
PLATOX: Integrated In Vitro/In Vivo Approach for Screening of Adverse Lung Effects of Graphene-Related 2D Nanomaterials

 , ,
, ,  , ,
, , 
Abstract
:
1. Introduction
2. Materials and Methods
2.1. Graphene-Related 2D Nanomaterials (GRNP)
2.1.1. GRNP Species
2.1.2. Material Characterization
2.1.3. Dispersion and In Vitro Treatment with GRNP Materials
2.1.4. Sedimentation Kinetics
2.2. In Vitro Screening
2.2.1. Cell Models
2.2.2. Cellular Uptake
2.2.3. Cytotoxicity Screening
2.2.4. Genotoxicity Screening
2.2.5. Calculation of Benchmark Dose
2.3. In Vivo Validation
2.3.1. Animals
2.3.2. Dose Range Finding (DRF) Study (Intratracheal Instillation)
2.3.3. 28-Day Nose-Only Inhalation Study
2.3.4. Statistics
3. Results
3.1. GRNP Dispersion and Sedimentation Kinetics
3.2. In Vitro Screening
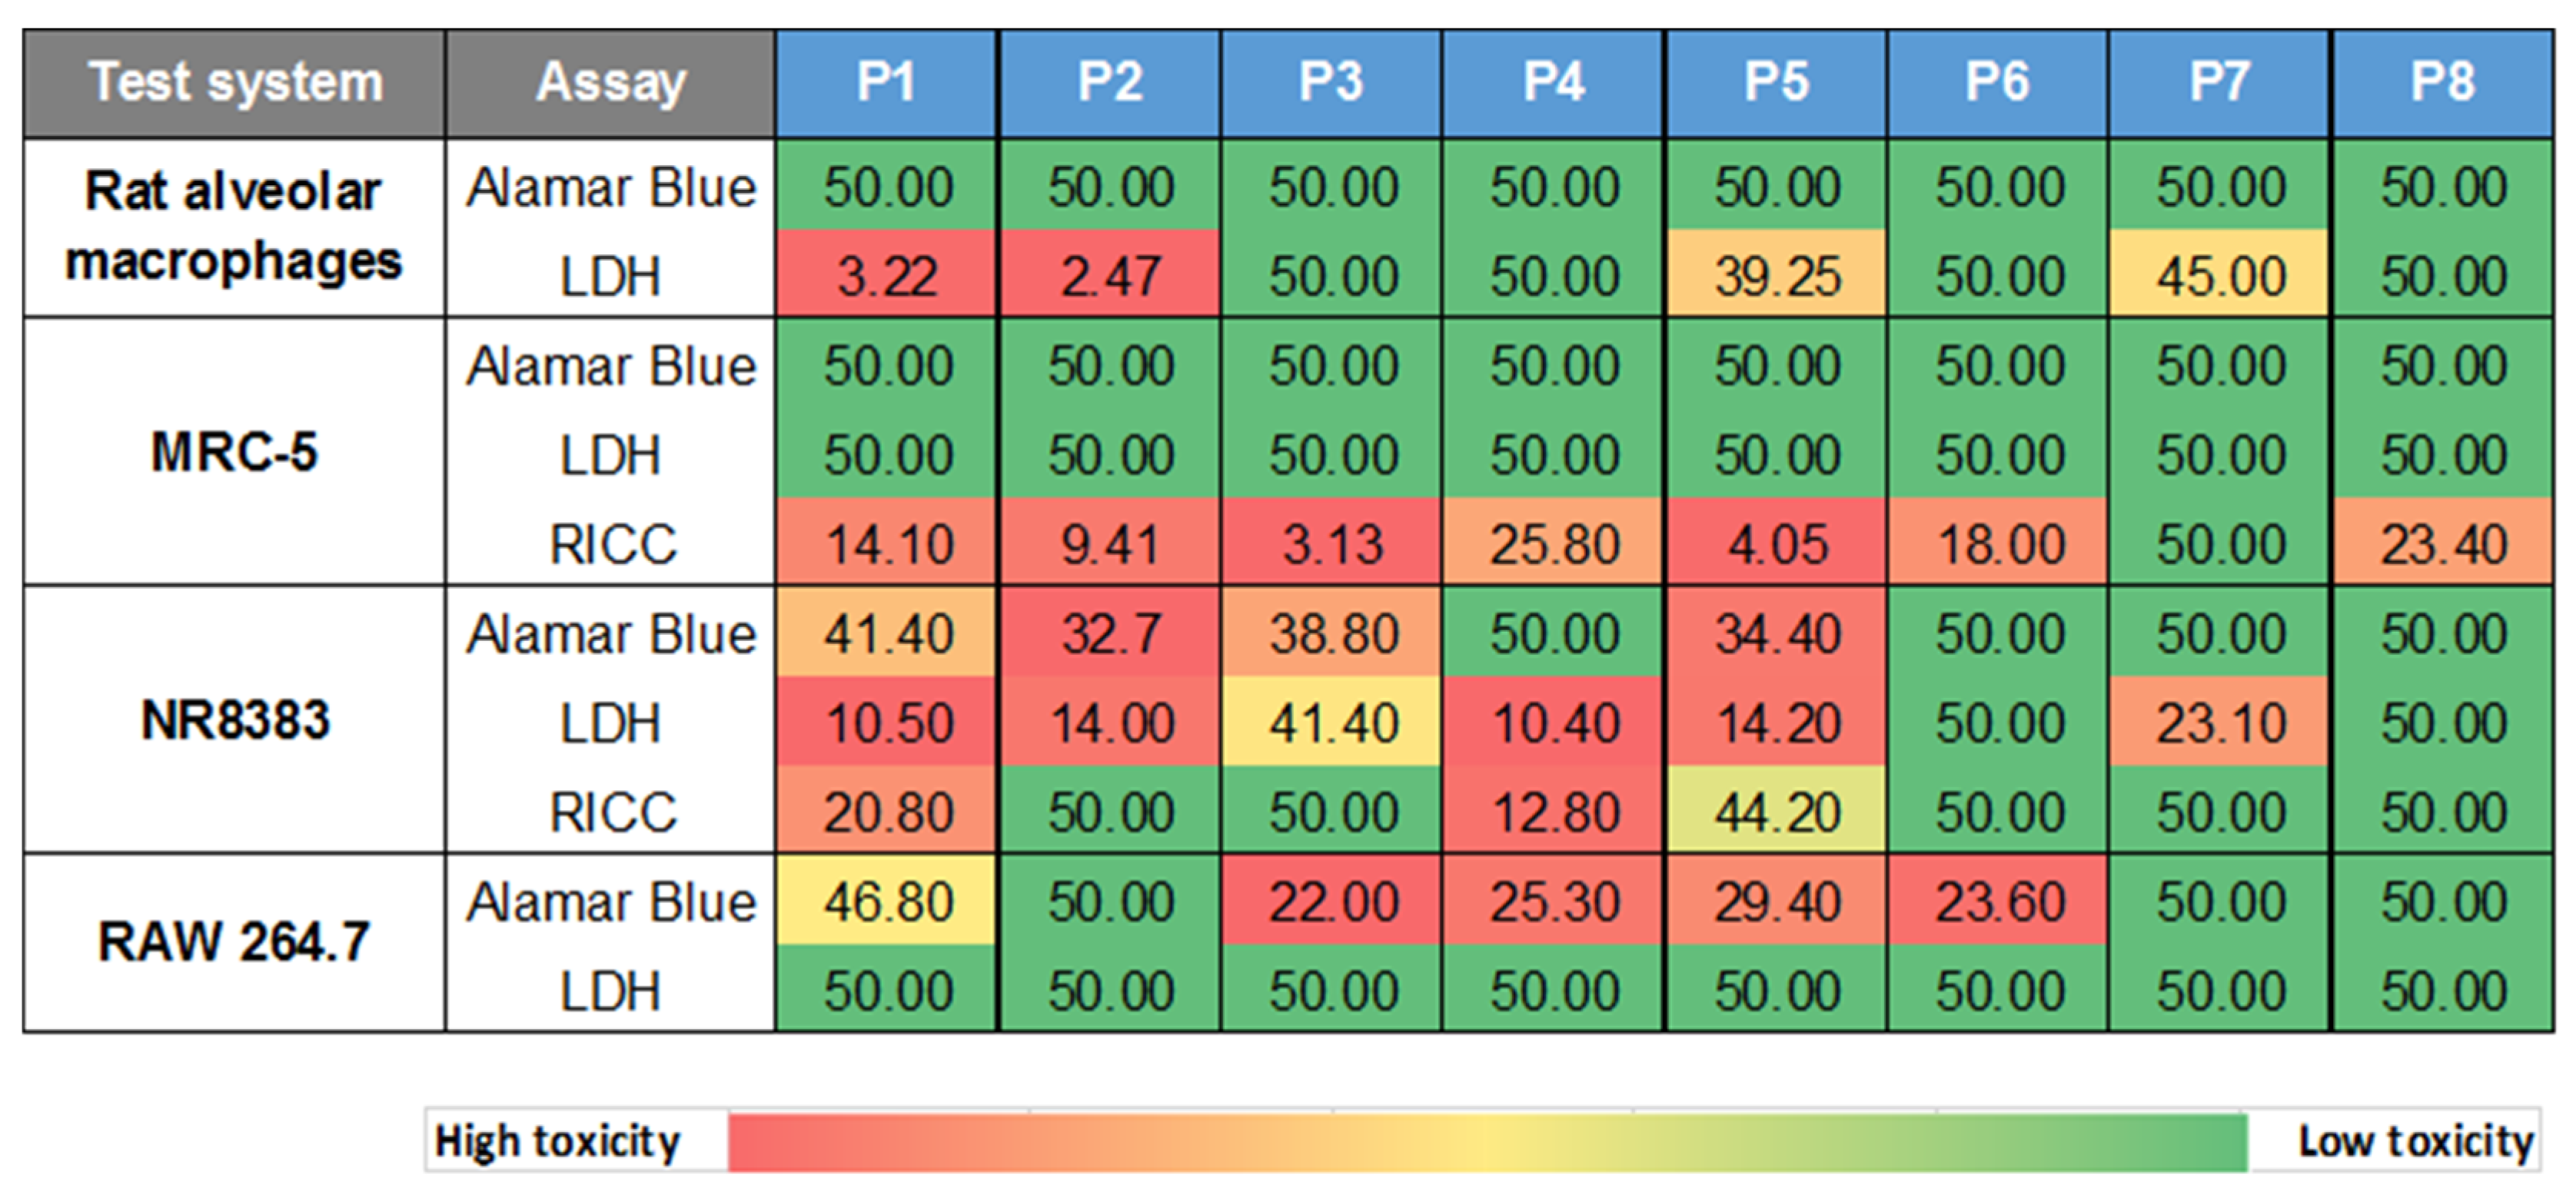
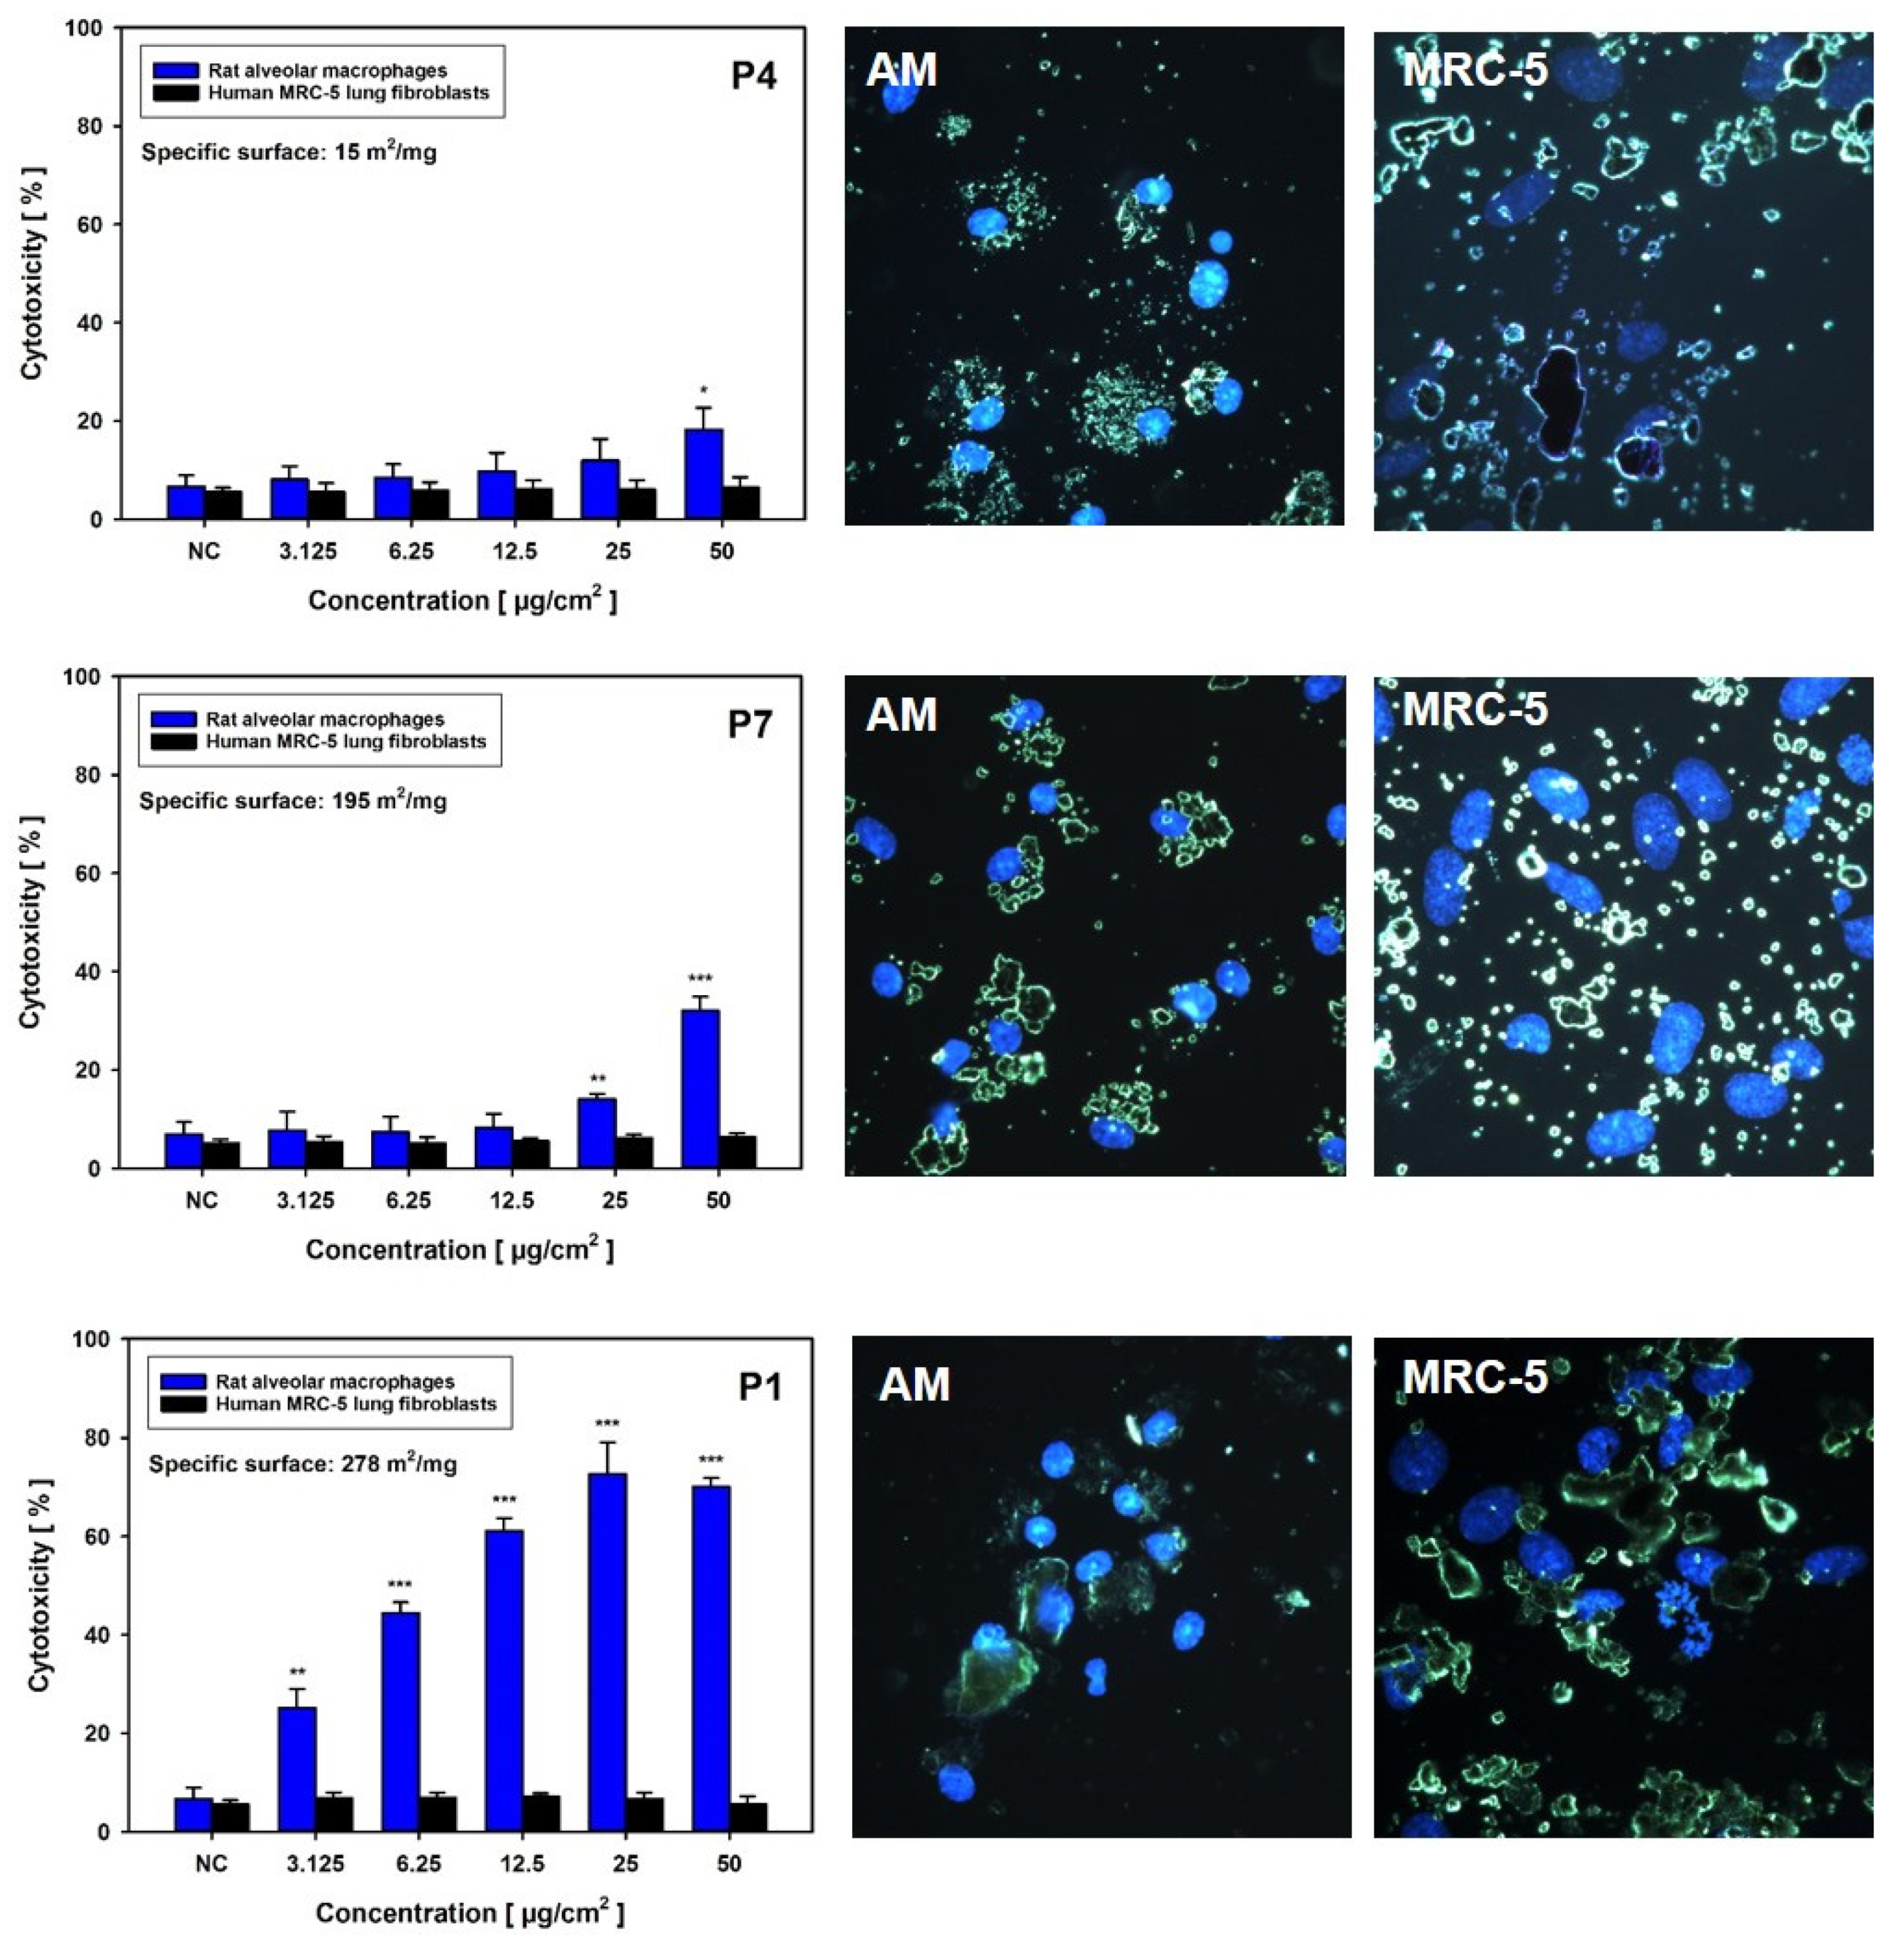
3.2.1. Cytotoxicity Screening
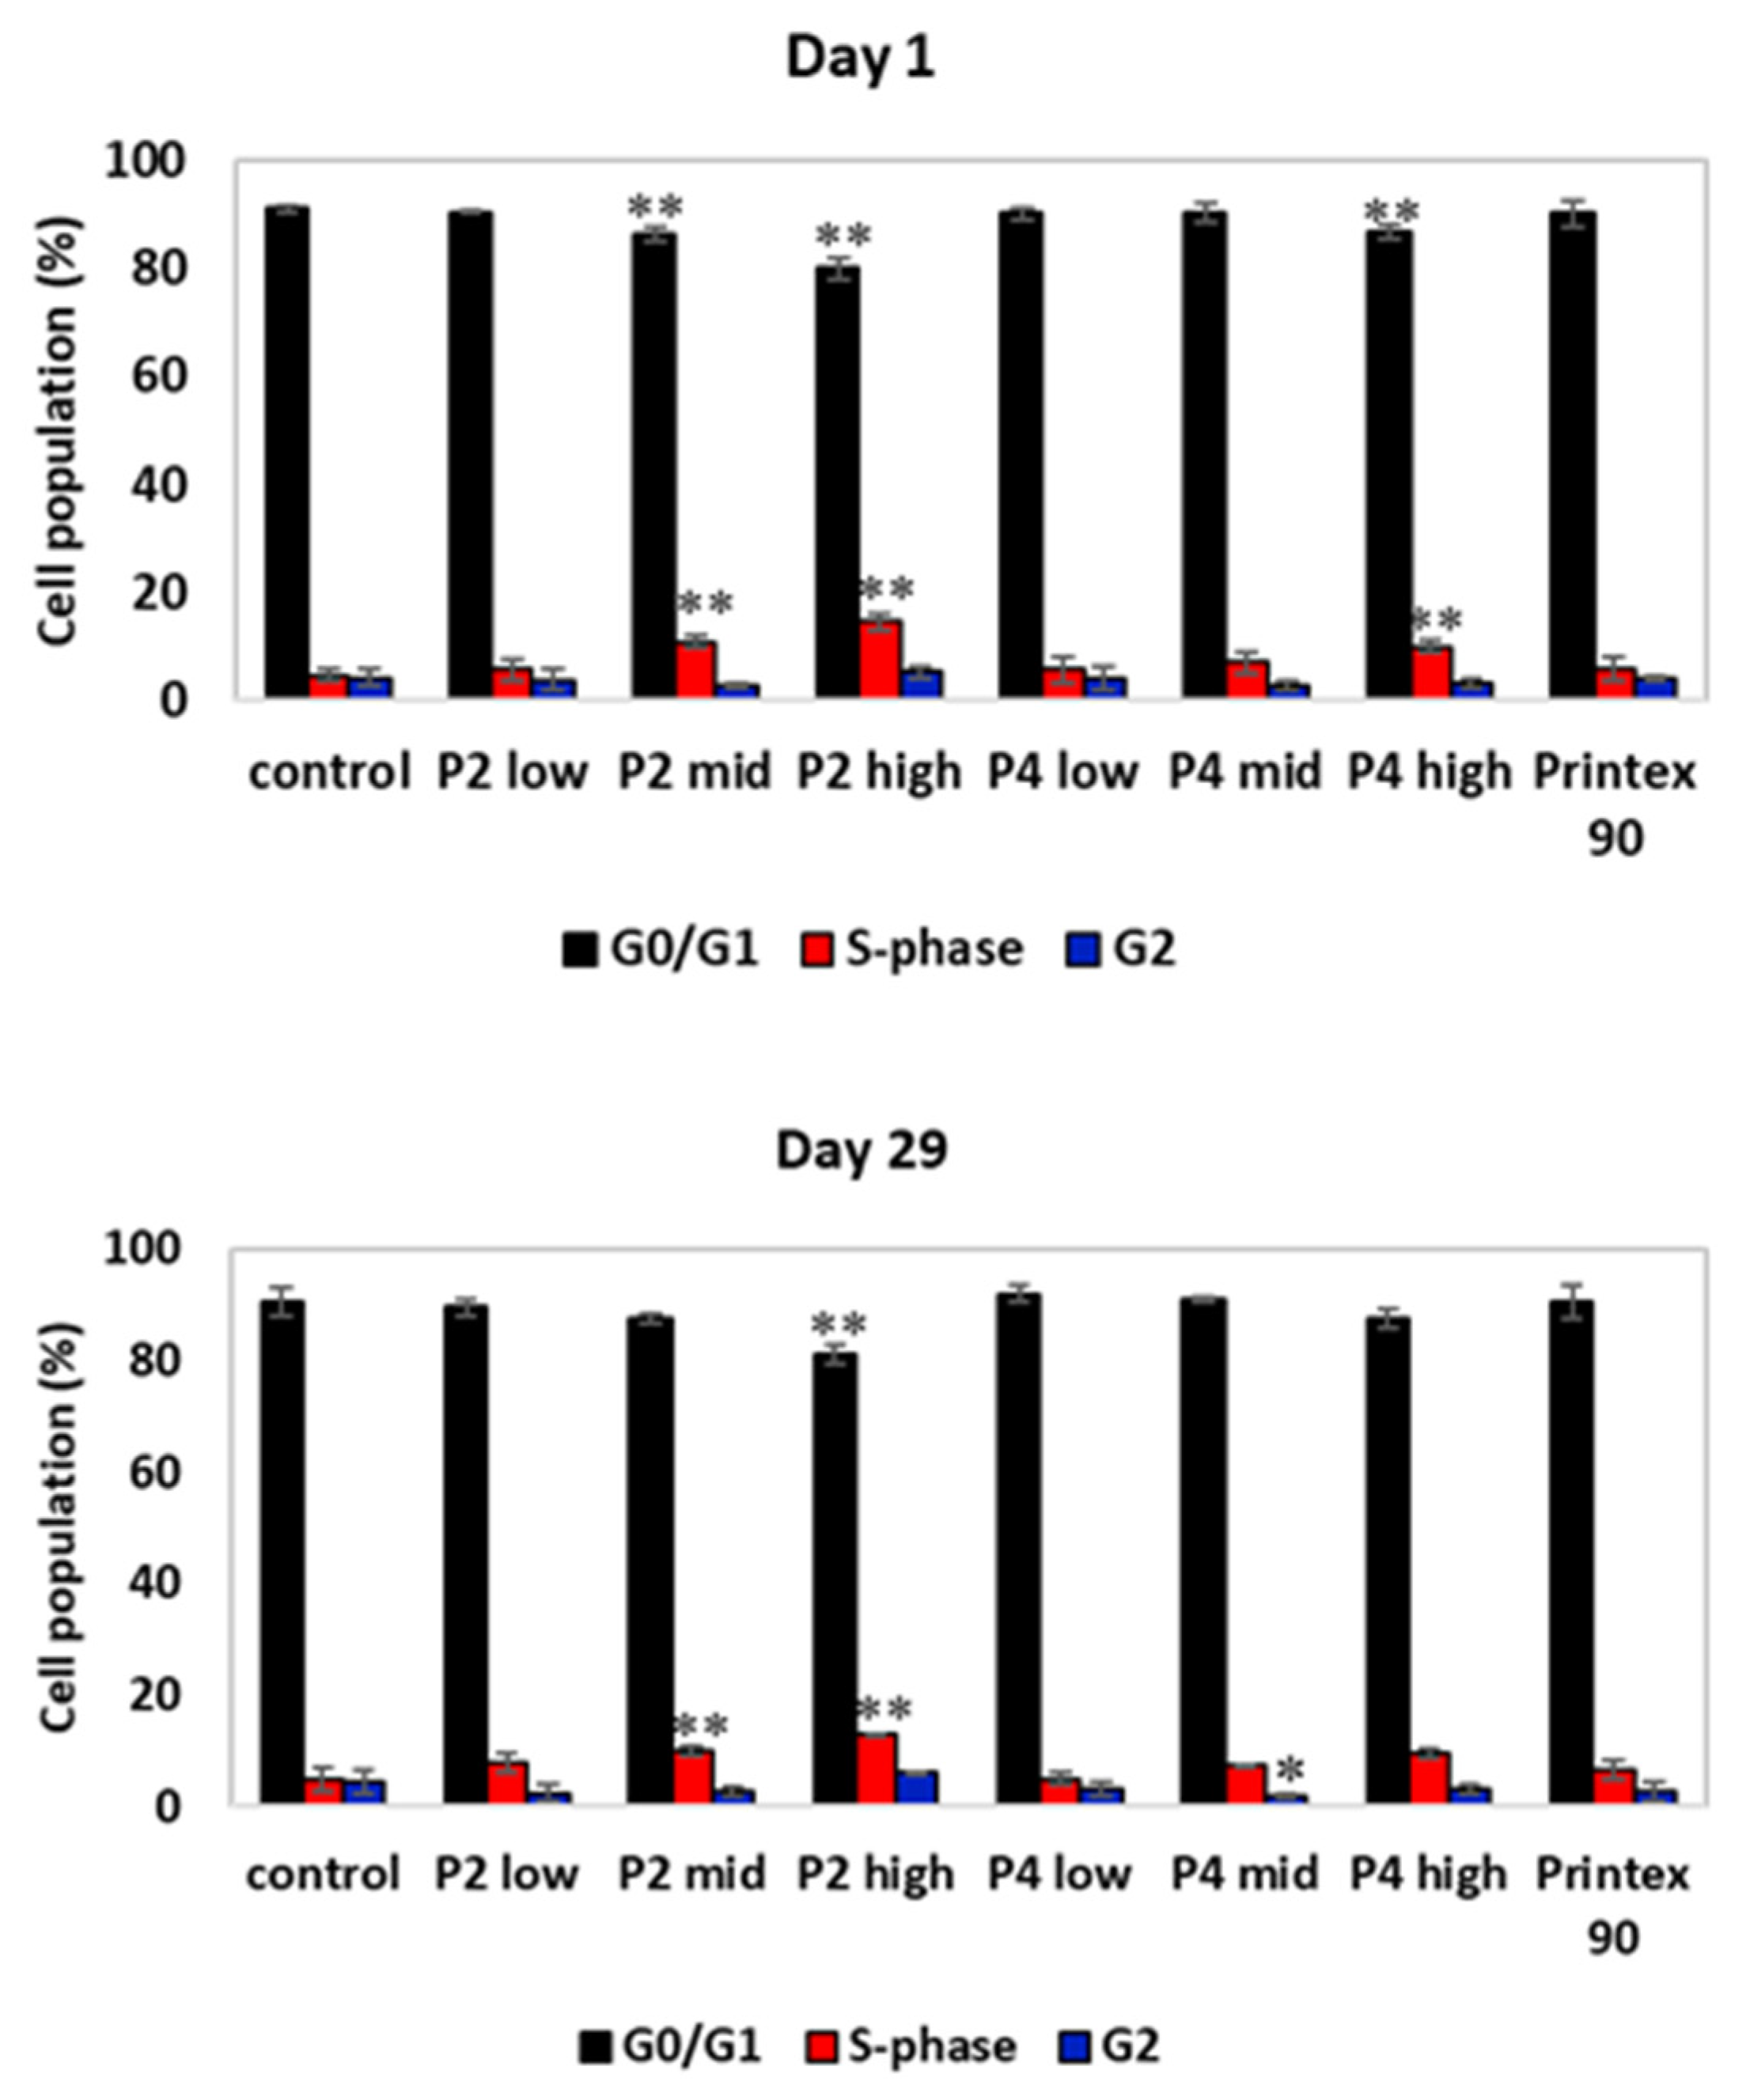
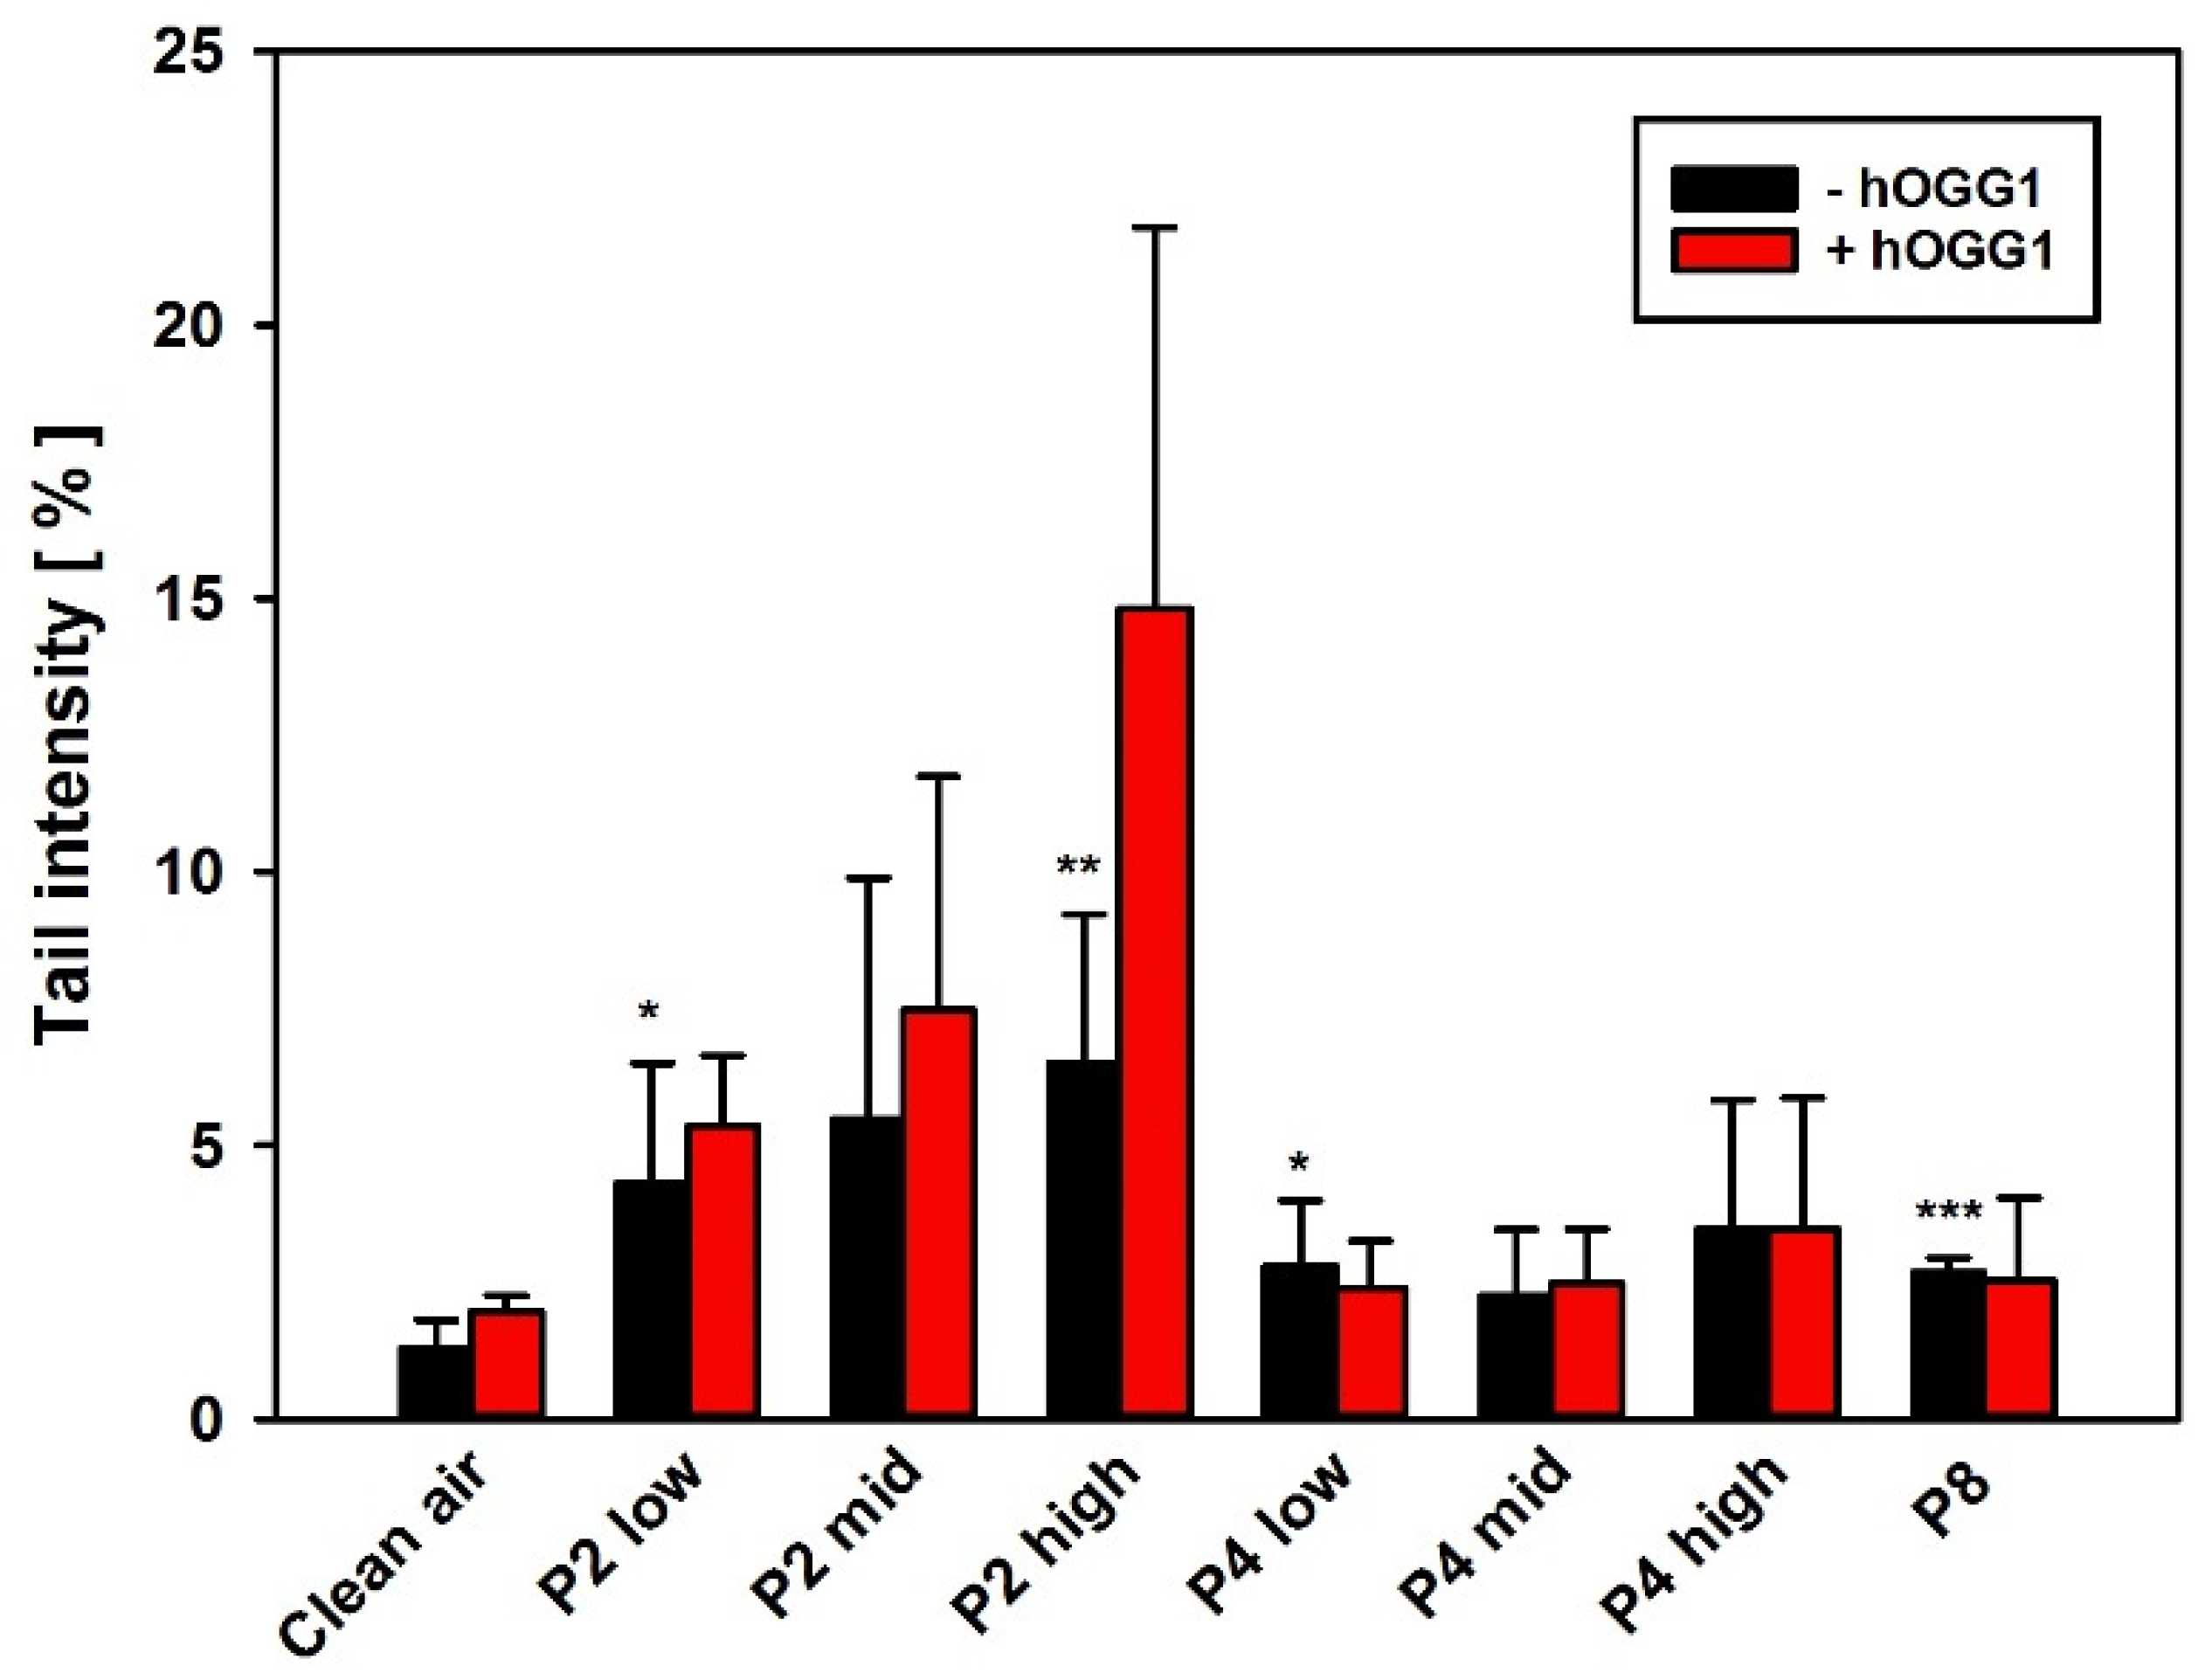
3.2.2. Genotoxicity Screening
3.3. In Vivo Validation
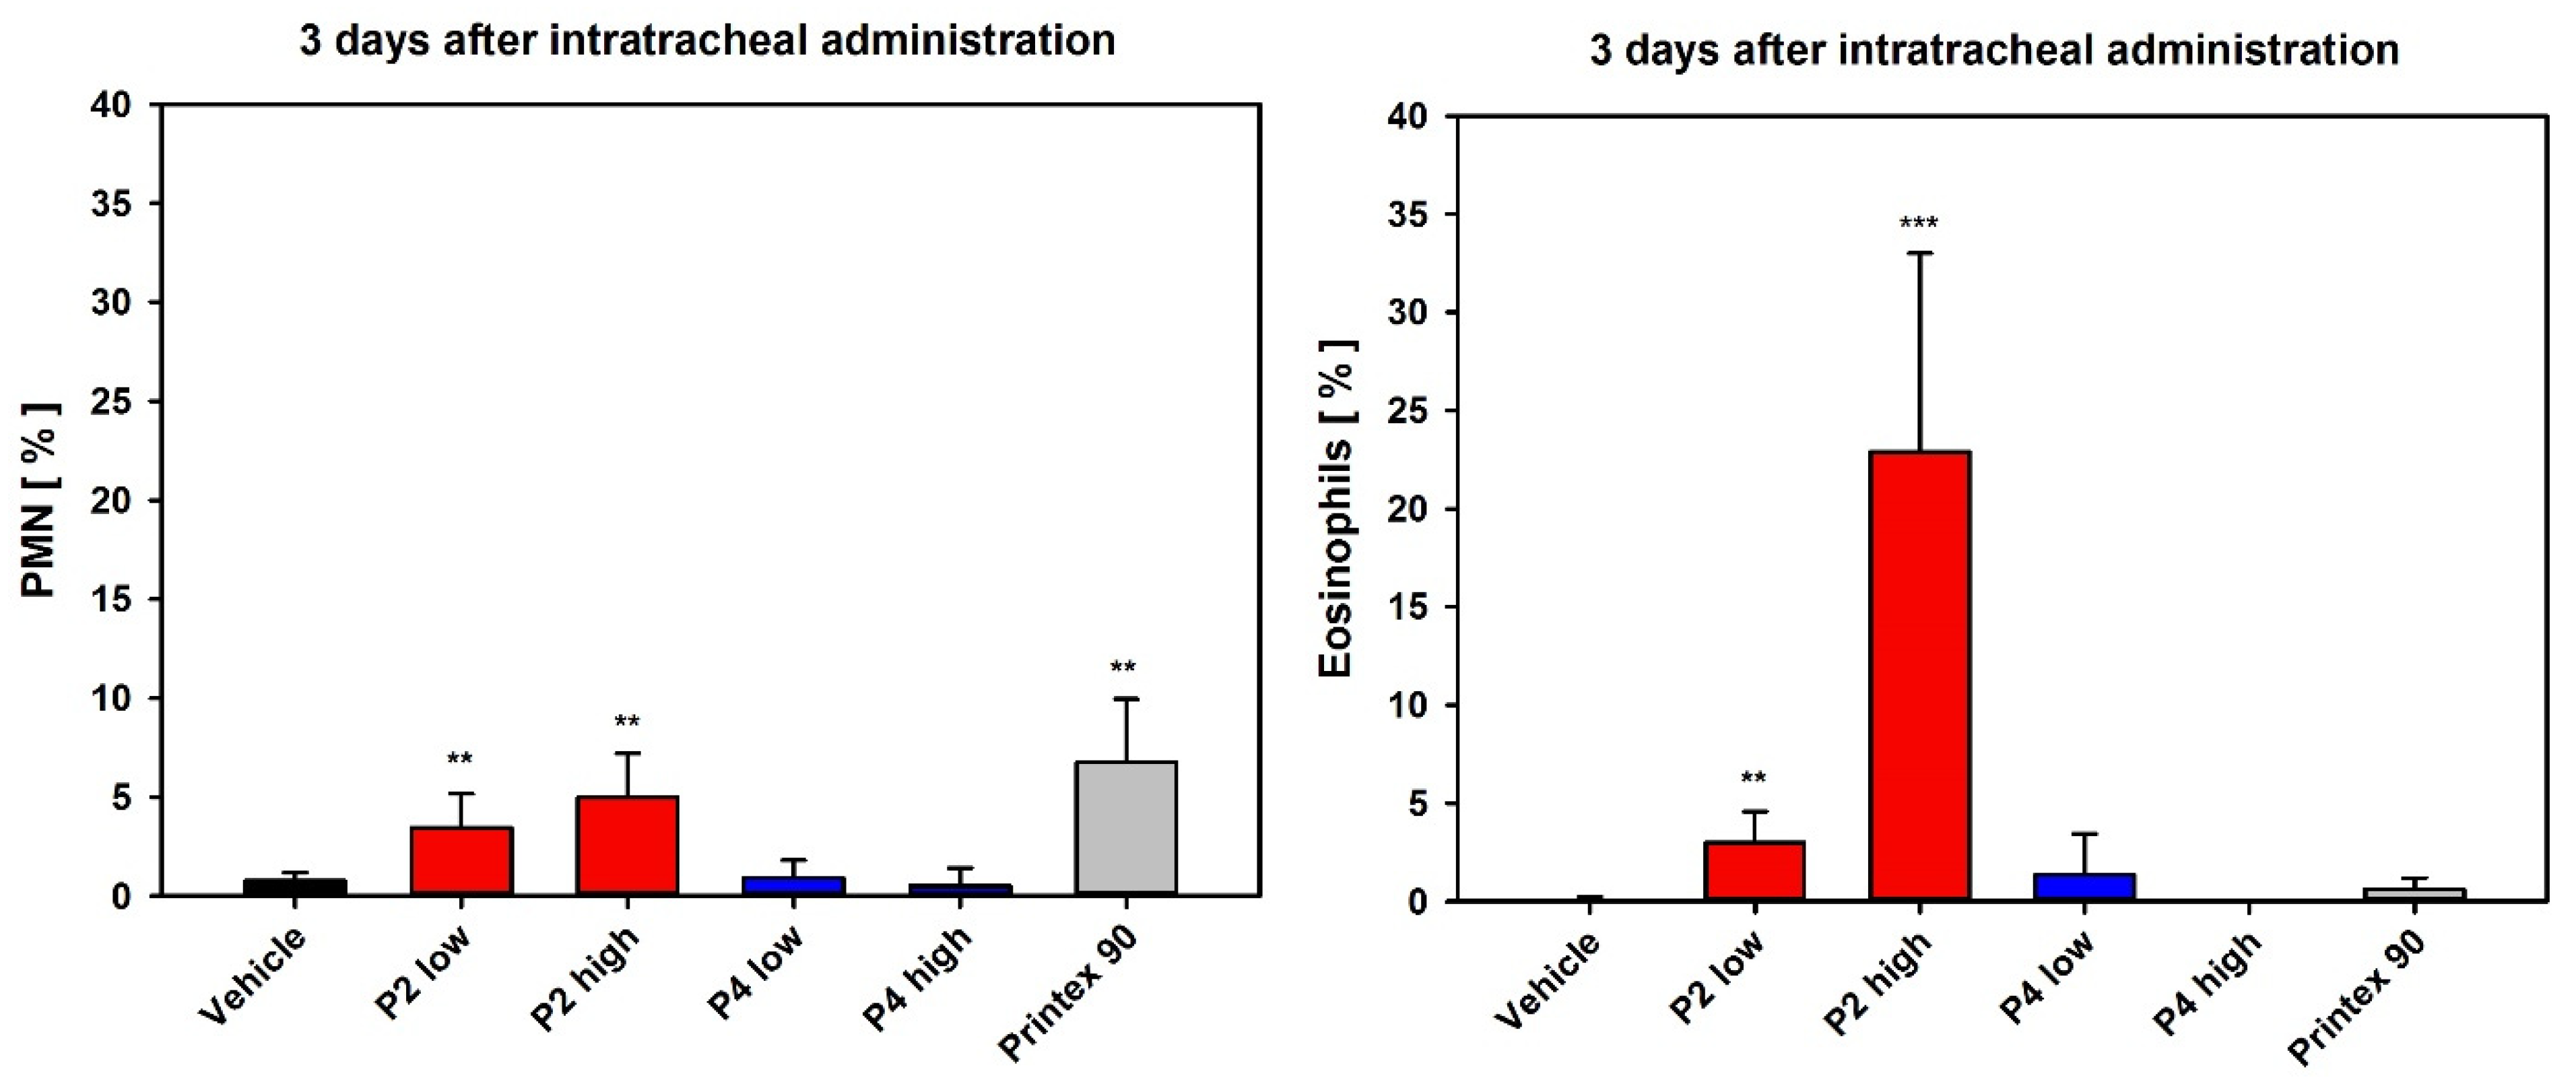
3.3.1. Dose-Range Finding Test (DRF) with Instillation into Rat Lungs
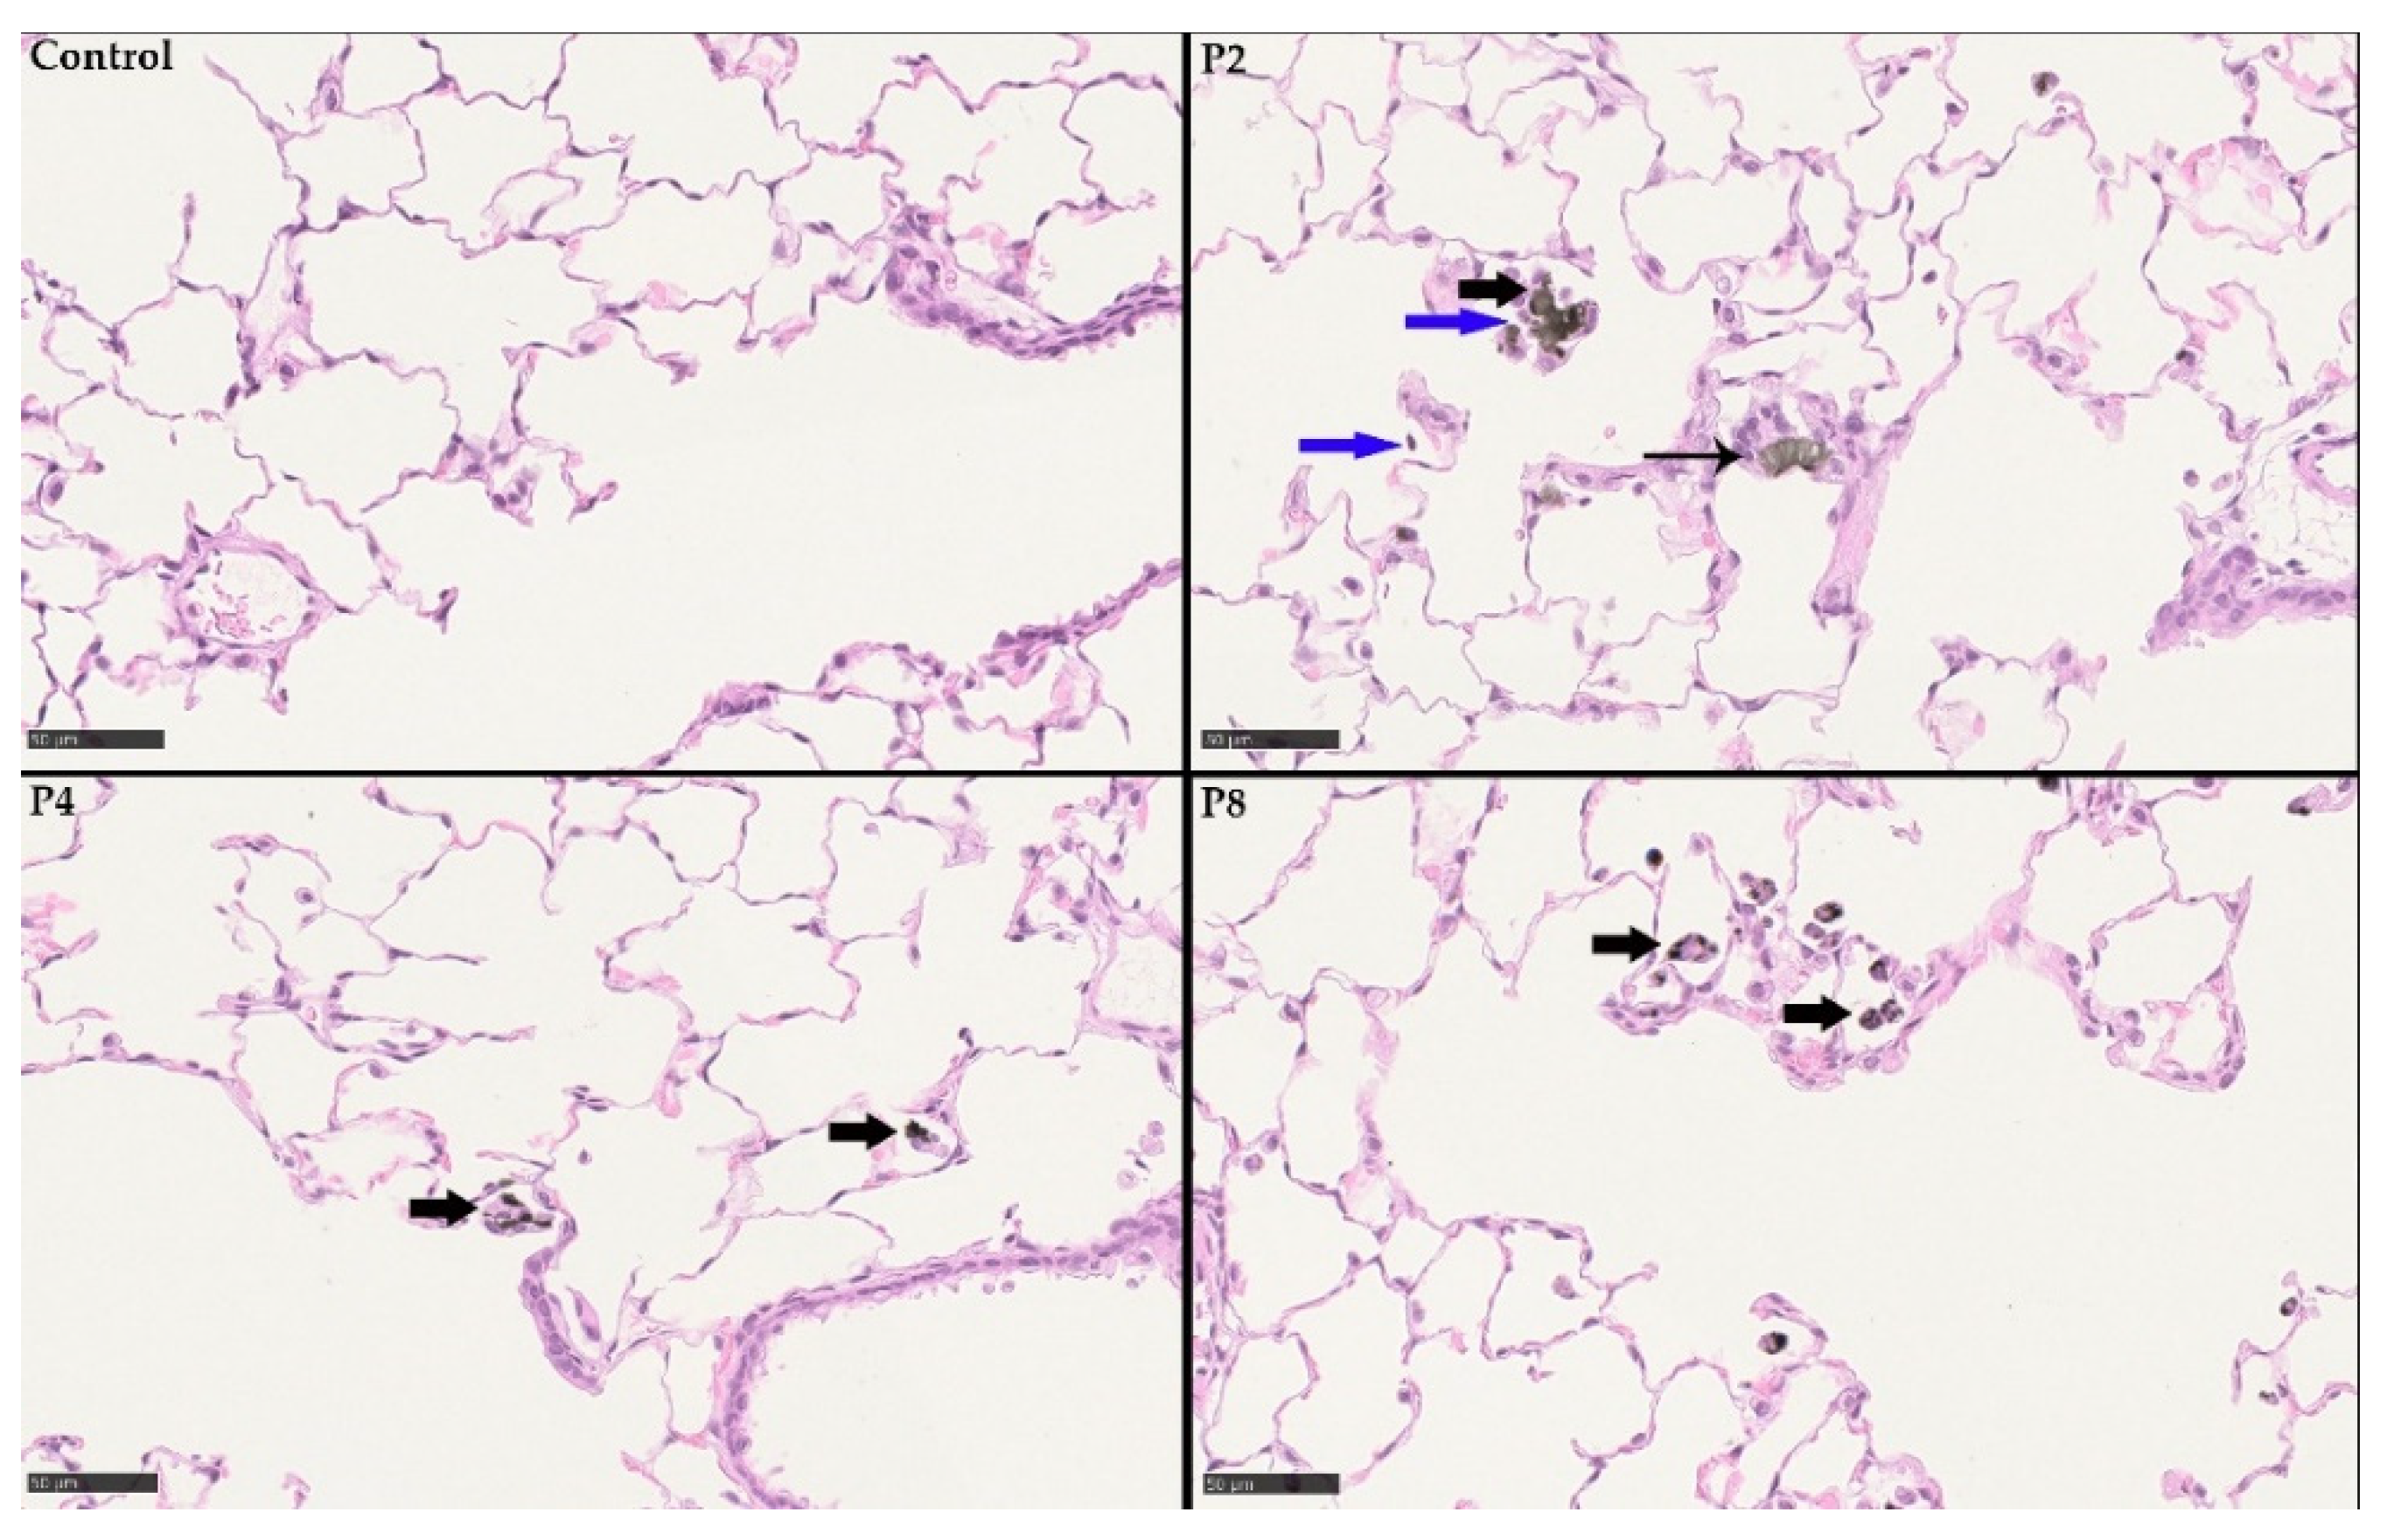
3.3.2. 28-Day Rat Inhalation Test
4. Discussion
5. Conclusions
Supplementary Materials
Author Contributions
Funding
Institutional Review Board Statement
Data Availability Statement
Acknowledgments
Conflicts of Interest
Abbreviations
| AM | Primary rat alveolar macrophages |
| BAL | Bronchoalveolar lavage |
| β -Glu | β-Glucuronidase |
| BMD | Benchmark dose |
| BMD30 | Benchmark dose 30% |
| BMR | Benchmark response |
| BMDL | Benchmark dose lower confidence limit |
| BMDU | Upper confidence limit of BMD |
| CB | Carbon black |
| CG | Carboxyl graphene |
| CNT | Carbon nanotubes |
| 1D | One-dimensional |
| 2D | Two-dimensional |
| 3D | Three-dimensional |
| DAPI | 4′,6-diamidino-2-phenylindole |
| DMEM | Dulbecco’s Modified Eagle Medium |
| DRF | Dose range finding |
| EMEM | Eagle’s Minimal Essential Medium |
| FCS | Fetal calf serum |
| FLG | Few-layer graphene |
| GFN | Family of graphene-based materials |
| GNP | Graphene nanoplatelets |
| GRNP | Graphene-related nanoplates |
| GO | Graphene oxide |
| GSD | Geometric standard deviation |
| HE | Hematoxylin and eosin |
| hOGG1 | Human 8-oxoguanine DNA N-glycosylase 1 |
| LALN | Lung-associated lymph nodes |
| LDH | Lactate dehydrogenase |
| LMA | Low melting point agarose |
| LPS | Lipopolysaccharide |
| MLG | Multilayer graphene |
| MMAD | Mass median aerodynamic diameter |
| MPPD | Multiple-Path Particle Dosimetry |
| MWCNT | Multiwalled carbon nanotubes |
| n.a. | Not applicable |
| NALT | Nasal-associated lymphoid tissue |
| NC | Negative control |
| NOAEL | No observed adverse effect level |
| 8-OHdG | 8-hydroxy-2′-deoxyguanosine |
| PI | Propidium iodide |
| PMN | Polymorphonuclear neutrophils |
| rGO | Reduced graphene oxide |
| RICC | Relative increase in cell count |
| SD | Standard deviation |
| SEM | Scanning electron microscopy |
| SLG | Single-layer graphene |
| TI | Tail intensity |
| TP | Total protein |
| TXA2 | Thromboxane A2 |
| TXB2 | Thromboxane B2 |
References
- Kiew, S.F.; Kiew, L.V.; Lee, H.B.; Imae, T.; Chung, L.Y. Assessing biocompatibility of graphene oxide-based nanocarriers: A review. J. Control. Release 2016, 226, 217–228. [Google Scholar] [CrossRef] [PubMed]
- Jastrzębska, A.M.; Kurtycz, P.; Olszyna, A.R. Recent advances in graphene family materials toxicity investigations. J. Nanopart. Res. 2012, 14, 1320. [Google Scholar] [CrossRef] [PubMed] [Green Version]
- Chatterjee, N.; Yang, J.; Choi, J. Differential genotoxic and epigenotoxic effects of graphene family nanomaterials (GFNs) in human bronchial epithelial cells. Mutat. Res. Genet. Toxicol. Environ. Mutagen. 2016, 798, 1–10. [Google Scholar] [CrossRef] [PubMed]
- European Union Observatory for Nanomaterials (EUON); European Chemicals Agency (ECHA). Nanopinions. 18 January 2022. Available online: https://euon.echa.europa.eu/nanopinion/-/blogs/what-does-graphene-really-look-like-and-why-is-it-not-carbon-nanotubes-%2021.%20Januar%202022.%2013:25 (accessed on 21 January 2022).
- Singh, Z.S. Applications and toxicity of graphene family nanomaterials and their composites. Nanotechnol. Sci. Appl. 2016, 15, 1. [Google Scholar] [CrossRef] [PubMed] [Green Version]
- ISO/TS 80004-13:2017; A Nanotechnologies–Vocabulary–Part 13: Graphene and Related Two-Dimensional (2D) Materials. Article No.: 225120; VDE-Verlag: Berlin, Germany, 2017.
- Tang, F.; Gao, J.; Ruan, Q.; Wu, X.; Wu, X.; Zhang, T.; Liu, Z.; Xiang, Y.; He, Z.; Wu, X. Graphene-Wrapped MnO/C Composites by MOFs-Derived as Cathode Material for Aqueous Zinc ion Batteries. Electrochim. Acta 2020, 353, 136570. [Google Scholar] [CrossRef]
- Zhang, Z.; Cai, R.; Long, F.; Wang, J. Development and application of tetrabromobisphenol A imprinted electrochemical sensor based on graphene/carbon nanotubes three-dimensional nanocomposites modified carbon electrode. Talanta 2015, 134, 435–442. [Google Scholar] [CrossRef]
- Sanchez, V.C.; Jachak, A.; Hurt, R.H.; Kane, A.B. Biological Interactions of Graphene-Family Nanomaterials: An Interdisciplinary Review. Chem. Res. Toxicol. 2012, 25, 15–34. [Google Scholar] [CrossRef] [Green Version]
- European Chemicals Agency (ECHA). Substance InfoCard. 2022. Available online: https://echa.europa.eu/substance-information/-/substanceinfo/100.227.924 (accessed on 21 January 2022).
- European Chemicals Agency (ECHA). Graphene. Available online: https://echa.europa.eu/registration-dossier/-/registered-dossier/24678/1/1 (accessed on 21 January 2022).
- Guo, X.; Mei, N. Assessment of the toxic potential of graphene family nanomaterials. J. Food Drug Anal. 2014, 22, 105–115. [Google Scholar] [CrossRef] [Green Version]
- Ruiz, A.; Lucherelli, A.; Murera, D.; Lamon, D.; Ménard-Moyon, C.; Bianco, A. Toxicological evaluation of highly water dispersible few-layer graphene in vivo. Carbon 2020, 170, 347–360. [Google Scholar] [CrossRef]
- Wu, K.; Zhou, Q.; Ouyang, S. Direct and Indirect Genotoxicity of Graphene Family Nanomaterials on DNA—A Review. Nanomaterials 2021, 11, 2889. [Google Scholar] [CrossRef]
- Spinazzè, A.; Cattaneo, A.; Borghi, F.; Del Buono, L.; Campagnolo, D.; Rovelli, S.; Cavallo, D.M. Exposure to airborne particles associated with the handling of graphene nanoplatelets. Med. Lav. 2018, 109, 285–296. [Google Scholar] [PubMed]
- Syama, S.; Mohanan, P.V. Safety and biocompatibility of graphene: A new generation nanomaterial for biomedical application. Int. J. Biol. Macromol. 2016, 86, 546–555. [Google Scholar] [CrossRef] [PubMed]
- Schinwald, A.; Murphy, F.A.; Jones, A.; MacNee, W.; Donaldson, K. Graphene-based nanoplatelets: A new risk to the respiratory system as a consequence of their unusual aerodynamic properties. ACS Nano 2012, 6, 736–746. [Google Scholar] [CrossRef] [PubMed]
- Bellagamba, I.; Boccuni, F.; Ferrante, R.; Tombolini, F.; Marra, F.; Sarto, M.S.; Iavicoli, S. Workers’ exposure assessment during the production of graphene nanoplatelets in R&D laboratory. Nanomaterials 2020, 10, 1520. [Google Scholar]
- Pelin, M.; Sosa, S.; Prato, M.; Tubaro, A. Occupational exposure to graphene based nanomaterials: Risk assessment. Nanoscale 2018, 10, 15894–15903. [Google Scholar] [CrossRef] [Green Version]
- Fadeel, B.; Bussy, C.; Merino, S.; Vasquez, E.; Flahaut, E.; Mouchet, F.; Evariste, L.; Gauthier, L.; Koivisto, A.J.; Vogel, U.; et al. Safety assessment of graphene-based materials: Focus on human health and the environment. ACS Nano 2018, 12, 10582–10620. [Google Scholar] [CrossRef]
- Kim, J.K.; Shin, J.H.; Lee, J.S.; Hwang, J.H.; Lee, J.H.; Baek, J.E.; Kim, T.G.; Kim, B.W.; Kim, J.S.; Lee, G.H.; et al. 28-day inhalation toxicity study of graphene nanoplatelets in Sprague-Dawley rats. Nanotoxicology 2016, 10, 891–901. [Google Scholar] [CrossRef]
- Ma-Hock, L.; Strauss, V.; Treumann, S.; Küttler, K.; Wohlleben, W.; Hofmann, T.; Gröters, S.; Wiench, K.; van Ravenzwaay, B.; Landsiedel, R. Comparative inhalation toxicity of multi-wall carbon nanotubes, graphene, graphite nanoplatelets and low surface carbon black. Part. Fibre Tox. 2013, 10, 23. [Google Scholar] [CrossRef] [Green Version]
- Vision Statement: SRA [Internet]. 2017. Available online: https://www.sra.org/vision-statement (accessed on 20 February 2017).
- Porter, D.; Sriram, K.; Wolfarth, M.; Jefferson, A.; Schwegler-Berry, D.; Andrew, E.; Castranova, V. A biocompatible medium for nanoparticle dispersion. Nanotox 2008, 2, 144–154. [Google Scholar] [CrossRef]
- Ziemann, C.; Jackson, P.; Brown, R.; Attik, G.; Rihn, B.H.; Creutzenberg, O. Quartz-containing ceramic dusts: In vitro screening of the cytotoxic, genotoxic and pro-inflammatory potential of 5 factory samples. J. Phys. Conf. Ser. 2009, 151, 1–6. [Google Scholar] [CrossRef]
- Ziemann, C.; Harrison, P.T.C.; Bellmann, B.; Brown, R.C.; Zoitos, B.K.; Class, P. Lack of marked cyto- and genotoxicity of cristobalite in devitrified (heated) alkaline earth silicate wools in short-term assays with cultured primary rat alveolar macrophages. Inhal. Toxicol. 2014, 26, 113–127. [Google Scholar] [CrossRef] [PubMed]
- Monfort, E.; López-Lilao, A.; Ibáñeza, M.J.; Ziemann, C.; Creutzenberg, O.; Bonvicinic, G. Feasibility of using organosilane dry-coated detoxified quartzes as raw material in different industrial sectors. Clean. Eng. Technol. 2021, 5, 100331. [Google Scholar] [CrossRef]
- German Animal Protection Law 2006 (Tierschutzgesetz of 18 May 2006, with update on 13 July 2013.). Available online: https://www.globalanimallaw.org/database/national/germany/ (accessed on 27 February 2022).
- Ziemann, C.; Escrig, A.; Bonvicini, G.; Ibáñez, M.J.; Monfort, E.; Salomoni, A.; Creutzenberg, O. Organosilane-Based Coating of Quartz Species from the Traditional Ceramics Industry: Evidence of Hazard Reduction Using In Vitro and In Vivo Tests. Ann. Work. Expo. Health 2017, 61, 468–480. [Google Scholar] [CrossRef] [PubMed] [Green Version]
- Helmke, R.J.; Boyd, R.L.; German, V.F.; Mangos, J.A. From growth factor dependence to growth factor responsiveness. The genesis of an alveolar macrophage cell line. In Vitro Cell. Dev. Biol. 1987, 23, 567–574. [Google Scholar] [CrossRef]
- Smith, C.C.; O’Donovan, M.R.; Martin, E.A. hOGG1 recognizes oxidative damage using the comet assay with greater specificity than FPG or ENDOIII. Mutagenesis 2006, 21, 185–190. [Google Scholar] [CrossRef] [Green Version]
- Kirkland, D.; Brock, T.; Haddouk, H.; Hargeaves, V.; Lloyd, M.; Mc Garry, S.; Proudlock, R.; Sarlang, S.; Sewald, K.; Sire, G.; et al. New investigations into the genotoxicity of cobalt compounds and their impact on overall assessment of genotoxic risk. Regul. Toxicol. Pharmacol. 2015, 73, 311–338. [Google Scholar] [CrossRef]
- European Food Safety Authority (EFSA). Update: Use of the benchmark dose approach in risk assessment. EFSA J. 2017, 15, e04658. Available online: https://efsa.onlinelibrary.wiley.com/doi/full/10.2903/j.efsa.2017.4658 (accessed on 29 January 2022).
- European Chemicals Agency (ECHA). Guidance on Information Requirements and Chemical Safety Assessment: Chapter R.8: Characterisation of Dose [Concentration]-Response for Human Health; ECHA: Helsinki, Finland, 2012; Available online: https://echa.europa.eu/documents/10162/13632/information_requirements_r8_en.pdf/e153243a-03f0-44c5-8808-88af66223258 (accessed on 29 January 2022).
- World Health Organization. Environmental Health Criteria 239. Principles for Modelling Dose–Response for The Risk Assessment of Chemicals; World Health Organization: Geneva, Switzerland, 2009; Available online: http://apps.who.int/iris/bitstream/10665/43940/1/9789241572392_eng.pdf (accessed on 29 January 2022).
- PROAST Software. 2022. Available online: https://www.rivm.nl/en/proast (accessed on 29 January 2022).
- Henderson, R.F.; Mauderly, J.L.; Pickrell, J.A.; Hahn, R.F.; Muhle, H.; Rebar, A.H. Comparative study of bronchoalveolar lavage fluid: Effect of species, age and method of lavage. Exp. Lung Res. 1987, 13, 329–342. [Google Scholar] [CrossRef]
- Creutzenberg, O.; Hansen, T.; Ernst, H.; Muhle, H.; Oberdörster, G.; Hamilton, R. Toxicity of a quartz with occluded surfaces in a 90-day intratracheal instillation study in rats. Inhalation Tox. 2008, 20, 995–1008. [Google Scholar] [CrossRef]
- Organisation for Economic Co-operation and Development (OECD). Guidelines for the Testing of Chemicals, Section 4; Test No. 412: Subacute Inhalation Toxicity: 28-Day Study; OECD Publishing: Paris, France, 2018; Available online: https://doi.org/10.1787/9789264070783-en (accessed on 27 February 2022).
- Anjilvel, S.; Asgharian, B. A multiple-path model of particle deposition in the rat lung. Fund Appl Tox 1995, 28, 41–50. [Google Scholar] [CrossRef] [Green Version]
- Dunnett, C.W. New tables for multiple comparisons with a control. Biometrics 1964, 20, 482–491. [Google Scholar] [CrossRef] [Green Version]
- Rittinghausen, S.; Hackbarth, A.; Creutzenberg, O.; Ernst, H.; Heinrich, U.; Leonhardt, A.; Schaudien, D. The carcinogenic effect of various multi-walled carbon nanotubes (MWCNTs) after intraperitoneal injection in rats. Part. Fibre Toxicol. 2014, 11, 59. [Google Scholar] [CrossRef] [PubMed] [Green Version]
- Reamon-Buettner, S.M.; Hackbarth, A.; Leonhardt, A.; Braun, A.; Ziemann, C. Cellular senescence as a response to multiwalled carbon nanotube (MWCNT) exposure in human mesothelial cells. Mech. Ageing Dev. 2021, 193, 111412. [Google Scholar] [CrossRef] [PubMed]
- Liao, K.-H.; Lin, Y.-S.; Macosko, C.W.; Haynes, C.L. Cytotoxicity of graphene oxide and graphene in human erythrocytes and skin fibroblasts. ACS Appl. Mater. Interfaces 2011, 3, 2607–2615. [Google Scholar] [CrossRef]
- Malkova, A.; Svadlakova, T.; Singh, A.; Kolackova, M.; Vankova, R.; Borsky, P.; Holmannova, D.; Karas, A.; Borska, L.; Fiala, Z. In Vitro Assessment of the Genotoxic Potential of Pristine Graphene Platelets. Nanomaterials 2021, 11, 2210. [Google Scholar] [CrossRef]
- Hinzmann, M.; Jaworski, S.; Kutwin, M.; Jagiello, J.; Kozinski, R.; Wierzbicki, M.; Grodzik, M.; Lipinska, L.; Sawosz, E.; Chwalibog, A. Nanoparticles containing allotropes of carbon have genotoxic effects on glioblastoma multiforme cells. Int. J. Nanomed. 2014, 9, 2409–2417. [Google Scholar]
- Chatterjee, N.; Yang, J.S.; Park, K.; Oh, S.M.; Park, J.; Choi, J. Screening of toxic potential of graphene family nanomaterials using in vitro and alternative in vivo toxicity testing systems. Environ. Health Tox. 2015, 30, e2015007. [Google Scholar] [CrossRef]
- Sasidharan, A.; Panchakarla, L.S.; Chandran, P.; Menon, D.; Nair, S.; Rao, C.N.R.; Koyakutty, M. Differential nano-bio interactions and toxicity effects of pristine versus functionalized graphene. Nanoscale 2011, 3, 2461. [Google Scholar] [CrossRef]
- Muzi, L.; Mouchet, F.; Cadarsi, S.; Janowska, I.; Russier, J.; Menard-Moyon, C.; Risuleo, G.; Soula, B.; Galibert, A.M.; Flahaut, E.; et al. Examining the impact of multi-layer graphene using cellular and amphibian models. 2D Mater 2016, 3, 025009. [Google Scholar] [CrossRef] [Green Version]
- Hashemi, E.; Akhavan, O.; Shamsara, M.; Majd, S.A.; Sanati, M.H.; Joupari, M.D.; Farmany, A. Graphene Oxide Negatively Regulates Cell Cycle in Embryonic Fibroblast Cells. Int. J. Nanomed. 2020, 15, 6201–6209. [Google Scholar] [CrossRef]
- Wang, Y.; Xu, J.; Xu, L.; Tan, X.; Feng, L.; Luo, Y.; Liu, J.; Liu, Z.; Peng, R. Functionalized graphene oxide triggers cell cycle checkpoint control through both the ATM and the ATR signaling pathways. Carbon 2018, 129, 495–503. [Google Scholar] [CrossRef]
- Cho, W.S.; Duffin, R.; Bradley, M.; Megson, I.L.; MacNee, W.; Lee, J.K.; Jeong, J.; Donaldson, K. Predictive value of in vitro assays depends on the mechanism of toxicity of metal oxide nanoparticles. Part. Fibre Tox. 2013, 10, 55. [Google Scholar] [CrossRef] [PubMed] [Green Version]
- Wiemann, M.; Vennemann, A.; Sauer, U.G.; Wiench, K.; Ma-Hock, L.; Landsiedel, R. An in vitro alveolar macrophage assay for predicting the short-term inhalation toxicity of nanomaterials. J. Nanobiotech. 2016, 14, 16. [Google Scholar] [CrossRef] [PubMed] [Green Version]
- Gorki, A.-D.; Symmank, D.; Zahalka, S.; Lakovits, K.; Hladik, A. Murine ex vivo cultured alveolar macrophages provide a novel tool to study tissue-resident macrophage behavior and function. Am. J. Resp. Cell Mol. Biol. 2021, 66, 64–75. Available online: https://doi.org/10.1165/rcmb.2021-0190OC (accessed on 28 February 2022). [CrossRef] [PubMed]
- Sayes, C.M.; Reed, C.L.; Warheit, D.B. Assessing toxicity of fine and nanoparticles: Comparing in vitro measurements to in vivo pulmonary toxicity profile. Tox. Sci. 2007, 97, 163–180. [Google Scholar] [CrossRef] [PubMed] [Green Version]
- Gurcan, C.; Taheri, H.; Bianco, A.; Delogu, L.G.; Yilmazer, A. A closer look at the genotoxicity of graphene based materials. J. Phys. Mater. 2019, 3, 014007. [Google Scholar] [CrossRef]
- Ursini, C.L.; Fresegna, A.M.; Ciervo, A.; Maiello, R.; Del Frate, V.; Folesani, G.; Galetti, M.; Poli, D.; Buresti, G.; Di Cristo, L.; et al. Occupational exposure to graphene and silica nanoparticles. Part II: Pilot study to identify a panel of sensitive biomarkers of genotoxic, oxidative and inflammatory effects on suitable biological matrices. Nanotoxicology 2021, 15, 223–237. [Google Scholar] [CrossRef]
- Lee, S.; Hwang, S.H.; Jeong, J.; Han, Y.; Kim, S.H.; Lee, D.-K.; Lee, H.-S.; Chung, S.-T.; Jeong, J.; Roh, C.; et al. Nickel oxide nanoparticles can recruit eosinophils in the lungs of rats by the direct release of intracellular eotaxin. Part. Fibre Tox. 2016, 13, 30. [Google Scholar] [CrossRef] [Green Version]
- Moghimian, N.; Nazarpour, S. The future of carbon: An update on graphene’s dermal, inhalation and gene toxicity. Crystals 2020, 10, 718. [Google Scholar] [CrossRef]
- Roberts, J.R.; Mercer, R.R.; Stefaniak, A.B.; Seehra, M.S.; Geddam, U.K.; Chaudhuri, I.S.; Kyrlidis, A.; Kodali, V.K.; Sager, T.; Kenyon, A.; et al. Evaluation of pulmonary and systemic toxicity following lung exposure to graphite nanoplates: A member of the graphene-based nanomaterial family. Part. Fibre Tox. 2016, 13, 34. [Google Scholar] [CrossRef] [Green Version]
- Corbo, C.; Molinaro, R.; Parodi, A.; Toledano Furman, N.E.; Salvatore, F.; Tasciotti, E. The impact of nanoparticle protein corona on cytotoxicity, immunotoxicity and target drug delivery. Nanomedicine 2016, 11, 81–100. [Google Scholar] [CrossRef] [PubMed] [Green Version]


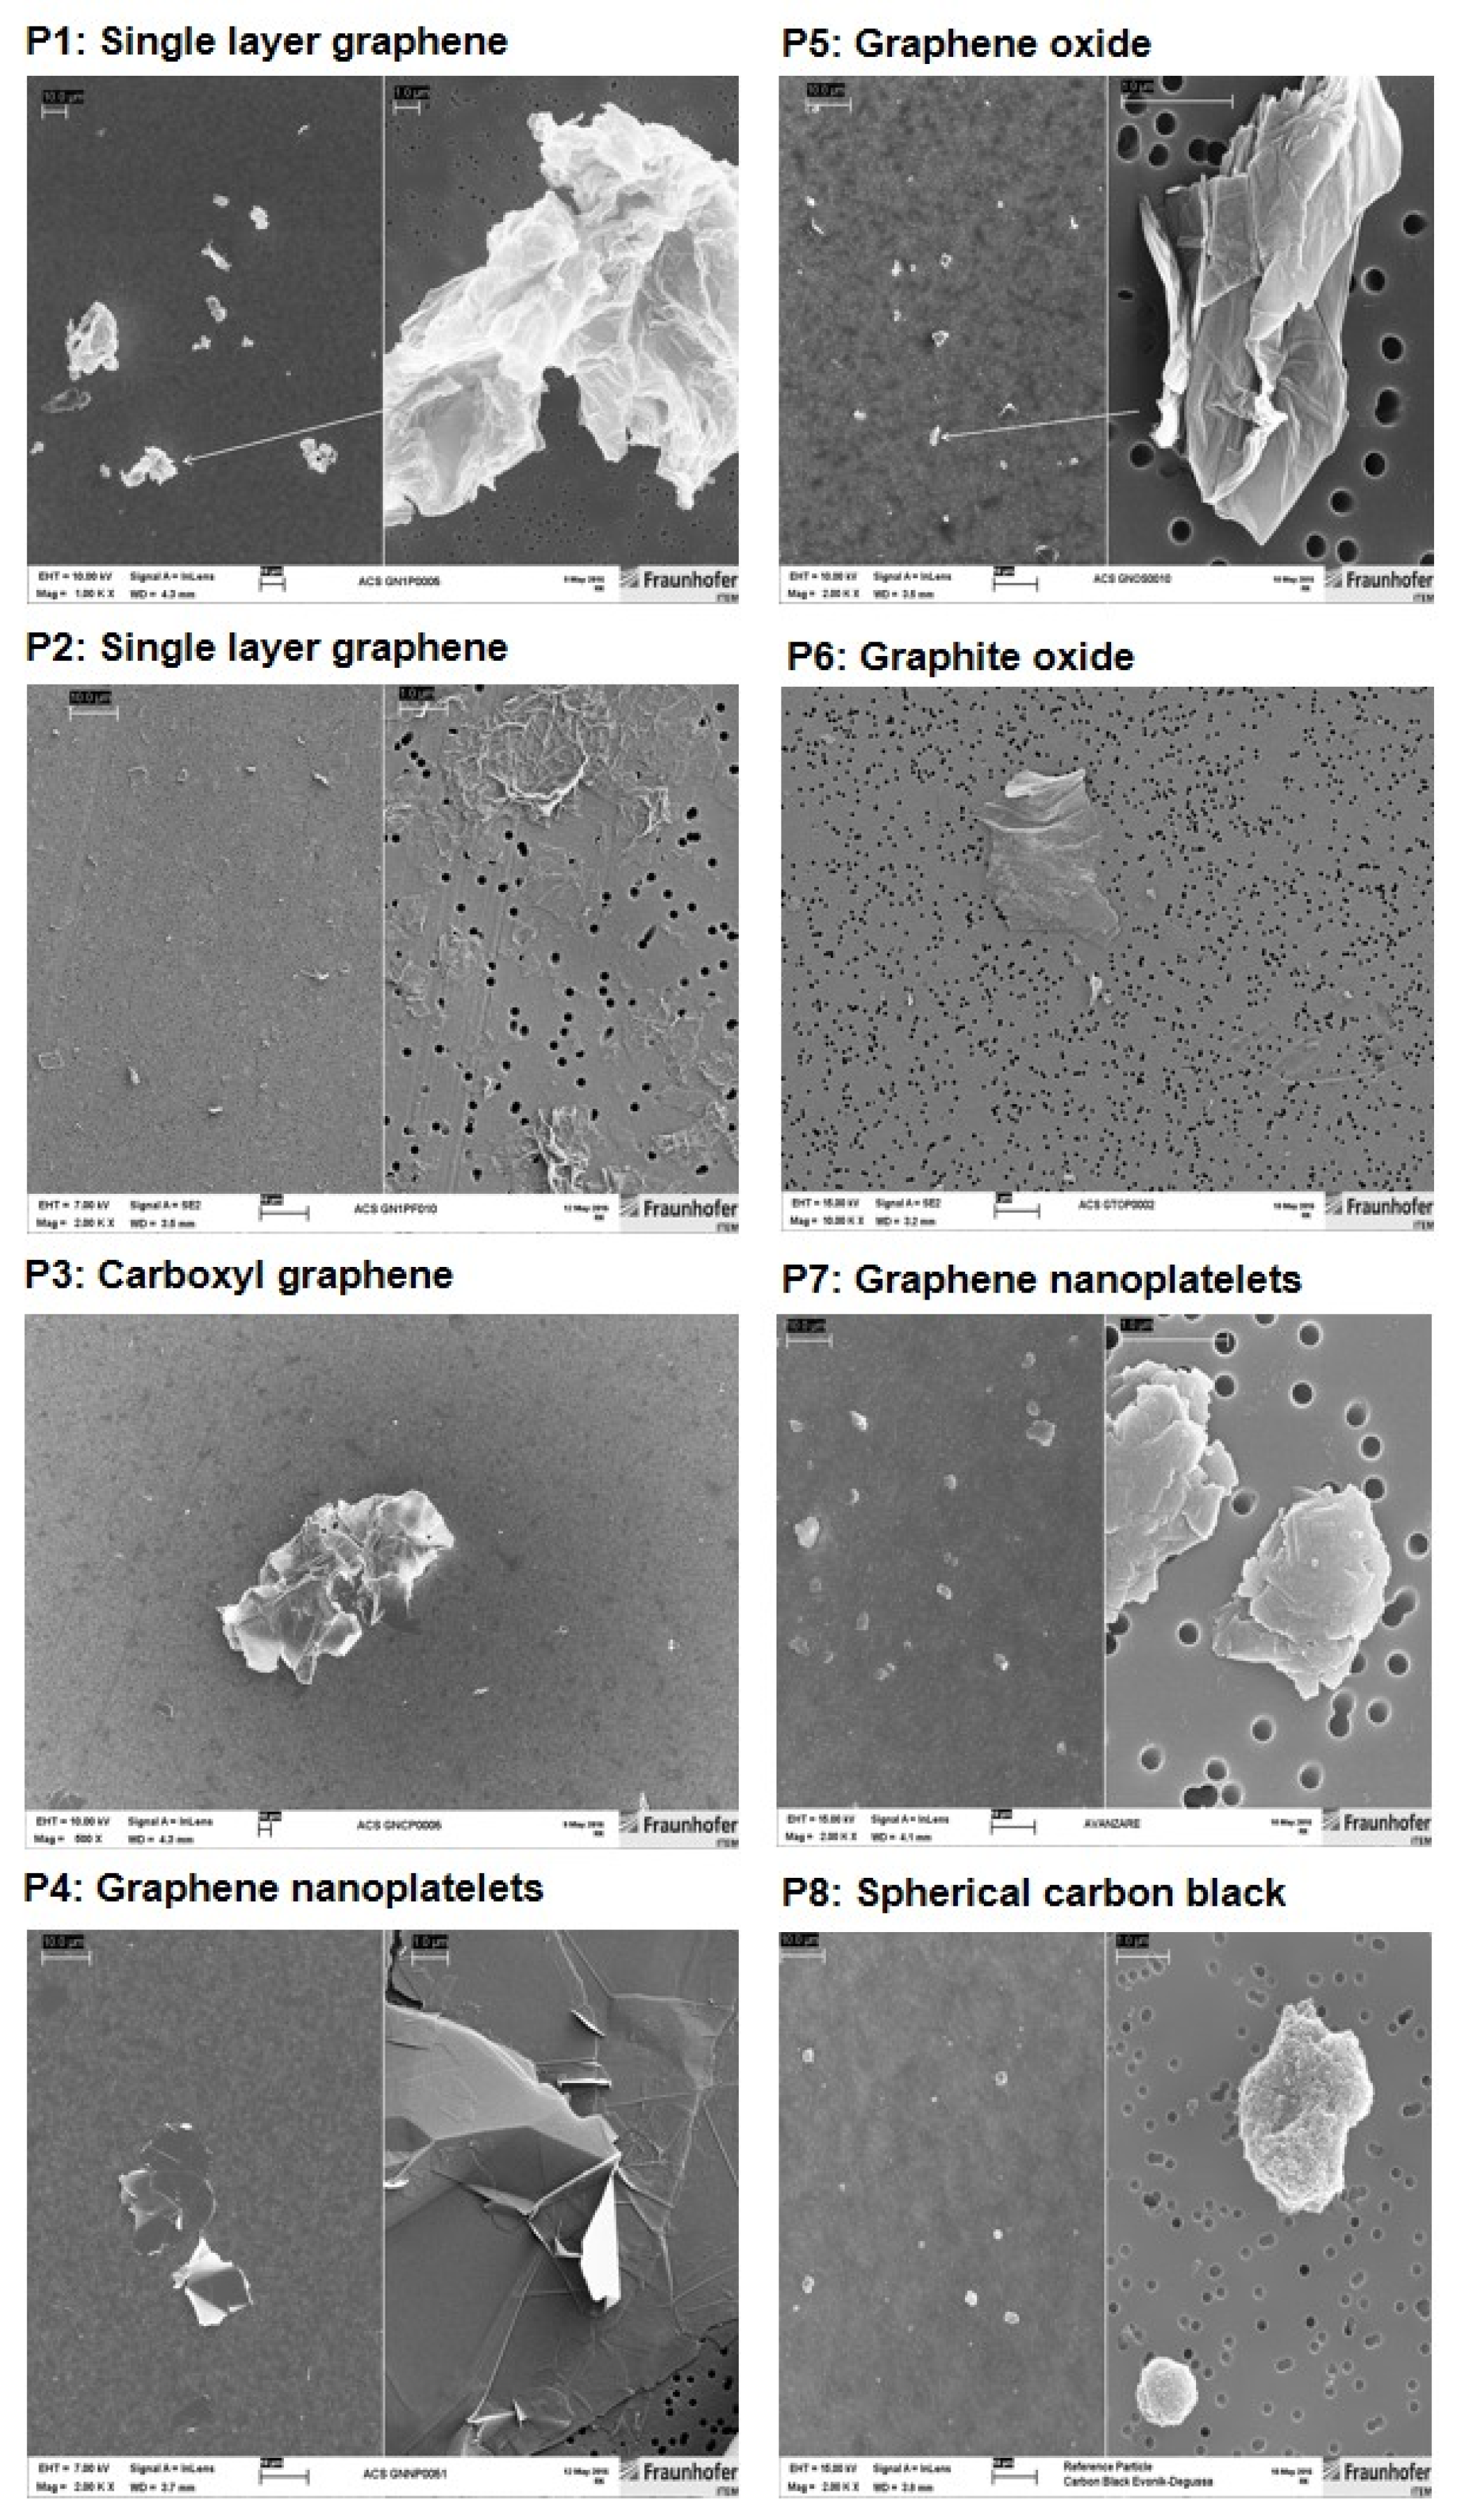
| Code | Material | Supplier/ Identification | Diameter [µm] * | Thickness [nm] * | BET Surface Area [m2/mg] | Dispersible in * | Preparation/Properties * |
|---|---|---|---|---|---|---|---|
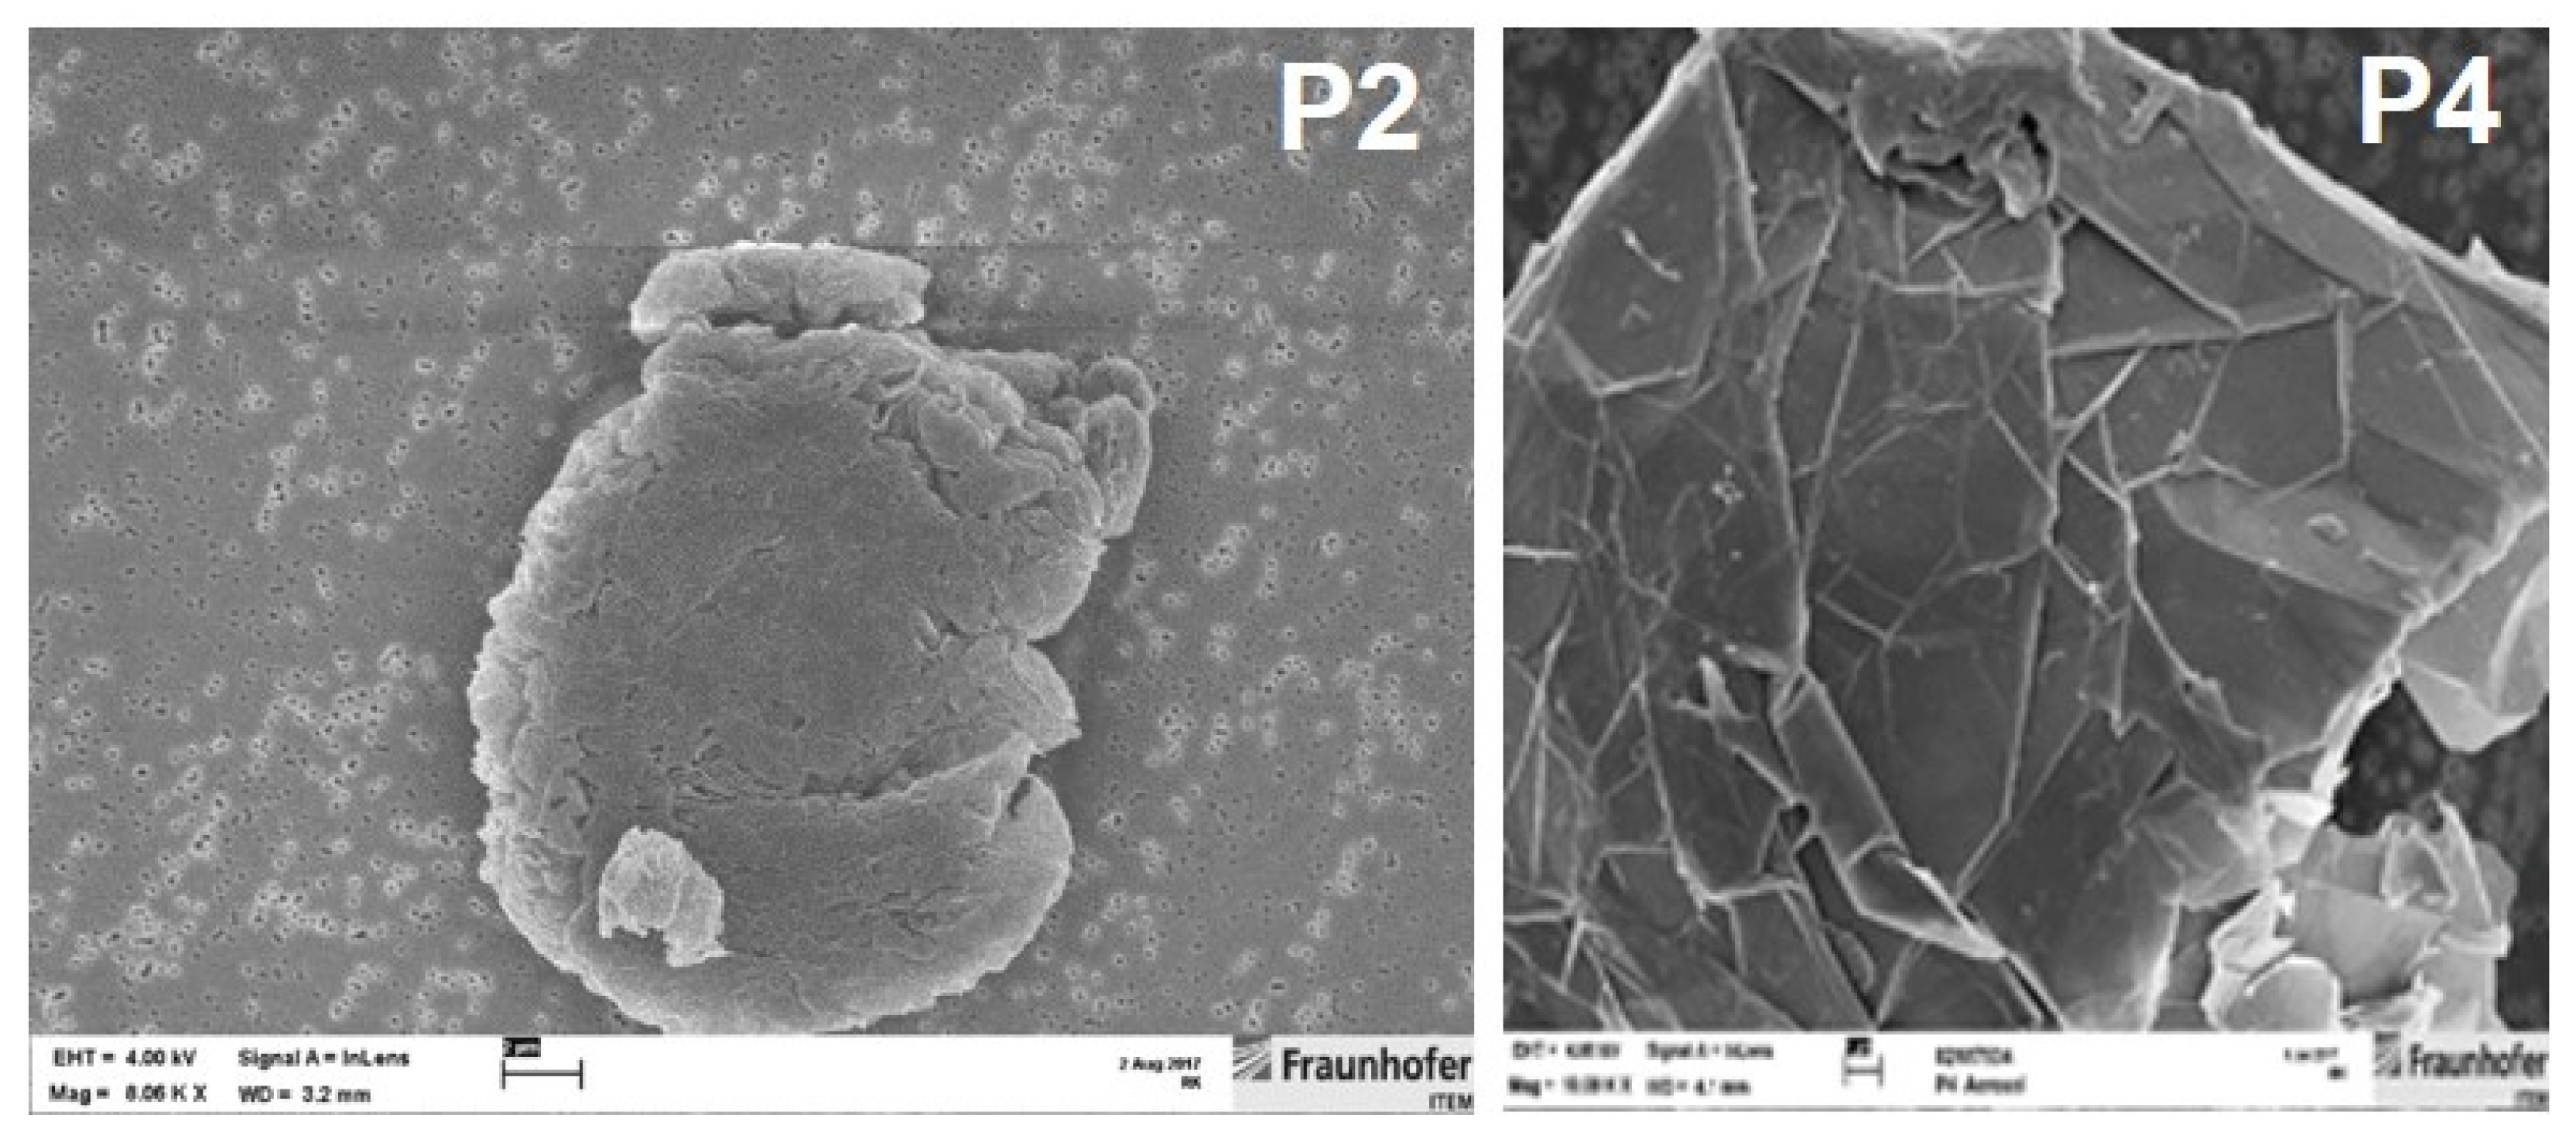
| P1 | Single-Layer Graphene (SLG) | ACS: GN1P0005 | 0.4–5 | 0.6–1.2 | 278 (400–1000) * | Water, ethanol and others | Thermal exfoliation + hydrogen reduction; sulfur impurities |
| P2 | Single-Layer Graphene, (Graphene factory) (SLG) | ACS: GNP1F010 | 0.5–5 | 1–5 atomic layers | 620 (650–750) * | No information | Thermal exfoliation + hydrogen reduction |
| P3 | Carboxyl Graphene (CG) | ACS: GNCP0005 | 1–5 | 0.8–1.2 | 1.5 | Polar solvents like DMF | (1) Modified Hummer’s Method to make graphene oxide (2) Conversion of (-OH) and (C-O-C) into (-COOH); non-conductivity |
| P4 | Graphene Nanoplatelets (GNP) | ACS: GNNP0051 | 2–7 | 2–10 | 15 (20–40) * | Easy to disperse | Stacks of multilayer graphene; high aspect ratio (width to thickness); D50 = 48.93 µm, phosphorous impurities |
| P5 | Graphene Oxide (S Method) (GO) | ACS: GNOS0010 | 1–15 | 0.8–1.2 | 5.2 (5–10) * | No information | Staudenmaier Method; oxygen content: 35 wt %; single-layer ratio > 90% |
| P6 | Graphite Oxide | ACS: GTOP0002 | 0.5–5 | 1–3 | 2.7 | Polar solvents like water, ethanol, DMF | Modified Hummer’s Method; oxygen content: 46 wt %; intercalated with either two ethanol or methanol monolayers |
| P7 | Reference Graphene Nanoplatelets (GNP) | Avanzare: GR1 | 2 | 3 | 195 (70) * | No information | No XPS (low defects by Raman), all C1s; 8 ± 0.5 atomic graphene layers |
| P8 | Spherical Carbon Black (CB) | Evonik: Printex 90® | 14 | n.a. | 317 (337) * | No information | Spherical; specified as >99% pure carbon black, PAH = 0.039 ppm |
| Clean Air | P2 Low | P2 Mid | P2 High | P4 Low | P4 Mid | P4 High | Printex 90® | |
|---|---|---|---|---|---|---|---|---|
| Aerosol conc. [mg/m3] | 0 | 0.2 | 0.8 | 3.2 | 0.2 | 0.8 | 3.2 | 3.2 |
| MMAD [µm] | n.a. | 1.92 B | 2.52 B | 3.11 M | - | 2.72 B | 2.63 B 3.87 B | 0.92 M |
| GSD [–] | n.a. | (2.57) | (2.34) | (3.49) | - | (2.05) | (2.34) (3.12) | (3.53) |
| Test Material Group | Clean Air | P2 Low | P2 Mid | P2 High | P4 Low | P4 Mid | P4 High | P8 | |||
|---|---|---|---|---|---|---|---|---|---|---|---|
| Number of Animals | 5 | 5 | 5 | 5 | 5 | 5 | 5 | 5 | |||
| Lung | Accumulation of particle-laden macrophages | Alveolar | Occ. | 0 | 5 | 5 | 5 | 2 | 4 | 5 | 5 |
| Grade | 0 | 1 | 1.2 | 2 | 0.4 | 0.8 | 1.2 | 1.8 | |||
| Interstitial | Occ. | 0 | 0 | 0 | 1 | 0 | 0 | 0 | 1 | ||
| Grade | 0 | 0 | 0 | 0.2 | 0 | 0 | 0 | 0.2 | |||
| BALT | Occ. | 0 | 0 | 0 | 2 | 0 | 0 | 0 | 4 | ||
| Grade | 0 | 0 | 0 | 0.4 | 0 | 0 | 0 | 0.8 | |||
| Particle-laden giant cells (syncytia) | Occ. | 0 | 0 | 0 | 5 | 0 | 0 | 1 | 0 | ||
| Grade | 0 | 0 | 0 | 1 | 0 | 0 | 0.2 | 0 | |||
| Infiltration granulocytes | Alveolar | Occ. | 0 | 0 | 0 | 4 | 0 | 0 | 0 | 0 | |
| Grade | 0 | 0 | 0 | 0.8 | 0 | 0 | 0 | 0 | |||
| LALN | Accumulation of particle-laden macrophages | Occ. | 0 | 0 | 0 | 0 | 0 | 0 | 0 | 3 | |
| Grade | 0 | 0 | 0 | 0 | 0 | 0 | 0 | 0.6 | |||
| Nasal cavity | Eosinophilic globules | Olfactory epithelium | Occ. | 0 | 1 | 1 | 3 | 0 | 0 | 1 | 0 |
| Grade | 0 | 0.2 | 0.2 | 0.6 | 0 | 0 | 0.2 | 0 | |||
 .
.| Test Material Group | Clean Air | P2 Low | P2 Mid | P2 High | P4 Low | P4 Mid | P4 High | P8 | |||
|---|---|---|---|---|---|---|---|---|---|---|---|
| Number of Animals | 5 | 5 | 5 | 5 | 5 | 5 | 5 | 5 | |||
| Lung | Accumulation of particle-laden macrophages | Alveolar | Occ. | 0 | 3 | 5 | 5 | 1 | 3 | 5 | 5 |
| Grade | 0 | 0.6 | 1 | 1.6 | 0.2 | 0.6 | 1 | 1.4 | |||
| Interstitial | Occ. | 0 | 0 | 0 | 3 | 0 | 0 | 0 | 1 | ||
| Grade | 0 | 0 | 0 | 0.6 | 0 | 0 | 0 | 0.2 | |||
| BALT | Occ. | 0 | 0 | 1 | 0 | 0 | 0 | 0 | 5 | ||
| Grade | 0 | 0 | 0.2 | 0 | 0 | 0 | 0 | 1 | |||
| Particle-laden giant cells (syncytia) | Occ. | 0 | 0 | 1 | 5 | 0 | 0 | 0 | 0 | ||
| Grade | 0 | 0 | 0.2 | 1.6 | 0 | 0 | 0 | 0 | |||
| Infiltration granulocytes | Alveolar | Occ. | 0 | 0 | 0 | 1 | 0 | 0 | 0 | 0 | |
| Grade | 0 | 0 | 0 | 0.2 | 0 | 0 | 0 | 0 | |||
| LALN | Accumulation of particle-laden macrophages | Occ. | 0 | 0 | 0 | 4 | 0 | 0 | 0 | 2 | |
| Grade | 0 | 0 | 0 | 0.8 | 0 | 0 | 0 | 0.4 | |||
| Nasal cavity | Eosinophilic globules | Olfactory epithelium | Occ. | 0 | 0 | 1 | 5 | 1 | 0 | 3 | 1 |
| Grade | 0 | 0 | 0.2 | 1.4 | 0.2 | 0 | 0.6 | 0.2 | |||
 .
.Publisher’s Note: MDPI stays neutral with regard to jurisdictional claims in published maps and institutional affiliations. |
© 2022 by the authors. Licensee MDPI, Basel, Switzerland. This article is an open access article distributed under the terms and conditions of the Creative Commons Attribution (CC BY) license (https://creativecommons.org/licenses/by/4.0/).
Share and Cite
Creutzenberg, O.; Oliveira, H.; Farcal, L.; Schaudien, D.; Mendes, A.; Menezes, A.C.; Tischler, T.; Burla, S.; Ziemann, C. PLATOX: Integrated In Vitro/In Vivo Approach for Screening of Adverse Lung Effects of Graphene-Related 2D Nanomaterials. Nanomaterials 2022, 12, 1254. https://doi.org/10.3390/nano12081254
Creutzenberg O, Oliveira H, Farcal L, Schaudien D, Mendes A, Menezes AC, Tischler T, Burla S, Ziemann C. PLATOX: Integrated In Vitro/In Vivo Approach for Screening of Adverse Lung Effects of Graphene-Related 2D Nanomaterials. Nanomaterials. 2022; 12(8):1254. https://doi.org/10.3390/nano12081254
Chicago/Turabian StyleCreutzenberg, Otto, Helena Oliveira, Lucian Farcal, Dirk Schaudien, Ana Mendes, Ana Catarina Menezes, Tatjana Tischler, Sabina Burla, and Christina Ziemann. 2022. "PLATOX: Integrated In Vitro/In Vivo Approach for Screening of Adverse Lung Effects of Graphene-Related 2D Nanomaterials" Nanomaterials 12, no. 8: 1254. https://doi.org/10.3390/nano12081254
APA StyleCreutzenberg, O., Oliveira, H., Farcal, L., Schaudien, D., Mendes, A., Menezes, A. C., Tischler, T., Burla, S., & Ziemann, C. (2022). PLATOX: Integrated In Vitro/In Vivo Approach for Screening of Adverse Lung Effects of Graphene-Related 2D Nanomaterials. Nanomaterials, 12(8), 1254. https://doi.org/10.3390/nano12081254