
Magnetic-Core/Gold-Shell Nanoparticles for the Detection of Hydrophobic Chemical Contaminants

 , ,
, ,  and
and 
Abstract
:
1. Introduction
2. Materials and Methods
2.1. Synthesis
2.1.1. MAuNPs
2.1.2. Functionalization
2.2. Experimental Techniques
3. Results and Discussion
4. Conclusions
Supplementary Materials
Author Contributions
Funding
Institutional Review Board Statement
Informed Consent Statement
Data Availability Statement
Acknowledgments
Conflicts of Interest
References
- Eryılmaz, M.; Tamer, U.; Boyacı, I.H. Nanoparticle-assisted pyrrolidonyl arylamidase assay for a culture-free Group A Streptococcus pyogenes detection with image analysis. Talanta 2020, 212, 120781. [Google Scholar] [CrossRef] [PubMed]
- Bülbül, G.; Hayat, A.; Andreescu, S. Portable Nanoparticle-Based Sensors for Food Safety Assessment. Sensors 2015, 15, 30736–30758. [Google Scholar] [CrossRef]
- Ellis, D.I.; Brewster, V.L.; Dunn, W.B.; Allwood, J.W.; Golovanov, A.P.; Goodacre, R. Fingerprinting food: Current technologies for the detection of food adulteration and contamination. Chem. Soc. Rev. 2012, 41, 5706–5727. [Google Scholar] [CrossRef] [PubMed]
- Wang, C.; Wang, C.; Wang, X.; Wang, K.; Zhu, Y.; Rong, Z.; Wang, W.; Xiao, R.; Wang, S. Magnetic SERS Strip for Sensitive and Simultaneous Detection of Respiratory Viruses. ACS Appl. Mater. Interfaces 2019, 11, 19495–19505. [Google Scholar] [CrossRef]
- Feng, J.; Xu, Y.; Huang, W.; Kong, H.; Li, Y.; Cheng, H.; Li, L. A magnetic SERS immunosensor for highly sensitive and selective detection of human carboxylesterase 1 in human serum samples. Anal. Chim. Acta 2020, 1097, 176–185. [Google Scholar] [CrossRef] [PubMed]
- Bernat, A.; Samiwala, M.; Albo, J.; Jiang, X.; Rao, Q. Challenges in SERS-based pesticide detection and plausible solutions. J. Agric. Food Chem. 2019, 67, 12341–12347. [Google Scholar] [CrossRef] [PubMed]
- Cheung, W.; Shadi, I.T.; Xu, Y.; Goodacre, R. Quantitative Analysis of the Banned Food Dye Sudan-1 Using Surface Enhanced Raman Scattering with Multivariate Chemometrics. J. Phys. Chem. C 2010, 114, 7285–7290. [Google Scholar] [CrossRef] [Green Version]
- Xie, Y.; Li, Y.; Niu, L.; Wang, H.; Qian, H.; Yao, W. A novel surface-enhanced Raman scattering sensor to detect prohibited colorants in food by graphene/silver nanocomposite. Talanta 2012, 100, 32–37. [Google Scholar] [CrossRef]
- He, L.; Kim, N.-J.; Li, H.; Hu, Z.; Lin, M. Use of a Fractal-like Gold Nanostructure in Surface-Enhanced Raman Spectroscopy for Detection of Selected Food Contaminants. J. Agric. Food Chem. 2008, 56, 9843–9847. [Google Scholar] [CrossRef] [PubMed]
- Peica, N.; Pavel, I.; Pînzaru, S.C.; Rastogi, V.K.; Kiefer, W. Vibrational characterization of E102 food additive by Raman and surface-enhanced Raman spectroscopy and theoretical studies. J. Raman Spectrosc. 2005, 36, 657–666. [Google Scholar] [CrossRef]
- Podstawka, E.; Światłowska, M.; Borowiec, E.; Proniewicz, L.M. Food additives characterization by infrared, Raman, and surface-enhanced Raman spectroscopies. J. Raman Spectrosc. 2007, 38, 356–363. [Google Scholar] [CrossRef]
- Fan, C.; Hu, Z.; Mustapha, A.; Lin, M. Rapid detection of food- and waterborne bacteria using surface-enhanced Raman spectroscopy coupled with silver nanosubstrates. Appl. Microbiol. Biotechnol. 2011, 92, 1053–1061. [Google Scholar] [CrossRef]
- Tang, D.; Yuan, A.R.; Chai, Y. Magnetic Core−Shell Fe3O4@Ag Nanoparticles Coated Carbon Paste Interface for Studies of Carcinoembryonic Antigen in Clinical Immunoassay. J. Phys. Chem. B 2006, 110, 11640–11646. [Google Scholar] [CrossRef]
- Van Dorst, B.; Mehta, J.; Bekaert, K.; Rouah-Martin, E.; De Coen, W.; Dubruel, P.; Blust, R.; Robbens, J. Recent advances in recognition elements of food and environmental biosensors: A review. Biosens. Bioelectron. 2010, 26, 1178–1194. [Google Scholar] [CrossRef] [PubMed]
- Chen, J.; Alcaine, S.D.; Jiang, Z.; Rotello, V.M.; Nugen, S.R. Detection of Escherichia coli in Drinking Water Using T7 Bacteriophage-Conjugated Magnetic Probe. Anal. Chem. 2015, 87, 8977–8984. [Google Scholar] [CrossRef]
- Kim, J.S.; Taitt, C.; Ligler, F.S.; Anderson, G.P. Multiplexed magnetic microsphere immunoassays for detection of pathogens in foods. Sens. Instrum. Food Qual. Saf. 2010, 4, 73–81. [Google Scholar] [CrossRef] [PubMed] [Green Version]
- Hayat, A.; Yang, C.; Rhouati, A.; Marty, J.L. Recent Advances and Achievements in Nanomaterial-Based, and Structure Switchable Aptasensing Platforms for Ochratoxin A Detection. Sensors 2013, 13, 15187–15208. [Google Scholar] [CrossRef] [Green Version]
- Driskell, J.D.; Kwarta, K.M.; Lipert, R.J.; Porter, M.D.; Neill, J.D.; Ridpath, J.F. Low-level detection of viral pathogens by a surface-enhanced raman scattering based immunoassay. Anal. Chem. 2005, 77, 6147–6154. [Google Scholar] [CrossRef] [PubMed]
- Tiwari, P.M.; Vig, K.; Dennis, V.A.; Singh, S.R. Functionalized Gold Nanoparticles and Their Biomedical Applications. Nanomaterials 2011, 1, 31–63. [Google Scholar] [CrossRef]
- Yang, G.; Hu, L.; Keiper, T.D.; Xiong, P.; Hallinan, D.T. Gold Nanoparticle Monolayers with Tunable Optical and Electrical Properties. Langmuir 2016, 32, 4022–4033. [Google Scholar] [CrossRef] [PubMed]
- Yang, G.; Hallinan, D.T. Gold Nanoparticle Monolayers from Sequential Interfacial Ligand Exchange and Migration in a Three-Phase System. Sci. Rep. 2016, 6, 35339. [Google Scholar] [CrossRef] [Green Version]
- Yang, G.; Nanda, J.; Wang, B.; Chen, G.; Hallinan, D.T., Jr. Self-Assembly of Large Gold Nanoparticles for Surface-Enhanced Raman Spectroscopy. ACS Appl. Mater. Interfaces 2017, 9, 13457–13470. [Google Scholar] [CrossRef]
- Goodwin, J.W. Colloids and Interfaces with Surfactants and Polymers—An Introduction. Colloids Interfaces Surfactants Polym.-Introd. 2004, 61–93. [Google Scholar]
- Alhadrami, H.A.; Al-Amer, S.; Aloraij, Y.; Alhamlan, F.; Chinnappan, R.; Abu-Salah, K.M.; Almatrrouk, S.; Zourob, M.M. Development of a Simple, Fast, and Cost-Effective Nanobased Immunoassay Method for Detecting Norovirus in Food Samples. ACS Omega 2020, 5, 12162–12165. [Google Scholar] [CrossRef]
- Tamer, U.; Cetin, D.; Suludere, Z.; Boyaci, I.H.; Temiz, H.T.; Yegenoglu, H.; Daniel, P.; Dinçer, I.; Elerman, Y. Gold-Coated Iron Composite Nanospheres Targeted the Detection of Escherichia coli. Int. J. Mol. Sci. 2013, 14, 6223–6240. [Google Scholar] [CrossRef] [PubMed]
- Waswa, J.; Debroy, C.; Irudayaraj, J. Rapid detection of salmonella enteritidis and escherichia coli using surface plasmon resonance biosensor. J. Food Process Eng. 2006, 29, 373–385. [Google Scholar] [CrossRef]
- Sozer, N.; Kokini, J.L. Nanotechnology and its applications in the food sector. Trends Biotechnol. 2009, 27, 82–89. [Google Scholar] [CrossRef]
- Liu, H.; Hou, P.; Zhang, W.X.; Wu, J.H. Synthesis of monosized core-shell Fe3O4/Au multifunctional nanoparticles by PVP-assisted nanoemulsion process. Colloids Surf. A Physicochem. Eng. Asp. 2010, 356, 21–27. [Google Scholar] [CrossRef]
- Mikhaylova, M.; Kim, D.K.; Bobrysheva, N.; Osmolowsky, M.; Semenov, V.; Tsakalakos, T.; Muhammed, M. Superparamagnetism of Magnetite Nanoparticles: Dependence on Surface Modification. Langmuir 2004, 20, 2472–2477. [Google Scholar] [CrossRef] [PubMed]
- Tamer, U.; Gündoğdu, Y.; Boyaci, I.; Pekmez, K. Synthesis of magnetic core–shell Fe3O4–Au nanoparticle for biomolecule immobilization and detection. J. Nanoparticle Res. 2010, 12, 1187–1196. [Google Scholar] [CrossRef]
- Bernat, A. Synthesis and Characterization of Silica-Coated Iron(II, III) Oxide Magnetic Particles for Potential Application in Glyphosate Detection. Master’s Thesis, The Florida State University, Ann Arbor, MI, USA, 2019; p. 95. [Google Scholar]
- Winkler, K.; Kaminska, A.; Wojciechowski, T.; Holyst, R.; Fialkowski, M. Gold Micro-Flowers: One-Step Fabrication of Efficient, Highly Reproducible Surface-Enhanced Raman Spectroscopy Platform. Plasmonics 2011, 6, 697–704. [Google Scholar] [CrossRef] [Green Version]
- Mie, G. Beiträge zur Optik trüber Medien, speziell kolloidaler Metallösungen. Ann. Phys. 1908, 330, 377–445. [Google Scholar] [CrossRef]
- Oldenburg, S.; Averitt, R.; Westcott, S.; Halas, N. Nanoengineering of optical resonances. Chem. Phys. Lett. 1998, 288, 243–247. [Google Scholar] [CrossRef]
- Oldenburg, S.J. Light Scattering from Gold Nanoshells; Rice University: Houston, TX, USA, 2000. [Google Scholar]
- Iqbal, M.; Usanase, G.; Oulmi, K.; Aberkane, F.; Bendaikha, T.; Fessi, H.; Zine, N.; Agusti, G.; Errachid, E.-S.; Elaissari, A. Preparation of gold nanoparticles and determination of their particles size via different methods. Mater. Res. Bull. 2016, 79, 97–104. [Google Scholar] [CrossRef]
- An, L.; Wang, Y.; Tian, Q.; Yang, S. Small Gold Nanorods: Recent Advances in Synthesis, Biological Imaging, and Cancer Therapy. Materials 2017, 10, 1372. [Google Scholar] [CrossRef] [PubMed] [Green Version]
- Tranter, G.E. UV-Visible Absorption and Fluorescence Spectrometers. In Encyclopedia of Spectroscopy and Spectrometry; Lindon, J.C., Ed.; Elsevier: Oxford, UK, 1999; pp. 2383–2389. [Google Scholar]
- Liu, X.; Atwater, M.; Wang, J.; Huo, Q. Extinction coefficient of gold nanoparticles with different sizes and different capping ligands. Colloids Surf. B Biointerfaces 2007, 58, 3–7. [Google Scholar] [CrossRef]
- Kudelski, A. Surface-enhanced Raman scattering study of monolayers formed from mixtures of 4-mercaptobenzoic acid and various aromatic mercapto-derivative bases. J. Raman Spectrosc. 2009, 40, 2037–2043. [Google Scholar] [CrossRef]
- Zhu, J.; Li, W.; Zhu, M.; Zhang, W.; Niu, W.; Liu, G. Influence of the pH value of a colloidal gold solution on the absorption spectra of an LSPR-assisted sensor. AIP Adv. 2014, 4, 031338. [Google Scholar] [CrossRef]
- Pabisch, S.; Feichtenschlager, B.; Kickelbick, G.; Peterlik, H. Effect of interparticle interactions on size determination of zirconia and silica based systems—A comparison of SAXS, DLS, BET, XRD and TEM. Chem. Phys. Lett. 2012, 521, 91–97. [Google Scholar] [CrossRef] [Green Version]
- Philip, D. Biosynthesis of Au, Ag and Au–Ag nanoparticles using edible mushroom extract. Spectrochim. Acta Part A Mol. Biomol. Spectrosc. 2009, 73, 374–381. [Google Scholar] [CrossRef] [PubMed]
- Katikaneani, P.; Vaddepally, A.K.; Tippana, N.R.; Banavath, R.; Kommu, S. Phase Transformation of Iron Oxide Nanoparticles from Hematite to Maghemite in Presence of Polyethylene Glycol: Application as Corrosion Resistant Nanoparticle Paints. J. Nanosci. 2016, 2016, 1–6. [Google Scholar] [CrossRef] [Green Version]
- Liu, H.; Zwart, P.H. Determining pair distance distribution function from SAXS data using parametric functionals. J. Struct. Biol. 2012, 180, 226–234. [Google Scholar] [CrossRef]
- Moore, P.B. Small-angle scattering. Information content and error analysis. J. Appl. Crystallogr. 1980, 13, 168–175. [Google Scholar] [CrossRef]
- Hasegawa, R.; Aoki, A.Y.; Doi, M. Optimum Graft Density for Dispersing Particles in Polymer Melts. Macromolecules 1996, 29, 6656–6662. [Google Scholar] [CrossRef]
- Chevigny, C.; Dalmas, F.; Di Cola, E.; Gigmes, D.; Bertin, D.; Boué, F.; Jestin, J. Polymer-Grafted-Nanoparticles Nanocomposites: Dispersion, Grafted Chain Conformation, and Rheological Behavior. Macromolecules 2010, 44, 122–133. [Google Scholar] [CrossRef]
- Martin, K.L.; Street, D.P.; Dickerson, M.B. Polycarbosilane-Grafted Nanoparticles: Free-Flowing Hairy Nanoparticle Liquids That Convert to Ceramic. Chem. Mater. 2020, 32, 3990–4001. [Google Scholar] [CrossRef]
- Yang, G.; Kim, K.; Wang, W.; Chen, B.; Mattoussi, H.; Hallinan, D.T. Scaling Laws for Polymer Chains Grafted onto Nanoparticles. Macromol. Chem. Phys. 2018, 219, 1700417. [Google Scholar] [CrossRef]
- ACD/ChemSketch; Advanced Chemistry Development, Inc.: Toronto, ON, Canada, 2021.
- Silverstein, R.M.; Webster, F.X.; Kiemle, D. Spectrometric Identification of Organic Compounds, 7th ed.; Wiley: Hoboken, NJ, USA, 2005. [Google Scholar]
- Smith, A.M.; Marbella, L.E.; Johnston, K.A.; Hartmann, M.J.; Crawford, S.E.; Kozycz, L.M.; Seferos, D.S.; Millstone, J.E. Quantitative Analysis of Thiolated Ligand Exchange on Gold Nanoparticles Monitored by 1H NMR Spectroscopy. Anal. Chem. 2015, 87, 2771–2778. [Google Scholar] [CrossRef]
- Hermansson, K.; Lindberg, U.; Hok, B.; Palmskog, G. Wetting properties of silicon surfaces. In Proceedings of the TRANSDUCERS’91: 1991 International Conference on Solid-State Sensors and Actuators. Digest of Technical Papers, San Francisco, CA, USA, 24–27 June 2002. [Google Scholar]
- Ayansiji, A.O.; Dighe, A.V.; Linninger, A.A.; Singh, M.R. Constitutive relationship and governing physical properties for magnetophoresis. Proc. Natl. Acad. Sci. USA 2020, 117, 30208–30214. [Google Scholar] [CrossRef]
- Orendorff, C.J.; Gole, A.; Sau, A.T.K.; Murphy, C.J. Surface-Enhanced Raman Spectroscopy of Self-Assembled Monolayers: Sandwich Architecture and Nanoparticle Shape Dependence. Anal. Chem. 2005, 77, 3261–3266. [Google Scholar] [CrossRef]
- Huang, X.; Liu, Y.; Barr, J.; Song, J.; He, Z.; Wang, Y.; Nie, Z.; Xiong, Y.; Chen, X. Controllable self-assembled plasmonic vesicle-based three-dimensional SERS platform for picomolar detection of hydrophobic contaminants. Nanoscale 2018, 10, 13202–13211. [Google Scholar] [CrossRef] [PubMed]
- Zrimsek, A.B.; Chiang, N.; Mattei, M.; Zaleski, S.; McAnally, M.O.; Chapman, C.T.; Henry, A.-I.; Schatz, G.C.; Van Duyne, R.P. Single-Molecule Chemistry with Surface- and Tip-Enhanced Raman Spectroscopy. Chem. Rev. 2017, 117, 7583–7613. [Google Scholar] [CrossRef] [PubMed]


| Sample | Most Probable Pair Distance (nm) |
|---|---|
| MAuNPs | 8.8 ± 5.6 |
| 0.2 mM PEG-MAuNPs | 8.3 ± 4.8 |
| 2 mM PEG-MAuNPs | 7.4 ± 4.6 |
| 20 mM PEG-MAuNPs | 9.9 ± 5.0 |
| 0.1 mM (4-MBA)-MAuNPs | 8.8 ± 5.4 |
| 1 mM (4-MBA)-MAuNPs | 8.2 ± 5.2 |
| 0.1 mM 4-MBA/2 mM PEG-MAuNPs | 11.8 ± 5.4 |
| 2 mM PEG/0.1 mM (4-MBA)-MAuNPs | 10.3 ± 5.0 |
| Sample | PEG Graft Density (Chains nm−2 × 10²) | 4-MBA Graft Density (Molecules nm−2) |
|---|---|---|
| PEG-MAuNPs | 3.3 ± 3.1 | 0.4 ± 0.5 |
| (4-MBA)-MAuNPs | 0.1 ± 0.1 | 6.4 ± 5.8 |
| PEG-(4-MBA)-MAuNPs | 0.5 ± 0.4 | 7.0 ± 6.5 |
| (4-MBA)-PEG-MAuNPs | 4.7 ± 4.3 | 2.2 ± 2.0 |
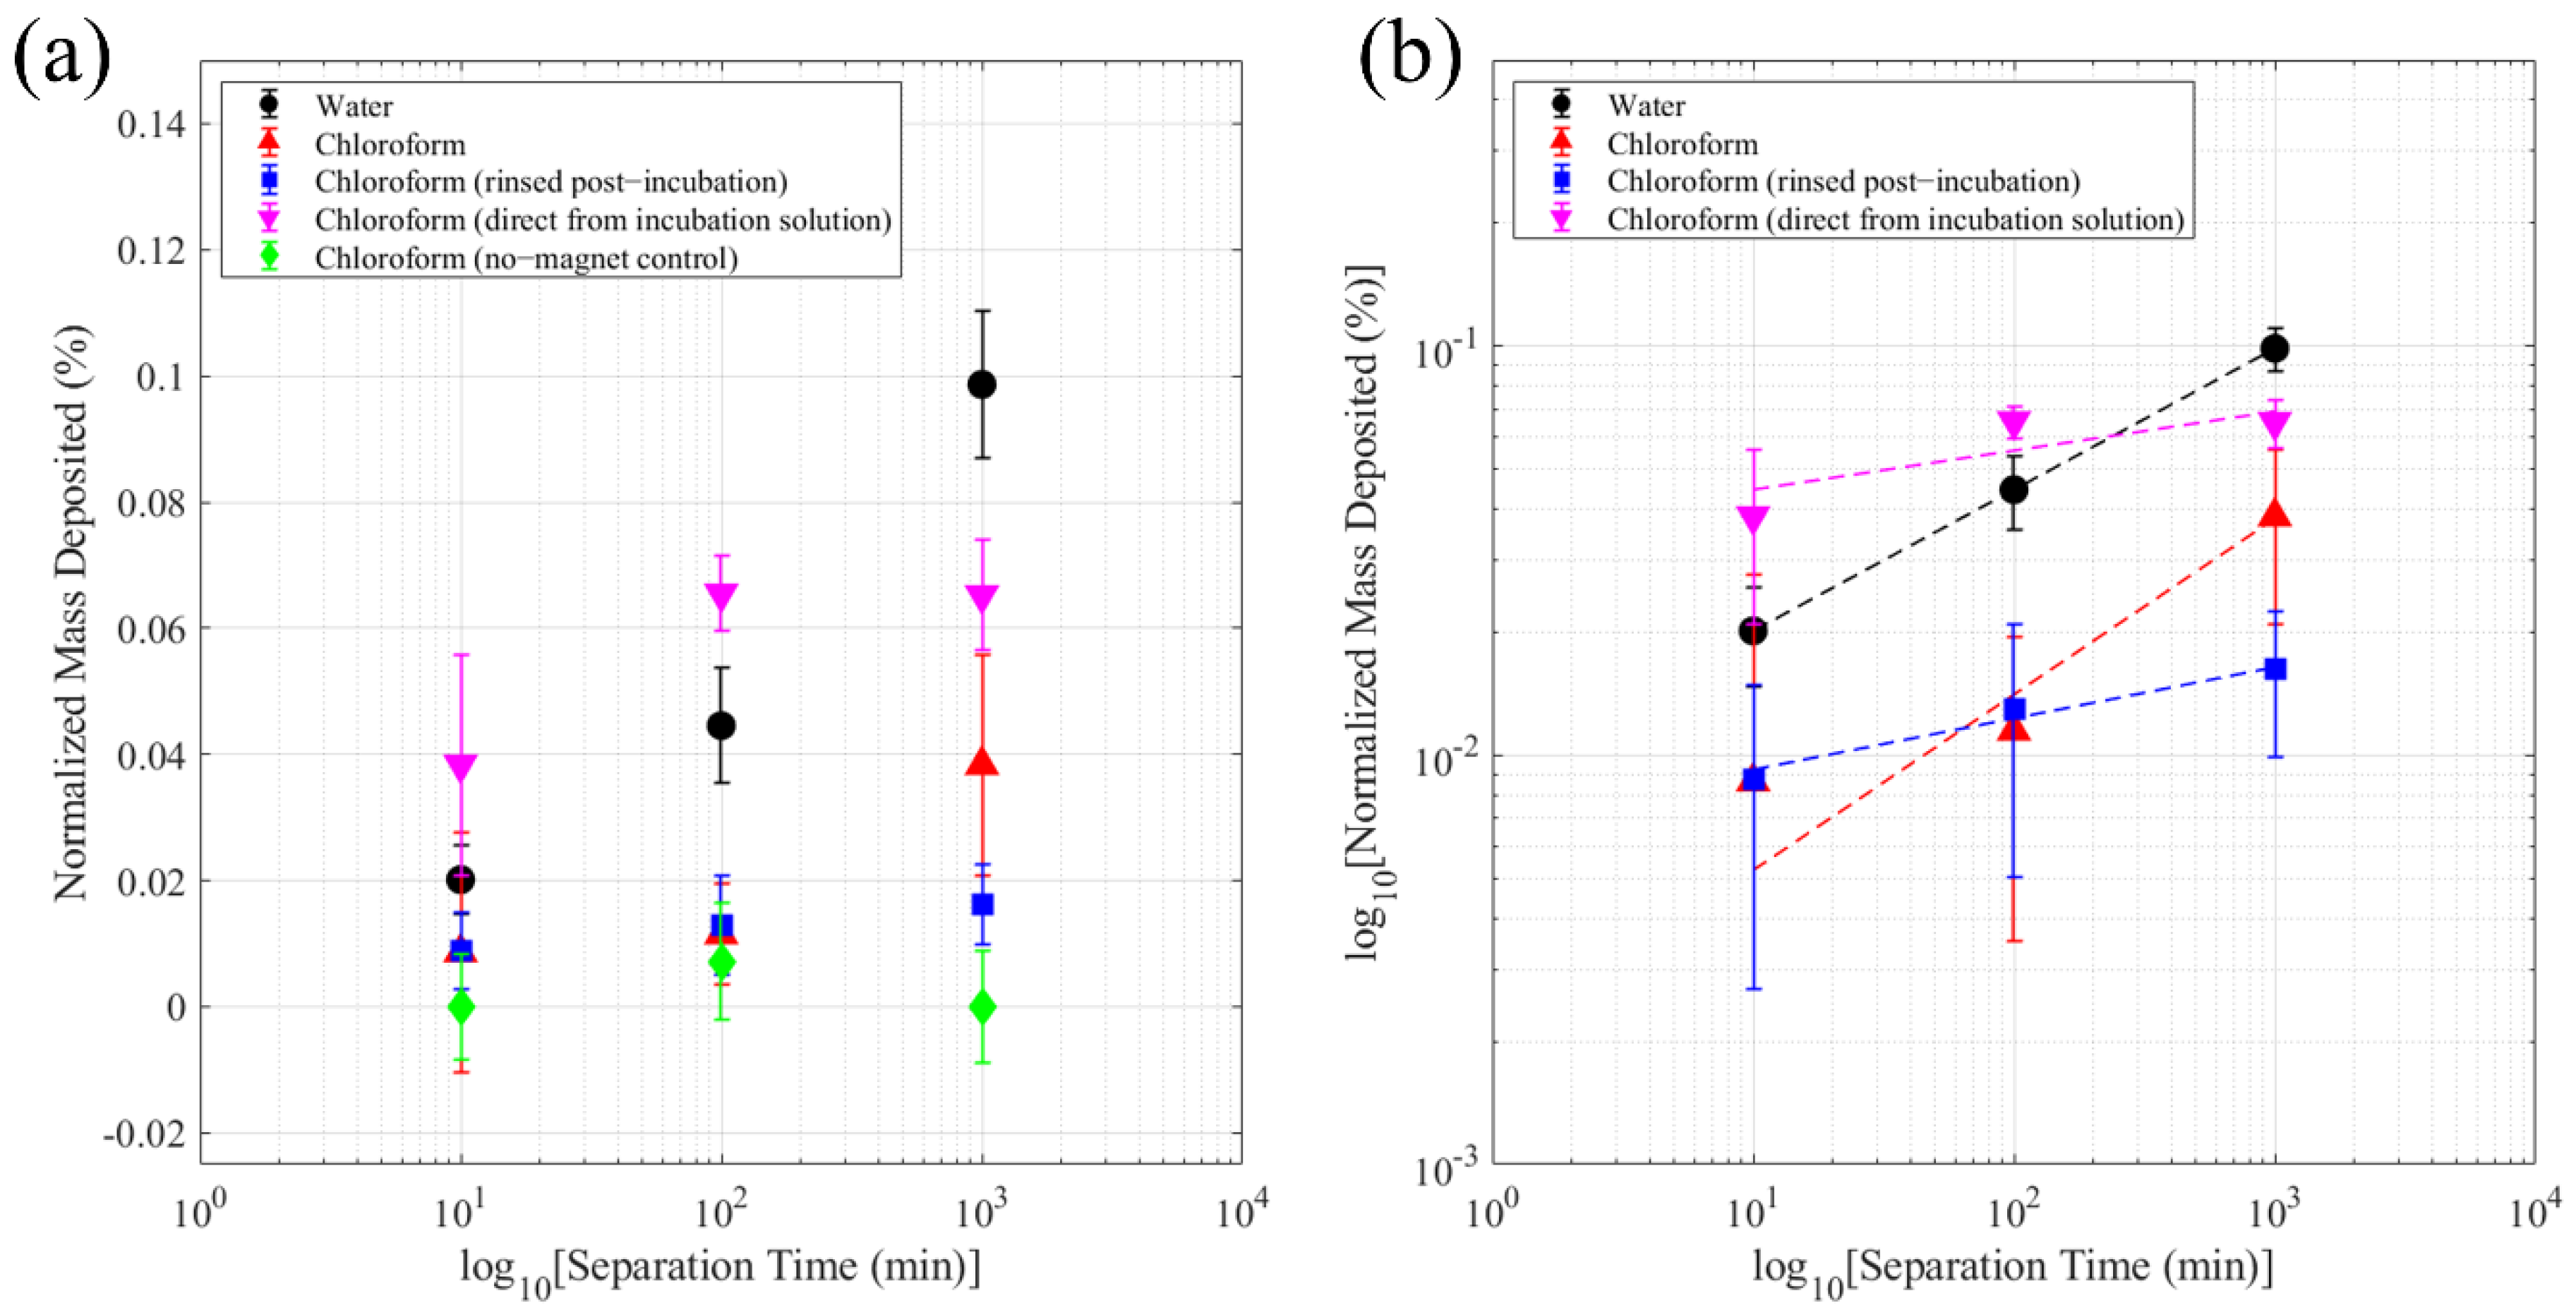
| Sample | Prefactor, A (95% CI) | Power, b (95% CI) | R2 |
|---|---|---|---|
| MAuNPs in DI Water | 9.09 (9.05, 9.14) × 10⁻³ | 3.45 (3.44, 3.46) × 10⁻¹ | 1.000 |
| MAuNPs in Chloroform | 1.95 (−1.67, 2.06) × 10⁻² | 0.43 (−1.02, 1.88) × 10⁰ | 0.966 |
| (4-MBA)-MAuNPs in Chloroform (rinsed post-incubation) | 0.69 (−0.36, 1.74) × 10⁻² | 1.25 (−1.40, 3.90) × 10⁻¹ | 0.976 |
| (4-MBA)-MAuNPs in Chloroform (direct from incubation solution) | 0.36 (−1.40, 2.11) × 10⁻¹ | 0.96 (−7.87, 9.79) × 10⁻¹ | 0.685 |
Publisher’s Note: MDPI stays neutral with regard to jurisdictional claims in published maps and institutional affiliations. |
© 2022 by the authors. Licensee MDPI, Basel, Switzerland. This article is an open access article distributed under the terms and conditions of the Creative Commons Attribution (CC BY) license (https://creativecommons.org/licenses/by/4.0/).
Share and Cite
Mills, A.M.; Strzalka, J.; Bernat, A.; Rao, Q.; Hallinan, D.T., Jr. Magnetic-Core/Gold-Shell Nanoparticles for the Detection of Hydrophobic Chemical Contaminants. Nanomaterials 2022, 12, 1253. https://doi.org/10.3390/nano12081253
Mills AM, Strzalka J, Bernat A, Rao Q, Hallinan DT Jr. Magnetic-Core/Gold-Shell Nanoparticles for the Detection of Hydrophobic Chemical Contaminants. Nanomaterials. 2022; 12(8):1253. https://doi.org/10.3390/nano12081253
Chicago/Turabian StyleMills, Anna M., Joseph Strzalka, Andrea Bernat, Qinchun Rao, and Daniel T. Hallinan, Jr. 2022. "Magnetic-Core/Gold-Shell Nanoparticles for the Detection of Hydrophobic Chemical Contaminants" Nanomaterials 12, no. 8: 1253. https://doi.org/10.3390/nano12081253
APA StyleMills, A. M., Strzalka, J., Bernat, A., Rao, Q., & Hallinan, D. T., Jr. (2022). Magnetic-Core/Gold-Shell Nanoparticles for the Detection of Hydrophobic Chemical Contaminants. Nanomaterials, 12(8), 1253. https://doi.org/10.3390/nano12081253