Abstract
The electrodes of two-dimensional (2D) titanium dioxide (TiO2) nanosheet arrays were successfully fabricated for microRNA-155 detection. The (001) highly active crystal face was exposed to catalyze signaling molecules ascorbic acid (AA). Zero-dimensional (0D) titanium carbide quantum dots (Ti3C2Tx QDs) were modified to the electrode as co-catalysts and reduced the recombination rate of the charge carriers. Spectroscopic methods were used to determine the band structure of TiO2 and Ti3C2Tx QDs, showing that a type Ⅱ heterojunction was built between TiO2 and Ti3C2Tx QDs. Benefiting the advantages of materials, the sensing platform achieved excellent detection performance with a wide liner range, from 0.1 pM to 10 nM, and a low limit of detection of 25 fM (S/N = 3).
1. Introduction
The ultrasensitive, rapid, and accurate detection of microRNA is very meaningful for the early diagnosis and prevention of disease [1]. Research has shown that the aberrant expression of microRNA-155 in the human body can be regarded as a critical detection index for some diseases, such as B-cell lymphoma [2] and breast cancer [3]. However, microRNA-155 is expressed only at the DNA level and not at the protein level; therefore, detecting microRNA-155 by traditional methods for early warning is very difficult [4]. Photoelectrochemical (PEC) biosensing is now attracting extensive attention for sensing nucleic acid and other diagnostic markers because of its inherently low limit of detection and high sensitivity. Generally speaking, there are two important parts in PEC biosensing [5]: (i) the PEC biosensing active species (catalytic signaling molecule to generate the detection signal) and (ii) the biological recognition elements (which are in contact with the active species). Therefore, active materials are very important for photoelectrochemical biosensing.
TiO2 is one of the most charming candidates for PEC biosensing due to its outstanding chemical stability, biocompatibility, and accessibility [6]. Titanium dioxide nanomaterials have been widely used in biological monitoring [7,8]. Sadly, pristine TiO2 suffers from a high carrier recombination rate, which significantly hinders the signal generation and collection of PEC sensors [9]. Coupling TiO2 with other semiconductors can achieve spatial separation of the photogenerated charges [10]. Proper band alignment and electron trapping would increase the concentration and lifetime of the photogenerated charges, thereby improving the catalytic ability of the material [11,12,13]. For this purpose, the interface between the two materials needs to be rationally designed. In principle, the morphology and contacting pattern of active species have to be rationally considered to maximize the contact area while reducing the interfacial defects caused by lattice mismatch between the two phases. On the one hand, the optoelectronic properties of composite materials are closely related to the configuration between the materials. For instance, compared with other forms of allotropes (such as graphene and carbon nanotubes), 0D carbon materials (such as carbon quantum dots) exhibit unique optoelectronic properties when combined with TiO2. On the other hand, the charge behavior of the materials is different when the heterojunction is built on different exposed crystal planes because (i) the generation rates of the photogenerated carriers on different crystal planes are different, and (ii) different work functions of different crystal planes can change the direction of electron flow between the heterojunctions [14].
Since their discovery in 2011, MXene materials have come into the spotlight due to their chemical stability, rapid charge-transfer kinetics, and tight interfacial coupling. Quantum dots derived from 2D materials exhibit excellent properties as compared to their 2D counterparts, such as more abundant active edge sites, bandgap widening, and tunable physicochemical properties [15]. In addition, compared with the other QDs, Ti3C2Tx QDs possess more abundant surface hydrophilic groups (–O and –OH), making them connect tightly with photoactive supporters. Hence, the Ti3C2Tx QDs could be a good co-catalyst for boosting the performance of the PEC biosensor. Song et al. employed Ti3C2Tx QDs as a photoactive material to promote the performance of TiO2-based PEC sensing.
Herein, a PEC biosensing platform was fabricated for microRNA-155 detection. Two-dimensional TiO2 NS arrays were selected as the sensing active substrate. The exposed (001) crystal face of TiO2 enables the material to have higher catalytic performance. The Ti3C2Tx QDs were used as a co-catalyst for the photocatalysis of ascorbic acid (AA) and to suppress the recombination of the charge carriers inside the electrode. Their appropriate energy-band structure enables them to form a type II heterojunction with TiO2 to achieve efficient separation of electrons and holes. The S9.6 antibody was used as the microRNA recognition unit to identify DNA–RNA hybrid duplexes, and alkaline phosphatase (ALP) served as the catalytic signal generation unit. With reasonable material selection and interface design, excellent sensing performance can be expected.
2. Experimental Section
2.1. Synthesis of Ti3C2Tx MXene QDs
An amount of 1 g Ti3AlC2 was slowly added into 10 mL concentrated hydrofluoric acid solution (40 wt %). The mixture was stirred for 12 h to fully etch the aluminum atomic layer in Ti3AlC2. Afterward, the mixture was centrifuged until the pH was near neutral. After vacuum filtration, the sample was vacuum dried at 200 °C overnight. Then, 0.1 g of Ti3C2 powder was added to 10 mL of tetramethylammonium hydroxide (TMAOH, 1 wt%) and stirred for 12 h. The TMAOH-intercalated Ti3C2 powder was centrifuged at 8000 rpm, vacuum filtered, and vacuum dried at 200 °C. Finally, 50 mg of the sample was added to 10 mL solution of TMAOH (2.5wt%). The suspension was refluxed at 110 °C for a whole day, centrifuged at 12,000 rpm, and vacuum dried at 200 °C.
2.2. Synthesis of Ti3C2Tx QDs/(001) TiO2/FTO Electrode
Initially, 10 mL of concentrated hydrochloric acid was mixed with equal amounts of deionized water to configure a dilute solution. Then, 385 μL of tetrabutyl titanate and 0.158 g of ammonium fluorotitanate were added into the mixture with constant stirring until a transparent color solution formed. The fluorine-doped tin oxide (FTO) substrates were ultrasonically cleaned with a glass cleaner and poured into a Teflon reaction kettle with a perforated Teflon base. After heating at 170 °C for 12 h, the FTO substrates were rinsed with water. The (001) exposed TiO2 NSs arrays were prepared after annealing in an air atmosphere at 450 °C for 3 h. Subsequently, Ti3C2Tx QDs (20 mg) were dispersed in 20 mL of water. In order to carry out the self-assembly process, the substrates were dropped vertically into the solution. The solution was placed in an oven at 50 ºC overnight. The Ti3C2Tx QDs slowly self–Organized onto the surface of TiO2 NSs with the volatilization of water. Finally, the Ti3C2Tx QDs/(001) TiO2/FTO electrodes were washed with ultra-pure water to remove the unconnected Ti3C2Tx QDs.
2.3. PEC Detection of microRNA-155
To immobilize DNA, 20 μL of Au NPs (0.05 mg/mL) was added dropwise onto the Ti3C2Tx QDs/(001) TiO2/FTO surface. An amount of 20 μL of 0.5 μM probe DNA immobilization buffer was cast onto the Ti3C2Tx QDs/(001) TiO2/FTO electrode and incubated under humid condition for 12 h at 25 ºC. The electrode was denoted as DNA/Ti3C2Tx QDs/(001) TiO2/FTO electrode. The electrode was washed with a washing buffer and incubated with 20 μL of mercaptohexanol (MCH, 0.1 mM) for 1 h. Then, the DNA/Ti3C2Tx QDs/(001) TiO2/FTO electrode was incubated with 20 μL of different concentrations of microRNA-155 for 2 h. The RNA-DNA/Ti3C2Tx QDs/(001) TiO2/FTO electrode was washed with 0.1×SSC hybridization buffer to eliminate the unhybridized microRNA-155. Subsequently, 20 μL of the S9.6 antibody (20 μg/mL) was further incubated with the electrode for 1 h at 25 ºC in a humid cell. The S9.6-RNA-DNA/Ti3C2Tx QDs/(001) TiO2/FTO electrode was then washed with a buffer. Then, the electrode was incubated with 20 μL of IgG-ALP (25 μg/mL) at 37 °C for 1 h and keeping the surface moist. Finally, the PEC response of the ALP-IgG/antibody/RNA-DNA/Ti3C2Tx QDs/(001) TiO2/FTO electrode was recorded in the detection buffer at 0V.
3. Results and Discussion
3.1. Electrode Construction and Sensing Mechanism of PEC Sensor
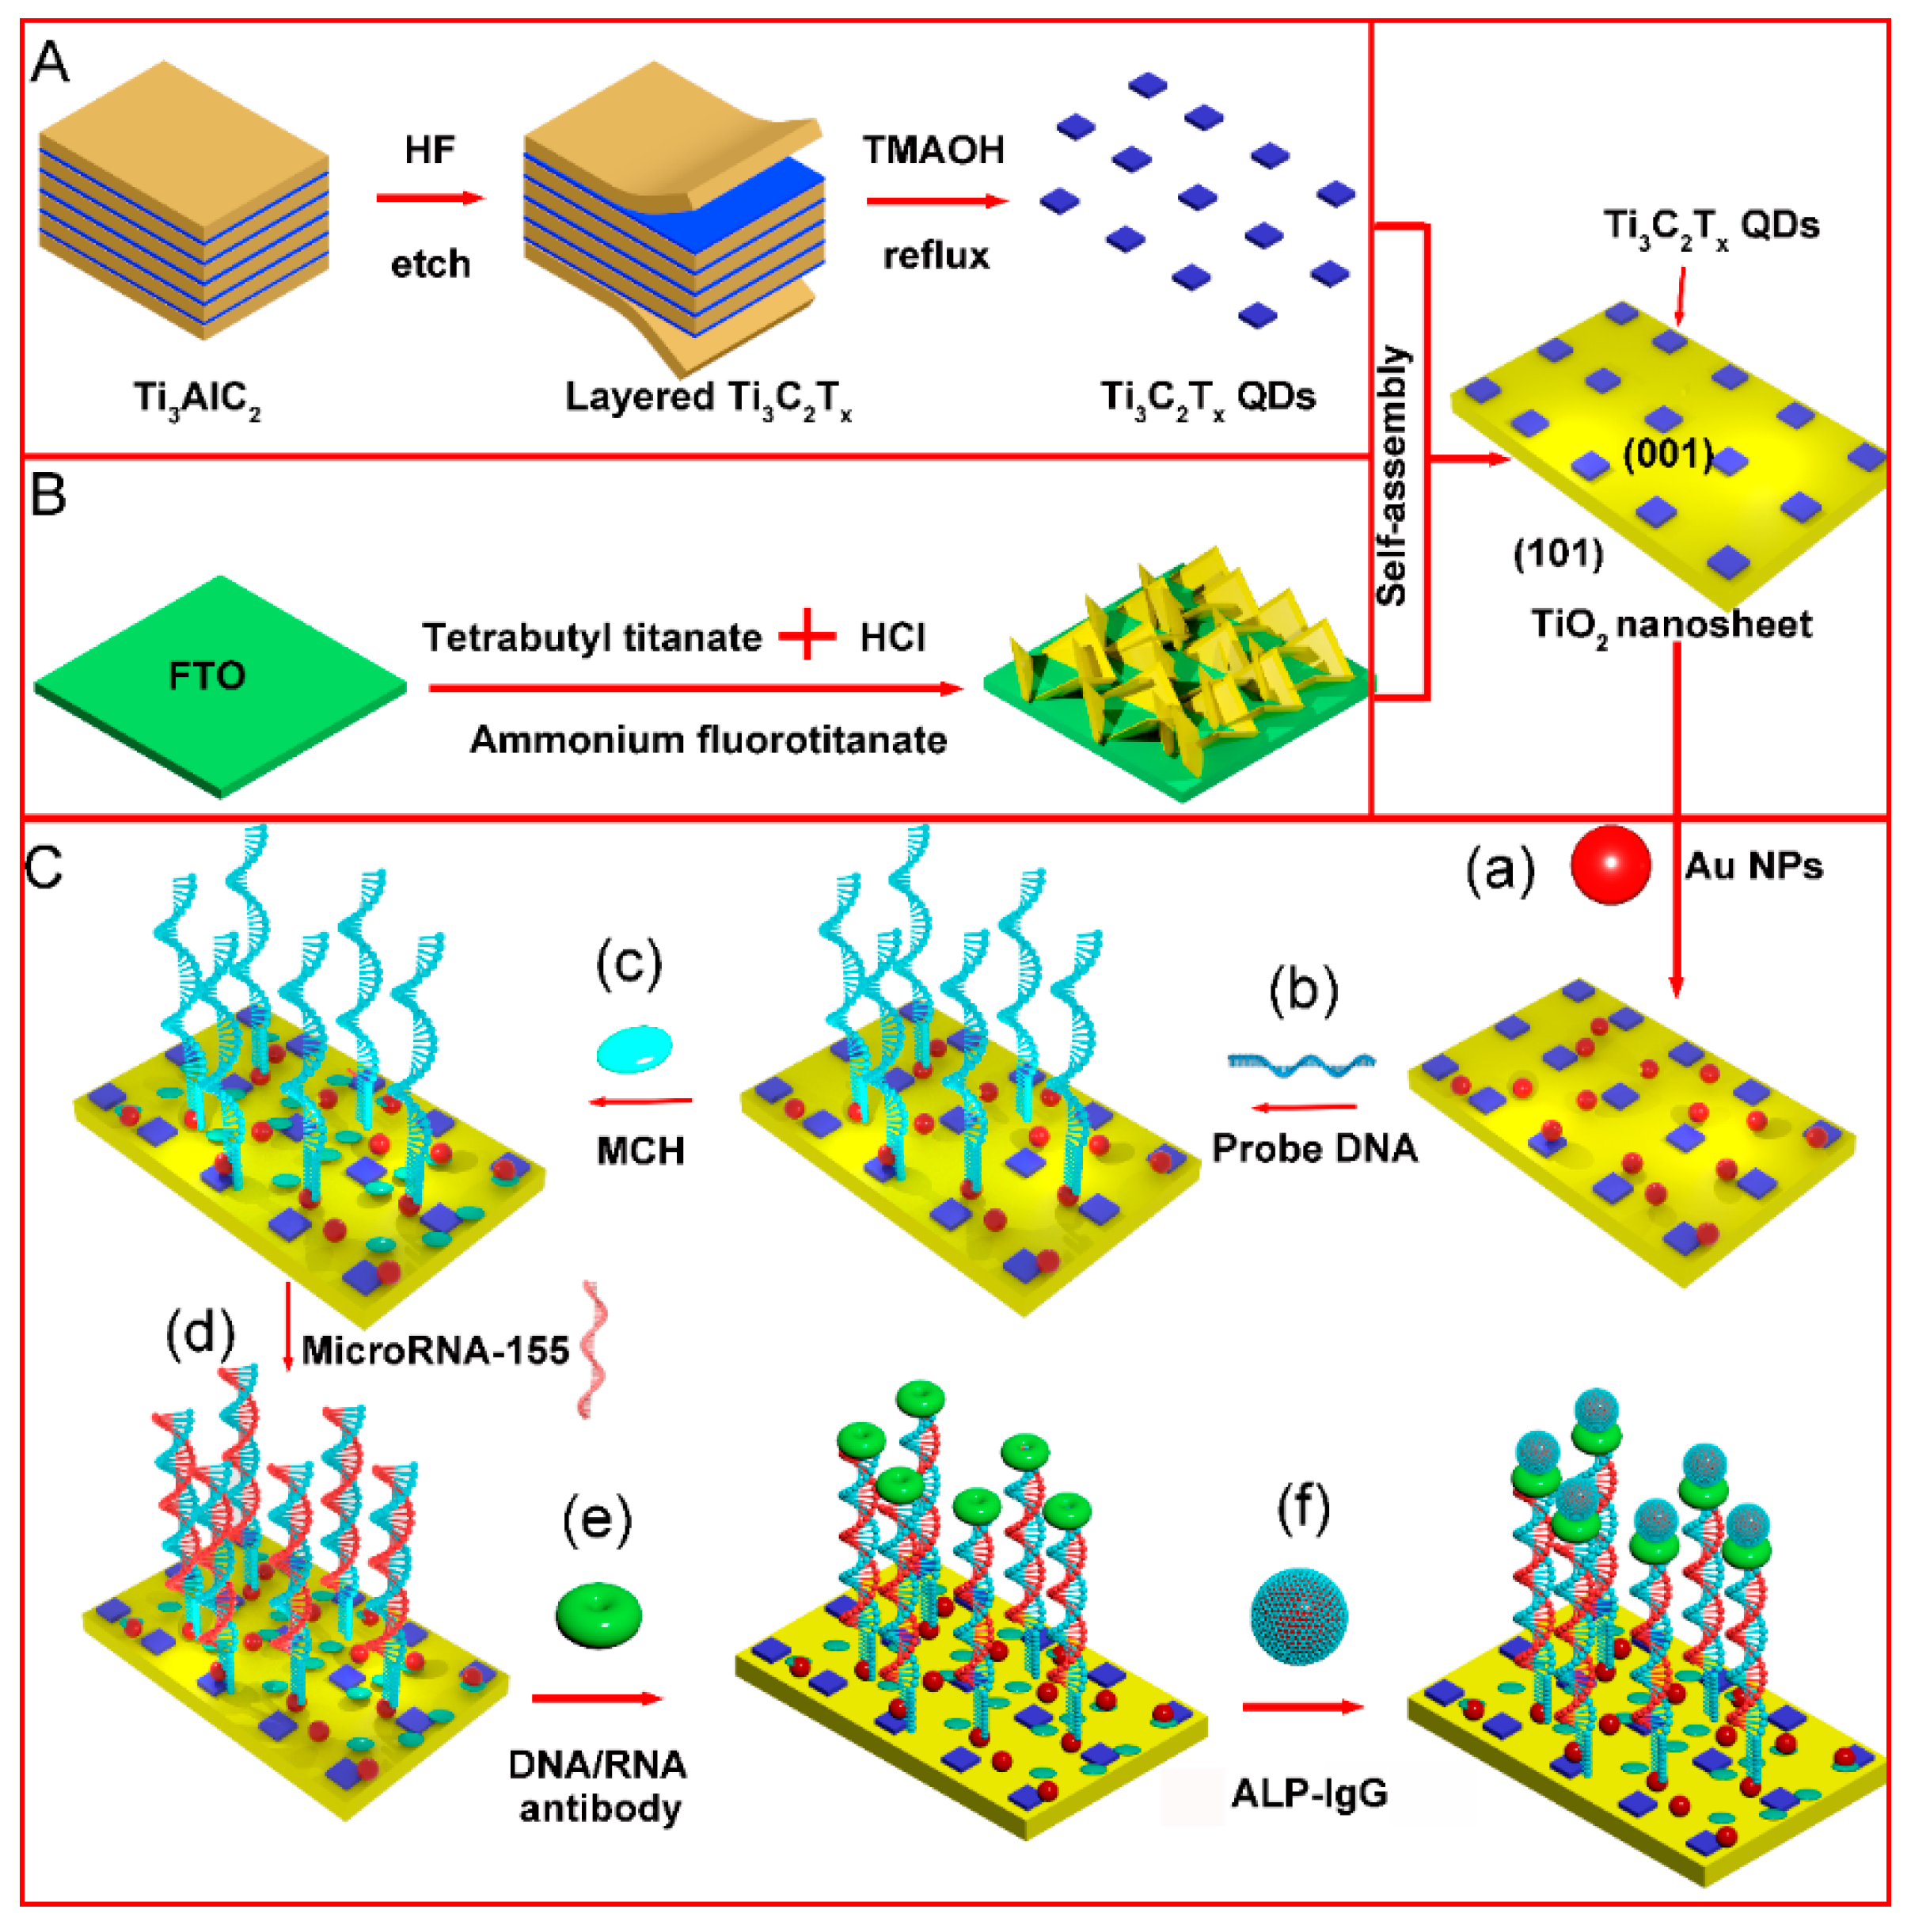
As shown in Figure 1A, layered Ti3C2Tx MXene were fabricated by a top-down method by etching the Al atomic layer in Ti3AlC2 with HF. The Ti3C2Tx QDs were prepared by the reflux hydrothermal method with TMAOH as the intercalating agent. Using ammonium fluorotitanate as a seed, (001) TiO2 NSs were grown on FTO glass through the hydrolysis of titanate in an acidic solution (Figure 1B). Ti3C2Tx QDs and (001) TiO2 NSs were joined together by a self-assembly process. The microRNA-155 detection process is shown in Figure 1C. Au NPs served as the reagent of the immobilization matrix for the thiol modified probe DNA. MCH was used for end capping of the electrode surface. After probe DNA hybridization with target RNA, rigid DNA:RNA double helix hybrids were combined with the S9.6 antibody. Afterward, the immunoreaction between the IgG and S9.6 antibody would lead to alkaline phosphatase immobilization. The alkaline phosphatase on the electrode surface could catalyze phosphorylated ascorbic acid in the detection solution to generate electron donor ascorbic acid, thereby increasing the electrode photocurrent and realizing the quantitative analysis of target microRNA-155.
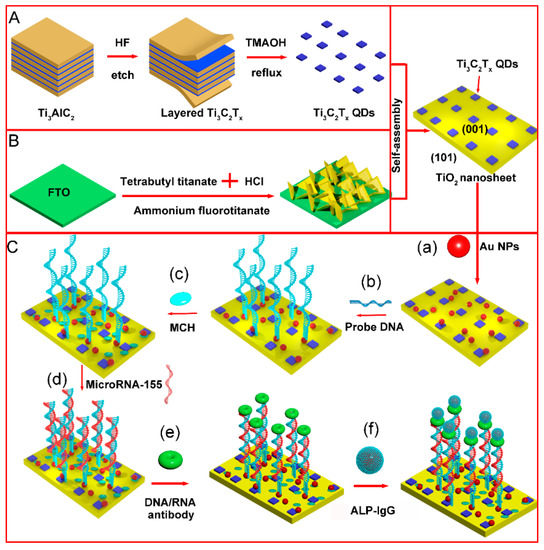
Figure 1.
Schematic of PEC electrode construction and detection mechanism of microRNA-155 (A) synthesis process of Ti3C2Tx QDs (B) synthesis process of (001) TiO2/FTO electrode (C) detection process of microRNA-155 (a) dropping AuNPs (b) probe DNA loading (c) incubation with MCH (d) incubation with microRNA-155 (e) incubation with antibody (f) incubation with IgG-ALP.
3.2. Morphology Characterization of Ti3C2Tx QDs/(001) TiO2/FTO Electrode
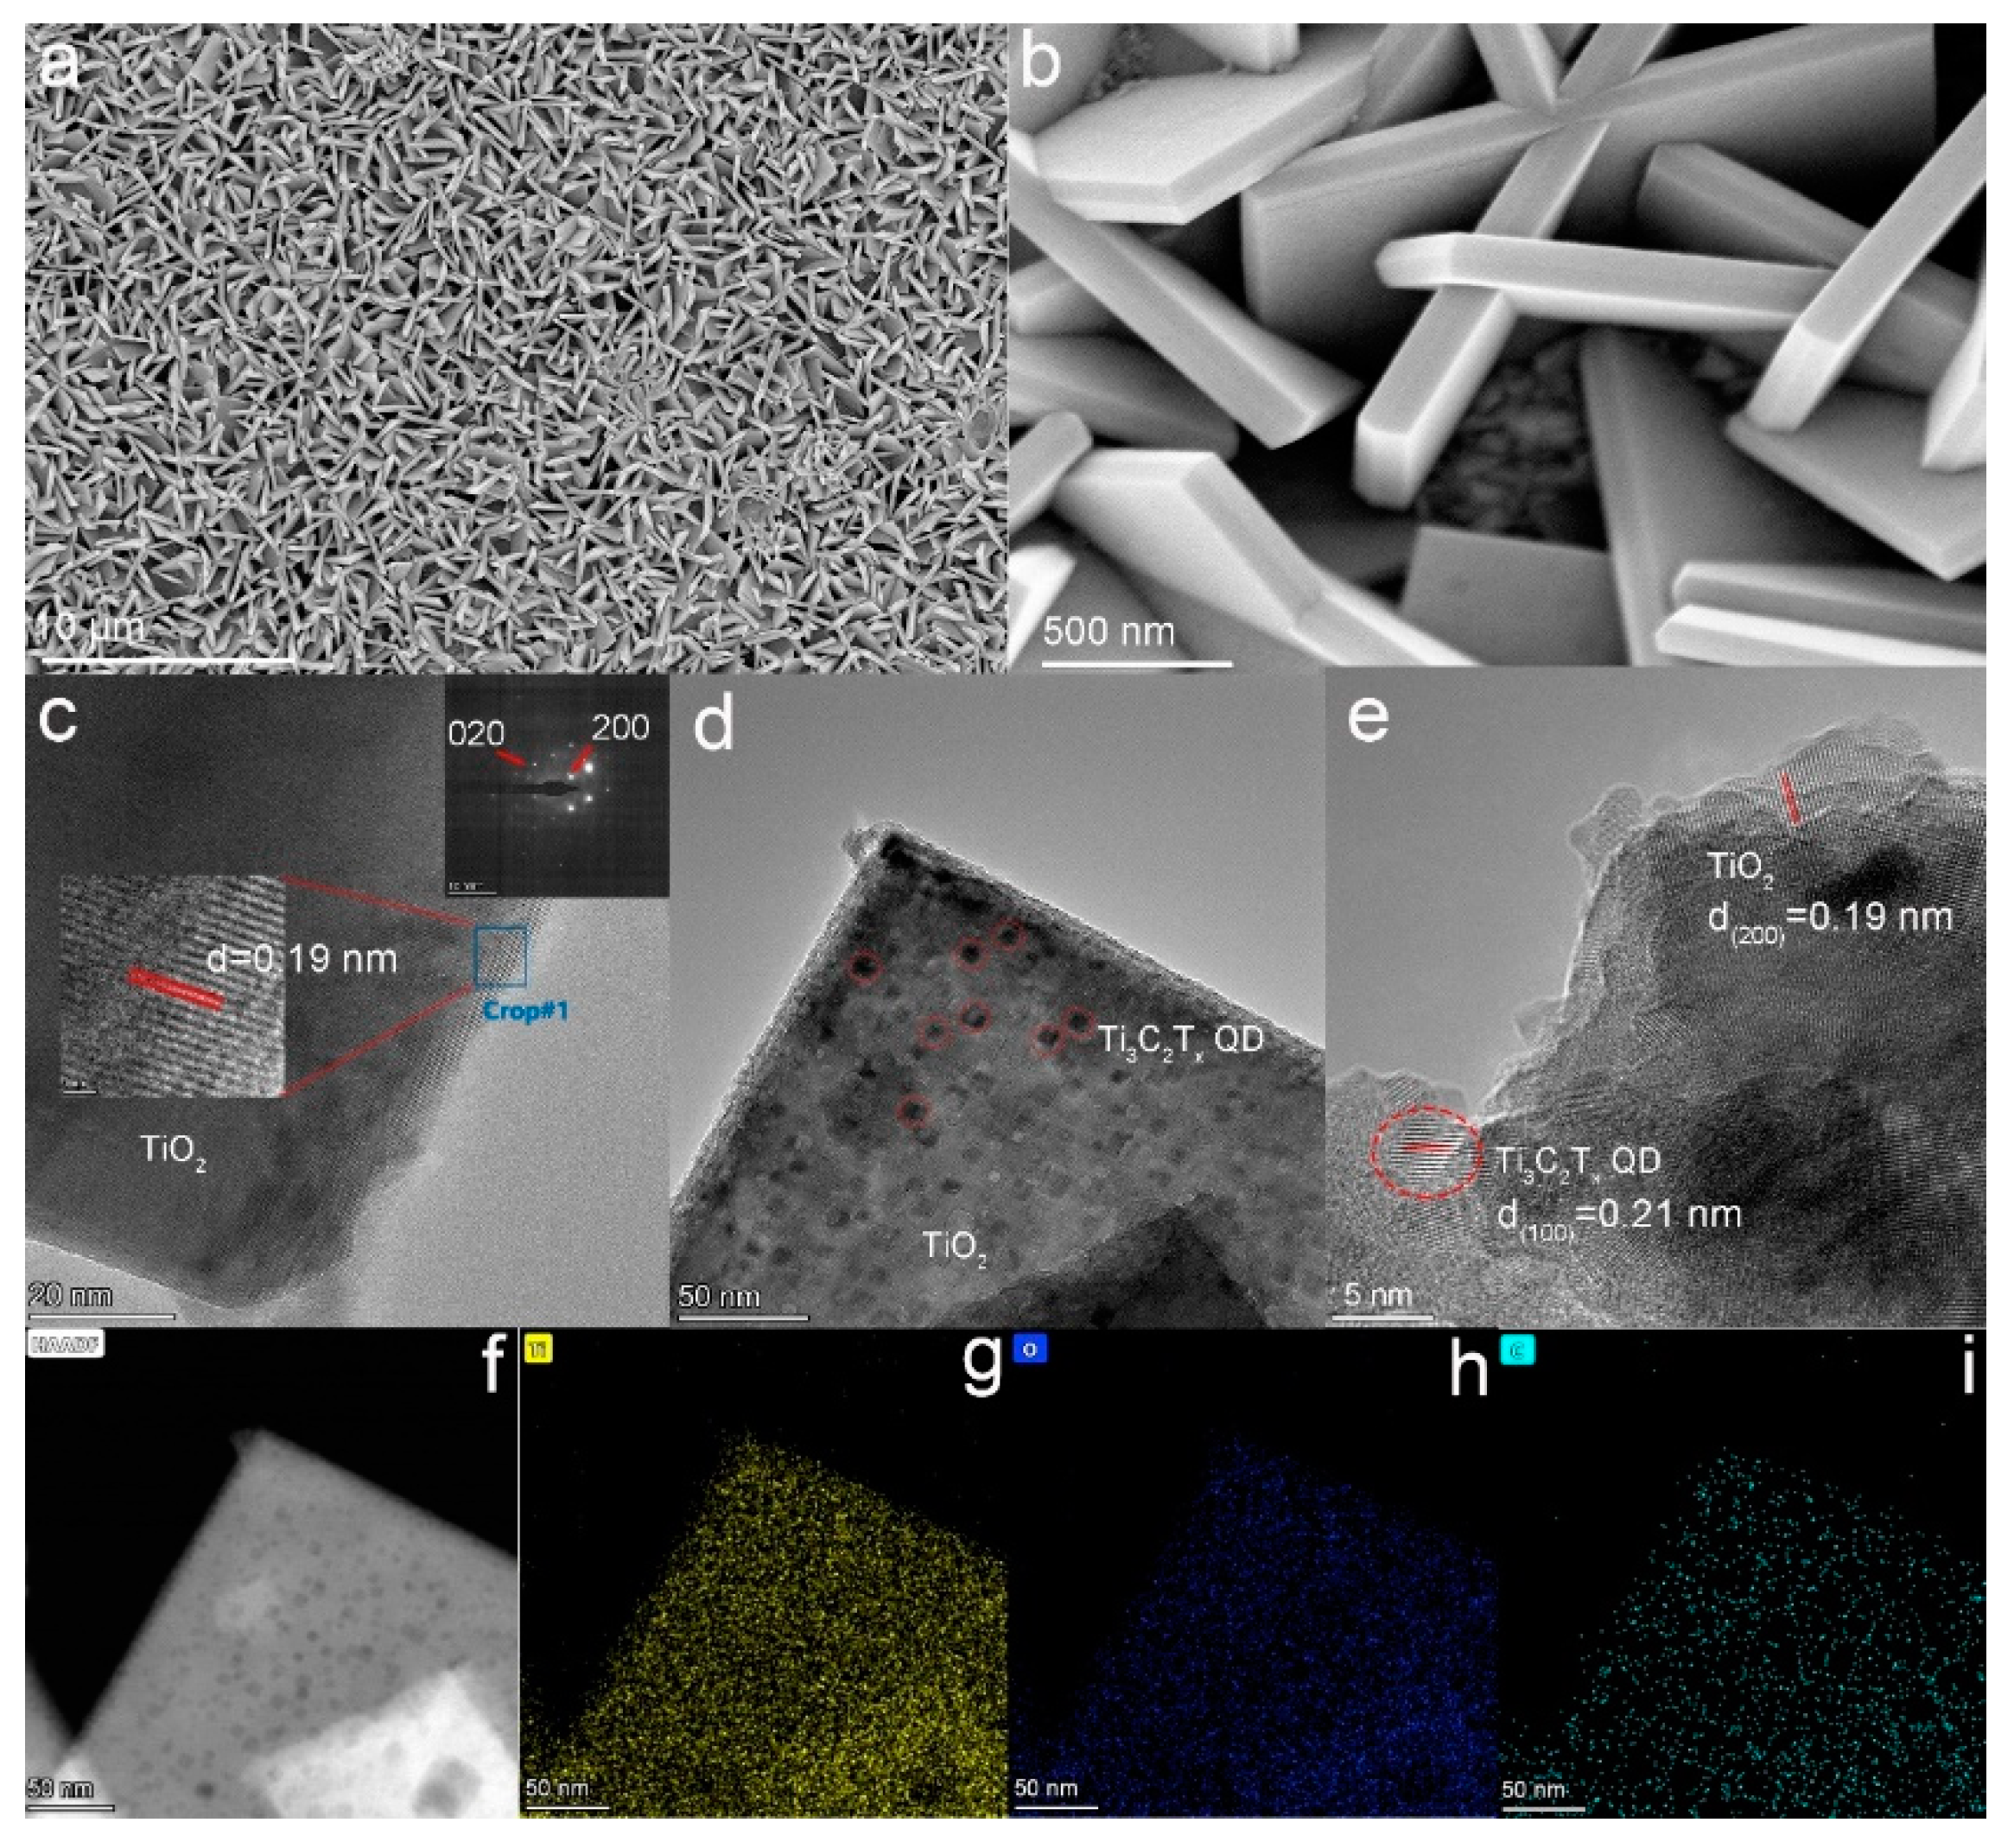
Atomic force microscopy was used to observe the topography and size of the quantum dots. From Figure S1, the average thickness of Ti3C2Tx QDs was about ~1.0 nm, indicating that they were mostly single layer. FESEM was used to study the morphology of the (001) TiO2 NSs. The TiO2 NSs with a side length of about 2 μm and a thickness of about 150 nm uniformly grew on the surface of FTO glass (Figure S2). The FESEM images of the Ti3C2Tx QDs/(001) TiO2 composite are provided in Figure 2a,b. Compared with pure TiO2 NSs, there were no significant changes in the morphology of the composite electrodes after loading with Ti3C2Tx QDs. Transmission electron microscopy (TEM) images were provided to characterize the crystal information of TiO2 NSs. The HRTEM image (Figure 2c insert, middle part) revealed (200) and (020) atomic planes with a lattice spacing of 0.19 nm and an interfacial angle of 90°. The bright, periodically arranged diffraction spots in selected-area electron diffraction (SAED, Figure 2c insert, top right-hand corner) patterns indicated that the TiO2 NSs prepared were a single crystal with excellent crystallinity [16]. Proofread with standard PDF cards, the main exposed crystal plane of TiO2 nanosheets was (001) [17]. The introduction of Ti3C2Tx QDs was further identified by TEM images. Compared with pure TiO2 NSs, many small scales (~10 nm) appeared on the Ti3C2Tx QDs/(001) TiO2 composite (Figure 2d). The HRTEM image of the Ti3C2Tx QDs/(001) TiO2 composite is presented in Figure 2e. The lattice fringes with widths of 0.19 and 0.21 nm can be assigned to the (200) plane of TiO2 and the (100) plane of Ti3C2Tx QDs. The elemental mapping dots of the Ti3C2Tx QDs/(001) TiO2 composite for Ti and O were dense and apparent (Figure 2f–i) because TiO2 was dominant in this composite, whereas those for C were relatively scarce and primarily found around the sheet edges, indicating that Ti3C2Tx QDs successfully combined with the (001) crystal plane of TiO2 NSs.
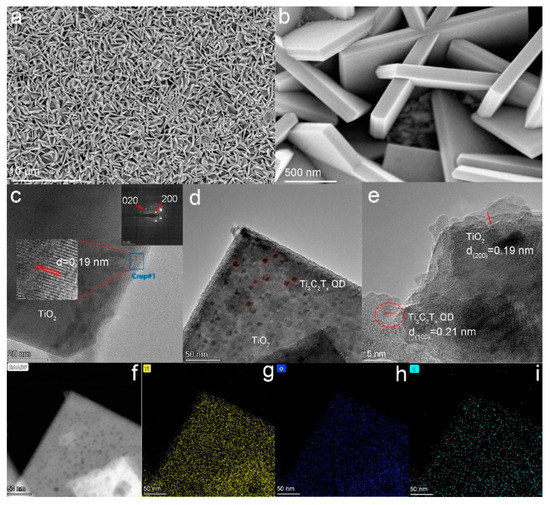
Figure 2.
(a,b) FESEM of Ti3C2Tx QDs/(001) TiO2; TEM of (c) (001) TiO2 inset (middle part, HRTEM image, top right-hand corner, SAED) and (d) Ti3C2Tx QDs/(001) TiO2; (e) HRTEM of Ti3C2Tx QDs/(001) TiO2; and (f–i) mapping of Ti3C2Tx QDs/(001) TiO2 ((g): Yellow, titanium; (h): blue, oxygen; (i): cyan, carbon).
3.3. Composition Characterization of Ti3C2Tx QDs/(001) TiO2/FTO Electrode
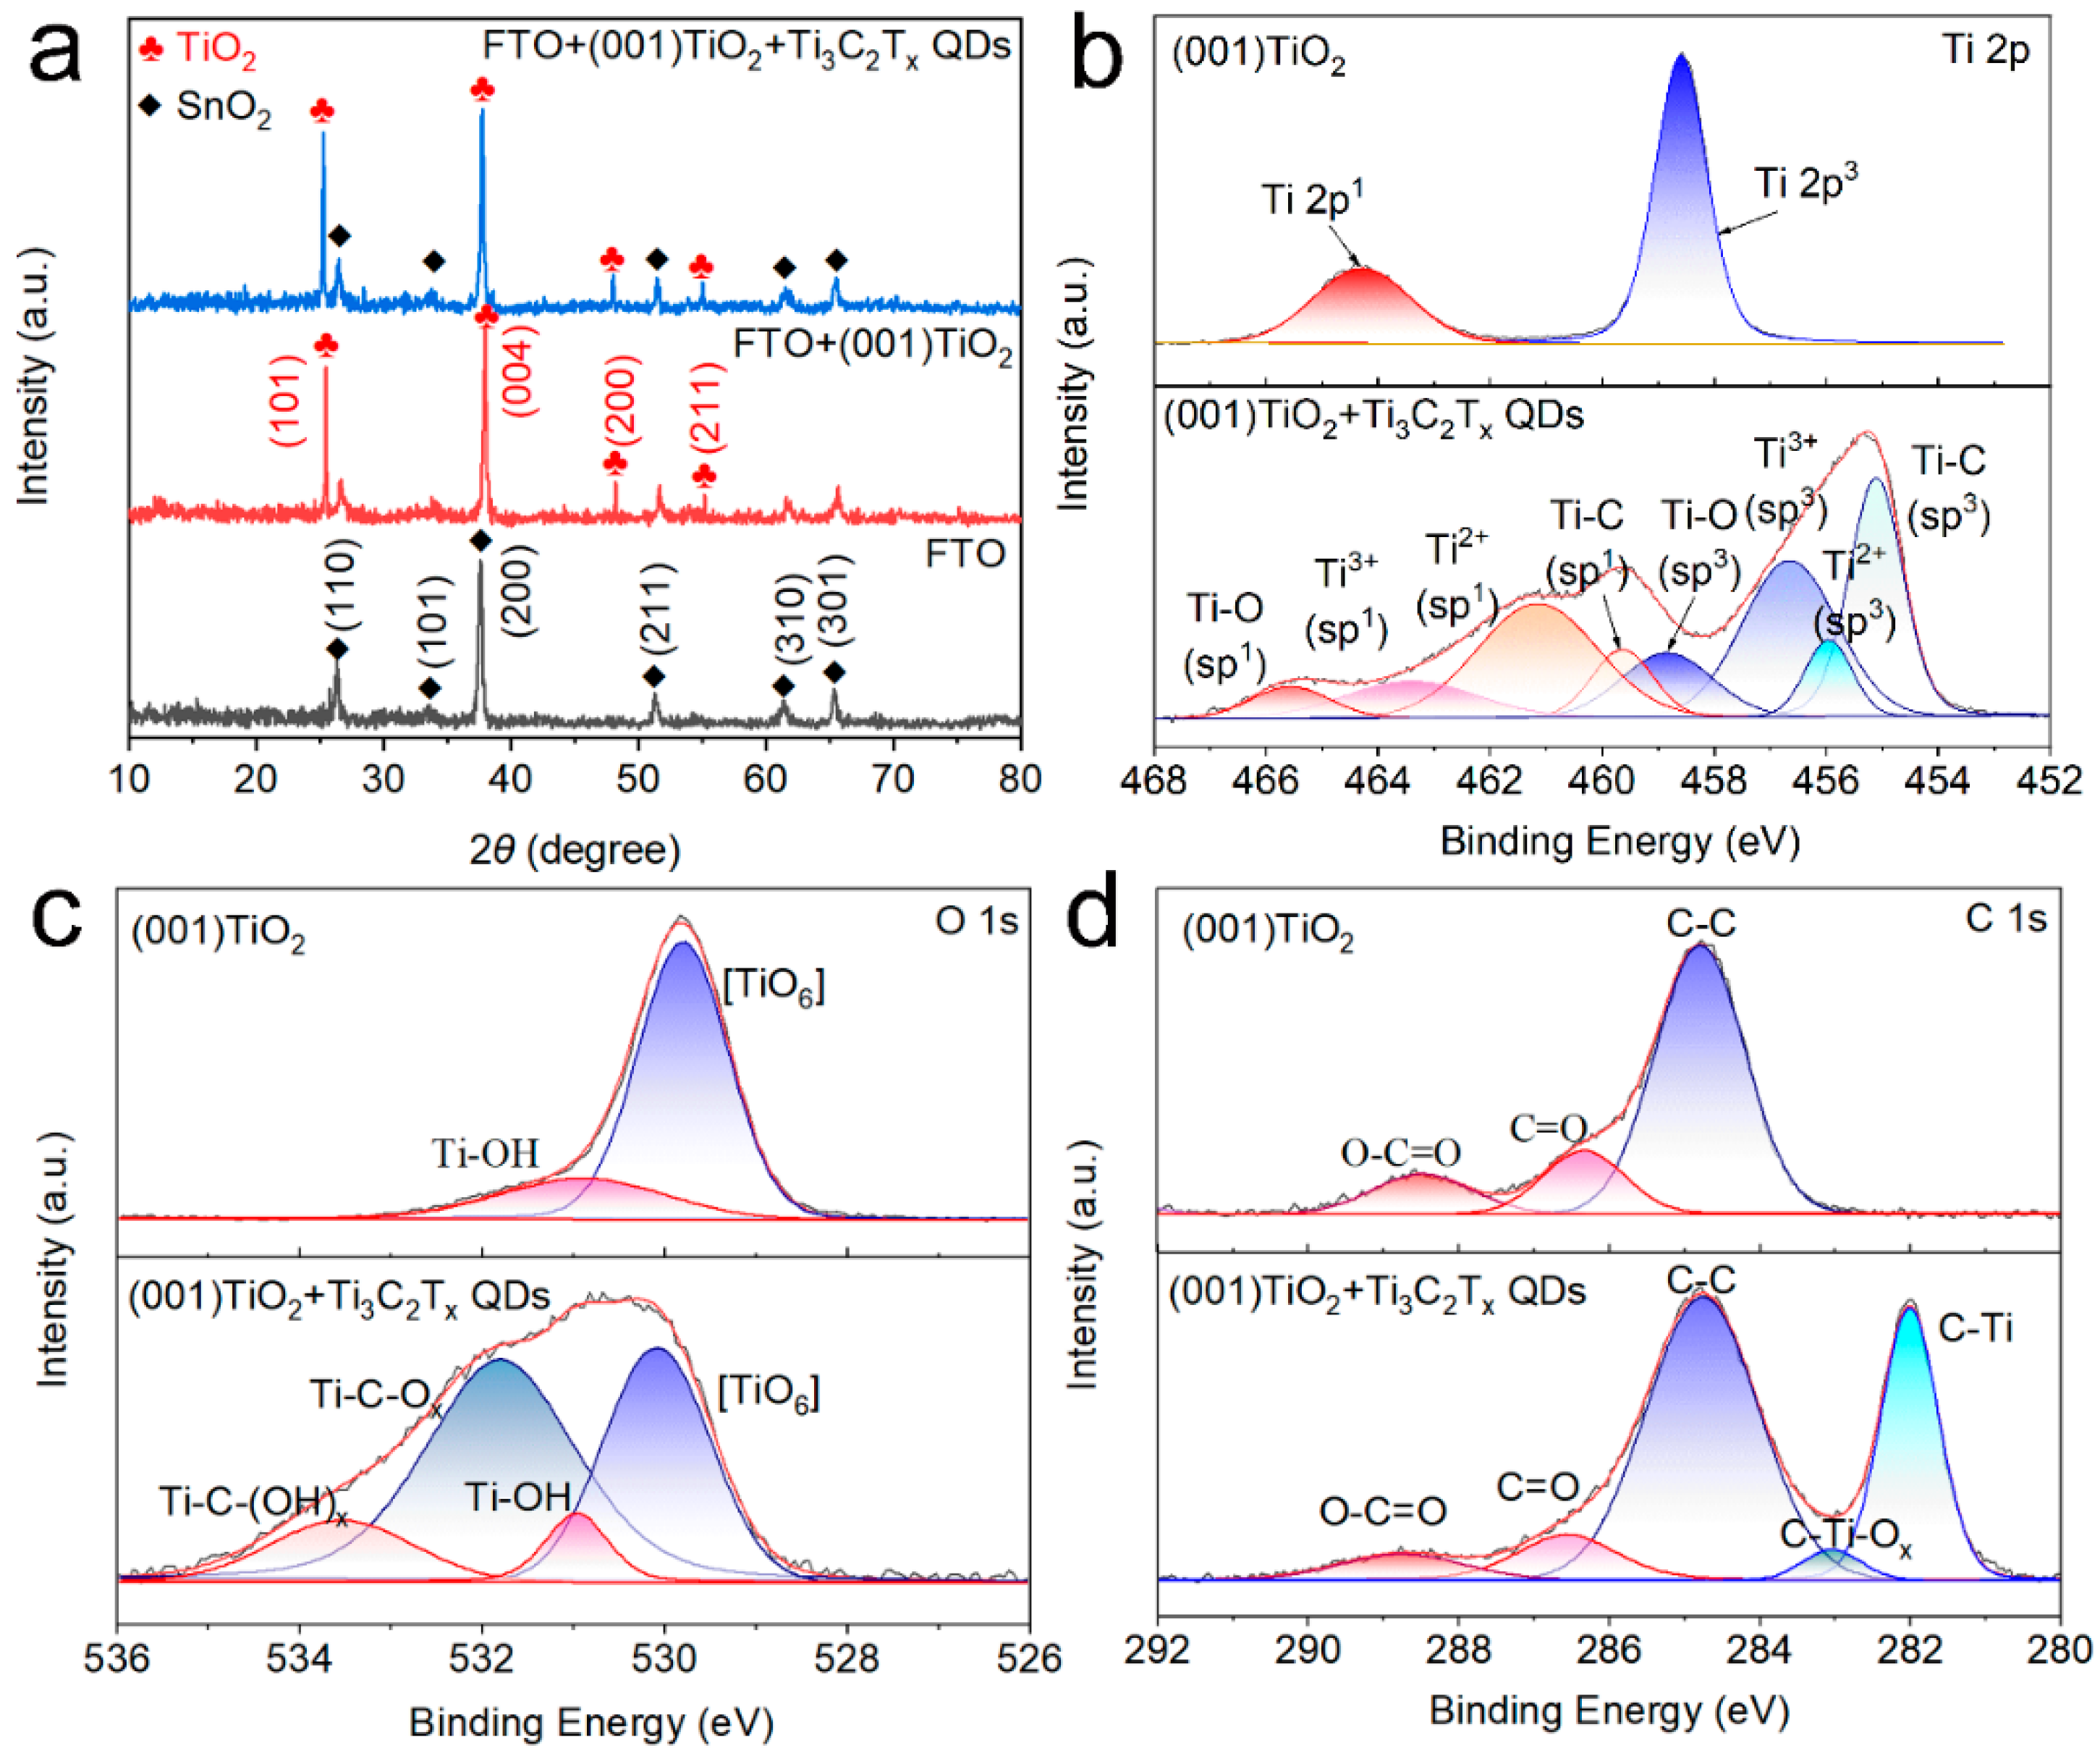
XRD pattern, Fourier transform infrared (FTIR) spectroscopy, and XPS analyses were performed for electrode composition characterization. The XRD results in Figure 3a indicated that FTO had peaks at 26.58°, 33.77°, 37.77°, 51.76°, and 65.19°, consistent with SnO2 (JCPDS No. 46-1088) [18]. Meanwhile, the TiO2 NS arrays had diffraction peaks at 25.28°, 37.80°, 48.05°, and 55.06°, assigned to the anatase TiO2 diffraction peaks (JCPDS No. 21-1276). No distinct characteristic diffraction peak of Ti3C2Tx QDs was found in the Ti3C2Tx QDs/(001) TiO2 sample, which was due to the low crystallinity and low content of the Ti3C2Tx QDs in the composites [19]. To further determine the functional group information of Ti3C2Tx QDs and TiO2, the Fourier transform infrared spectroscopy (FTIR) spectra of TiO2 NSs, Ti3C2Tx QDs, and Ti3C2Tx QDs/(001) TiO2 were presented in Figure S3. The (001) TiO2 composite film had some characteristic peaks at 3439, 1633, 1380, and 1110 cm−1, which were assigned to surface hydroxyl groups and adsorbed oxygen. Compared with pure TiO2, two new peaks emerged at 561 and 613 cm−1 after self-assembly, and they can be assigned to Ti-C and Ti–O, respectively [20].
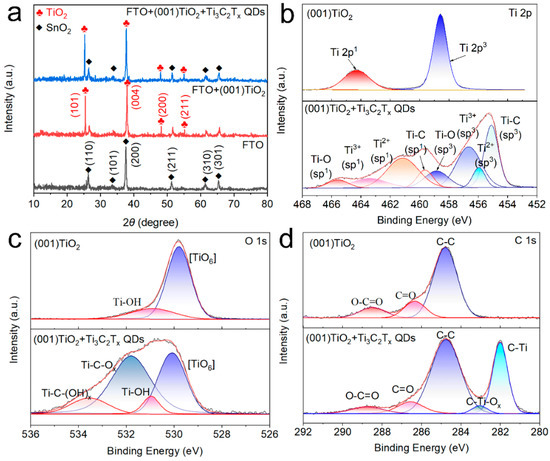
Figure 3.
(a) X-ray diffraction (XRD) pattern of FTO glass, (001) TiO2 and Ti3C2Tx QDs/(001) TiO2 and X-ray photoelectron spectroscopy (XPS) results of (b) Ti 2p, (c) O 1s, and (d) C 1s orbital of (001) TiO2 and Ti3C2Tx QDs/(001) TiO2.
The chemical bonding and functional groups of (001) TiO2 and Ti3C2Tx QDs/(001) TiO2 composite were also investigated by XPS spectrum. In Figure 3b, the high-resolution spectrum of Ti 2p of (001) TiO2 revealed two peak components at 458.8 eV (2p3/2) and 464.4 eV (2p1/2). After loading Ti3C2Tx QDs, the peak components of Ti 2p3/2 and 2p1/2 centered from low binding energy to high binding energy were attributed to the Ti-C, Ti-X from substoichiometric TiCx (x < 1) or Ti3AlC2, Ti2+ ions and Ti4+ ions, respectively [21]. The spectrum of O 1s had two peaks located at 530.98 and 529.83 eV (Figure 3c), which were assigned to the Ti–OH species and the lattice oxygen [Ti–O6] species. As for the O 1s XPS spectra after Ti3C2Tx QDs were loaded, two new peaks were found at 531.78 and 533.58 eV, ascribed to the Ti-C–OH and Ti-C–O species, demonstrating the surface groups of Ti3C2Tx QDs were O and −OH [22]. The C 1s of (001) TiO2 can be divided into three characteristic peak components located at 288.4 eV, 286.5 eV, and 284.7 eV, which can be assigned to O-C=O, C=O, and C-C. Compared with pure TiO2, the introduction of Ti3C2Tx QDs led to the appearance of two new characteristic peaks. The characteristic peak at 282.3 can be assigned to the Ti-C inside the Ti3C2Tx QDs. Interestingly, compared with (001) TiO2 composite, a new component appeared at 283.03 eV after the self-assembly process, which could be assigned to the C−Ti−Ox bonding at the interfaces between Ti3C2Tx QDs and (001) TiO2 (Figure 3d) [23]. We believe that the O and –OH on the surface of Ti3C2Tx may act as rivet sites to connect to the five coordinated titanium atoms in (001) of TiO2 and form an atomic-scale interfacial heterojunction between 0D Ti3C2Tx QDs and 2D TiO2 NSs.
3.4. PEC Performance Characterization of Ti3C2Tx QDs/(001) TiO2/FTO Electrode
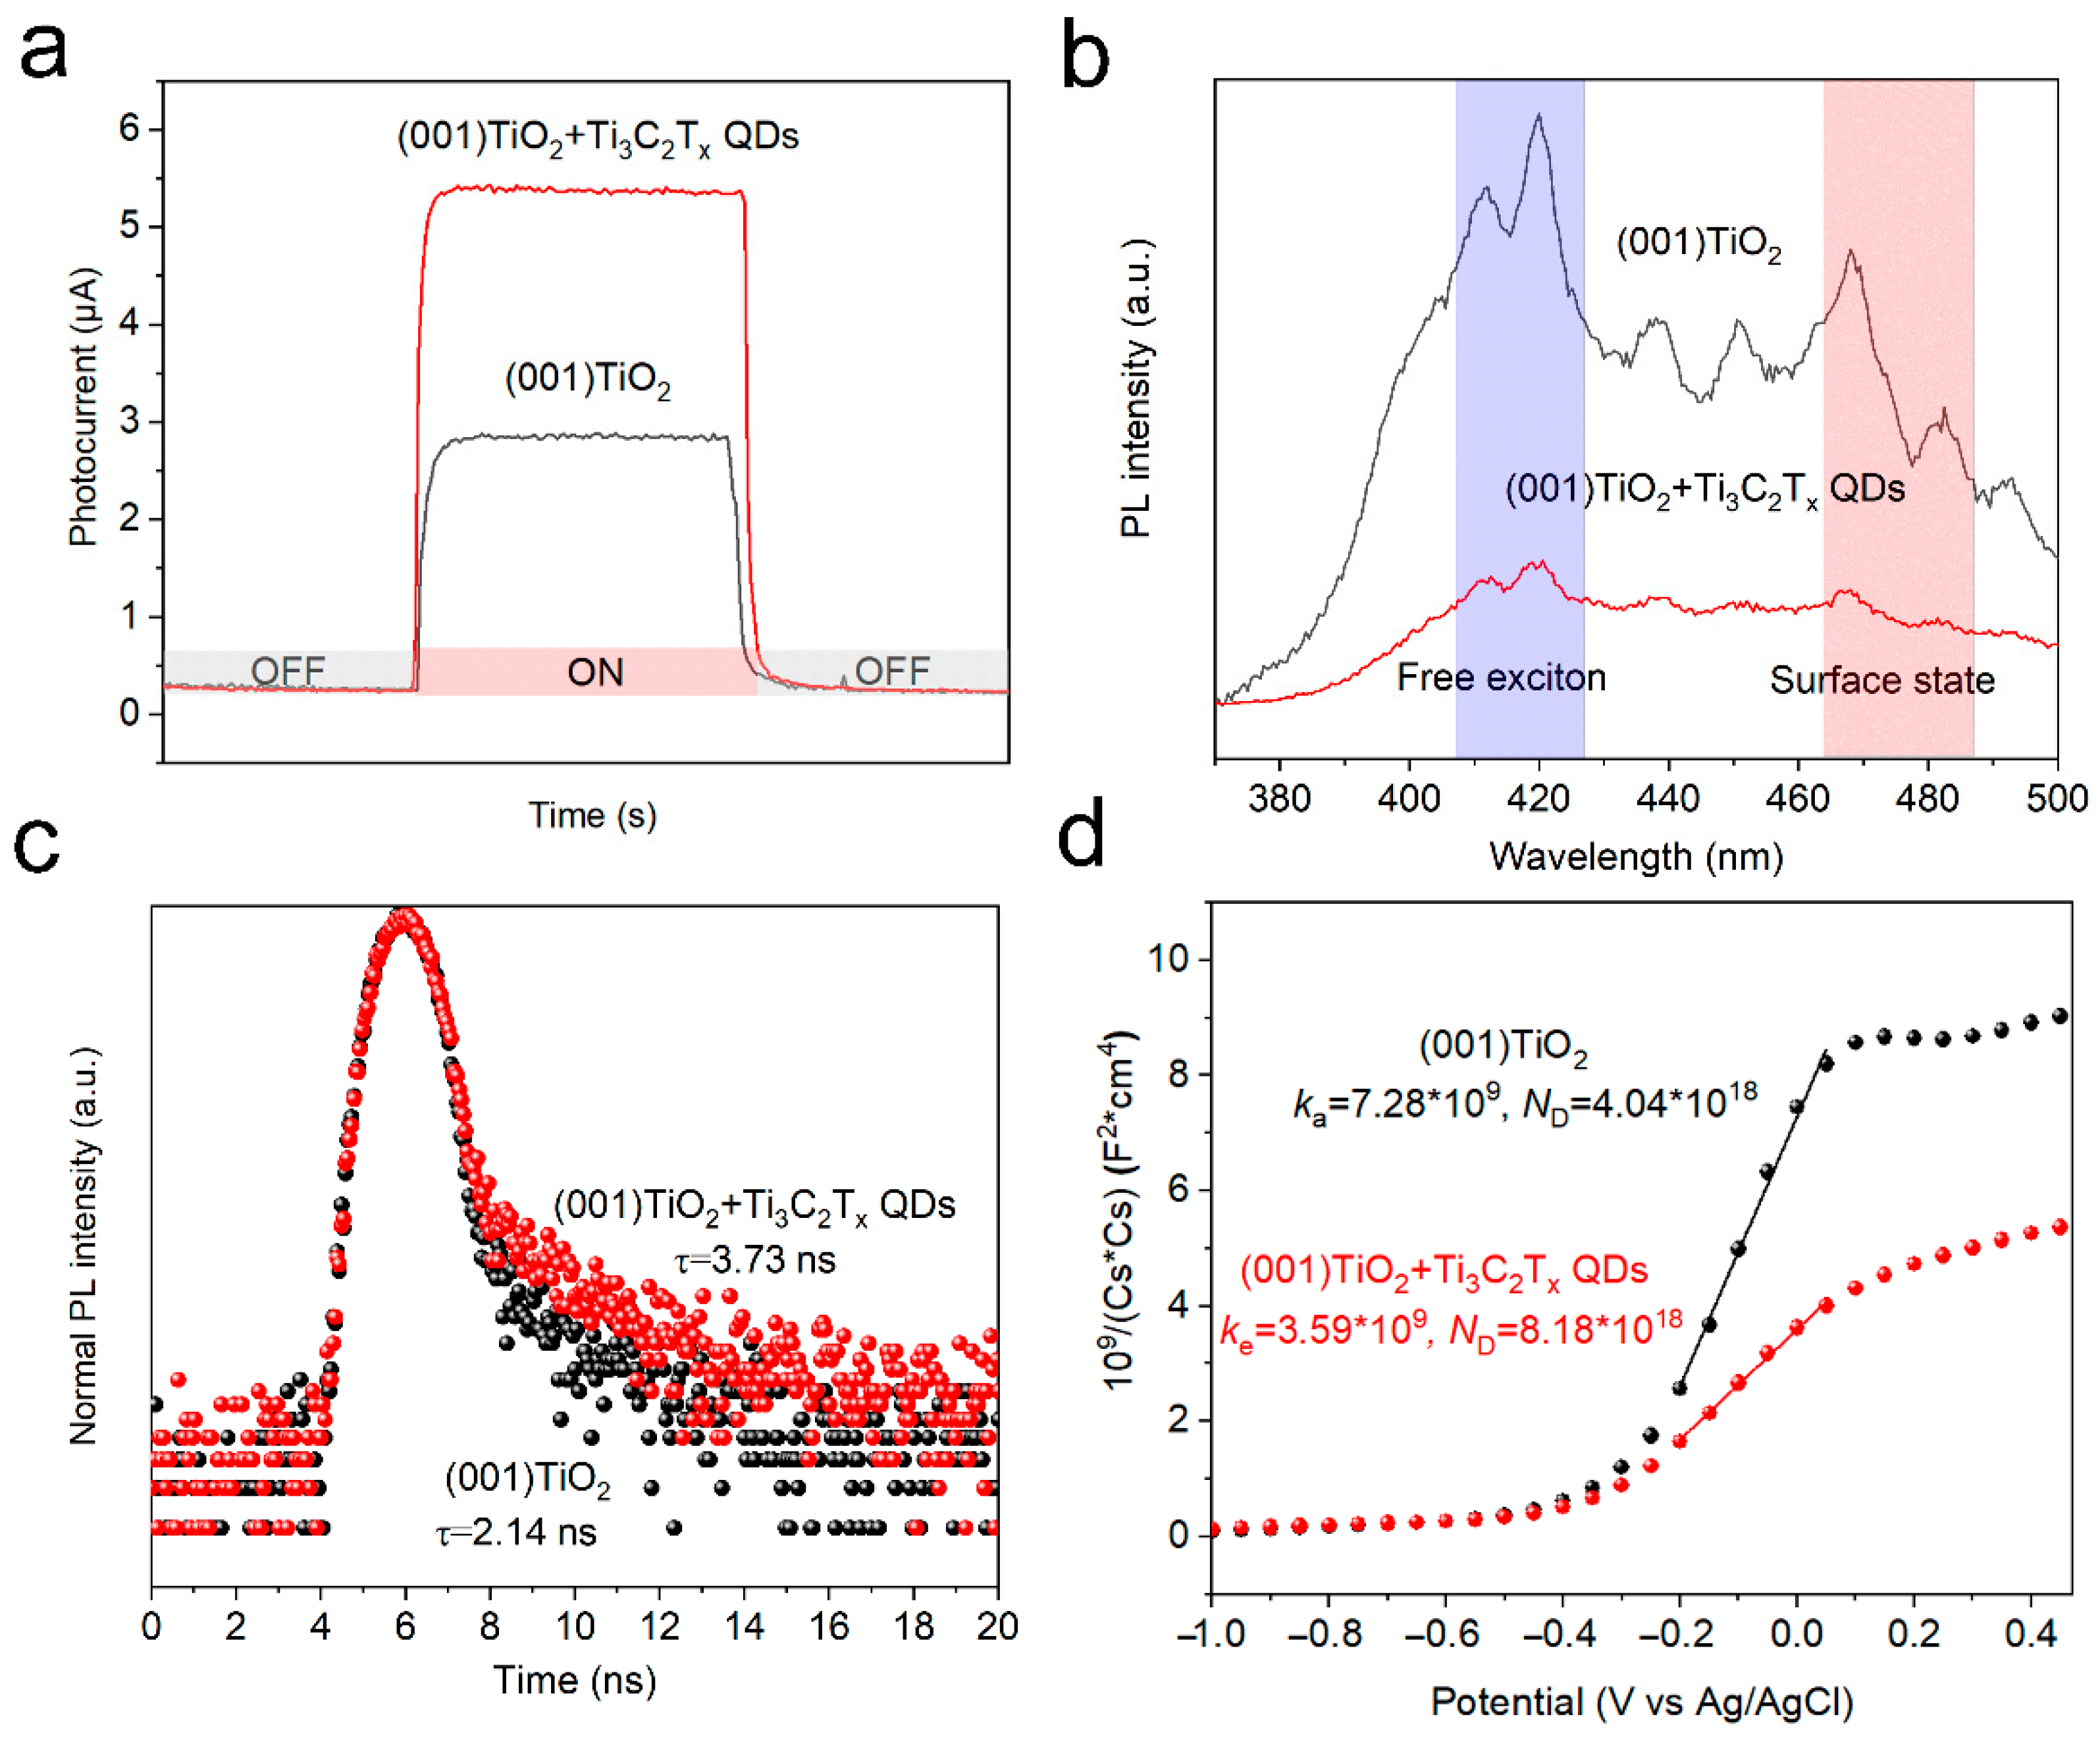
To evaluate the catalytic ability of the materials to catalyze AA, time-resolved current response curves were obtained in an aqueous O2-saturated PBS solution containing AA (0.1 M) under light irradiation (365 nm). In Figure 4a, the photoelectric response of TiO2 NSs significantly improved after loading Ti3C2Tx QDs. To explain the enhanced catalytic ability, the photoelectric properties of the catalysts were evaluated. Photoluminescence (PL) spectra were also obtained to reveal the recombination efficiency of the carriers. In general, fluorescence emission at 420 nm represents the recombination of free excitons inside a material, whereas fluorescence emission at 480 nm represents surface state-trapping recombination [18]. Compared with TiO2 NSs, the emission intensity of Ti3C2Tx QDs/(001) TiO2 electrodes significantly decreased in both ranges (Figure 4b). The reduced recombination rate of photogenerated carriers could supply sufficient holes to activate –OH on Ti3C2Tx QDs, thereby significantly promoting the formation of reactive species (·OH) during the photocatalytic redox reaction. Time-resolved photoluminescence (TRPL) spectroscopy was performed to survey the lifetime of the electrons in (001) TiO2 and Ti3C2Tx QDs/(001) TiO2 electrodes. The average lifetime (τave) for the (001) TiO2 and Ti3C2Tx QDs/(001) TiO2 electrodes was 2.14 ns and 3.73 ns (Figure 4c). The carrier density of the electrodes was also investigated by the Mott–Schottky Equation (1) [23].
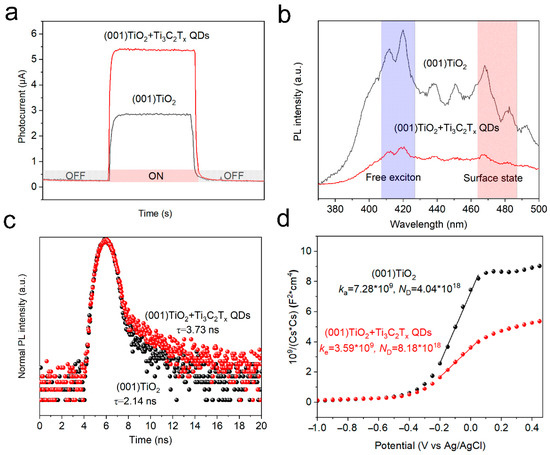
Figure 4.
(a) Time-resolved current response curves, (b) Photoluminescence (PL) spectroscopy, (c) Time-resolved photoluminescence (TRPL) emission spectroscopy spectra, and (d) Mott–Schottky plot of pristine (001) TiO2 and Ti3C2Tx QDs/(001) TiO2 electrode.
The carrier density can be obtained from the slope of the linear region of the Mott–Schottky plots (Figure 4d) on the basis of Equation (2).
where is the electron density, e is the element charge value, ε is the dielectric constant (48 for anatase), ε0 is the vacuum permittivity, C is the space charge capacitance, and US is the applied potential. The calculated ND for the (001) TiO2 and Ti3C2Tx QDs/(001) TiO2 electrodes were 4.04 × 10¹⁸ and 8.18 × 10¹⁸, respectively. The photoelectric property tests implied that the introduction of Ti3C2Tx QDs could reduce the recombination rate, prolong the lifetime, and increase the density of the carriers in the electrode, thereby improving the catalytic ability of the electrode.
3.5. Electron Transfer Mechanism of Ti3C2Tx QDs/(001) TiO2/FTO Electrode
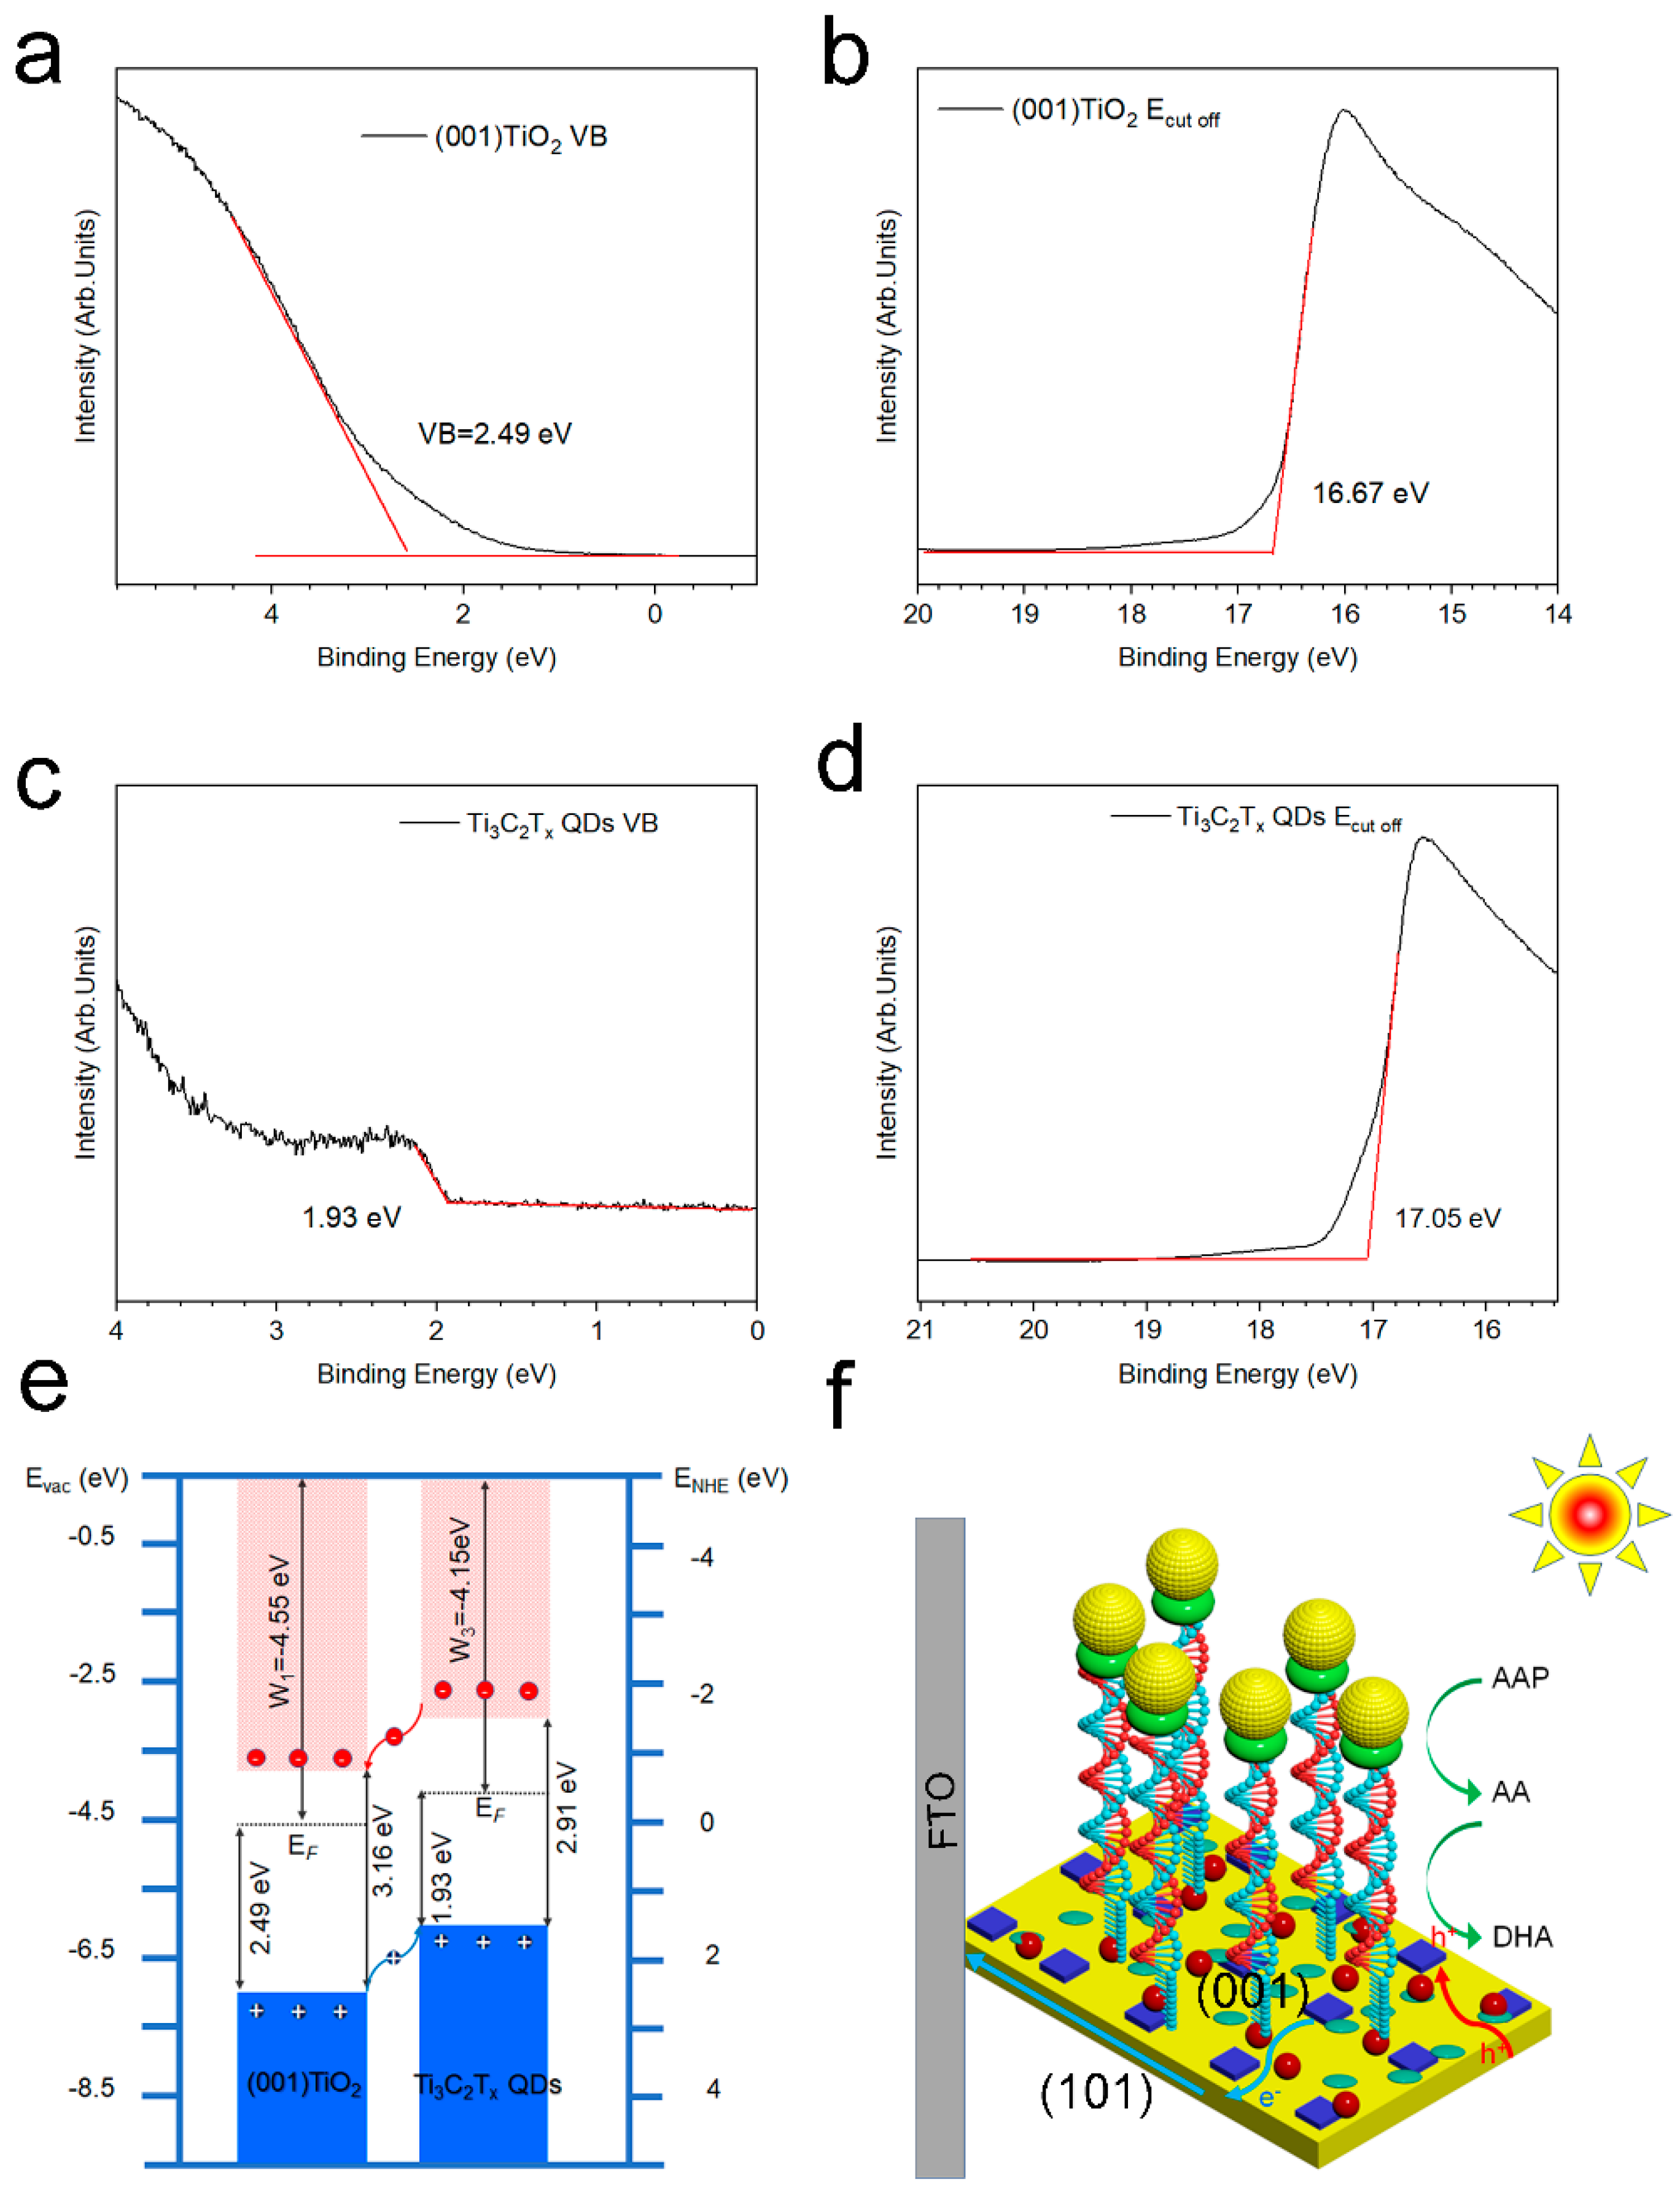
Ultraviolet–visible diffuse reflection spectrum (UV-vis DRS) and ultraviolet photoelectron spectroscopy (UPS) were combined to study the band structure and interface electron states of Ti3C2Tx QDs and (001) TiO2 (Figure 5a–d). Figure S4 depicts the optical bandgap (Eg) of the (001) TiO2 and Ti3C2Tx QDs, as derived from the Tauc Equation (3).
where α is the absorption coefficient, h is the Planck constant, ν is the photon frequency, n = 1/2 is the indirect bandgap semiconductors, A is a constant, and Eg is the bandgap. The bandgaps of (001) TiO2, Ti3C2Tx QDs were obtained as 3.16 and 2.91 eV, respectively. The cutoff energies (Ecut off) of (001) TiO2 and Ti3C2Tx QDs were obtained as 16.67 (Figure 5b) and 17.05 eV (Figure 5d) from the UPS spectra. Their work functions (W) were calculated to be 4.55 and 4.15 eV, respectively. The valence band maximum (VBM) of (001) TiO2 and Ti3C2Tx QDs were determined from the binding energy onset as 2.49 (Figure 5a) and 1.93 eV (Figure 5c), which were −7.04 and −6.08 eV. The conduction band minimum (CBM) positions were -3.88 and −2.77 eV, which is the VBM plus the optical bandgap.
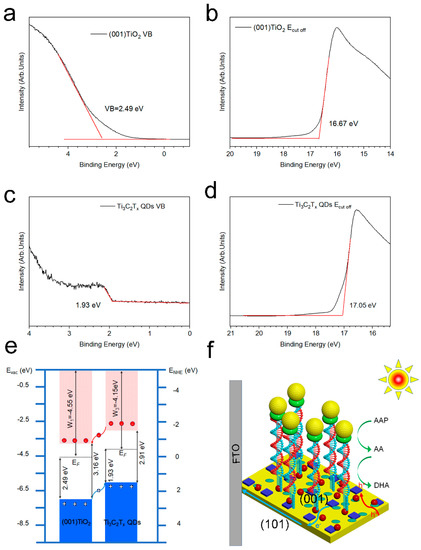
Figure 5.
Ultraviolet photoelectron spectra: valence band spectra of (a) (001) TiO2 and (b)Ti3C2Tx QDs, cutoff energies spectra of (c) (001) TiO2 and (d)Ti3C2Tx QDs (e) band structure of (001) TiO2 and Ti3C2Tx QDs, and (f) schematic of electrode electron transfer.
The band structures and schematic of electrode electron transfer of (001) TiO2 and Ti3C2Tx QDs are shown in Figure 5e,f. A type Ⅱ heterojunction was built between TiO2 and Ti3C2Tx QDs (Figure 5e). Because the CBM and VBM of Ti3C2Tx QDs were more positive than those of (001) TiO2, the photogenerated electrons from the conduction band (CB) of Ti3C2Tx QDs flowed to the CB of (001) TiO2 due to the lower energy level (Figure 5f). Given that the single crystalline (001) TiO2 were grown in situ on conductive substrate, the photogenerated electrons on the (001) plane were rapidly transferred to the FTO electrode. These electrons would flow to the counter electrode. As for the hole in the valance band (VB) of (001) TiO2, it will be injected to the VB of Ti3C2Tx QDs to oxidize the (–OH) groups on the Ti3C2Tx QD surface into ·OH free radicals (–OH+ h+ (hv) →⋅OH). These surface hydroxyl radicals can be regarded as the active species, thereby greatly improving the photocatalytic ability of the material. When the recognition process is completed, the ALP on the electrode surface converts Ascorbic acid-2-phosphate (AAP) into electron donor AA, and these active species can catalyze the oxidation of AA to generate dehydroascorbic acid (DHA) and generate photocurrent at the same time.
3.6. MicroRNA-155 Analytical Performance
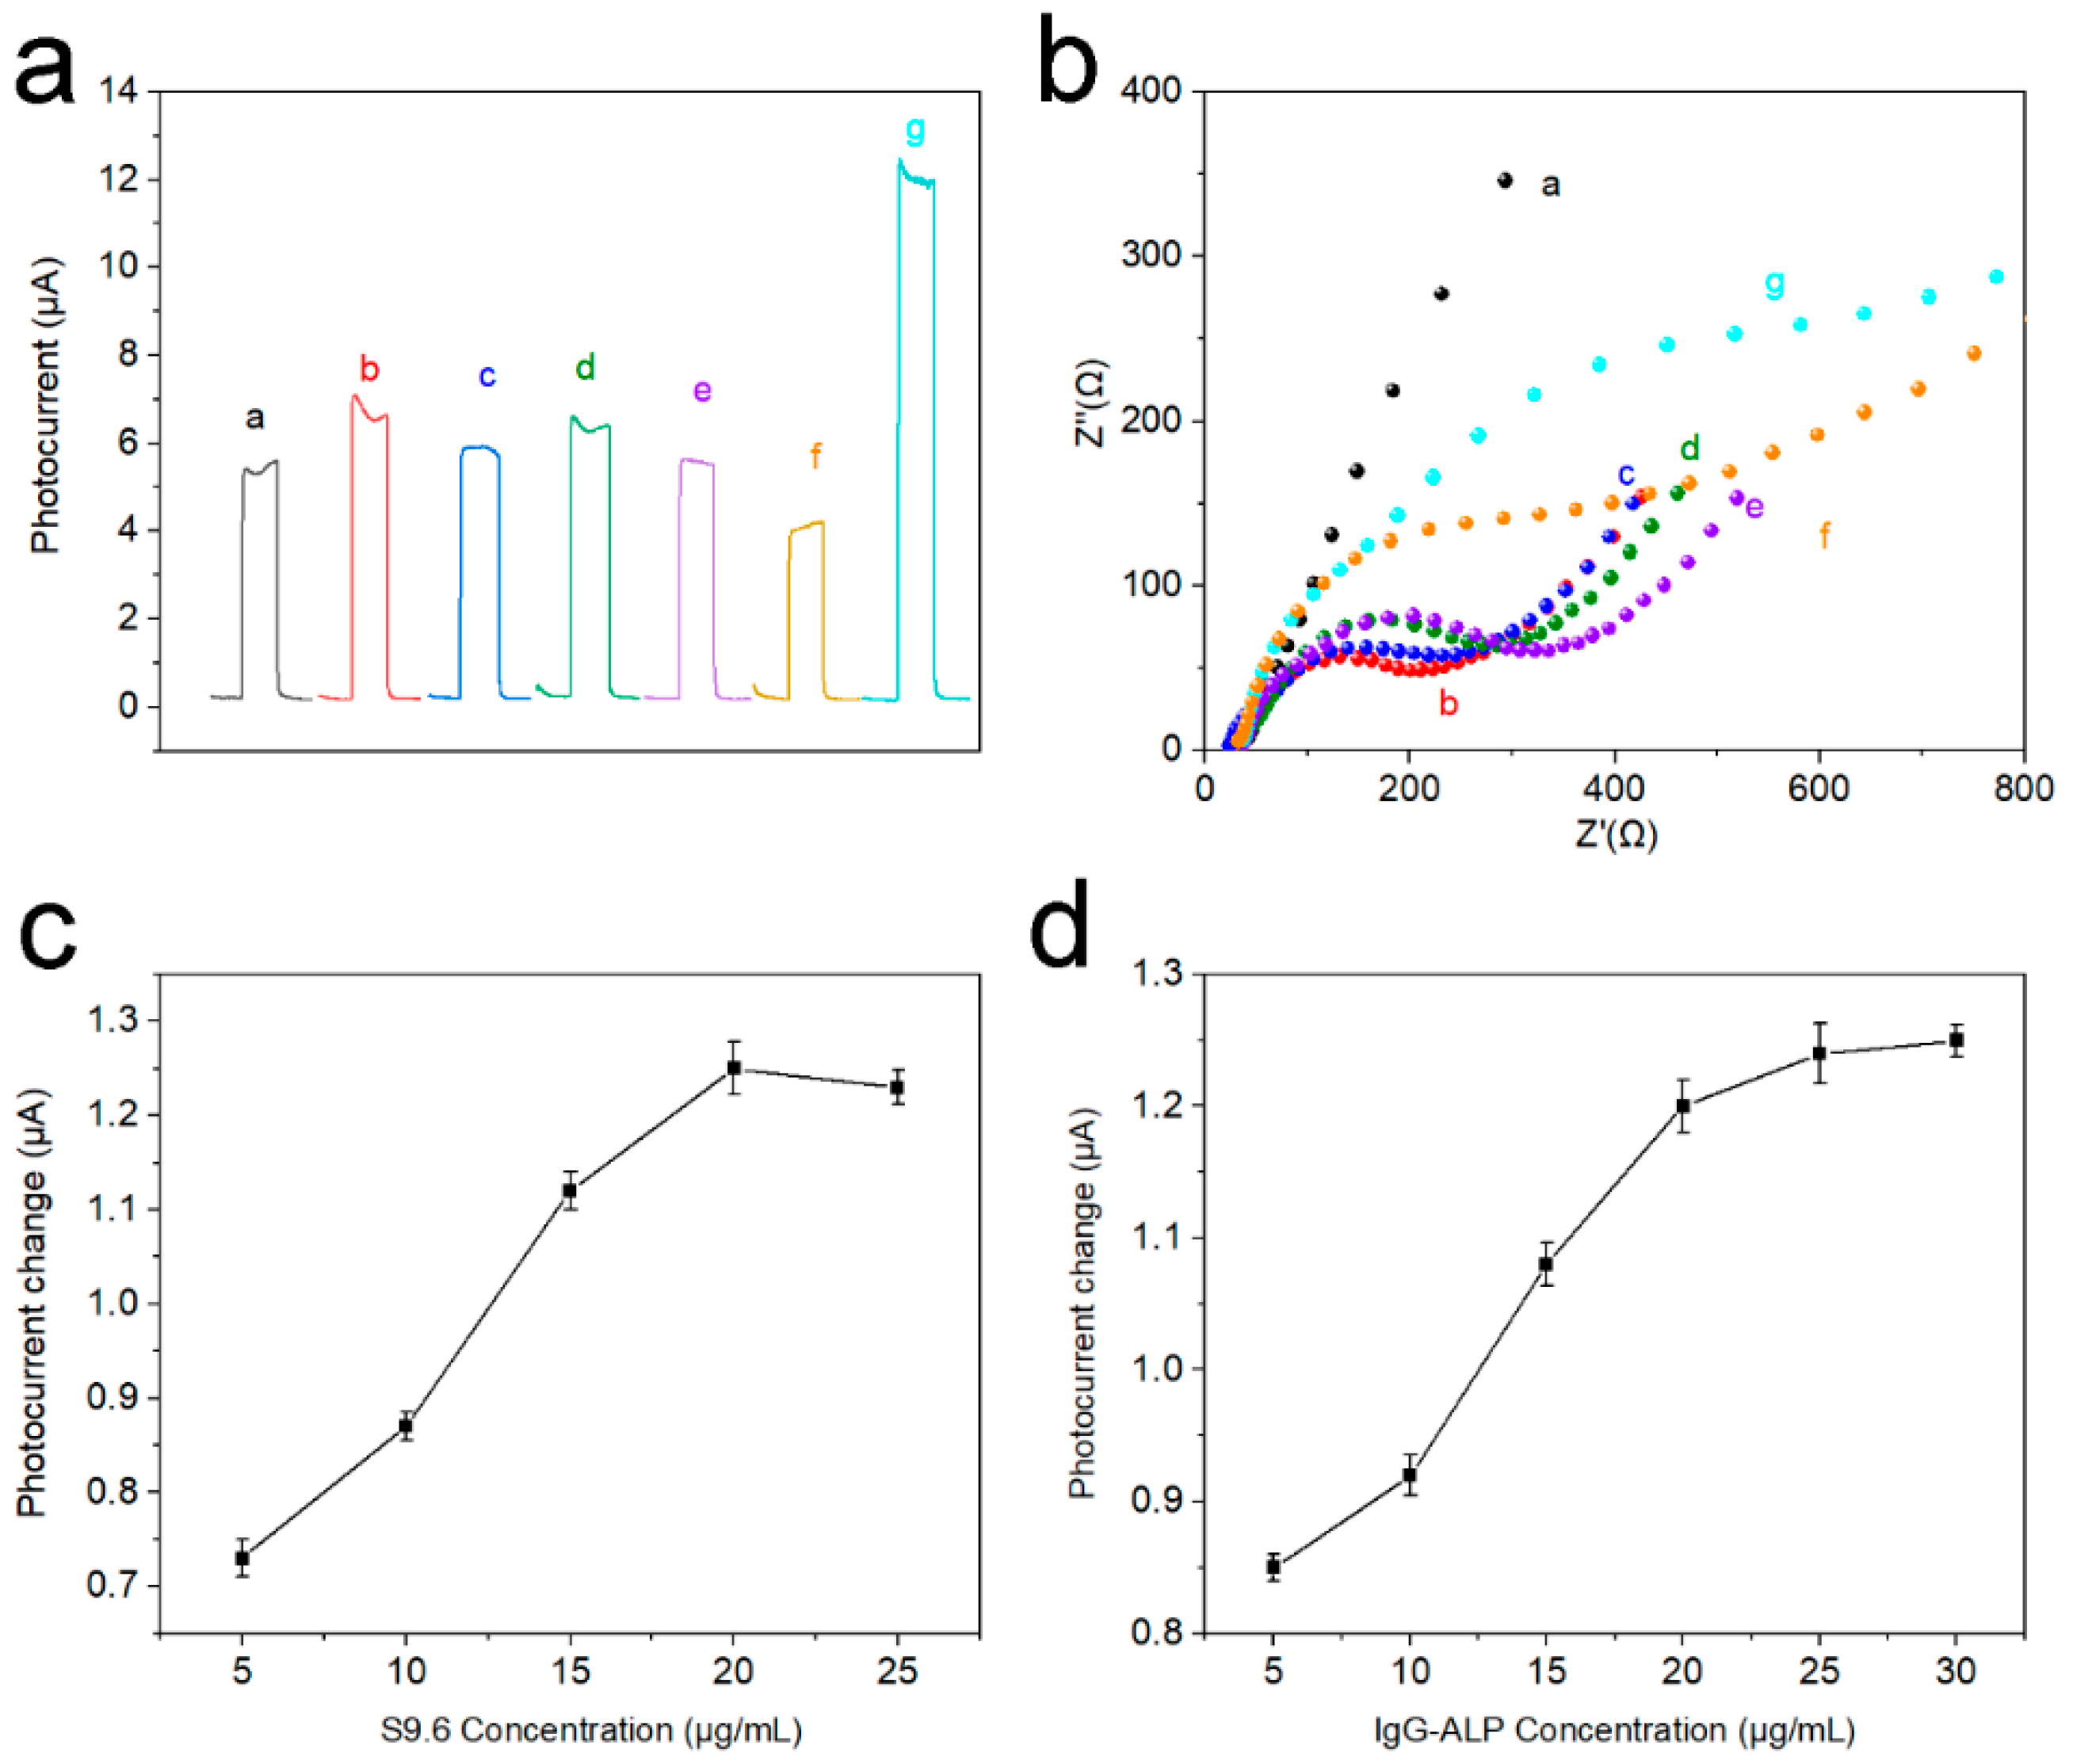
The PEC response current of stepwise modified electrodes was presented to corroborate the electrode modification process. In Figure 6a, a stable PEC response was obtained after Ti3C2Tx QDs were coated on the (001) TiO2 NSs substrate (curve a). Afterward, the PEC response was further raised after Au NPs were loaded, probably due to the good conductivity of Au NPs (curve b). The PEC response current of electrodes dropped gradually with the introduction of probe DNA, MCH, microRNA-155, and S9.6 antibody (curve c-f). This may be due to the poor electrical conductivity of nucleic acid and protein structures. However, when IgG-ALP was introduced into the system, the photoelectric response current of the electrode greatly improved (curve g). This is because the alkaline phosphatase can catalyze AAP to generate electron donor AA to enhance the photoelectric response. Figure 6b illustrates the EIS spectra of stepwise modified electrodes. The Ti3C2Tx QDs/(001) TiO2 electrode shows a semicircle (curve a) in the high-frequency region relating to the electron transfer resistance. Then, the electron transfer resistance decreased significantly when AuNPs were loaded (curve b). However, the electron transfer resistance increased continuously after probe DNA immobilization (curve c), MCH blocking (curve d), and hybridization with microRNA-155 (curve e). This could be due to the electrostatic repulsion between the negative ions (phosphate and acetate) and the redox probe of Fe(CN)63−/4−. Electron transfer resistance further successively increased after the electrodes were incubated with S9.6 (curve f) and IgG-ALP (curve g) because of the insulativity of the protein structure. To explore the impact of the concentration of S9.6 and ALP-IgG, a concentration parameter adjustment experiment was performed in Figure 6c,d. It can be seen that the change of the response current also increases with the increase in the concentration. When the concentration of S9.6 reaches 20 μg/mL, and the concentration of ALP-IgG reaches 25 μg/mL, the current change reaches the maximum.
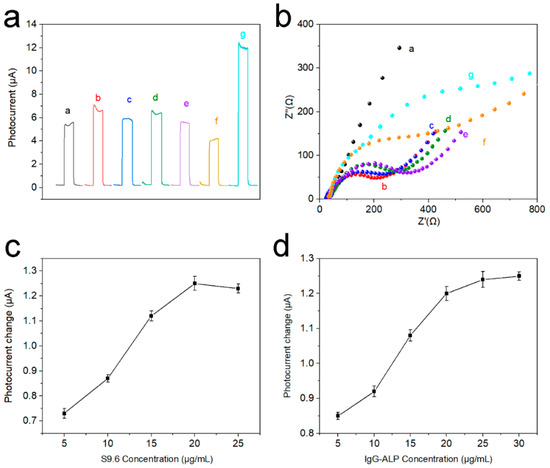
Figure 6.
(a) Photocurrent response in detection buffer and (b) EIS plot in 5.0 mM Fe(CN)63−/4− solution of different electrodes: curve a, Ti3C2Tx QDs/(001) TiO2/FTO; curve b, after dropping AuNPs; curve c, after probe DNA loading; curve d, after incubation with MCH; curve e, after incubation with 1 nM microRNA-155; curve f, after incubation with antibody; curve g, incubation with IgG-ALP, (c) the change of the response current with different concentrations of S9.6 and (d) the change of the response current with different concentrations of IgG-ALP.
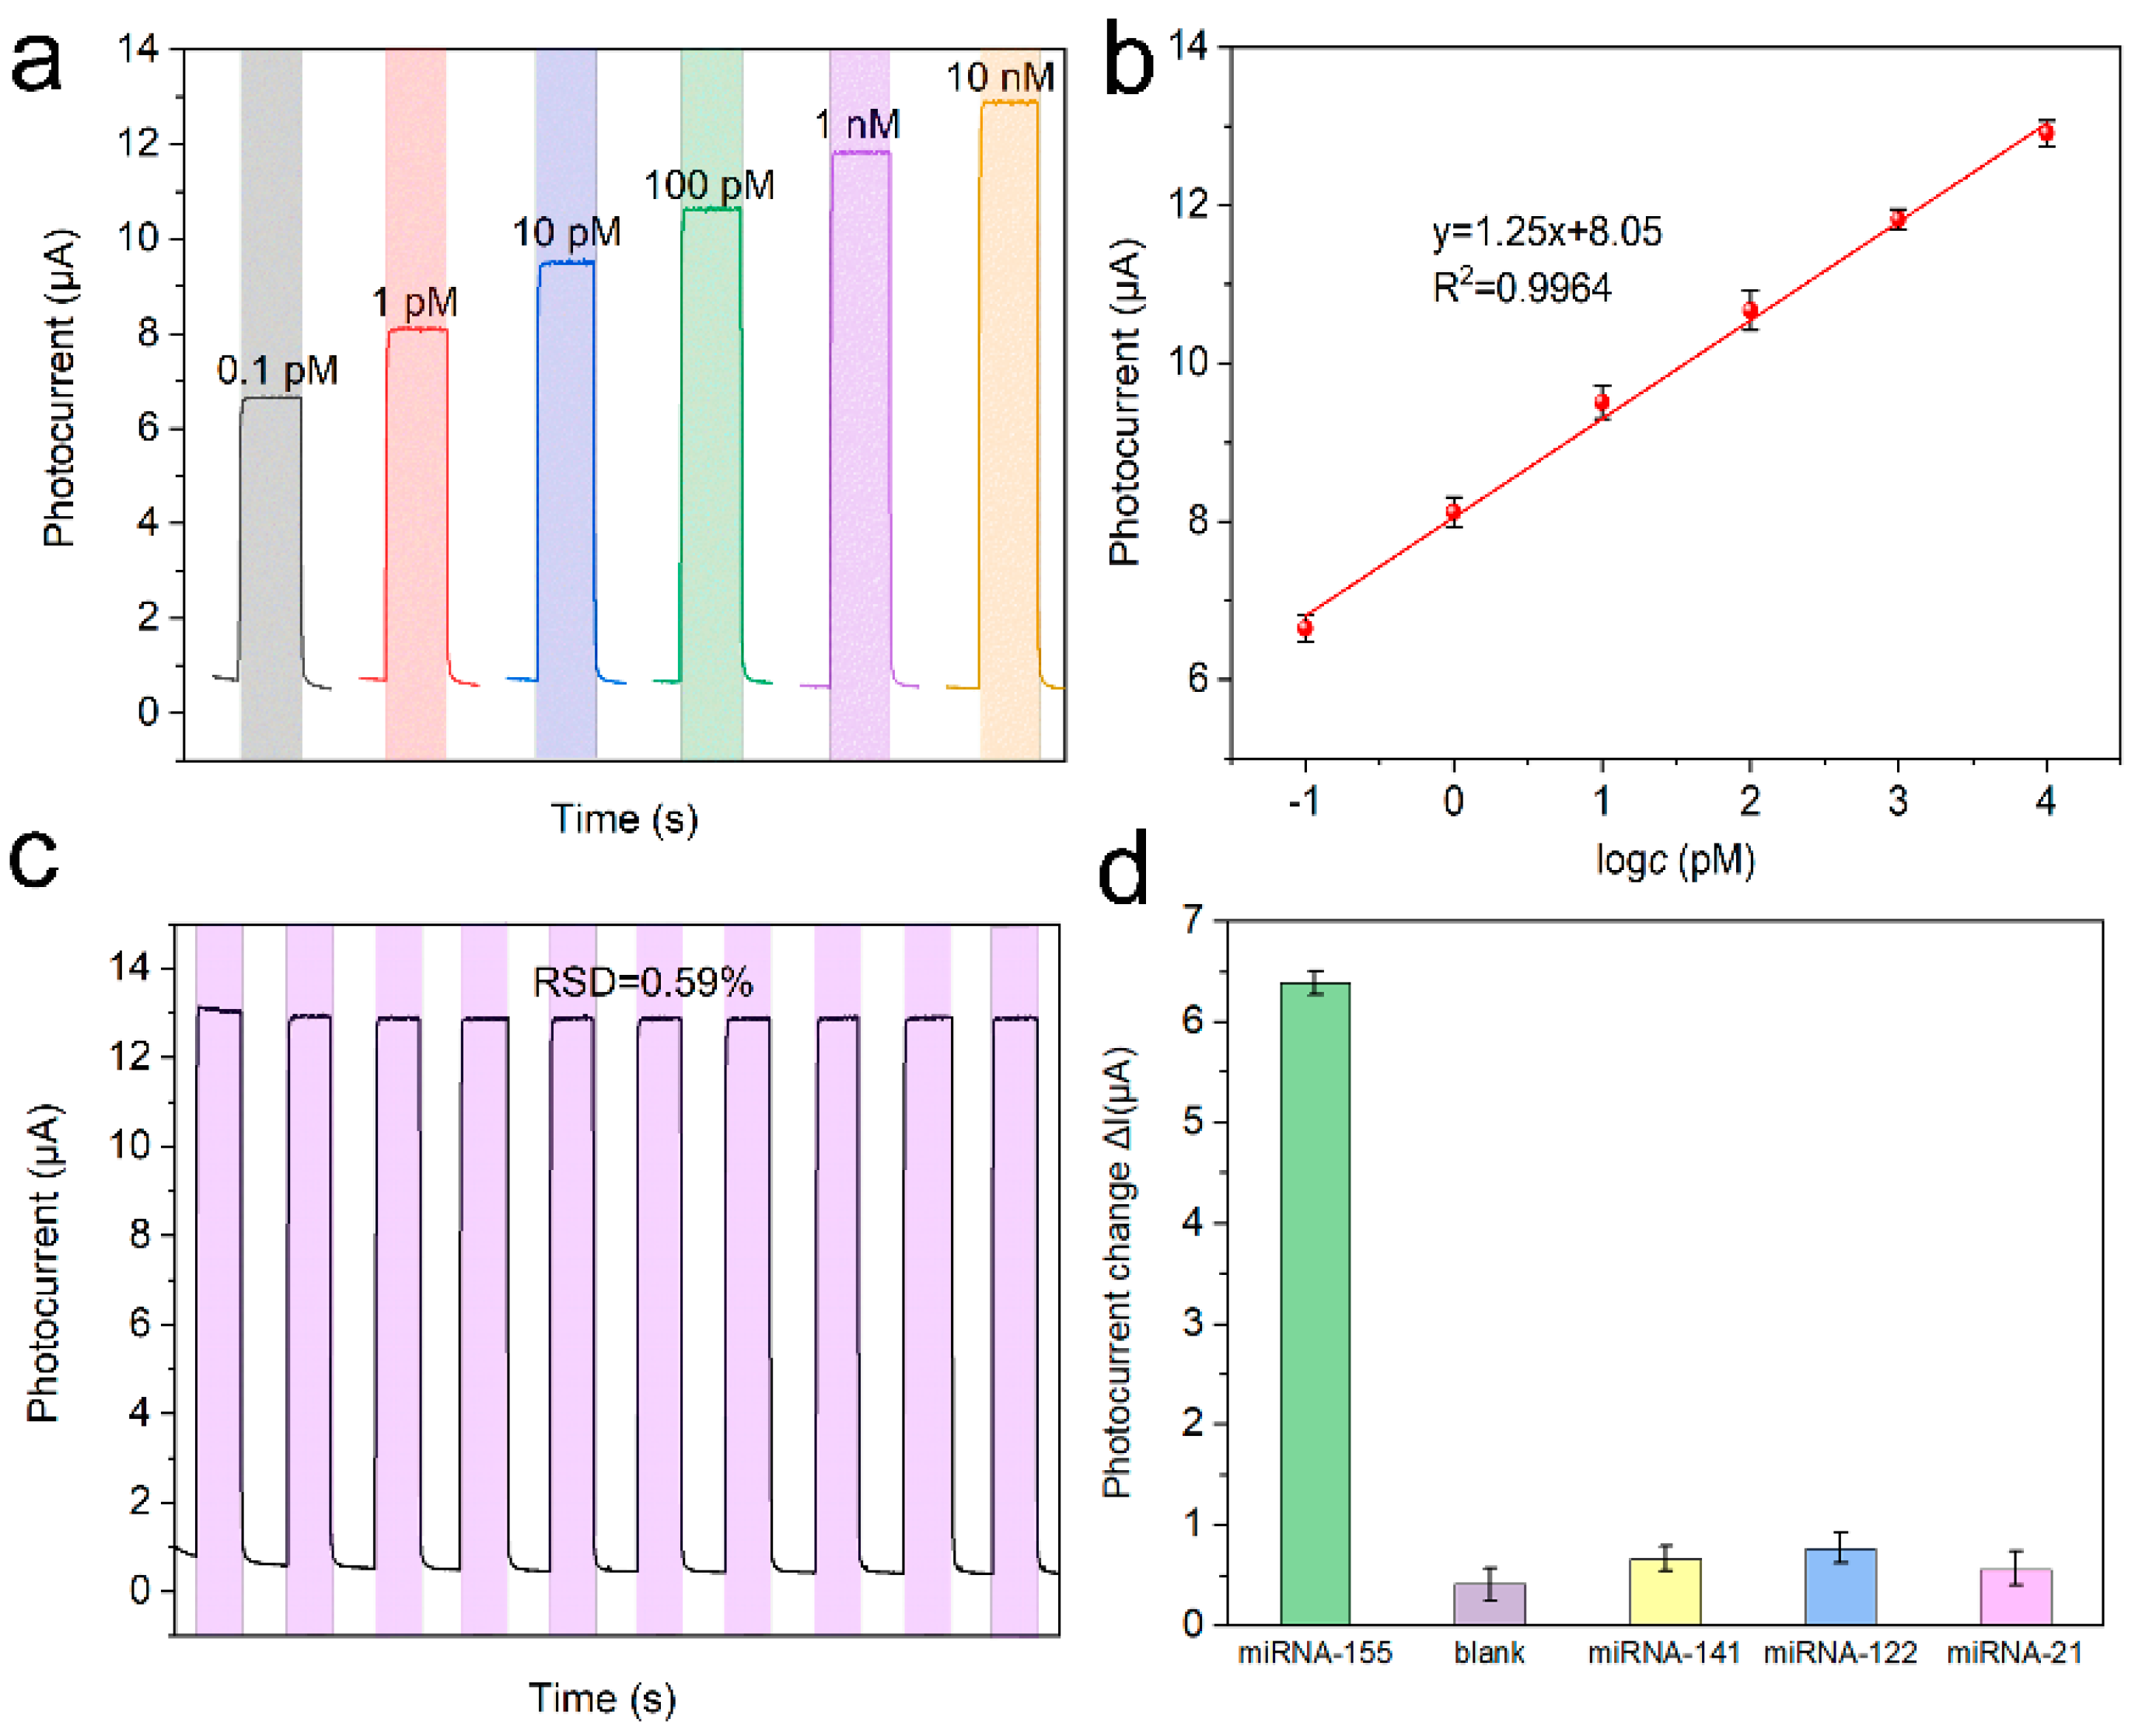
The response currents of the PEC platform with various microRNA-155 concentrations were tested (Figure 7a). The response current (I) showed a logarithmic relationship with the microRNA-155 concentrations (c), and the regression equation was I = 1.25lgc + 8.05 (R2 = 0.9964) (Figure 7b). Moreover, according to the literature [13], the LOD was calculated as 3.0×σ/S = 0.025 pM, where σ is the standard deviation of five times blank tests, and S is the sensitivity. The stability of the PEC platform was studied by continuous scanning under periodic light irradiation. Based on the relative standard deviation (RSD = 0.59%) of the response current in Figure 7c, the detection platform we built is very stable. Furthermore, the selectivity of the PEC platform was investigated by performing an anti-interference test with 1 nM microRNA-141, microRNA-121, and microRNA-21 as interferents. It can be seen that the response current of the detection platform to the interference is much smaller than that of the target, indicating that the detection platform has good anti-interference performance (Figure 7d). The performance of the detection platform is compared with the reported articles in Table 1.
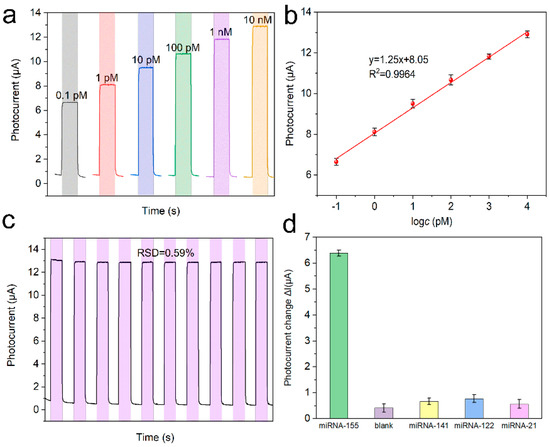
Figure 7.
(a) Photocurrent response in detection buffer of the biosensor with different microRNA-155 concentrations (b) calibration curve, (c) stability of the PEC biosensor with 1 nM microRNA-155, and (d) selectivity of the PEC microRNA-155 biosensor with 1 nM different microRNAs.

Table 1.
Analytical performance of several microRNA-155 biosensors.
4. Conclusions
In this article, arrays of titanium dioxide nanosheets with a highly active (001) crystal plane were successfully prepared for microRNA-155 PEC detection. Zero-dimensional Ti3C2Tx QDs were successfully synthesized and used in titanium dioxide. The excellent performance was related to the higher surface energy due to the exposed (001) facet on TiO2 nanosheets. The better separation ability of the photogenerated carriers was due to the Ti3C2Tx QDs/TiO2 type Ⅱ heterostructure being able to reduce the loss of electron transfer inside the electrode. The faster electron transport caused by the 0D/2D nanostructure and lattice connection at the interface between Ti3C2Tx and TiO2 allowed the electrons generated by the detection to be collected more smoothly. The PEC sensor comprising the Ti3C2Tx QDs/(001) TiO2 electrode exhibited high stability, sensitivity, and selectivity for microRNA-155 detection.
Supplementary Materials
The following are available online at https://www.mdpi.com/article/10.3390/nano12203557/s1, Table S1. Specific oligonucleotide sequence. Figure S1. Atomic force microscopy (AFM) image of Ti3C2Tx QDs. Figure S2. FESEM of (001) TiO2 NSs. Figure S3. FTIR spectra of TiO2 NSs, Ti3C2Tx QDs, and Ti3C2Tx QDs/(001) TiO2 composite. Figure S4. UV−vis DRS of (001) TiO2 and Ti3C2Tx QDs.
Author Contributions
Conceptualization: B.Y.; Methodology: B.Y.; Software: C.L.; Validation: H.P.; Formal analysis: R.Y.; Investigation: C.Z.; Resources: J.T.; Data curation: B.Q.; Writing—original draft preparation: B.Y.; Writing—review and editing: Q.W.; Visualization: Z.C.; Supervision: J.T.; Project administration: Q.W.; Funding acquisition: Q.W. All authors have read and agreed to the published version of the manuscript.
Funding
This research was financially supported by Hainan Province Clinical Medical Center. This research was funded by the National Natural Science Foundation of China [nos. 81860373, 51862006, 81902154, and 82060386], Hainan Province Science and Technology Special Fund [nos. ZDKJ2021029 and ZDYF2021SHFZ068], CAMS Innovation Fund for Medical Sciences [no. 2019-I2M-5-023], Key Laboratory Open Project Fund of Emergency and Trauma of Ministry of Education [no. KLET-201910]. Hainan Province Postgraduate Innovative Research Projects [no. Qhyb2021-23].
Institutional Review Board Statement
Not applicable.
Informed Consent Statement
Not applicable.
Data Availability Statement
Data available in a publicly accessible repository. The data presented in this study are openly available in [FigShare] at [10.6084/m9.figshare.21291828], reference number [10.1000/data.20120401].
Conflicts of Interest
The authors declare no conflict of interest.
References
- Chang, J.; Lv, W.; Wu, J.; Li, H.; Li, F. Simultaneous photoelectrochemical detection of dual microRNAs by capturing CdS quantum dots and methylene blue based on target-initiated strand displaced amplification. Chin. Chem. Lett. 2021, 32, 775–778. [Google Scholar] [CrossRef]
- Hu, T.; Zhang, L.; Wen, W.; Zhang, X.; Wang, S. Enzyme catalytic amplification of miRNA-155 detection with graphene quantum dot-based electrochemical biosensor. Biosens. Bioelectron. 2016, 77, 451–456. [Google Scholar] [CrossRef] [PubMed]
- Liu, L.; Zhu, S.; Wei, Y.; Liu, X.; Jiao, S.; Yang, J. Ultrasensitive detection of miRNA-155 based on controlled fabrication of AuNPs@MoS2 nanostructures by atomic layer deposition. Biosens. Bioelectron. 2019, 144, 111660. [Google Scholar] [CrossRef] [PubMed]
- Gai, P.; Gu, C.; Hou, T.; Li, F. Integration of Biofuel Cell-Based Self-Powered Biosensing and Homogeneous Electrochemical Strategy for Ultrasensitive and Easy-To-Use Bioassays of MicroRNA. ACS Appl. Mater. Interfaces 2018, 10, 9325–9331. [Google Scholar] [CrossRef] [PubMed]
- Zhao, W.-W.; Xu, J.-J.; Chen, H.-Y. Photoelectrochemical bioanalysis: The state of the art. Chem. Soc. Rev. 2015, 44, 729–741. [Google Scholar] [CrossRef]
- Roy, P.; Berger, S.; Schmuki, P. TiO2 Nanotubes: Synthesis and Applications. Angew. Chem. Int. Ed. 2011, 50, 2904–2939. [Google Scholar] [CrossRef]
- Huang, S.; Wu, C.; Wang, Y.; Yang, X.; Yuan, R.; Chai, Y. Ag/TiO2 nanocomposites as a novel SERS substrate for construction of sensitive biosensor. Sens. Actuators B: Chem. 2021, 339, 129843. [Google Scholar] [CrossRef]
- Ravariu, C.; Manea, E.; Babarada, F. Masks and metallic electrodes compounds for silicon biosensor integration. J. Alloys Compd. 2017, 697, 72–79. [Google Scholar] [CrossRef]
- Zhao, W.-W.; Shan, S.; Ma, Z.-Y.; Wan, L.-N.; Xu, J.-J.; Chen, H.-Y. Acetylcholine Esterase Antibodies on BiOI Nanoflakes/TiO2 Nanoparticles Electrode: A Case of Application for General Photoelectrochemical Enzymatic Analysis. Anal. Chem. 2013, 85, 11686–11690. [Google Scholar] [CrossRef]
- Guo, L.; Li, Z.; Marcus, K.; Navarro, S.; Liang, K.; Zhou, L.; Mani, P.D.; Florczyk, S.J.; Coffey, K.R.; Orlovskaya, N.; et al. Periodically Patterned Au-TiO2 Heterostructures for Photoelectrochemical Sensor. ACS Sens. 2017, 2, 621–625. [Google Scholar] [CrossRef]
- Cui, L.; Shen, J.; Ai, S.; Wang, X.; Zhang, C.-Y. In-situ synthesis of covalent organic polymer thin film integrates with palladium nanoparticles for the construction of a cathodic photoelectrochemical cytosensor. Biosens. Bioelectron. 2020, 168, 112545. [Google Scholar] [CrossRef] [PubMed]
- Li, C.-C.; Chen, H.-Y.; Luo, X.; Hu, J.; Zhang, C.-Y. Multicolor fluorescence encoding of different microRNAs in lung cancer tissues at the single-molecule level. Chem. Sci. 2021, 12, 12407–12418. [Google Scholar] [CrossRef] [PubMed]
- Ma, F.; Jiang, S.; Zhang, C.-Y. SiRNA-directed self-assembled quantum dot biosensor for simultaneous detection of multiple microRNAs at the single-particle level. Biosens. Bioelectron. 2020, 157, 112177. [Google Scholar] [CrossRef]
- Gu, L.; Wang, J.; Cheng, H.; Zhao, Y.; Liu, L.; Han, X. One-step preparation of graphene-supported anatase TiO2 with exposed {001} facets and mechanism of enhanced photocatalytic properties. ACS Appl. Mater. Interfaces 2013, 5, 3085–3093. [Google Scholar] [CrossRef] [PubMed]
- Chen, X.; Xu, W.; Ding, N.; Ji, Y.; Pan, G.; Zhu, J.; Zhou, D.; Wu, Y.; Chen, C.; Song, H. Dual Interfacial Modification Engineering with 2D MXene Quantum Dots and Copper Sulphide Nanocrystals Enabled High-Performance Perovskite Solar Cells. Adv. Funct. Mater. 2020, 30, 2003295. [Google Scholar] [CrossRef]
- Hadermann, J. Electron Crystallography. Electron Microscopy and Electron Diffraction. By Xiaodong Zou, Sven Hovmller and Peter Oleynikov. Oxford University Press, 2011. Price (hardcover) GBP 52.50. ISBN-13: 978-0-19-958020-0. J. Appl. Crystallogr. 2014, 47, 816–818. [Google Scholar] [CrossRef]
- Yang, H.G.; Sun, C.H.; Qiao, S.Z.; Zou, J.; Liu, G.; Smith, S.C.; Cheng, H.M.; Lu, G.Q. Anatase TiO2 single crystals with a large percentage of reactive facets. Nature 2008, 453, 638–641. [Google Scholar] [CrossRef]
- Gao, C.; Wei, T.; Zhang, Y.; Song, X.; Huan, Y.; Liu, H.; Zhao, M.; Yu, J.; Chen, X. A Photoresponsive Rutile TiO2 Heterojunction with Enhanced Electron-Hole Separation for High-Performance Hydrogen Evolution. Adv. Mater. 2019, 31, e1806596. [Google Scholar] [CrossRef]
- Jiang, X.; Wang, H.; Shen, Y.; Hu, N.; Shi, W. Nitrogen-doped Ti3C2 MXene quantum dots as novel high-efficiency electrochemiluminescent emitters for sensitive mucin 1 detection. Sens. Actuators B Chem. 2022, 350, 130891. [Google Scholar] [CrossRef]
- Guo, Z.; Zhu, X.; Wang, S.; Lei, C.; Huang, Y.; Nie, Z.; Yao, S. Fluorescent Ti3C2MXene quantum dots for an alkaline phosphatase assay and embryonic stem cell identification based on the inner filter effect. Nanoscale 2018, 10, 19579–19585. [Google Scholar] [CrossRef]
- Peng, C.; Yang, X.; Li, Y.; Yu, H.; Wang, H.; Peng, F. Hybrids of Two-Dimensional Ti3C2 and TiO2 Exposing {001} Facets toward Enhanced Photocatalytic Activity. ACS Appl. Mater. Interfaces 2016, 8, 6051–6060. [Google Scholar] [CrossRef] [PubMed]
- Cheng, Y.; Ma, Y.; Li, L.; Zhu, M.; Yue, Y.; Liu, W.; Wang, L.; Jia, S.; Li, C.; Qi, T.; et al. Bioinspired Microspines for a High-Performance Spray Ti3C2Tx MXene-Based Piezoresistive Sensor. ACS Nano 2020, 14, 2145–2155. [Google Scholar] [CrossRef]
- Wang, H.; Zhao, R.; Hu, H.; Fan, X.; Zhang, D.; Wang, D. 0D/2D Heterojunctions of Ti3C2 MXene QDs/SiC as an Efficient and Robust Photocatalyst for Boosting the Visible Photocatalytic NO Pollutant Removal Ability. ACS Appl. Mater. Interfaces 2020, 12, 40176–40185. [Google Scholar] [CrossRef] [PubMed]
- Wu, X.; Chai, Y.; Yuan, R.; Su, H.; Han, J. A novel label-free electrochemical microRNA biosensor using Pd nanoparticles as enhancer and linker. Analyst 2012, 138, 1060–1066. [Google Scholar] [CrossRef] [PubMed]
- Wang, F.; Fu, C.; Huang, C.; Li, N.; Wang, Y.; Ge, S.; Yu, J. Paper-based closed Au-Bipolar electrode electrochemiluminescence sensing platform for the detection of miRNA-155. Biosens. Bioelectron. 2020, 150, 111917. [Google Scholar] [CrossRef]
- Ding, X.; Yan, Y.; Li, S.; Zhang, Y.; Cheng, W.; Cheng, Q.; Ding, S. Surface plasmon resonance biosensor for highly sensitive detection of microRNA based on DNA super-sandwich assemblies and streptavidin signal amplification. Anal. Chim. Acta 2015, 874, 59–65. [Google Scholar] [CrossRef]
- Chu, Y.; Deng, A.-P.; Wang, W.; Zhu, J.-J. Concatenated Catalytic Hairpin Assembly/Hyperbranched Hybridization Chain Reaction Based Enzyme-Free Signal Amplification for the Sensitive Photoelectrochemical Detection of Human Telomerase RNA. Anal. Chem. 2019, 91, 3619–3627. [Google Scholar] [CrossRef]
- Liu, H.; Ai, S.; Liu, Y.; Zeng, H.; Da, H.; Liu, Y.; Chai, Y.; Yuan, R. Enhancing photoelectrochemical performance of ZnIn2S4 by phosphorus doping for sensitive detection of miRNA-155. Chem. Commun. 2020, 56, 14275–14278. [Google Scholar] [CrossRef]
Publisher’s Note: MDPI stays neutral with regard to jurisdictional claims in published maps and institutional affiliations. |
© 2022 by the authors. Licensee MDPI, Basel, Switzerland. This article is an open access article distributed under the terms and conditions of the Creative Commons Attribution (CC BY) license (https://creativecommons.org/licenses/by/4.0/).

