Article

Enhanced Electrochemical Performance of Sugarcane Bagasse-Derived Activated Carbon via a High-Energy Ball Milling Treatment

1
Department of Physics, Faculty of Science, Institute of Nanomaterials Research and Innovation for Energy (IN-RIE), Khon Kaen University, Khon Kaen 40002, Thailand
2
Synchrotron Light Research Institute (Public Organization), 111 University Avenue, Muang District, Nakhon Ratchasima 30000, Thailand
3
School of Physics, Institute of Science, Suranaree University of Technology, Nakhon Ratchasima 30000, Thailand
*
Author to whom correspondence should be addressed.
Nanomaterials 2022, 12(20), 3555; https://doi.org/10.3390/nano12203555
Submission received: 31 August 2022 / Revised: 6 October 2022 / Accepted: 8 October 2022 / Published: 11 October 2022

Abstract

:
Activated carbon (AC) from sugarcane bagasse was prepared using dry chemical activation with KOH. It was then subjected to a high-energy ball milling (HEBM) treatment under various milling speeds (600, 1200 and 1800 rpm) to produce AC nanoparticles from micro-size particles. The AC samples after the HEBM treatment exhibited reduced particle sizes, increased mesopore volume and a rich surface oxygen content, which contribute to higher pseudocapacitance. Notably, different HEBM speeds were used to find a good electrochemical performance. As a result, the AC/BM12 material, subjected to HEBM at 1200 rpm for 30 min, exhibited the highest specific capacitance, 257 F g−1, at a current density 0.5 A g−1. This is about 2.4 times higher than that of the AC sample. Moreover, the excellence capacitance retention of this sample was 93.5% after a 3000-cycle test at a current density of 5 A g−1. Remarkably, a coin cell electrode assembly was fabricated using the AC/BM12 material in a 1 M LiPF6 electrolyte. It exhibited a specific capacitance of 110 F g−1 with a high energy density of 27.9 W h kg−1.

Graphical Abstract

1. Introduction

Electric double layer capacitors (EDLCs), or supercapacitors, store energy via double layers consisting of an electrode surface and electrolyte ions. EDLCs have excellent electrochemical performance with high power density, fast charge/discharge and long life-cycles [1,2]. They can store electrostatic charges or ions at their surfaces or in electrode pores with no redox reactions or structural changes, giving them an advantage over batteries and other energy storage devices [3]. Generally, EDLC electrodes are made of porous carbon materials with large surface areas, including carbon nanotubes, graphene, carbon nanofibers and other activated carbon [4,5]. However, a major disadvantage of EDLCs is their low energy density [6]. Additional performance improvements are mainly related to specific energy density. Recently, improvement of EDLCs functionalized by Faradaic reactions for high energy density have become attractive. For example, use of novel electrolytes or some electrochemical reactions on electrode surfaces of supercapacitors has been demonstrated [7,8,9].
Nowadays, carbon-based products from various biomass wastes such as corn stover [10], wood [11], rice straw [12], rice husks [13], and bamboo [14], have attracted extensive interest for energy storage applications [15]. Sugarcane bagasse, one of the most plentiful agricultural biowastes, is a potential alternative source of carbon products. This is due to its great abundance, low cost, biocompatibility and eco-friendly nature [16,17,18,19,20]. In general, two processes are used for preparation of biomass derived activated carbon. They are pyrolysis and chemical activation methods. These are the most common preparation routes to produce refined microporous structures, high pore volumes and large surface areas of activated carbon [21]. Accordingly, activated carbon from sugarcane bagasse is considered a novel material for supercapacitor electrodes [22,23,24]. Nevertheless, high-surface area and micropores in carbon material electrodes are not the only factor needed for high performance [25,26]. Mesopores (pore diameters of 2–50 nm) shorten the transport paths of electrons and ions, which can also enhance the electrical performance of the materials [27].
Recently, nanoscale materials have become a research focus for electric double layer capacitors (EDLCs) in energy storage and conversion applications due to their superior properties compared to materials with micro-macro particle sizes. They have higher surface areas, high pore volumes, faster kinetics, and lower resistance. A top-down method via ball milling is a simple technique used to reduce particle sizes to nanoscale. Additionally, nanoparticles exhibit a larger mesopore volume compared to micrometer sized particles, providing one of the key factors for high performance electrochemical supercapacitors [28]. Furthermore, high-energy ball milling (HEBM) is a novel technique for decreasing particle size as it is a fast grinding process to perform high speed milling with high kinetic energy [29]. Decreased particle sizes enable production of electrodes with increased surface area, resulting in greater levels of ion adsorption on the surfaces and in pores of these materials. This results in supercapacitors with superior capacity due to short ion diffusion pathways and low resistance, among other factors [30,31]. Moreover, mesopores can enhance electrochemical performance [27]. Several research studies demonstrated that high surface area and large mesopores were generated in high-energy ball milling processes [32,33].
Here, we employed an HEBM process to produce AC from sugarcane bagasse by adjusting milling speed to 600, 1200 and 1800 rpm for 30 min. The impact of structure, morphology, porosity, and surface chemical groups of electrode materials on electrochemical performance was examined. Interestingly, we demonstrated that an HEBM process can decrease the particle size of AC samples and enhance surface chemistry. Moreover, the HEBM milling speed was studied to obtain the highest specific capacitance, 257 F g−1, at a current density 0.5 A g−1. This achieved a capacitance retention of 93.5% after a 3000-cycle test at a current density of 5 A g−1 in a sample produced with a milling speed of 1200 rpm. Furthermore, a symmetrical coin cell electrode system was assembled with a 1 M LiPF6 electrolyte for a supercapacitor device with high energy density of 27.9 W h kg−1.

2. Materials and Methods

2.1. Synthesis

Sugarcane bagasse, a biomass waste, was used as a starting raw material. The products were prepared in three steps, carbonization, activation and an HEBM process, as depicted in Figure 1. In the first step, sugarcane bagasse (SB) was shredded and dried at 150 °C for 24 h. Then, the dried SB underwent size reduction using a mechanical homogenizer (JGY-800B, Yongkang hardware capital, Zhejiang, China) at a speed of 25,000 rpm. The resulting material was passed through a 125 µm stainless steel sieve to obtained SB powder. The sieved SB powder was pyrolyzed at 500 °C for 1 h in a quartz-tube furnace at a heating rate of 10 °C min−1 under an Ar flow to obtain carbon from sugarcane bagasse (CSB). Pyrolysis temperature was determined from thermal gravimetric analysis (TGA) and derivative thermogravimetry (DTG) (STA7200, HITACHI, Tokyo, Japan) (Figure S1 in the Supporting Information). Then, the CSB powder was mixed with KOH at a weight ratio of 1:4. This condition was optimized to attain the highest electrochemical performance by varying the CSB:KOH ratio as shown in Figures S2 and S3 (Supporting Information). The dried powder was then annealed at 800 °C for 1 h under an argon flow using a heating rate 10 °C min−1 to produce activated carbon (AC) powders [21,34]. In the final step, the AC powders were subjected to high-energy ball milling (HEBM) (Model Emax, Retsch, Haan, Germany). 1 g of AC and 20 g of zirconium oxide balls (0.5 mm of diameter) were mixed in 50 mL of ethanol and loaded into a 125 mL grinding jar. The mixture was milled by HEBM at milling speeds of 600, 1200 and 1800 rpm for 30 min, and referenced as the AC/BM6, AC/BM12 and AC/BM18 samples, respectively. After the HEBM process, the products were washed several times with deionized water and subsequently dried at 80 °C in an oven.

2.2. Characterization

Thermal gravimetric analysis (TGA) and derivative thermogravimetry (DTG) (STA7200, HITACHI, Tokyo, Japan) were used to determine the pyrolysis temperature of the samples. These measurements were performed starting from room temperature with heating to 900 °C under nitrogen flow (flow rate of 200 mL min−1) at a heating rate of 10 °C min−1. An X-ray diffraction (XRD) technique (Empyrean, Almelo, The Netherlands) with Cu Kα radiation was used to identify crystal structures. Carbon phases were studied using Raman spectroscopy (XploRA plus, Horiba, Kyoto, Japan) with a laser excitation wavelength of 532 nm. The morphology and particle size distributions of samples were examined using field emission scanning electron microscopy (FE–SEM, Helios Nanolab G3 CX, FEI, Brno, Czech Republic) and a Zetasizer nano ZS (Malvern Panalytical, Malvern, MA, USA), respectively. The specific surface area (SSA) and pore size distributions (PSD) were determined using an N2 adsorption-desorption method (Micromeritics, 3Flex, Tokyo, Japan) at 77 K. The SSA area was determined using a Brunauer–Emmett–Teller (BET) method. A T-plot was used to calculate the micropore volume (Vmicro). The PSDs of micropores and mesopores were determined using density functional theory (DFT) and a Barrett–Joyner–Halenda (BJH) method, respectively. All samples were degassed for 24 h at 300 °C under a vacuum before measurements were obtained. The sample surfaces were characterized using X-ray photoelectron spectroscopy (XPS) (PHI 5000 versa ProbII@ Ulvac-PHI Inc., Kanagawa, Japan). Fourier transform infrared spectrophotometry (FT–IR) (TENSOR27, Bruker, Osaka, Japan)] was used to identify the functional groups of the materials. The water contact angle on the surface of the aerogels was studied with a specialized instrument (FTA1000 Drop Shape Analysis System, Cambridge, UK).

2.3. Electrochemical Measurements

2.3.1. Electrochemical Performance in a Three-Electrode System with 3 M KOH

A three-electrode system with a platinum counter electrode and an Ag/AgCl reference electrode with a 3M KOH electrolyte solution was used to characterize electrochemical properties. For a working electrode, the AC powders (90 wt.%) were mixed with 10 wt.% of polyvinylidene fluoride and dissolved in an N-methyl-2-pyrrolidone (NMP) solution. Subsequently, the mixed solution was coated onto a 1.0 × 1.5 cm2 Ni foam substrate over a 1 × 1 cm2 area before being dried for 24 h in an oven at 80 °C. Finally, the coated Ni foam electrodes were uniaxially compressed at 5 MPa. Cyclic voltammetry (CV), galvanostatic charge/discharge (GCD), and electrochemical impedance spectra (EIS) were measured using a CORRTEST (CS350 Potentiostat/Galvanostat, Corrtest instruments, Wuhan, China). A voltage range of −1.0 to +0.0 V with scan rates ranging from 5–200 mV s−1 for the working electrode was used for CV measurements. The GCD experiments were done at current densities ranging from 0.5–30 A g−1 to determine the specific capacitance and cyclic stability of the electrodes. The electrical conductivity of the electrodes was measured using an EIS method within a frequency range of 0.1 Hz–100 kHz. For the three-electrode system, the specific capacitance (Csp) was calculated from the following equation [35]:
C sp   F g = I × Δ t m × Δ V
where I (Amperes) is the constant current in discharge, m (grams) refers to the weight of the active material within an electrode, ΔV refers to the voltage change during discharge and Δt (seconds) is the time of discharge.

2.3.2. Electrochemical Performance in a Two-Electrode System with a 1 M LiPF6 Electrolyte

Electrodes were prepared utilizing Al foil (16 microns thick) as a cathode current collector and copper foil (9 µm thick) as an anode current collector. 0.8 g of the powder sample (AC/BM12), 0.1 g of carbon-black and 0.1 g of PVDF were mixed with 6 mL of NMP to form a slurry. The slurry was then ball-milled for 24 h at 300 rpm. The well-mixed slurry was deposited on the current collector at a thickness of 200 µm using a doctor-blade. After that, the films were pre-heated for 1 h at 90 °C, cut into 5 × 5 cm2 squares and compressed at 5 MPa. Then, they were heated again at 120 °C for 1 h to completely dry the pressed films. The dried films were punched into 16 mm diameter disks and stored in a dry box. A 20 mm diameter coin cell system was used with a polypropylene (PP) film as a separator. The coin cells were crimped with an ECCCM-160E-A crimping machine (MTI Corporation, Richmond, CA, USA) at 5 Mpa after adding 100 µL of 1 M LiPF6 in an ethylene carbonate–di-methyl carbonate (EC/DMC) organic electrolyte. The specific capacitance of the symmetric coin cells was calculated from the GCD results using the following equation [36]:
C sp   F g = 2 I × Δ t m × Δ V
where I (Amperes) is the constant current in discharge, m (grams) refers to the weight of the active material within an electrode, ΔV refers to the voltage change during discharge (excluding IR drop) and Δt (seconds) is the time of discharge.
The energy (E) and power densities (P) of both systems were calculated following Equations (3) and (4) [36], respectively.
E Wh kg = C sp V max 2 8 × 3.6
P W kg = E Δ t
where, Csp is capacitance from the GCD results, ΔE is the operating potential window of charge or discharge in Volts, i (Amperes) is the applied current, Δt is the discharge time (seconds) and m (grams) is the mass of active materials.

3. Results and Discussion

3.1. XRD and Raman Spectroscopy

The XRD patterns of AC and AC/BM at various milling speeds of 600, 1200 and 1800 rpm for 30 min are shown in Figure 2a. The AC and AC/BM6 samples reveal no diffraction peak, which indicates an amorphous structure for these samples. However, the AC/BM12 and AC/BM18 samples showed broad 2θ peaks at around 26° and 43°, ascribed to the (002) and (100) planes of a graphite structure [37]. These results suggest that the characteristic graphitic crystal content increased in these samples. Numerous researchers reported that increasing the (002) peak of graphitic carbon can greatly enhance electrical conductivity [25]. The intensity of the broad (002) peaks increased at milling speeds of 1200 and 1800 rpm, suggesting that the HEBM process could induce graphitic structures [38]. The structure of carbon materials was further investigated using Raman spectroscopy [39]. Figure 2b shows Raman spectra of all samples. Two major peaks were observed at Raman shifts of approximately 1340 and 1580 cm−1, corresponding to the D-band and G-band, respectively [10,11]. The D-band reveals disorder defects in carbon materials, while the G-band can be attributed to the graphitic structures of carbon materials [12]. The ratios of the relative intensities of the D-band and G-band (ID/IG) values of AC, AC/BM6, AC/BM12 and AC/BM18 were approximately 0.93, 0.91, 0.73 and 0.71, respectively. The ID/IG ratio decreased with increasing HBEM speed, indicating an increased degree of graphitization [40], which is in good agreement with the XRD analysis. Moreover, a sharp narrow 2D peak at about 2700 cm−1 was observed for AC/BM12 and AC/BM18, inferring that the samples exhibit some portions of graphene sheets [40,41]. The induced 2D graphite from HBEM could lead to enhanced conductivity [40,41].

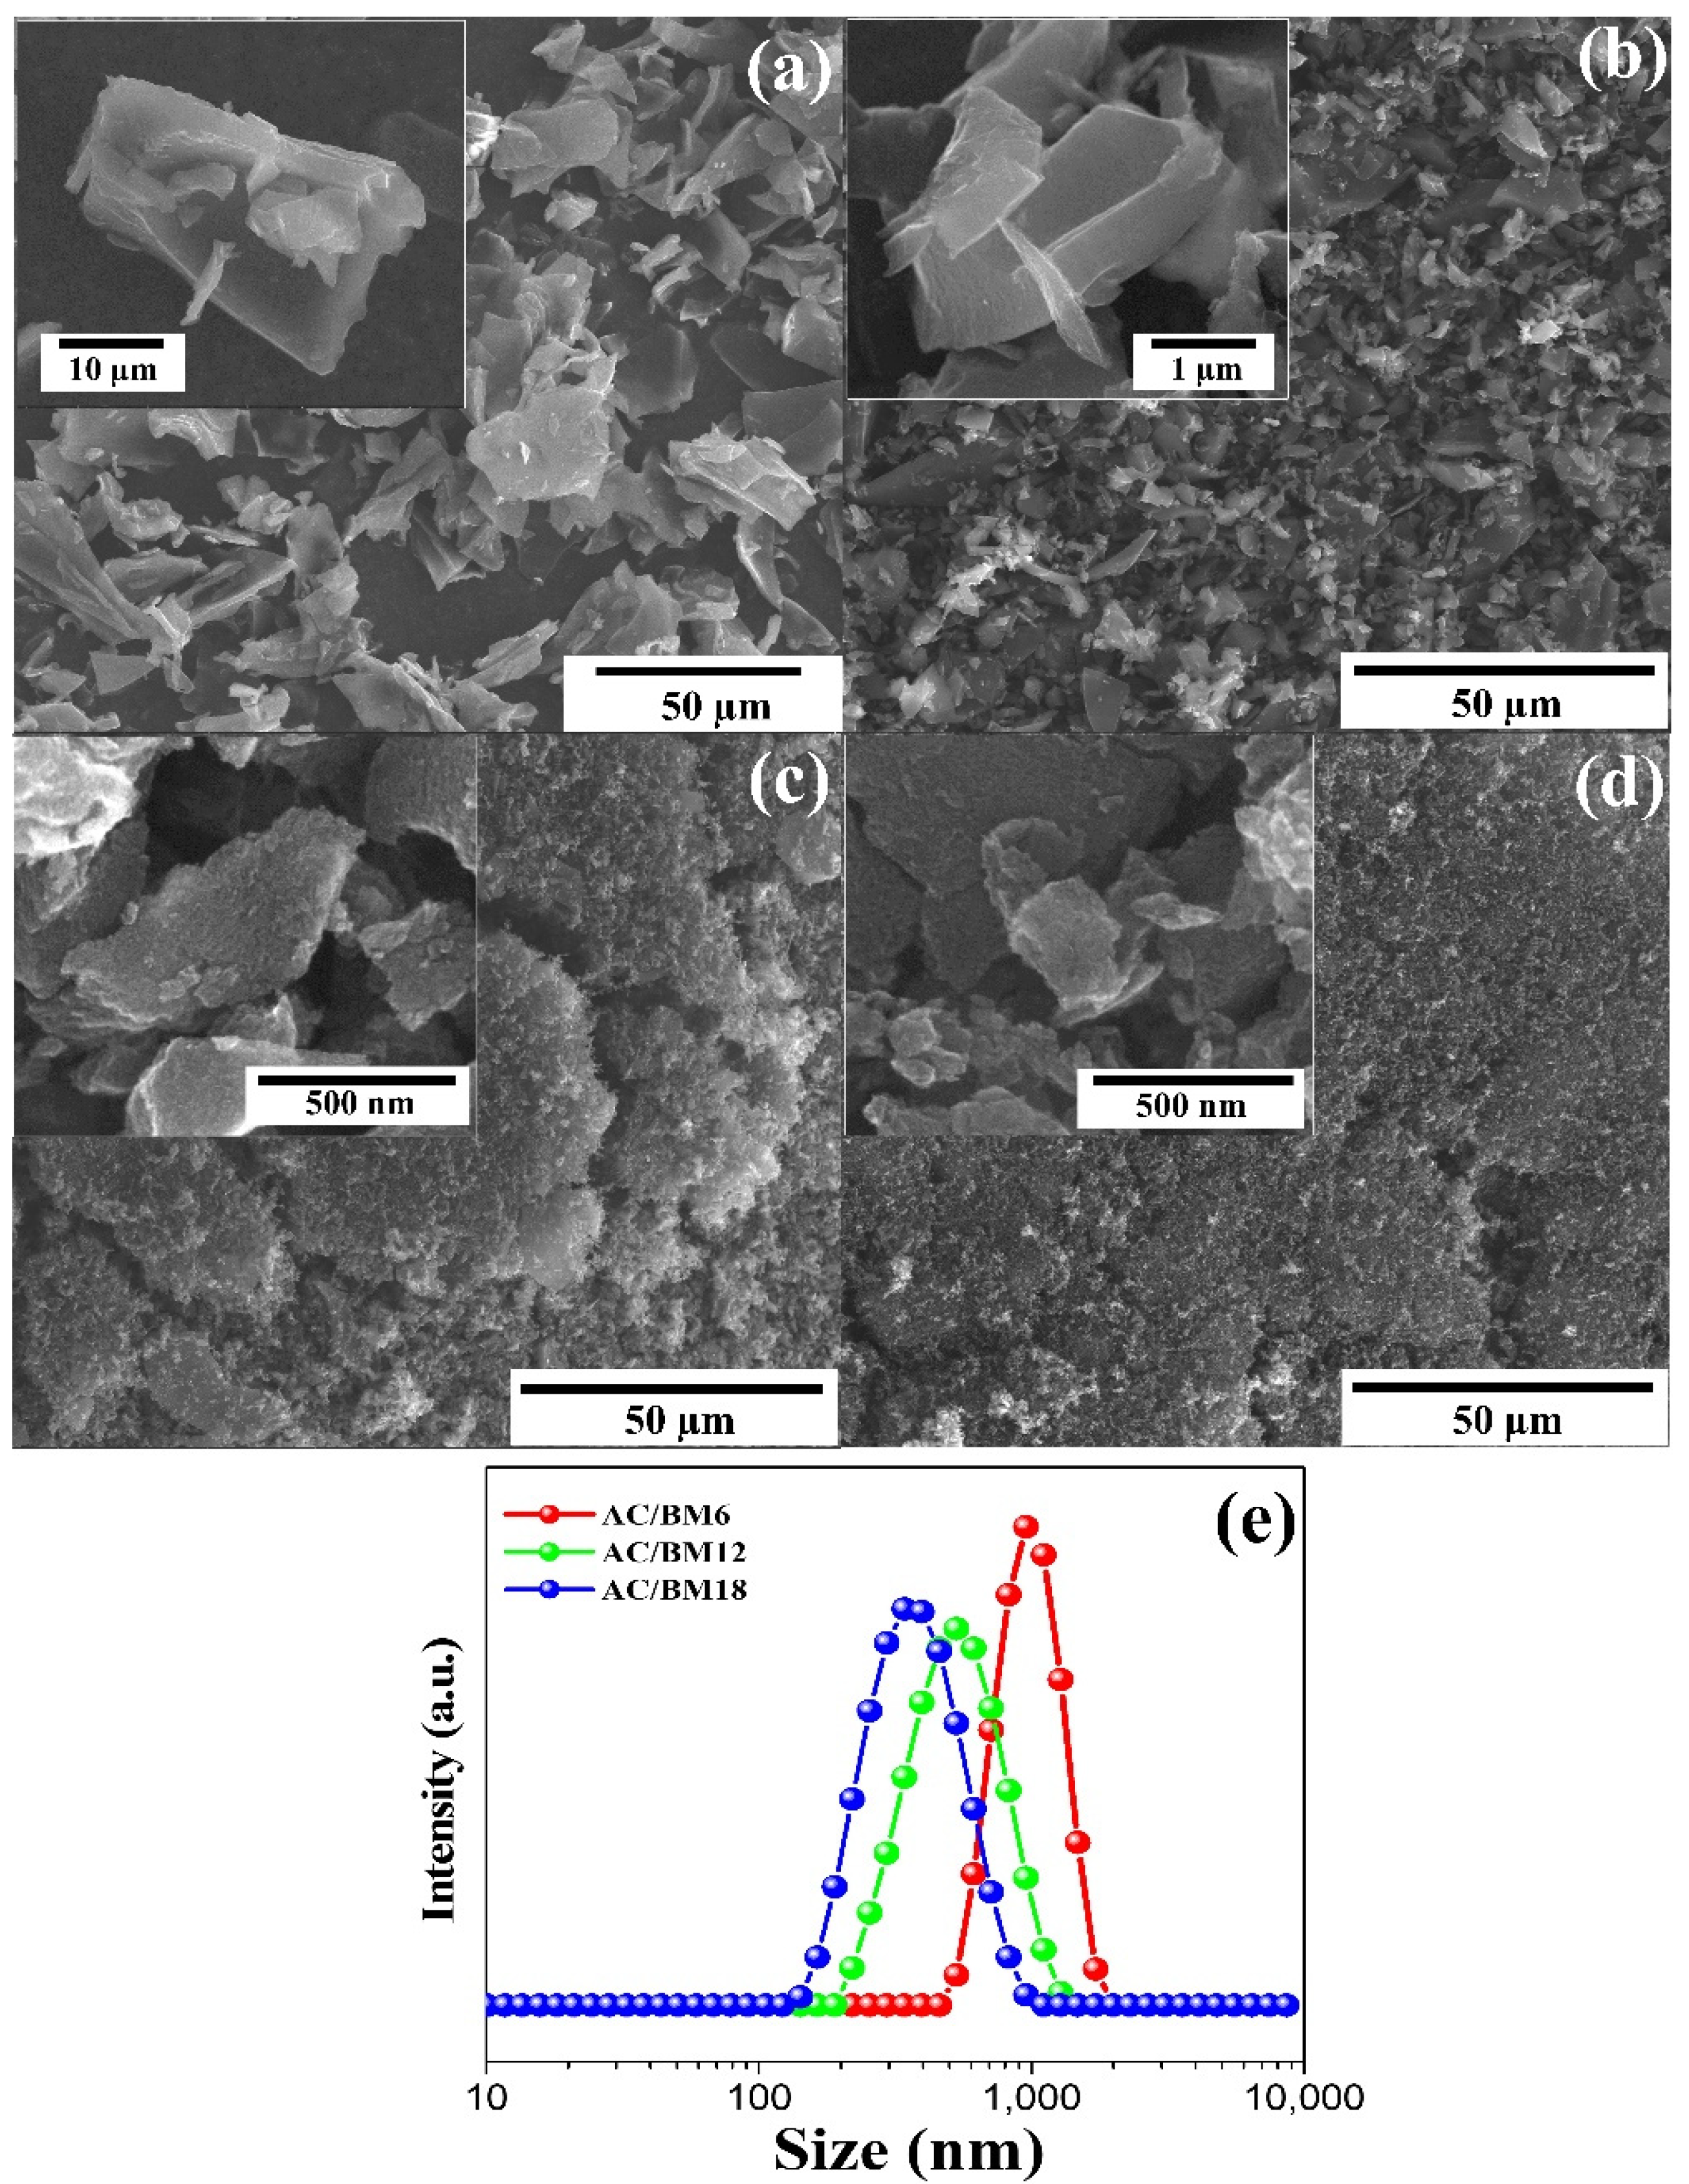
3.2. FE-SEM and Zeta Particle Size Analysis

FE-SEM images in Figure 3a–d show the morphologies of AC and AC/BM. The AC samples revealed large irregularly-shaped particles that are about 10–30 µm in size (Figure 3a). The particle size of AC after HEBM at 600 rpm decreased to 1–5 µm, as shown in Figure 3b. Moreover, after HEBM at speeds of 1200 and 1800 rpm, the samples presented decreased particle diameters to nano-scale sizes, as shown in Figure 3c,d. However, there are some agglomerations in the AC/BM12 and AC/BM18 samples ranging from 100 nm−1 µm. A Zeta nanoparticle size analyzer was employed to determine the size distribution of AC/BM6, AC/BM12 and AC/BM18, to quantify the particle size distributions. These results are shown in Figure 3e. The average particle sizes were 1.0 ± 0.11, 0.55 ± 0.13 and 0.39 ± 0.12 µm for AC/BM6, AC/BM12 and AC/BM18 samples, respectively. The results show that increasing the milling speed caused a decrease in the particle size, with average particle size of about 0.4–1 µm, compared to 10–30 µm for the AC powder. The reduction of particle sizes via HEBM is in good agreement with a previous report [26].

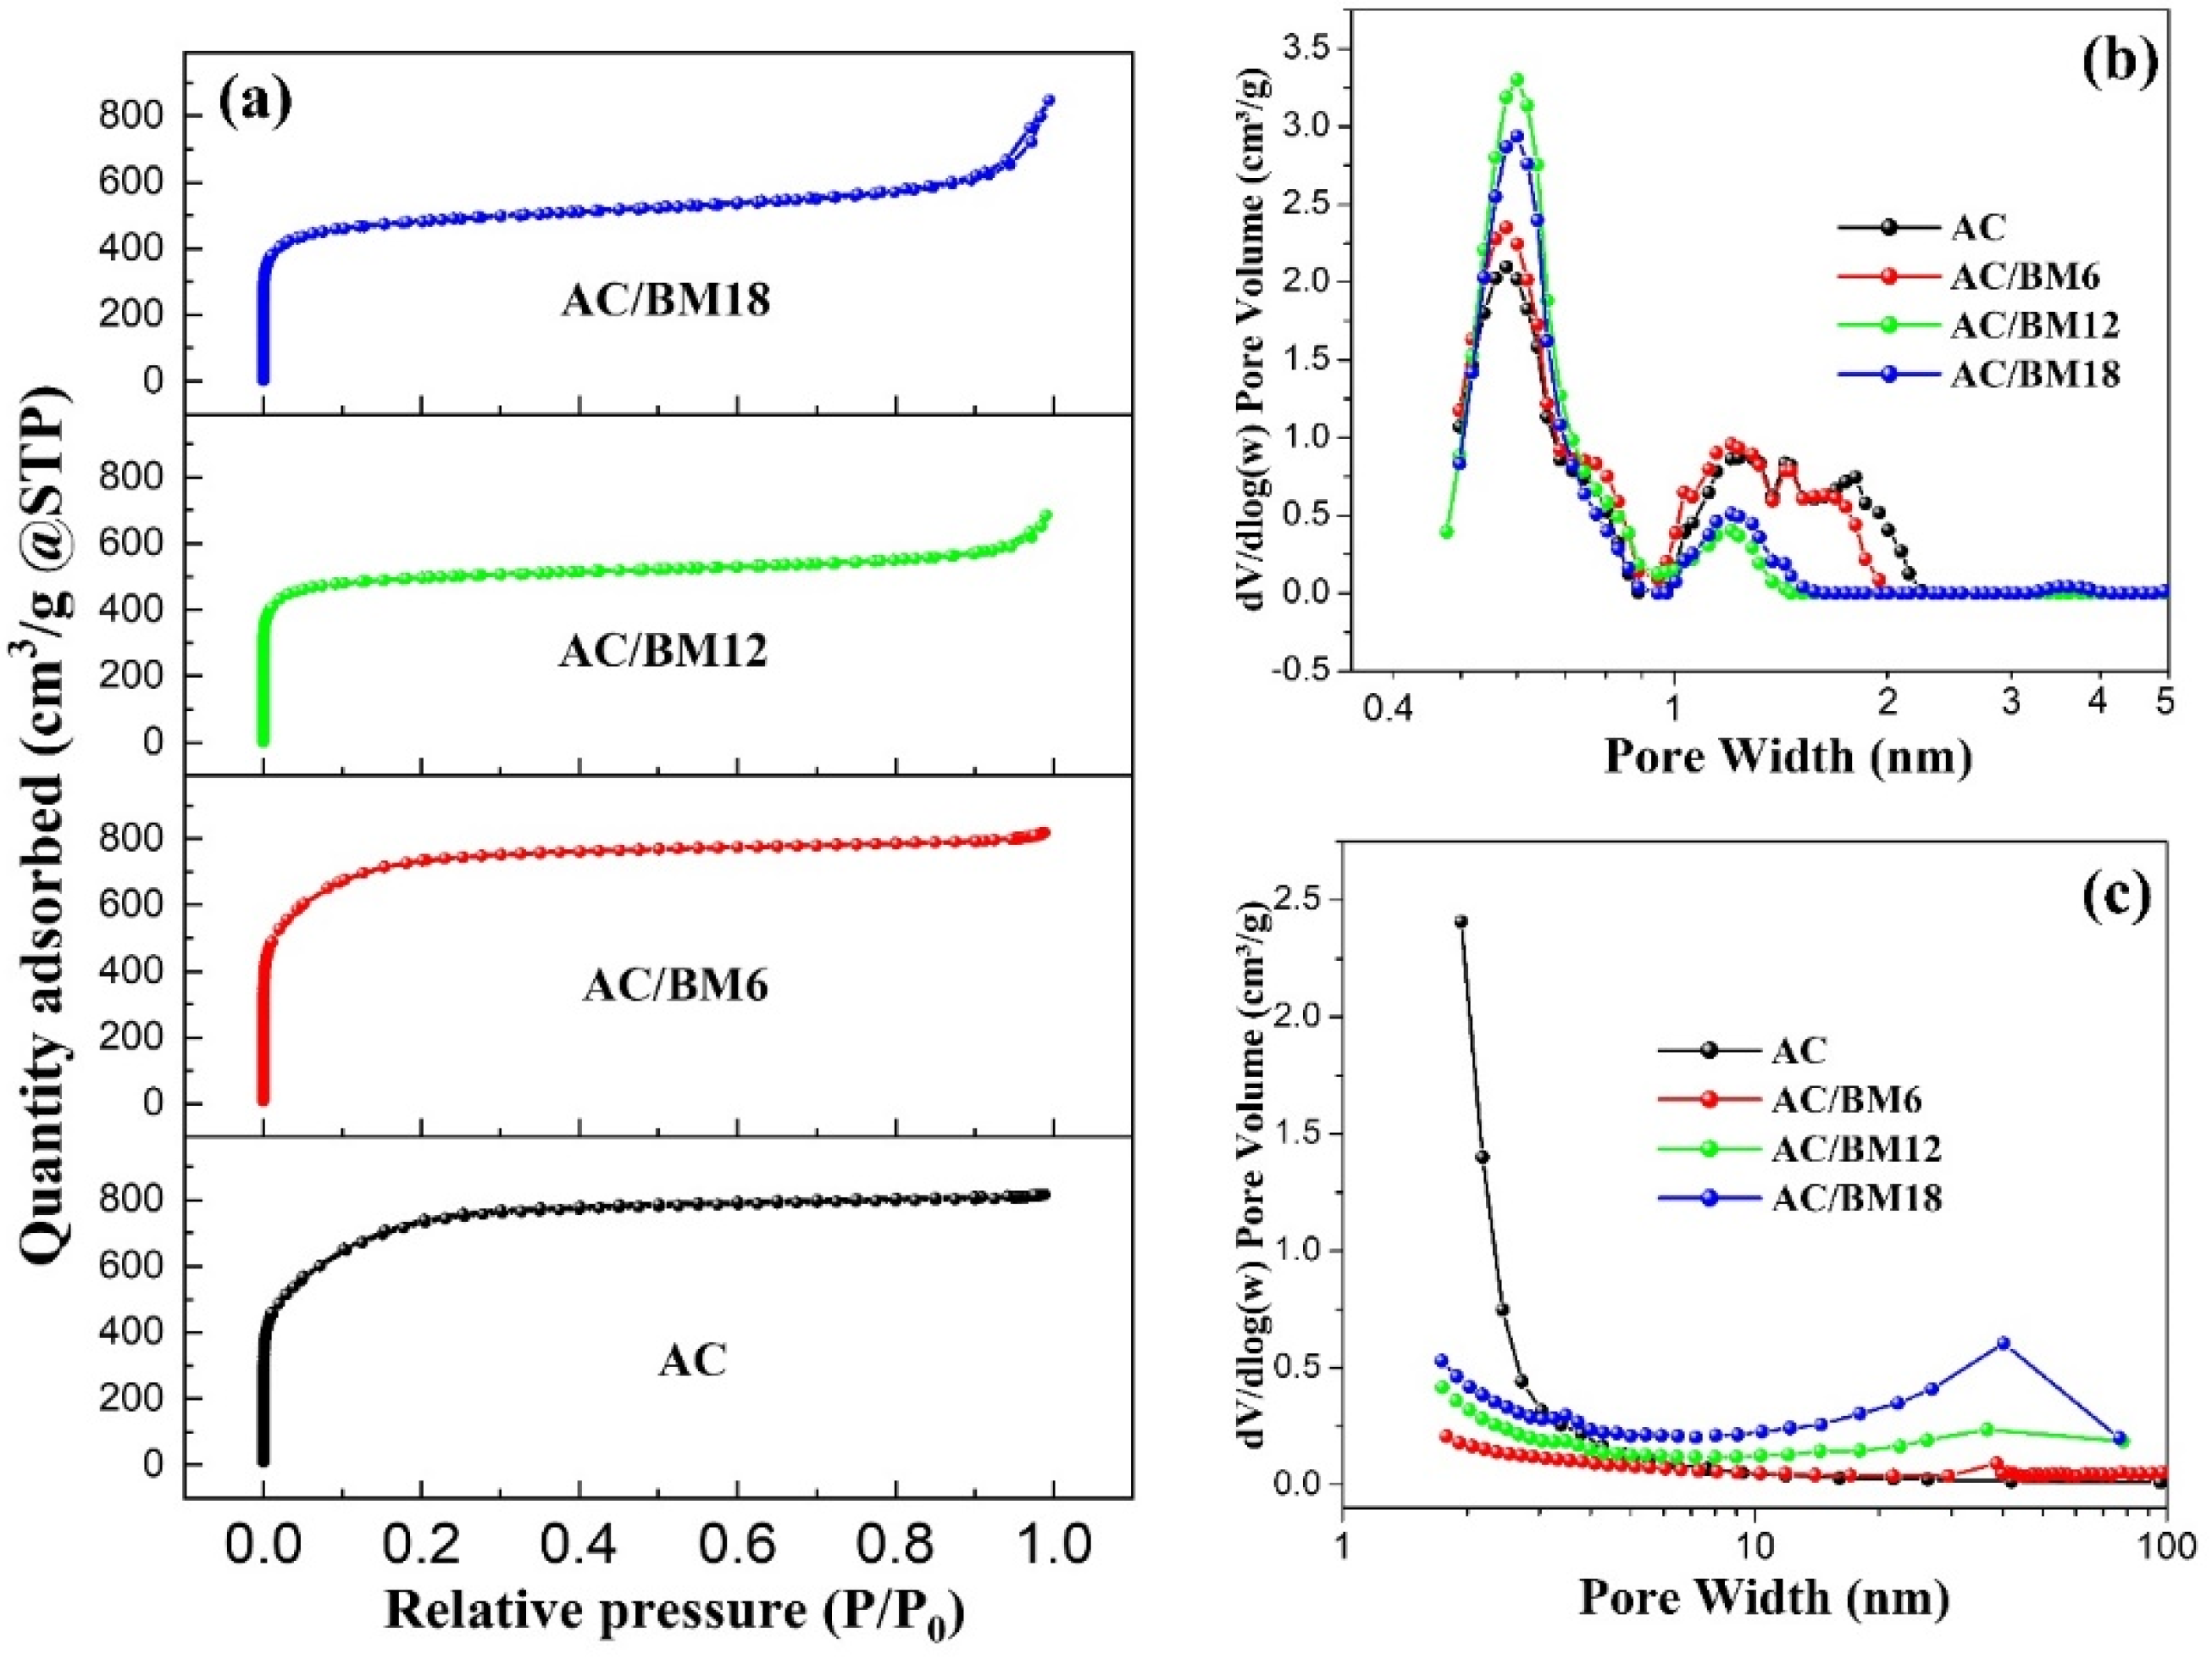
3.3. N2 Adsorption–Desorption
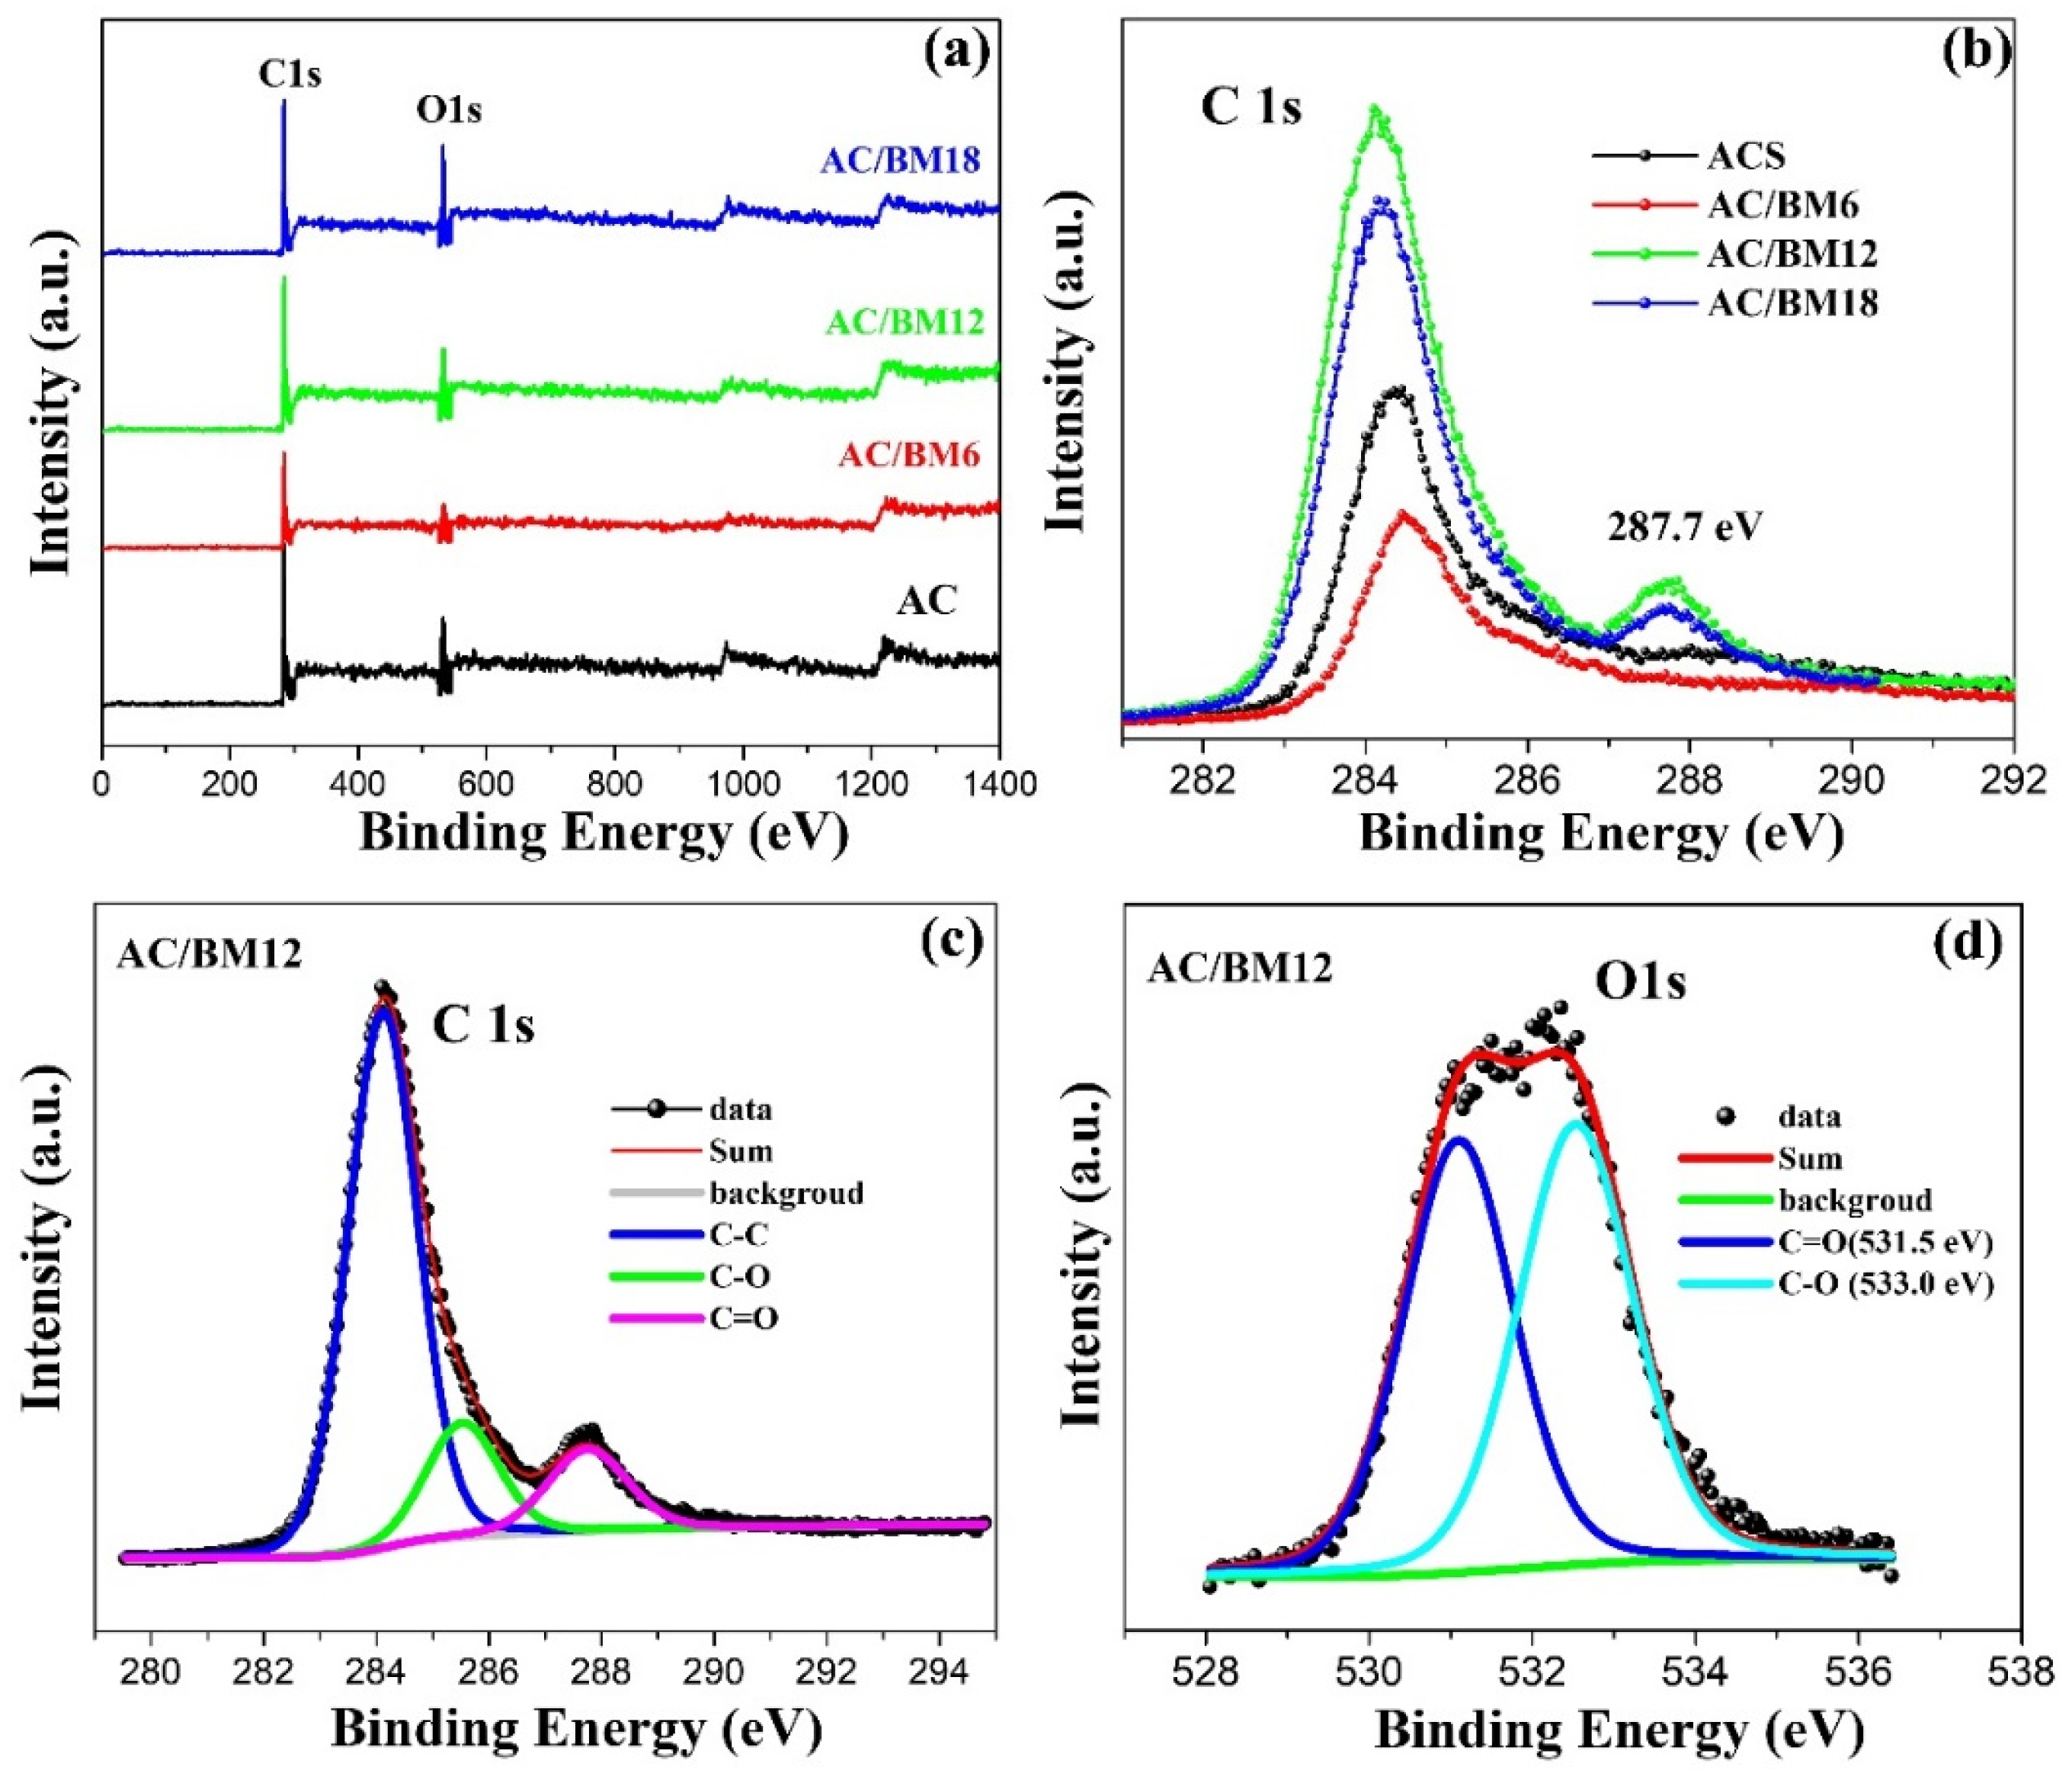
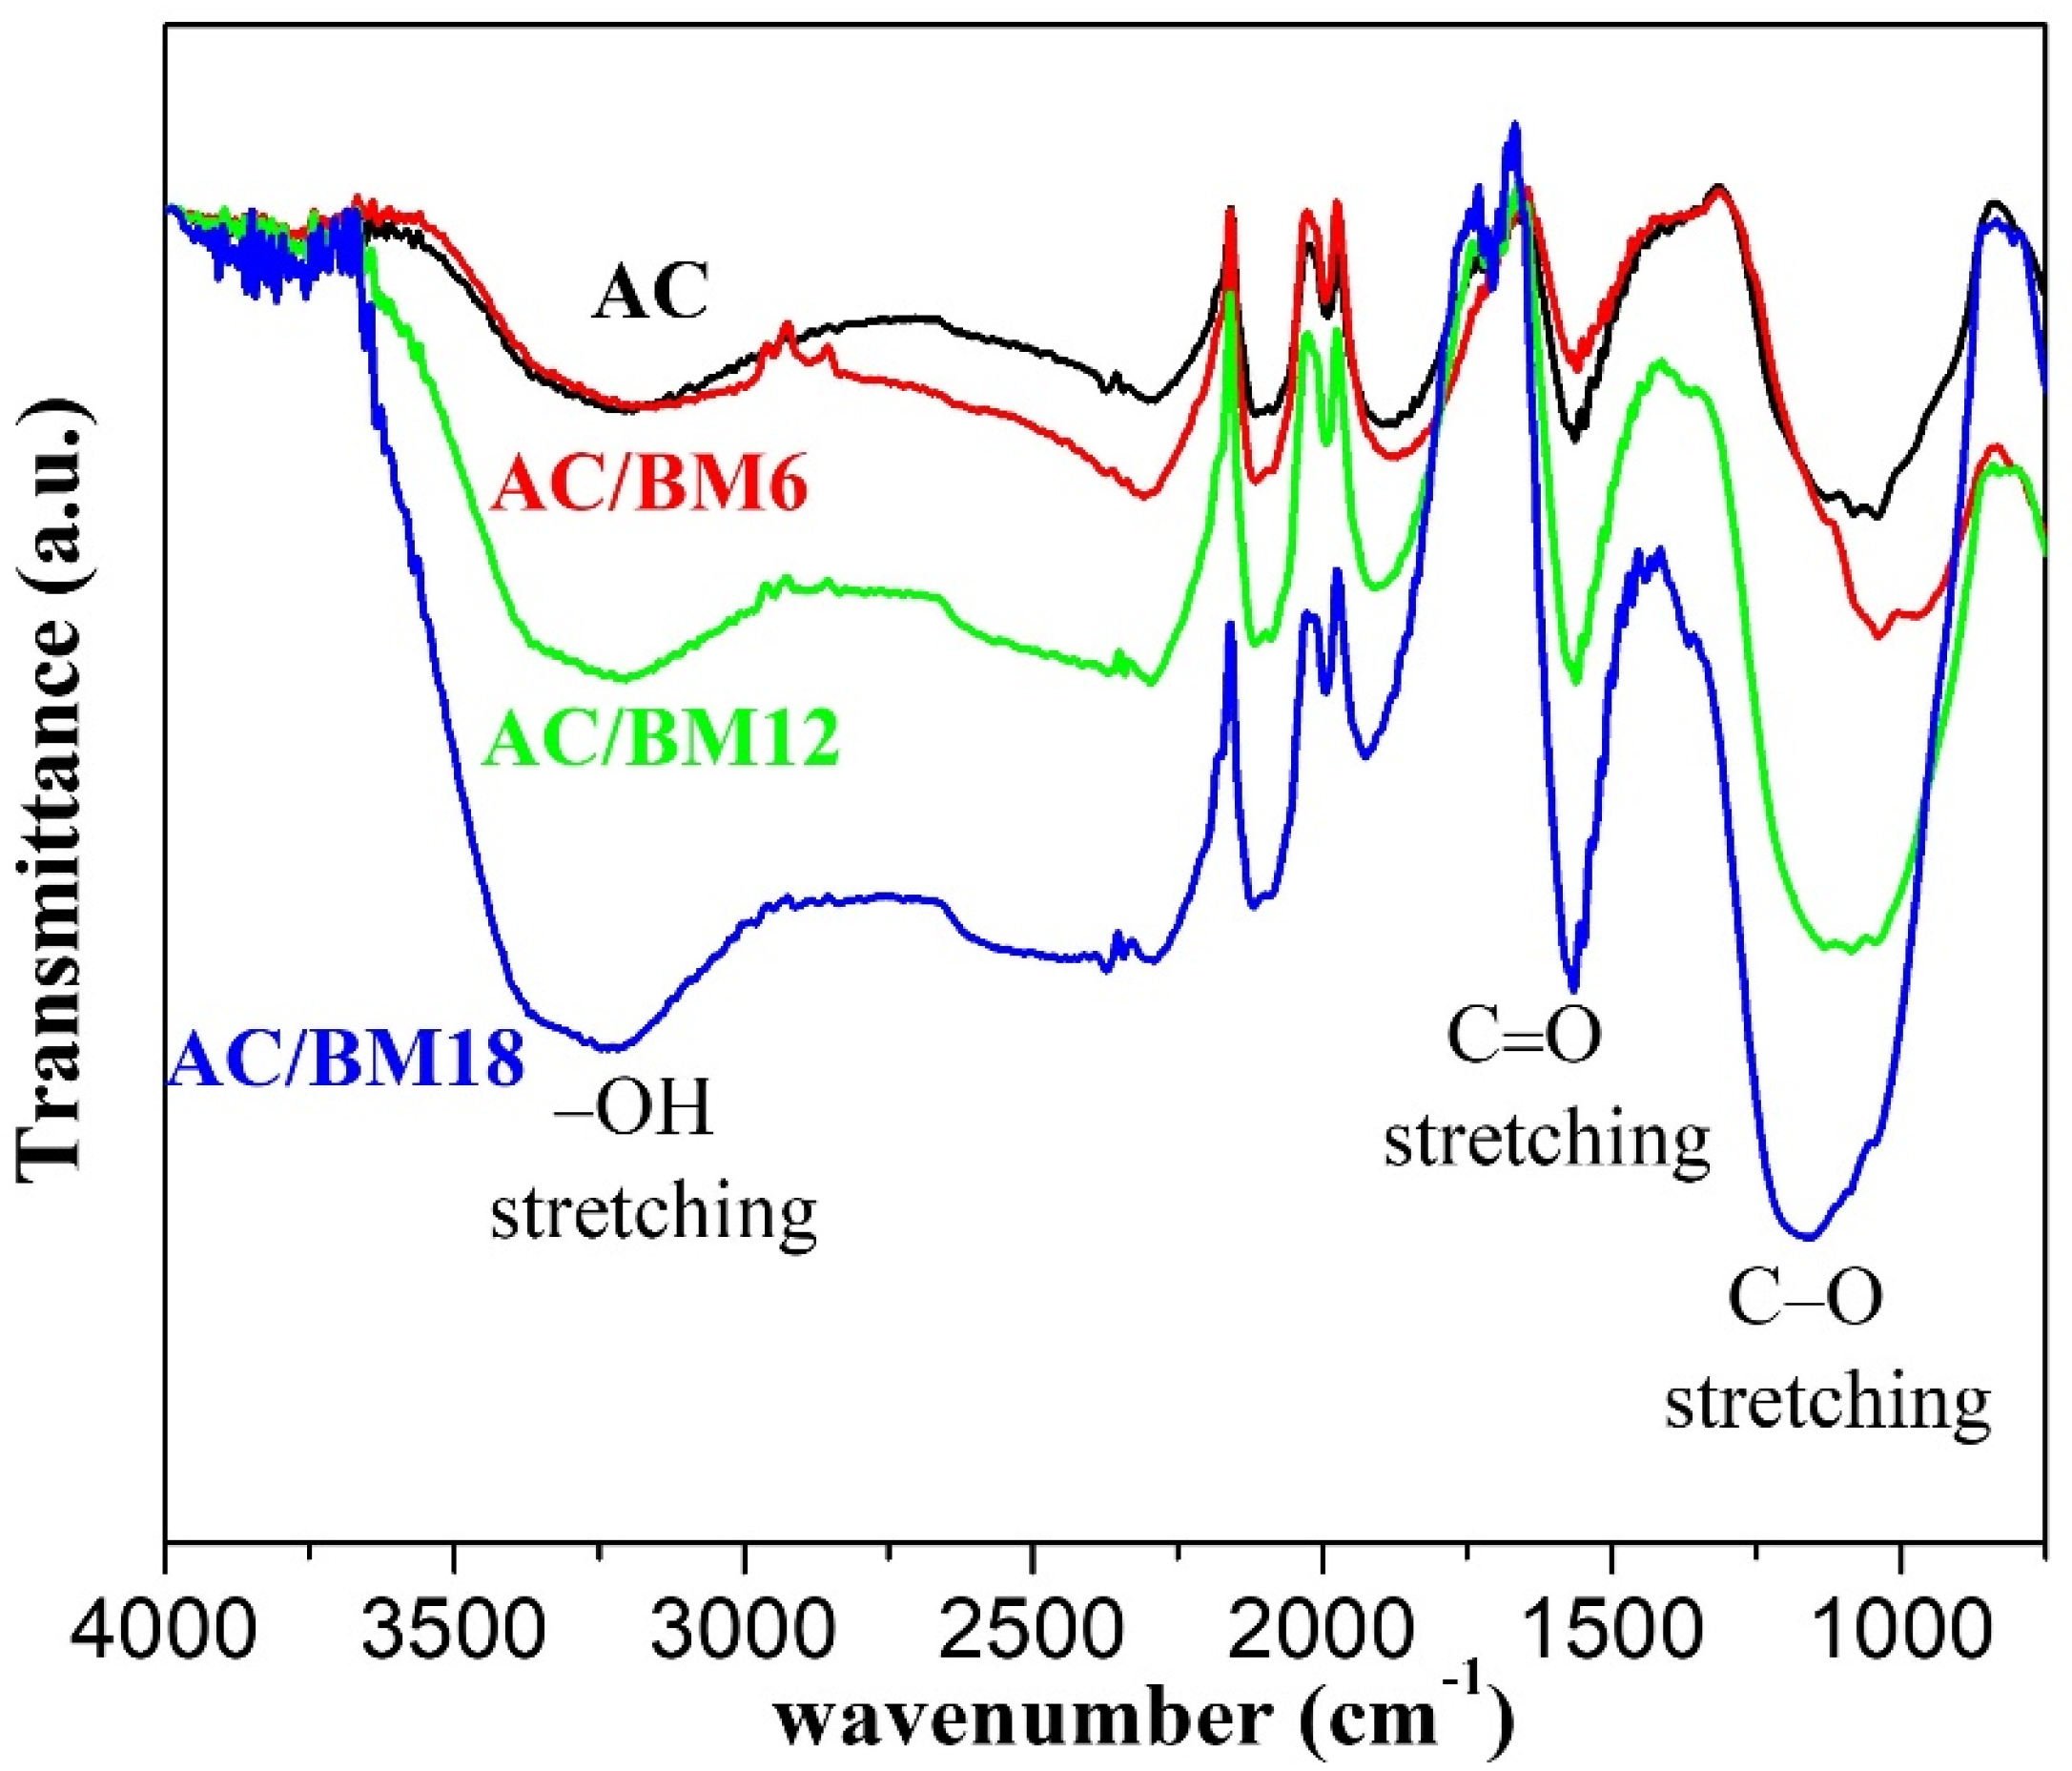
To further understand the microstructure of the prepared samples, the specific surface areas and pore size distributions were studied using an N2 adsorption–desorption technique. The adsorption-desorption isotherms of all samples are shown in Figure 4a. Isothermal curves of AC and AC/BM6 exhibit typical Type I curves, indicating the presence of large proportions of micro-porous material (<2 nm) in the low-pressure region. This type of isotherm represents materials that exhibit very small porous structures. In contrast, AC/BM12 and AC/BM18 samples display typical Type IV isotherms with H3 type hysteresis loops. This indicates the presence of micropores (<2 nm) and mesopores (2–50 nm) [42]. At a relative pressure of 0.8 in the adsorption branch of AC/BM12 and AC/BM18, the hysteresis loop at P/P0 = 0.80–0.99 exhibits a remarkable desorption process, indicating increased mesopore adsorption from carbon wedged-shape pores [42]. The BET surface areas were approximately 2631.9, 2592.4, 1580.9 and 1549.4 m2 g−1 for AC, AC/BM6, AC/BM12, and AC/BM18, respectively. As a result, the highest specific surface area was obtained in the AC sample because it had the greatest microporous volume. The specific surface area of the AC in this work is higher than in previous reports for activated carbon from sugarcane bagasse [22,37,43]. It is notable that the specific surface areas of the samples after HEBM decreased, which is attributed to a reduction of micropores by the HEBM process. These results are supported by previous research that demonstrated a decreased texture with milling time [44]. Figure 4b shows the pore size distribution of micropores using a DFT method. It was observed that the pore size distribution of all samples is similar, with a major peak ranging from 0.5–0.9 nm and another broad peak at around 1–2 nm. Moreover, the pore volume at a diameter of 0.6 nm for AC/BM12 was higher than in other samples. However, further increasing the milling speed, i.e., to AC/BM18, decreased the micropore volume of the sample due to the impact of HEBM [26]. Mesopore pore size distribution was studied using a BJH method and the results are shown in Figure 4c. At higher milling speeds, the mesopore volume of the HEBM samples (at about 10–50 nm) increased. The specific surface area, pore volume and average pore diameter results are summarized in Table 1. It is notable that the average pore diameter (Davg) of 0.48 nm for AC/BM12 is less than those of other samples.

3.4. XPS and FT–IR

XPS analysis was employed to further study the effect of the HEBM process on the elemental composition at the AC surface, as shown in Figure 5. A wide scan of the XPS spectra for AC, AC/BM6, AC/BM12 and AC/BM18 is shown in Figure 5a. C 1s (284.60 eV) and O 1s (532.3 eV) peaks are detected in all samples. Narrow XPS scans for the C 1s of all samples are presented in Figure 5b. The intensity of the C-C peak (284.6 eV) is maximal for the AC/BM12 sample. Moreover, increasing the milling speed to 1200 and 1800 rpm resulted in a peak at 287.7 eV, corresponding to the increased presence of C=O groups, indicating enhanced surface oxygen species in these samples [23,45]. These surface oxygen species can increase the wettability (hydrophilicity) of the electrolytes, promoting improved electron and ion adsorption between the surfaces, resulting in better electrochemical performance [9,46,47]. Table 2 summarizes the surface atomic composition and atomic ratios of oxygen and carbon atoms. The oxygen content increases through the HEBM process, from 13.3% to 20.5%, with the O/C ratio increased from 0.186 to 0.258. Moreover, the abundance of surface oxygen is not only a factor promoting hydrophilicity of the AC, but also enhances its electrochemical performance [23,46]. The high-resolution C 1s spectrum of the AC/BM12 sample was fitted with three peaks, as shown in Figure 5c. It consists of graphitic carbon (C-C, 284.6 eV), oxygen of carboxylic groups and/or water (C–O, 285.8 eV) and quinone groups along with carbonyl oxygen (C=O, 287.8 eV). Figure 5d shows the XPS spectrum of O 1s from AC/BM12, which can be fitted to binding energies of 531.5 eV for a C–O bond and at 533.0 eV for a C=O bond. The HEBM treatment induced mesopores in the structure of the AC samples (as shown in Figure 4c and Table 1). The higher mesopore volumes contributed to more oxygen-containing groups, as illustrated in Figure S4 in Supplementary Information. Therefore, the samples with large mesopore volume (AC/BM12 and AC/BM18) also exhibited the large O/C ratio (as shown in Table 2).
The results from XPS study were confirmed by the FT-IR measurements which show the functional groups of all AC samples, as shown in Figure 6. The oxygen-containing groups are indicated as the -OH stretching at 3100–3500 cm−1 [12], the C=O stretching at 1570 cm−1, and the C–O stretching at 1150 cm−1 [13]. It is clearly seen that the intensity of these absorption bands increases with increasing HBEM speed. This is supporting evidence to the FTIR analysis. However, the quantitative analysis of O/C ratio from the FTIR spectra is not straightforward but requires standard calibration. Therefore, we did not attempt to quantify the O/C ratio. It should be noted that there is a noticeable decrease of the C=O peak for the AC/BM6 sample compared to the AC sample. This could be the origin of the reduced O/C ratio of AC/CM6 in Table 2.
To confirm the wettability of AC after HEBM process, the dynamic water contact angle measurement was investigated for AC and AC/BM12 samples, as shown in Figure 7. The AC is hydrophobic with the contact angle of 101.9° from the beginning (0 s) to the end (15 s). Meanwhile, the AC/BM12 is hydrophilic. The water drop was absorbed instantly. This result clearly indicates an improved wettability of the AC/BM compared to the AC due to the presence of oxygen-containing groups after the HEBM.

3.5. Electrochemical Properties

To test the effect of KOH activation, the CBS:KOH ratios were varied as 1:1, 1:2, 1:3, 1:4, 1:5, and the electrochemical properties of AC powder from each condition were determined. These results are summarized in the Supporting Information (Figure S3). Optimal electrochemical performance was obtained when a CSB:KOH ratio of 1:4 was used. The highest specific capacitance, 107 F g−1, was attained at a current density of 0.5 A g−1. Therefore, this condition was selected for further improvement via the HEBM process. After HEBM treatment, the electrochemical properties of AC, AC/BM6, AC/BM12 and AC/BM18 electrodes were examined in a three-electrode system with a 3 M KOH electrolyte, and the results are shown in Figure 8a–f. A comparison of CV curves at a scan rate of 20 mV s−1 for AC, AC/BM6, AC/BM12 and AC/BM18 electrodes is given in Figure 8a. It can be clearly seen that the curves show nearly rectangular shapes, indicating that the capacitance mainly resulted from an EDLC behavior [48]. All electrode samples exhibit large storage of charges or ions on their surfaces and in pore sites. Clearly, the CV curve of AC/BM12 electrode contains a larger area than the others, indicating its greater specific capacitance. The highest specific capacitance for the AC/BM12 electrode can be attributed to an appropriate level of micropores and mesopores. Additionally, the average pore diameter of this sample is smaller than others (Table 1), suggesting that smaller pores facilitate better ion transport in EDLC electrodes [49]. Moreover, another reason for the high specific capacitance of AC/BM12 is possibly due to the pseudocapacitance from a Faradaic reaction of oxygen groups and compounds containing C=O and C–O groups [23,45]. The Faradaic pseudocapacitance at the surface by oxygen-containing groups of the electrode in electrolytes can be described by Equations (5) and (6) [9,47].
>C–O ↔ O + H+ + e (Phenolic)
>C=O + e ↔ >C–O (Ketone)
Galvanostatic charge-discharge measurements of AC, AC/BM6, AC/BM12 and AC/BM18 electrodes were examined at a current density of 0.5 A g−1, as shown in Figure 8b. These results indicate triangular-shaped charge/discharge curves for all electrodes, which confirmed electrical double layer formation [24,36]. The highest specific capacitance was found to be 256.6 F g−1 for the AC/BM12 electrode. Furthermore, the observed specific capacitance (Csp) values of the AC, AC/BM6, AC/BM12 and AC/BM18 electrodes were calculated at various current densities (0.5, 1, 2, 3, 4, 5, 10, 15, 20 and 30 A g−1) from the discharge curves using Equation (1), with results presented in Figure 8c. It was found that the Csp values decrease with increased current density. This occurs since the electrolyte ions cannot access the surface or pores quickly enough. Thus, there is a potential drop at higher current densities [31,50]. Interestingly, our results for the electrochemical performance are comparable with previous reports for other biomass-derived carbon sources for supercapacitors, as summarized in Table 3. The outstanding electrochemical performance from the present work demonstrates that AC/BM12 is a promising electrode material for energy storage devices.
The equivalent resistance and charge transfer resistance of all electrodes measured using an EIS technique at the frequency range of 0.1–105 Hz are presented as Nyquist plots in Figure 8d. These results reveal two overlapping semicircular arcs in the high frequency region and straight lines at low frequencies. At low-frequency range, the AC/BM12 appears to have high higher capacitance or lower resistance, which can contribute to the high performance of this electrode. The EIS curves were fitted using an equivalent circuit model, as shown in Figure 8d, where RS is the series resistance that is mainly related to the bulk electrolyte resistance, CPE is the constant phase element related to a charge accumulation at the electrode/electrolyte interface, Rct is the charge-transfer resistance, and W is the diffusion impedance, often called the Warburg Element [48,51]. All fitting parameters are summarized in Table S1 in Supplementary Information. HEBM reduced the particle sizes and induced graphitization, leading to higher conductivity, and thus decreased Rs values of electrodes [40,41]. The AC/BM18 electrode possesses the smallest RS and Rct, suggesting that smaller particles and larger mesopores facilitate ion-transport in EDLC electrodes [23,24,50]. However, the small RS and Rct are not the only factor necessary for high specific capacitance. Other parameters play a role in determining the capacitance, such as the effective ohmic resistance of the electrolyte and the charge transfer resistance at the interface, which depend on surface area, pore size distribution and surface chemical composition, among others. Furthermore, the specific capacitance retention at a 5 A g−1 current density remains more than 90% in all sample electrodes after 3000 cycles, as shown Figure 8e, indicating good cycling stability for all samples. The energy density (E) and power density (P) of all samples were calculated using Equations (3) and (4), respectively. Figure 8f shows the energy density versus power density curve in Ragone plots. The results show that the AC/BM12 electrode exhibits the highest energy density, 8.91 W h kg−1, and the highest power density, 4.98 kW kg−1.
Table 3. Comparison of the properties of various biomass-derived carbon sources used in supercapacitors.
MaterialSpecific Surface Area (m2 g−1)Specific Capacitance (F g−1)Scan Rate/Current DensityElectrolytesCell (3E/2E)Ref.
Bamboo14721460.2 A g−1EMIM TFSI2E[52]
Corns stalks5402131 A g−16 M KOH3E[53]
Wastepaper4161802 mV s−16 M KOH3E[54]
Banana fibers1097740.5 A g−11 M Na2SO43E[55]
Coconut shells18742681 A g−16 M KOH3E[56]
Rice husks26961121 A g−11 M Na2SO43E[57]
Corn stalk core23501401 A g−13 M KOH3E[10]
Corn silk22851601 A g−16 M KOH2E[58]
Rice straw3961121 A g−11 M H2SO43E[57]
Pistachio shells100912510 mV s−11 M HNO33E[59]
Beer lees35601881 mA cm−20.1 M H2SO43E[60]
Natural wood29252002 mV s−16 M KOH3E[61]
Onion peels-1270.75 A g−11 M H2SO42E[62]
Sugarcane bagasse6842160.2 A g−12 M KOH3E[22]
Sugarcane bagasse14371860.5 A g−16 M KOH2E[23]
Sugarcane bagasse12072280.2 A g−16 M KOH2E[24]
Sugarcane bagasse1150–26322570.5 A g−13 M KOH3EThis work
1100.25 A g−11 M LiPF62EThis work

3.6. Coin Cell Devices

To demonstrate a practical application of our AC/BM12 sample for a supercapacitor device, we fabricated coin cells using the synthesized materials as electrodes. Symmetrical electrodes for coin-cells were assembled with a 1 M LiPF6 electrolyte to increase the energy density of these devices. This is due to its larger voltage window as the energy density of a supercapacitor is equivalent to the square of the voltage. Figure 9a shows a schematic diagram of a coin cell assembly using an AC/BM12 electrode. It also shows an image of the coin cell connected to an LED, demonstrating its feasibility in a real application. The cyclic voltammograms converted from the current response at CV at scan rates of 2, 5, 10 and 20 mV s−1 (Figure 9b) indicate that the CV curves of the sample remained in the form of an ideal rectangular shape, between 0.3 V and 2.7 V. Galvanostatic charge-discharge curves at various current densities of 0.25, 0.50, 1.0, 2.0 and 3.0 A g−1 are shown in Figure 9c. The specific capacitance of AC/BM12 in a 1 M LiPF6 electrolyte is 110 F g−1 at 0.25 A g−1 and 27.4 F g−1 at 3.0 A g−1. Moreover, Figure 9d shows an excellent capacitance retention of 94.3% after 1000 cycles at a 1.0 A g−1 current density for this sample. Figure 9e shows Ragone plots of AC/BM12 in a 1 M LiPF6 organic electrolyte compared with various porous carbons from sugarcane bagasse. The AC/BM12 electrode in 1 M LiPF6 has an energy density of 27.9 W h kg−1 at a power density of 204.30 W kg−1. It can be seen that the performance of this material is much higher than previously reported. These results show that the AC/BM12 material is a promising electrode material for high performance supercapacitors.

4. Conclusions

In summary, we fabricated AC from sugarcane bagasse with improved electrochemical performance using an HEBM treatment. The effect of milling speed on carbon structure, morphology, porosity, surface chemical groups of the AC/BM samples was closely related to the electrochemical properties. It was found that the AC sample ball milled at 1200 rpm (AC/BM12) displayed excellent electrochemical properties with the highest specific capacitance, 257 F g−1, at a current density 0.5 A g−1. Moreover, the capacitance retention of this sample was 93.5% after a 3000-cycle test at a current density of 5 A g−1. The reason for the high specific capacitance of AC/BM12 can be attributed to an increased level of mesopores as well as the presence of a large number of micropores in its structure. Furthermore, the HEBM process induced additional surface functional groups, namely, C=O and C–O, which provided Faradaic pseudocapacitance and abundant adsorption sites for electrolyte ions. These improved the electrochemical performance of the AC/BM12 electrode. Additionally, the AC/BM12 electrodes were assembled in a symmetric coin cell supercapacitor using a LiPF6 electrolyte. The device displayed a specific capacitance of 110 F g−1 with an energy density of 27.9 W h kg−1. An effective HEBM treatment can decrease particle sizes and improve surface chemical groups, which enhanced capacitance. These outstanding electrochemical properties confirm that AC/BM12 is a promising electrode material for supercapacitor applications.

Supplementary Materials

The following supporting information can be downloaded at: https://www.mdpi.com/article/10.3390/nano12203555/s1, Figure S1: TGA and DTG curves of sugarcane bagasse powder under argon flow using a heating rate 10 °C min−1, Figure S2: The XRD patterns and Raman spectra of CSB and AC samples, Figure S3: (a) CV curves at a scan rate of 20 mV s−1, (b) GCD curves at a current density of 0.5 A g−1, (c) specific capacitance (Csp) at various scan rate and (d) specific capacitance (Csp) at various current densities for AC samples, Figure S4: A schematic illustration for the effect of HEBM on the mesopores and the induced oxygen-containing groups of the AC samples., Table S1: Fitting parameters of AC, AC/BM6, AC/BM12 and AC/BM18 electrodes from the Nyquist plots in Figure 8d. Refs. [32,33,34,35] cited in Supplementary Materials.

Author Contributions

Formal analysis, L.W.; Investigation, L.W.; Methodology, L.W. and S.S.; Project administration, S.P.; Resources, S.M.; Software, N.C. and E.S.; Supervision, S.P.; Validation, S.P.; Writing—original draft, L.W. and S.S.; Writing—review and editing, S.P. All authors have read and agreed to the published version of the manuscript.

Funding

This work has received scholarship under the Post-Doctoral Training Program (PD2565–15) from Khon Kaen University, Thailand, and the National Research Council of Thailand (NRCT) (N42A650237).

Institutional Review Board Statement

Not applicable.

Informed Consent Statement

Not applicable.

Data Availability Statement

The data presented in this study are available on request from the corresponding author.

Conflicts of Interest

The authors declare no conflict of interest.

References

  1. Ahmed, M.M.M.; Imae, T. Chapter 10—Graphene-Based Nanolayers Toward Energy Storage Device. In Nanolayer Research; Imae, T., Ed.; Elsevier: Amsterdam, The Netherlands, 2017; pp. 353–389. [Google Scholar]
  2. Simon, P.; Gogotsi, Y.; Dunn, B. Where Do Batteries End and Supercapacitors Begin? Science 2014, 343, 1210–1211. [Google Scholar] [CrossRef] [PubMed] [Green Version]
  3. Zhao, C.; Zheng, W. A Review for Aqueous Electrochemical Supercapacitors. Front. Energy Res. 2015, 3, 23. [Google Scholar] [CrossRef] [Green Version]
  4. Burke, A. Ultracapacitors: Why, how, and where is the technology. J. Power Sources 2000, 91, 37–50. [Google Scholar] [CrossRef] [Green Version]
  5. Vix-Guterl, C.; Saadallah, S.; Jurewicz, K.; Frackowiak, E.; Reda, M.; Parmentier, J.; Patarin, J.; Beguin, F. Supercapacitor electrodes from new ordered porous carbon materials obtained by a templating procedure. Mater. Sci. Eng. B 2004, 108, 148–155. [Google Scholar] [CrossRef]
  6. Frackowiak, E. Carbon materials for supercapacitor application. Phys. Chem. Chem. Phys. 2007, 9, 1774–1785. [Google Scholar] [CrossRef]
  7. Laheäär, A.; Kurig, H.; Jänes, A.; Lust, E. LiPF6 based ethylene carbonate–dimethyl carbonate electrolyte for high power density electrical double layer capacitor. Electrochim. Acta 2009, 54, 4587–4594. [Google Scholar] [CrossRef]
  8. Azam, M.A.; Jantan, N.H.; Dorah, N.; Seman, R.N.A.R.; Manaf, N.S.A.; Kudin, T.I.T.; Yahya, M.Z.A. Activated carbon and single-walled carbon nanotube based electrochemical capacitor in 1 M LiPF6 electrolyte. Mater. Res. Bull. 2015, 69, 20–23. [Google Scholar] [CrossRef]
  9. Liu, H.; Song, H.; Chen, X.; Zhang, S.; Zhou, J.; Ma, Z. Effects of nitrogen- and oxygen-containing functional groups of activated carbon nanotubes on the electrochemical performance in supercapacitors. J. Power Sources 2015, 285, 303–309. [Google Scholar] [CrossRef]
  10. Yu, K.; Zhu, H.; Qi, H.; Liang, C. High surface area carbon materials derived from corn stalk core as electrode for supercapacitor. Diam. Relat. Mater. 2018, 88, 18–22. [Google Scholar] [CrossRef]
  11. Volperts, A.; Dobele, G.; Zhurinsh, A.; Vervikishko, D.; Shkolnikov, E.; Ozolinsh, J. Wood-based activated carbons for supercapacitor electrodes with a sulfuric acid electrolyte. New Carbon Mater. 2017, 32, 319–326. [Google Scholar] [CrossRef]
  12. Sudhan, N.; Subramani, K.; Karnan, M.; Ilayaraja, N.; Sathish, M. Biomass-Derived Activated Porous Carbon from Rice Straw for a High-Energy Symmetric Supercapacitor in Aqueous and Non-aqueous Electrolytes. Energy Fuels 2017, 31, 977–985. [Google Scholar] [CrossRef]
  13. Teo, E.Y.L.; Muniandy, L.; Ng, E.-P.; Adam, F.; Mohamed, A.R.; Jose, R.; Chong, K.F. High surface area activated carbon from rice husk as a high performance supercapacitor electrode. Electrochim. Acta 2016, 192, 110–119. [Google Scholar] [CrossRef] [Green Version]
  14. Jayachandran, M.; Kishore Babu, S.; Maiyalagan, T.; Rajadurai, N.; Vijayakumar, T. Activated carbon derived from bamboo-leaf with effect of various aqueous electrolytes as electrode material for supercapacitor applications. Mater. Lett. 2021, 301, 130335. [Google Scholar] [CrossRef]
  15. Haghighi Poudeh, L.; Berktas, I.; Ali, H.Q.; Saner Okan, B.; Yıldız, M. Toward Next-Generation Carbon-Based Materials Derived from Waste and Biomass for High-Performance Energy Applications. Energy Technol. 2020, 8, 2000714. [Google Scholar] [CrossRef]
  16. Lado, J.J.; Zornitta, R.L.; Vázquez Rodríguez, I.; Malverdi Barcelos, K.; Ruotolo, L.A.M. Sugarcane Biowaste-Derived Biochars as Capacitive Deionization Electrodes for Brackish Water Desalination and Water-Softening Applications. ACS Sustain. Chem. Eng. 2019, 7, 18992–19004. [Google Scholar] [CrossRef]
  17. Guo, Y.; Tan, C.; Sun, J.; Li, W.; Zhang, J.; Zhao, C. Porous activated carbons derived from waste sugarcane bagasse for CO2 adsorption. Chem. Eng. J. 2019, 381, 122736. [Google Scholar] [CrossRef]
  18. Mohamed, E.F.; El-Hashemy, M.A.; Abdel-Latif, N.M.; Shetaya, W.H. Production of sugarcane bagasse-based activated carbon for formaldehyde gas removal from potted plants exposure chamber. J. Air Waste Manag. Assoc. (1995) 2015, 65, 1413–1420. [Google Scholar] [CrossRef]
  19. Rath, P.C.; Patra, J.; Huang, H.-T.; Bresser, D.; Wu, T.-Y.; Chang, J.-K. Carbonaceous Anodes Derived from Sugarcane Bagasse for Sodium-Ion Batteries. ChemSusChem 2019, 12, 2302–2309. [Google Scholar] [CrossRef]
  20. Chen, W.; Wang, H.; Lan, W.; Li, D.; Zhang, A.; Liu, C. Construction of sugarcane bagasse-derived porous and flexible carbon nanofibers by electrospinning for supercapacitors. Ind. Crops Prod. 2021, 170, 113700. [Google Scholar] [CrossRef]
  21. Heidarinejad, Z.; Dehghani, M.H.; Heidari, M.; Javedan, G.; Ali, I.; Sillanpää, M. Methods for preparation and activation of activated carbon: A review. Environ. Chem. Lett. 2020, 18, 393–415. [Google Scholar] [CrossRef]
  22. Sarkar, S.; Arya, A.; Gaur, U.K.; Gaur, A. Investigations on porous carbon derived from sugarcane bagasse as an electrode material for supercapacitors. Biomass Bioenergy 2020, 142, 105730. [Google Scholar] [CrossRef]
  23. Wang, X.; Cao, L.; Lewis, R.; Hreid, T.; Zhang, Z.; Wang, H. Biorefining of sugarcane bagasse to fermentable sugars and surface oxygen group-rich hierarchical porous carbon for supercapacitors. Renew. Energy 2020, 162, 2306–2317. [Google Scholar] [CrossRef]
  24. Wei, B.; Wei, T.; Xie, C.; Li, K.; Hang, F. Promising activated carbon derived from sugarcane tip as electrode material for high-performance supercapacitors. RSC Adv. 2021, 11, 28138–28147. [Google Scholar] [CrossRef]
  25. Luan, Y.; Wang, L.; Guo, S.; Jiang, B.; Zhao, D.; Yan, H.; Tian, C.; Fu, H. A hierarchical porous carbon material from a loofah sponge network for high performance supercapacitors. RSC Adv. 2015, 5, 42430–42437. [Google Scholar] [CrossRef]
  26. Eguchi, T.; Kanamoto, Y.; Tomioka, M.; Tashima, D.; Kumagai, S. Effect of Ball Milling on the Electrochemical Performance of Activated Carbon with a Very High Specific Surface Area. Batteries 2020, 6, 22. [Google Scholar] [CrossRef] [Green Version]
  27. Li, W.; Liu, J.; Zhao, D. Mesoporous materials for energy conversion and storage devices. Nat. Rev. Mater. 2016, 1, 16023. [Google Scholar] [CrossRef]
  28. Fang, B.; Wei, Y.Z.; Kumagai, M. Modified carbon materials for high-rate EDLCs application. J. Power Sources 2006, 155, 487–491. [Google Scholar] [CrossRef]
  29. Zhou, X.; Wang, R.; Li, C.; Wang, X.; Wang, K.; Wang, Q. Effect of high-energy ball milling on the microstructure and properties of ultrafine gradient cemented carbides. Int. J. Appl. Ceram. Technol. 2020, 17, 2298–2306. [Google Scholar] [CrossRef]
  30. Augustyn, V.; Simon, P.; Dunn, B. Pseudocapacitive oxide materials for high-rate electrochemical energy storage. Energy Environ. Sci. 2014, 7, 1597–1614. [Google Scholar] [CrossRef] [Green Version]
  31. Hadjipaschalis, I.; Poullikkas, A.; Efthimiou, V. Overview of current and future energy storage technologies for electric power applications. Renew. Sustain. Energy Rev. 2009, 13, 1513–1522. [Google Scholar] [CrossRef]
  32. Manikandan, A.; Subramanian, K.; Kannaiyan, P. Effect of high energy ball milling on particle size and surface area of adsorbents for efficient loading of fertilizer. Asian J. Soil Sci. 2013, 8, 249–254. [Google Scholar]
  33. Hongo, T.; Yoshino, S.; Yamazaki, A.; Yamasaki, A.; Satokawa, S. Mechanochemical treatment of vermiculite in vibration milling and its effect on lead (II) adsorption ability. Appl. Clay Sci. 2012, 70, 74–78. [Google Scholar] [CrossRef]
  34. Meng, L.-Y.; Park, S.-J. Effect of heat treatment on CO2 adsorption of KOH-activated graphite nanofibers. J. Colloid Interface Sci. 2010, 352, 498–503. [Google Scholar] [CrossRef] [PubMed]
  35. Stoller, M.D.; Ruoff, R.S. Best practice methods for determining an electrode material’s performance for ultracapacitors. Energy Environ. Sci. 2010, 3, 1294–1301. [Google Scholar] [CrossRef]
  36. Zhao, J.; Lai, H.; Lyu, Z.; Jiang, Y.; Xie, K.; Wang, X.; Wu, Q.; Yang, L.; Jin, Z.; Ma, Y.; et al. Hydrophilic Hierarchical Nitrogen-Doped Carbon Nanocages for Ultrahigh Supercapacitive Performance. Adv. Mater. 2015, 27, 3541–3545. [Google Scholar] [CrossRef]
  37. Jain, A.; Tripathi, S.K. Nano-porous activated carbon from sugarcane waste for supercapacitor application. J. Energy Storage 2015, 4, 121–127. [Google Scholar] [CrossRef]
  38. Chang, B.; Yang, B.; Guo, Y.; Wang, Y.; Dong, X. Preparation and enhanced supercapacitance performance of porous carbon spheres with a high degree of graphitization. RSC Adv. 2015, 5, 2088–2095. [Google Scholar] [CrossRef]
  39. Li, B.; Nan, Y.; Zhang, P.; Song, X. Structural characterization of individual graphene sheets formed by arc discharge and their growth mechanisms. RSC Adv. 2016, 6, 19797–19806. [Google Scholar] [CrossRef]
  40. Kaniyoor, A.; Ramaprabhu, S. A Raman spectroscopic investigation of graphite oxide derived graphene. AIP Adv. 2012, 2, 032183. [Google Scholar] [CrossRef] [Green Version]
  41. Zhang, F.; Wang, K.-X.; Li, G.-D.; Chen, J.-S. Hierarchical porous carbon derived from rice straw for lithium ion batteries with high-rate performance. Electrochem. Commun. 2009, 11, 130–133. [Google Scholar] [CrossRef]
  42. Yang, C.; Zhang, J.; Han, S.; Wang, X.; Wang, L.; Yu, W.; Wang, Z. Compositional controls on pore-size distribution by nitrogen adsorption technique in the Lower Permian Shanxi Shales, Ordos Basin. J. Nat. Gas Sci. Eng. 2016, 34, 1369–1381. [Google Scholar] [CrossRef]
  43. Tran, T.; Phạm, V.T.; Quynh, B.; Thanh Cong, H.; Tam, D.; Thuan, V.; Bach, L.G. Production of Activated Carbon from Sugarcane Bagasse by Chemical Activation with ZnCl2: Preparation and Characterization Study. Res. J. Chem. Sci. 2016, 6, 42–47. [Google Scholar]
  44. Kumar, A.; Pande, U.; Banerjee, M.K. Effect of high energy ball milling on the structure of iron—Multiwall carbon nanotubes (MWCNT) composite. Adv. Mater. Res. 2017, 6, 245–255. [Google Scholar]
  45. Bleda-Martínez, M.J.; Lozano-Castelló, D.; Morallón, E.; Cazorla-Amorós, D.; Linares-Solano, A. Chemical and electrochemical characterization of porous carbon materials. Carbon 2006, 44, 2642–2651. [Google Scholar] [CrossRef] [Green Version]
  46. Guo, N.; Li, M.; Wang, Y.; Sun, X.; Wang, F.; Yang, R. Soybean Root-Derived Hierarchical Porous Carbon as Electrode Material for High-Performance Supercapacitors in Ionic Liquids. ACS Appl. Mater. Interfaces 2016, 8, 33626–33634. [Google Scholar] [CrossRef]
  47. Frackowiak, E.; Béguin, F. Carbon materials for the electrochemical storage of energy in capacitors. Carbon 2001, 39, 937–950. [Google Scholar] [CrossRef]
  48. You, X.; Misra, M.; Gregori, S.; Mohanty, A.K. Preparation of an Electric Double Layer Capacitor (EDLC) Using Miscanthus-Derived Biocarbon. ACS Sustain. Chem. Eng. 2018, 6, 318–324. [Google Scholar] [CrossRef]
  49. Tanaka, S.; Nakao, H.; Mukai, T.; Katayama, Y.; Miyake, Y. An Experimental Investigation of the Ion Storage/Transfer Behavior in an Electrical Double-Layer Capacitor by Using Monodisperse Carbon Spheres with Microporous Structure. J. Phys. Chem. C 2012, 116, 26791–26799. [Google Scholar] [CrossRef]
  50. Chatterjee, D.P.; Nandi, A.K. A review on the recent advances in hybrid supercapacitors. J. Mater. Chem. A 2021, 9, 15880–15918. [Google Scholar] [CrossRef]
  51. Zia, A.I.; Abdul Rahman, M.S.; Mukhopadhyay, S.C.; AlBahadly, I.H.; Yu, P.-L.; Gooneratne, C.; Kosel, J.; Taishan, L. MEMS based impedimetric sensing of phthalates. In Proceedings of the 2013 IEEE International Instrumentation and Measurement Technology Conference (I2MTC), Minneapolis, MN, USA, 6–9 May 2013; pp. 855–860. [Google Scholar]
  52. Tian, W.; Gao, Q.; Tan, Y.; Yang, K.; Zhu, L.; Yang, C.; Zhang, H. Bio-inspired beehive-like hierarchical nanoporous carbon derived from bamboo-based industrial by-product as a high performance supercapacitor electrode material. J. Mater. Chem. A 2015, 3, 5656–5664. [Google Scholar] [CrossRef]
  53. Wang, L.; Mu, G.; Tian, C.; Sun, L.; Zhou, W.; Yu, P.; Yin, J.; Fu, H. Porous Graphitic Carbon Nanosheets Derived from Cornstalk Biomass for Advanced Supercapacitors. ChemSusChem 2013, 6, 880–889. [Google Scholar] [CrossRef]
  54. Kalpana, D.; Cho, S.H.; Lee, S.B.; Lee, Y.S.; Misra, R.; Renganathan, N.G. Recycled waste paper—A new source of raw material for electric double-layer capacitors. J. Power Sources 2009, 190, 587–591. [Google Scholar] [CrossRef]
  55. Subramanian, V.; Luo, C.; Stephan, A.M.; Nahm, K.S.; Thomas, S.; Wei, B. Supercapacitors from Activated Carbon Derived from Banana Fibers. J. Phys. Chem. C 2007, 111, 7527–7531. [Google Scholar] [CrossRef]
  56. Hou, B. High Specific Surface Area Activated Carbon with Well-Balanced Micro/Mesoporosity for Ultrahigh Supercapacitive Performance. Int. J. Electrochem. Sci. 2016, 11, 9007–9018. [Google Scholar] [CrossRef]
  57. Ganesan, A.; Mukherjee, R.; Raj, J.; Shaijumon, M.M. Nanoporous rice husk derived carbon for gas storage and high performance electrochemical energy storage. J. Porous Mater. 2014, 21, 839–847. [Google Scholar] [CrossRef]
  58. Mitravinda, T.; Nanaji, K.; Anandan, S.; Jyothirmayi, A.; Chakravadhanula, V.S.K.; Sharma, C.S.; Rao, T.N. Facile Synthesis of Corn Silk Derived Nanoporous Carbon for an Improved Supercapacitor Performance. J. Electrochem. Soc. 2018, 165, A3369–A3379. [Google Scholar] [CrossRef]
  59. Wu, F.-C.; Tseng, R.-L.; Hu, C.-C.; Wang, C.-C. Effects of pore structure and electrolyte on the capacitive characteristics of steam- and KOH-activated carbons for supercapacitors. J. Power Sources 2005, 144, 302–309. [Google Scholar] [CrossRef]
  60. Lee, S.G.; Park, K.H.; Shim, W.G.; balathanigaimani, M.S.; Moon, H. Performance of electrochemical double layer capacitors using highly porous activated carbons prepared from beer lees. J. Ind. Eng. Chem. 2011, 17, 450–454. [Google Scholar] [CrossRef]
  61. Chen, L.; Ji, T.; Brisbin, L.; Zhu, J. Hierarchical Porous and High Surface Area Tubular Carbon as Dye Adsorbent and Capacitor Electrode. ACS Appl. Mater. Interfaces 2015, 7, 12230–12237. [Google Scholar] [CrossRef]
  62. Mehare, M.D.; Deshmukh, A.D.; Dhoble, S.J. Preparation of porous agro-waste-derived carbon from onion peel for supercapacitor application. J. Mater. Sci. 2020, 55, 4213–4224. [Google Scholar] [CrossRef]
  63. Rufford, T.E.; Hulicova-Jurcakova, D.; Khosla, K.; Zhu, Z.; Lu, G.Q. Microstructure and electrochemical double-layer capacitance of carbon electrodes prepared by zinc chloride activation of sugar cane bagasse. J. Power Sources 2010, 195, 912–918. [Google Scholar] [CrossRef]
Figure 1. A schematic illustration for the preparation of AC/BM.
Nanomaterials 12 03555 g001
Figure 2. (a) The XRD pattern and (b) Raman spectra of AC, AC/BM6, AC/BM12 and AC/BM18.
Nanomaterials 12 03555 g002
Figure 3. FESEM images of (a) AC, (b) AC/BM6, (c) AC/BM12, (d) AC/BM18 and (e) Zeta nanoparticle size analysis of AC/BM6, AC/BM12 and AC/BM18.
Nanomaterials 12 03555 g003
Figure 4. (a) N2 adsorption–desorption isothermal curves, (b) micropore-size distribution and (c) mesopore-size distribution of AC, AC/BM6, AC/BM12 and AC/BM18.
Nanomaterials 12 03555 g004
Figure 5. (a) Full spectrum of all samples, (b) comparison of the C 1s spectra of all samples, (c) fitting of C 1s spectrum and (d) fitting of O 1s spectrum for AC/BM12.
Nanomaterials 12 03555 g005
Figure 6. FT-IR spectra of the AC, AC/BM6, AC/BM12 and AC/BM18 samples.
Nanomaterials 12 03555 g006
Figure 7. Dynamic water contact angle measurement for AC and AC/BM12 samples at 0 s and 15 s after dropping water.
Nanomaterials 12 03555 g007
Figure 8. (a) CV curves at a scan rate of 20 mV s−1, (b) GCD curves at a current density of 0.5 A g−1, (c) specific capacitance (Csp) at various current densities, (d) Nyquist plots, (e) the cycling retention at 5 A g−1 and (f) Ragone plot of energy density and power density for AC, AC/BM6, AC/BM12 and AC/BM18 electrodes.
Nanomaterials 12 03555 g008
Figure 9. (a) a Schematic diagram of a fabricated coin cell powering an LED, (b) CV curves, (c) GCD curves, (d) the cycling retention at 1 A g−1 and (e) Ragone plot of energy density and power density of AC/BM12 in 1 M LiPF6 compared with various porous carbons from sugarcane bagasse in other reported data [22,23,24,63].
Nanomaterials 12 03555 g009
Table 1. Porous structural parameters of AC, AC/BM6, AC/BM12 and AC/BM18 samples.
SampleSBET (m2/g)Vtotal (cm3/g)Vmicro (cm3/g)Vmeso (cm3/g)Davg (nm)
AC2631.91.26440.63450.48140.60
AC/BM62592.41.26800.63890.35540.57
AC/BM121580.90.92070.63180.38170.48
AC/BM181549.71.02380.55080.70170.50
Table 2. Elemental composition of AC, AC/BM6, AC/BM12 and AC/BM18 samples.
SampleAtomic Concentration (%)O/C
C1sO1s
AC84.3315.670.186
AC/BM686.7313.270.153
AC/BM1282.2217.780.216
AC/BM1879.5220.480.258
Publisher’s Note: MDPI stays neutral with regard to jurisdictional claims in published maps and institutional affiliations.

