
Thermal and Rheological Characterization of Aqueous Nanofluids Based on Reduced Graphene Oxide (rGO) with Manganese Dioxide Nanocomposites (MnO2)
 ,
,  ,
,  ,
,  and
and
Abstract
:1. Introduction
2. Materials and Methods
2.1. Synthesis of MnO/rGO Nanocomposites
2.1.1. Synthesis of Graphene Oxide (GO)
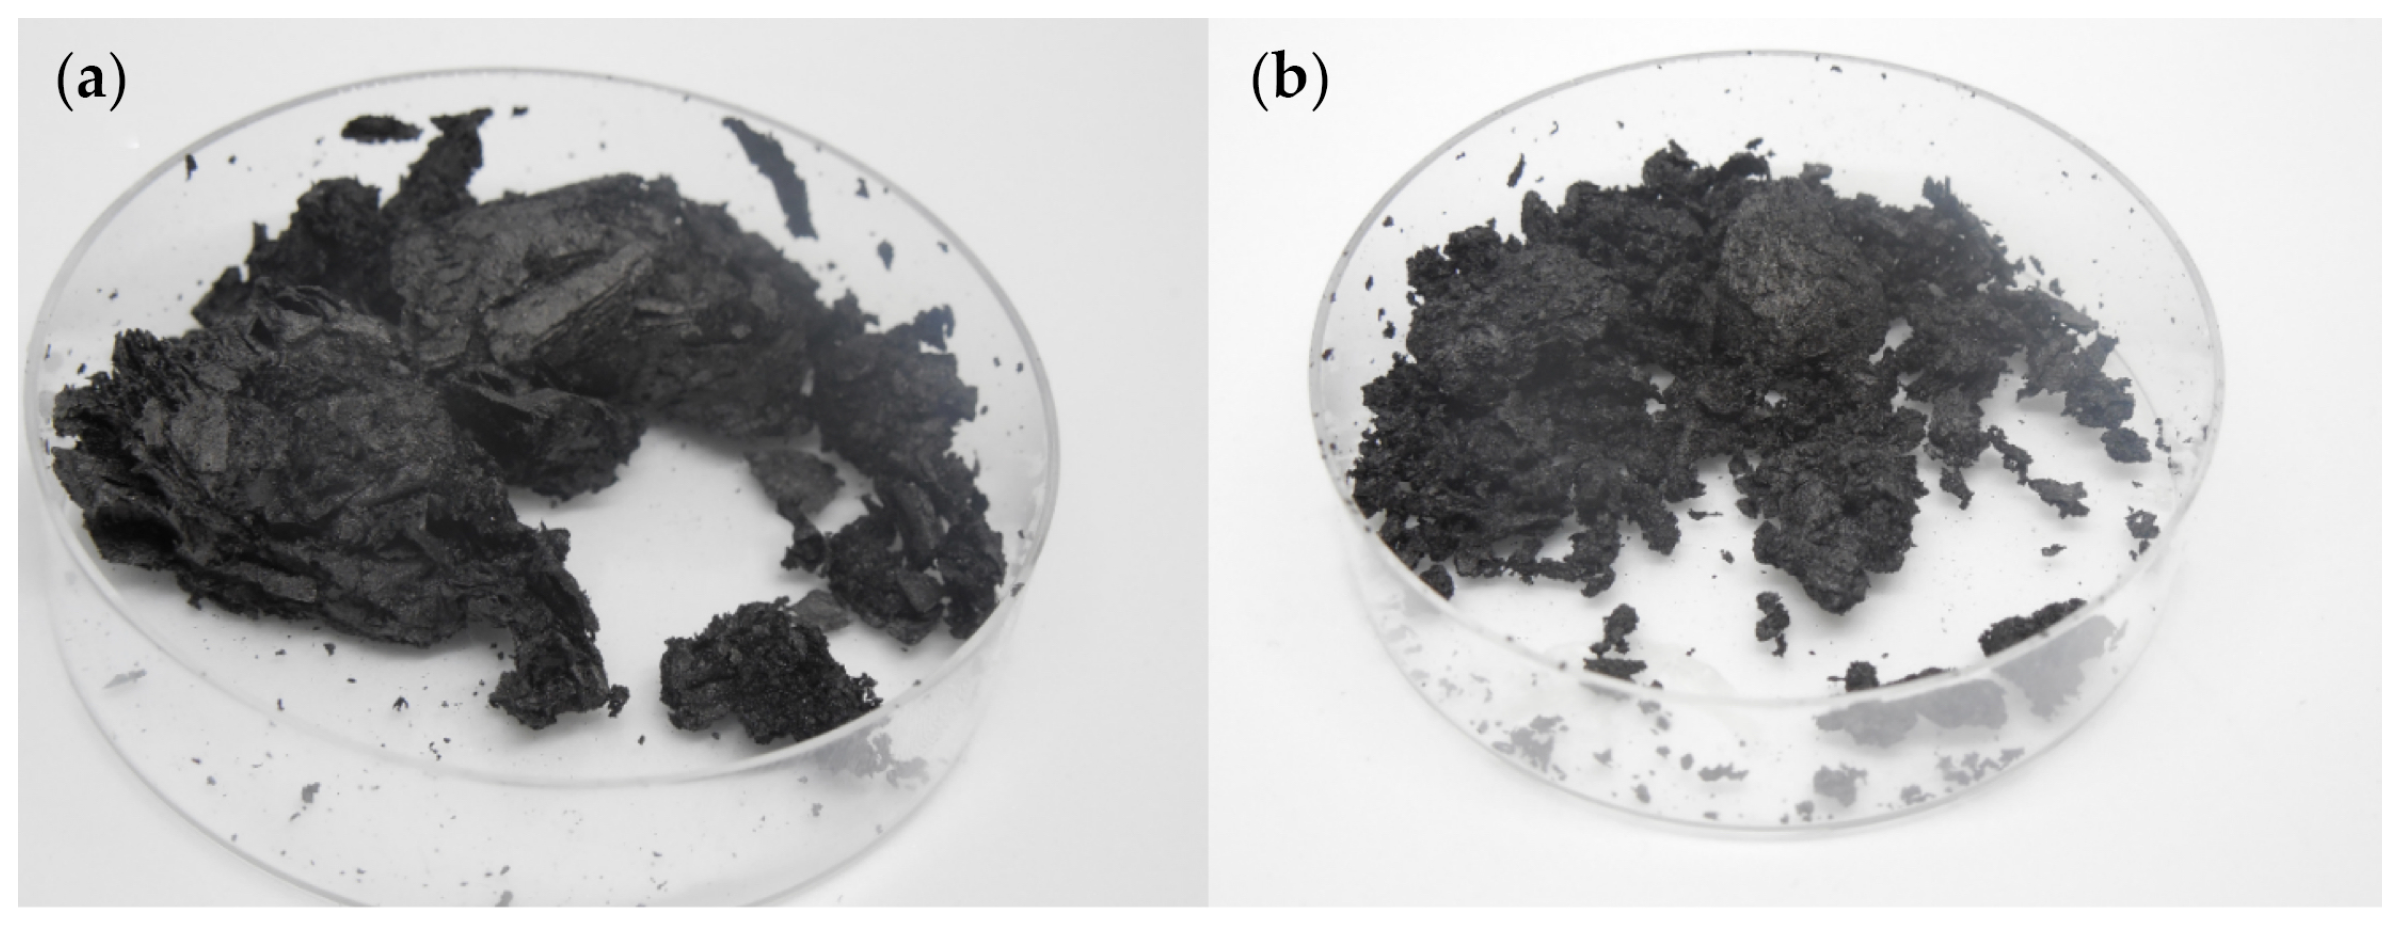
2.1.2. Synthesis of Hybrid Nanoparticles (MnO/rGO)
2.1.3. Nanocomposite Functionalization (MnOAsA/rGO)
2.2. Characterization of the Nanocomposite
2.3. Preparation of Nanofluids
2.4. Thermal and Rheological Characterization of Nanofluids
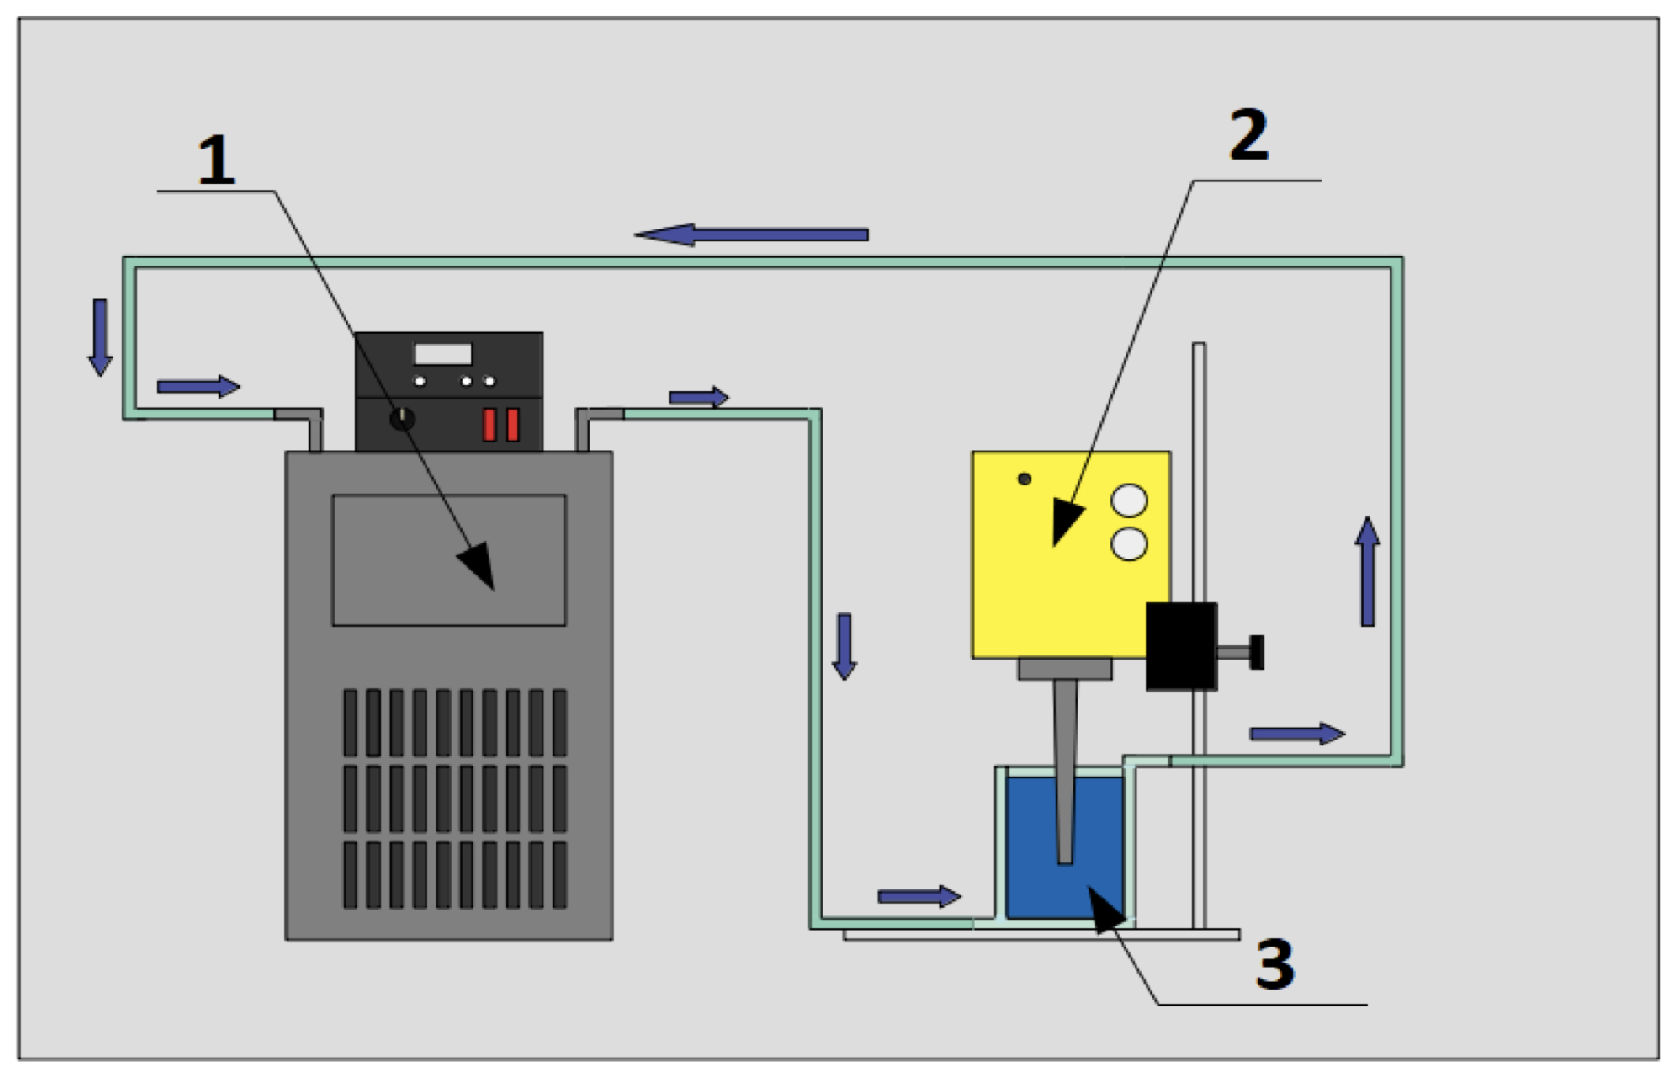
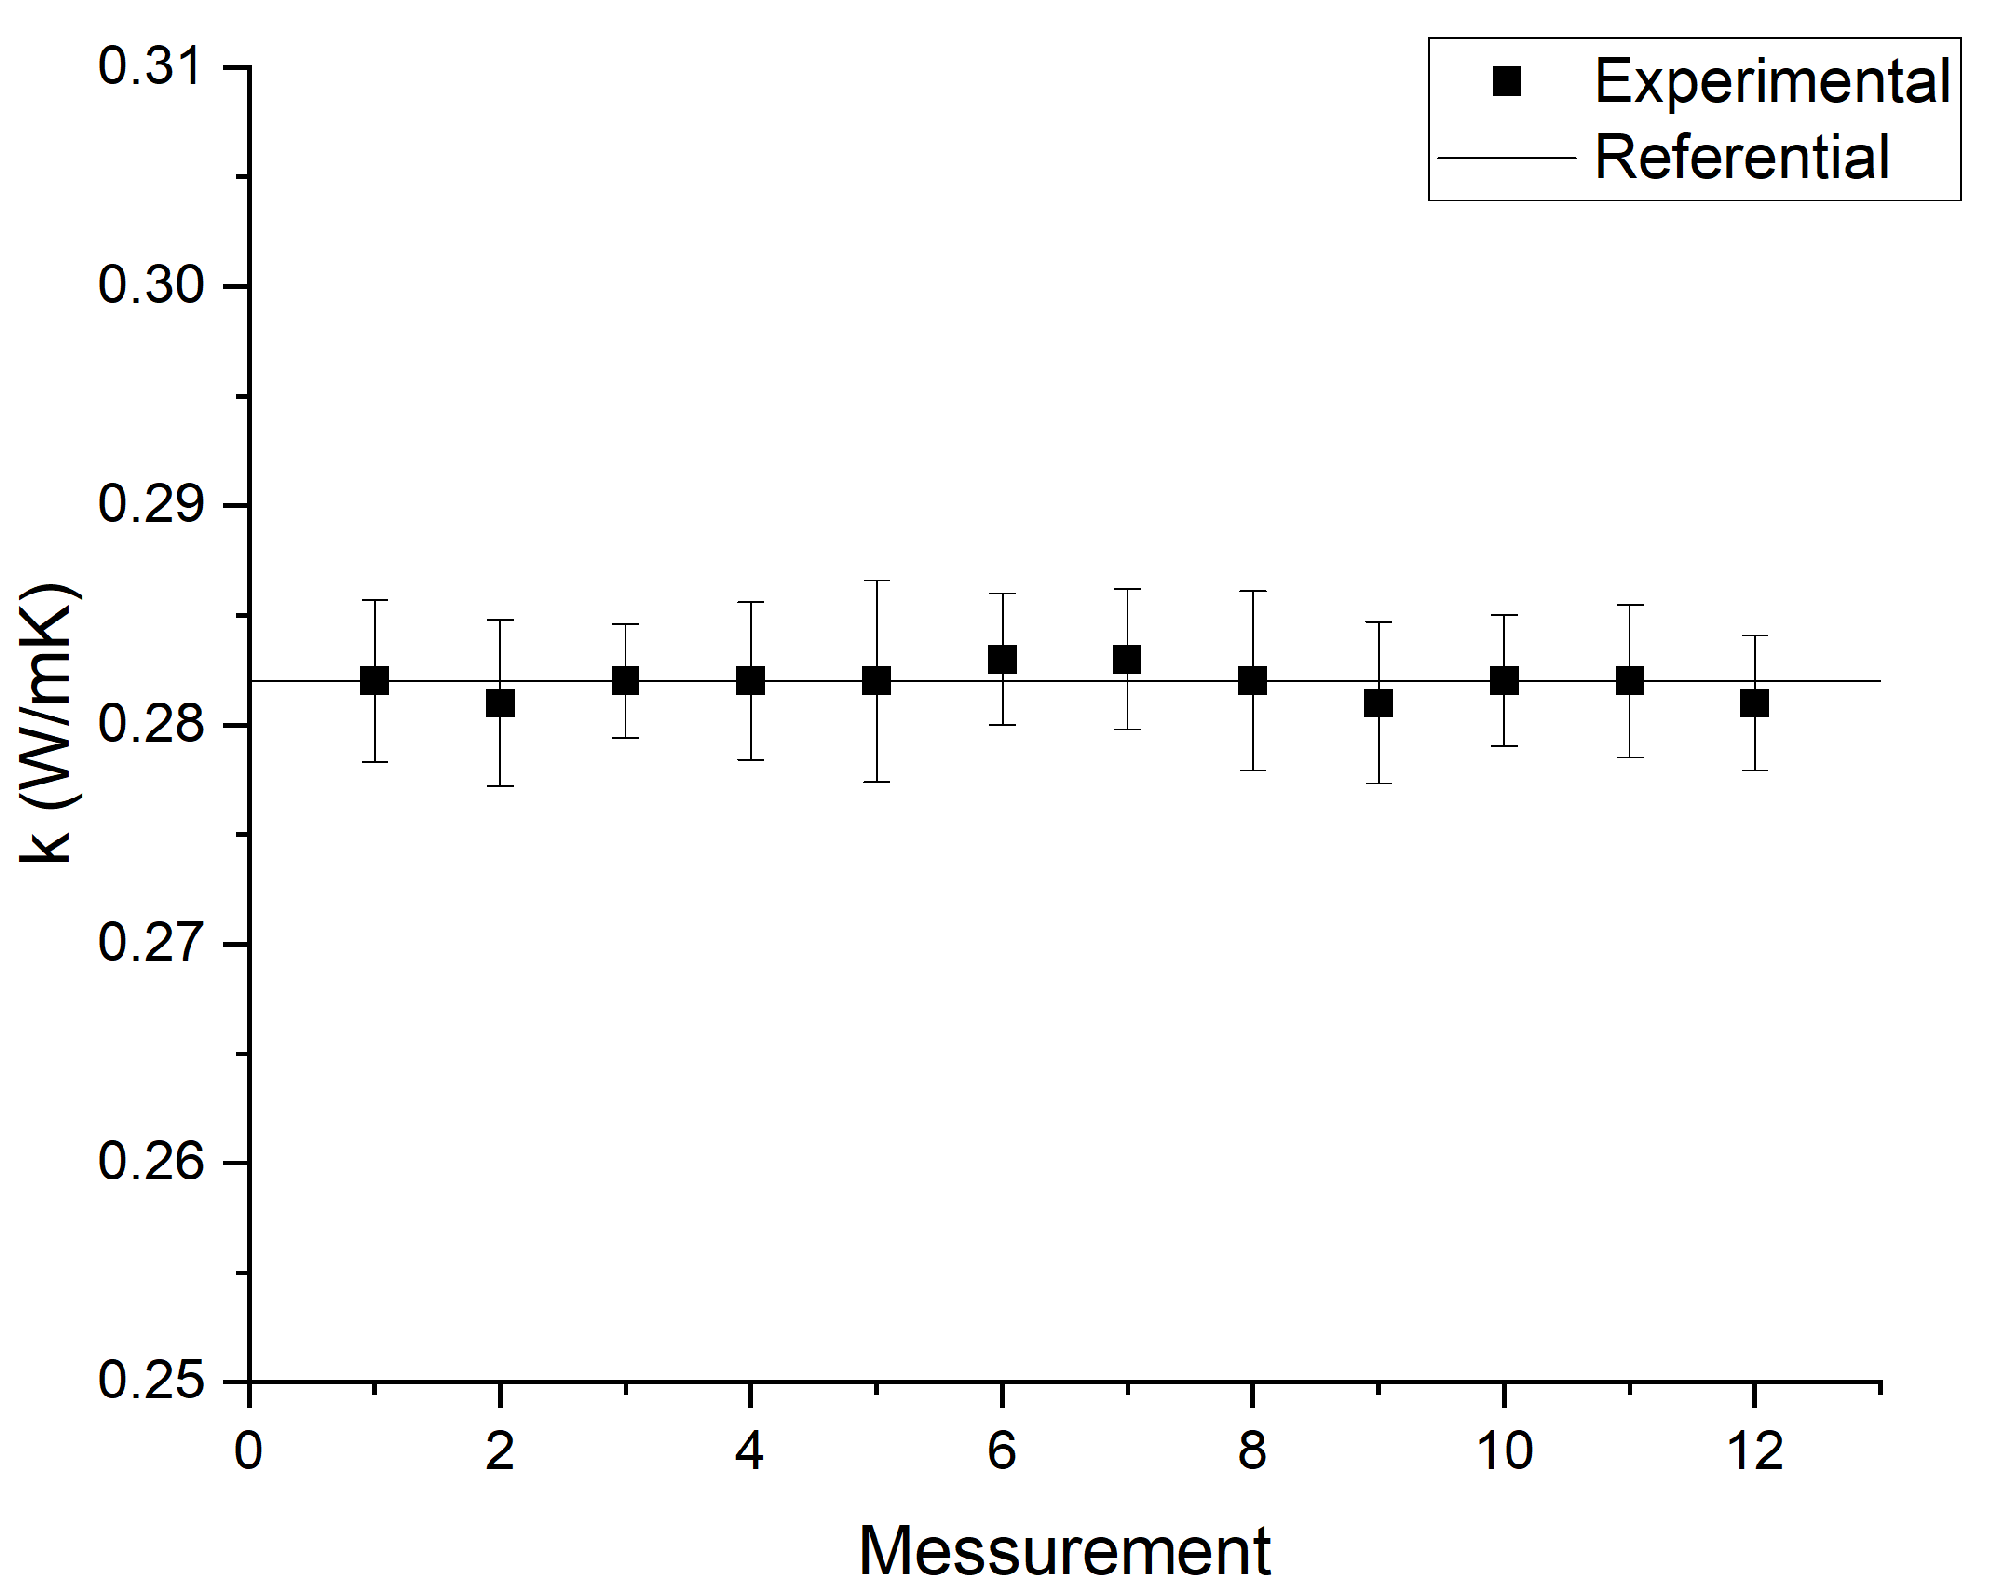
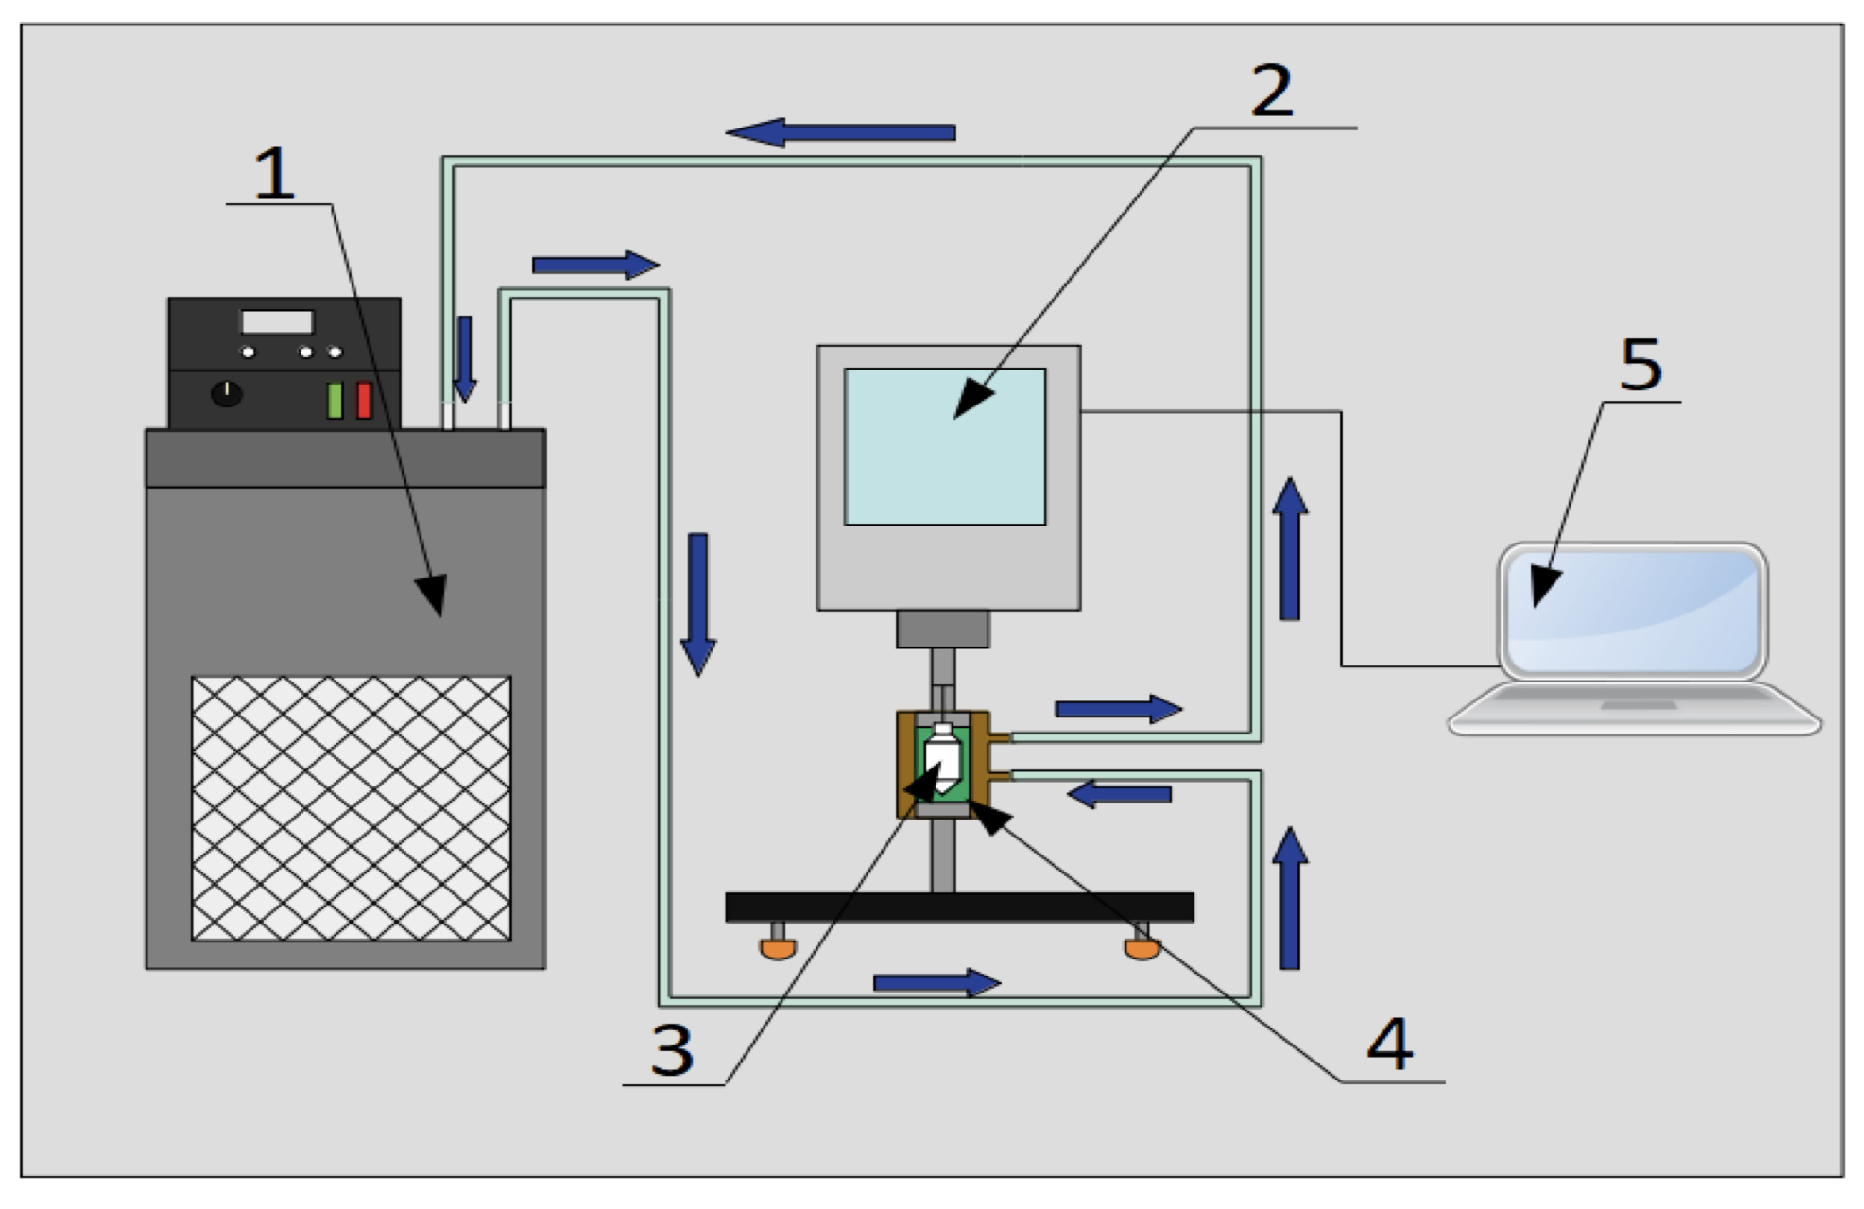
2.4.1. Thermal Conductivity
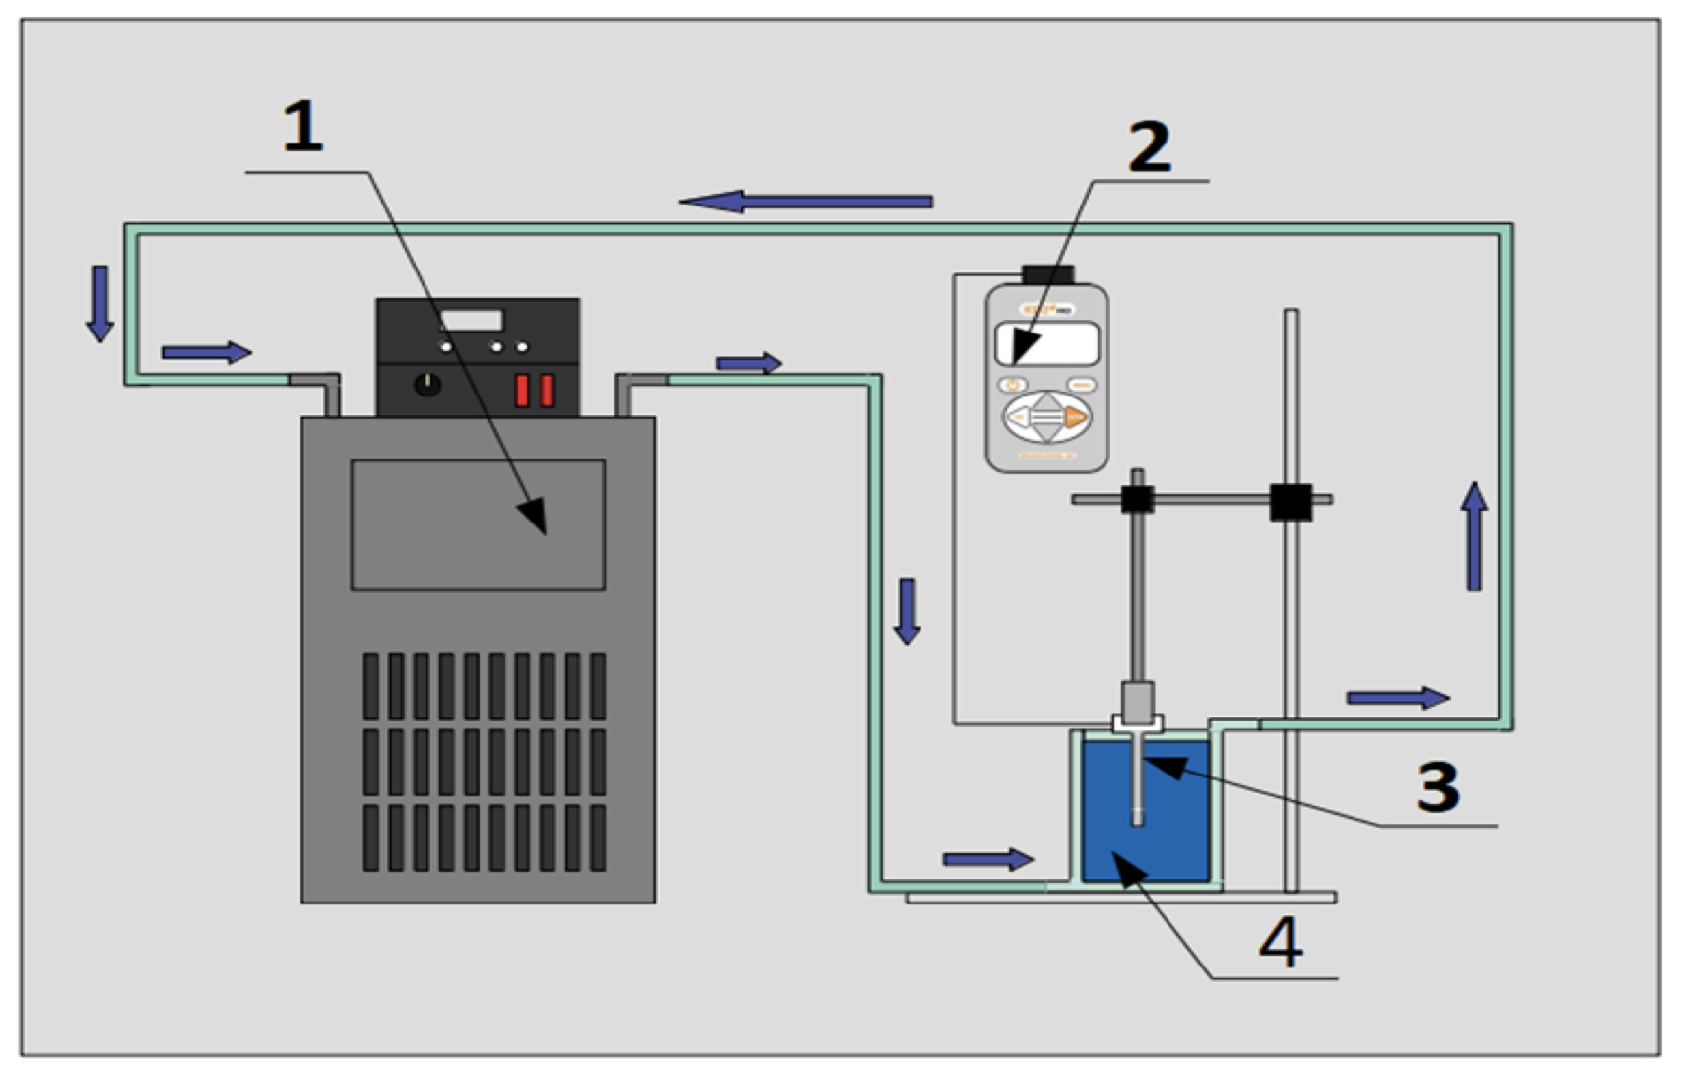
2.4.2. Viscosity
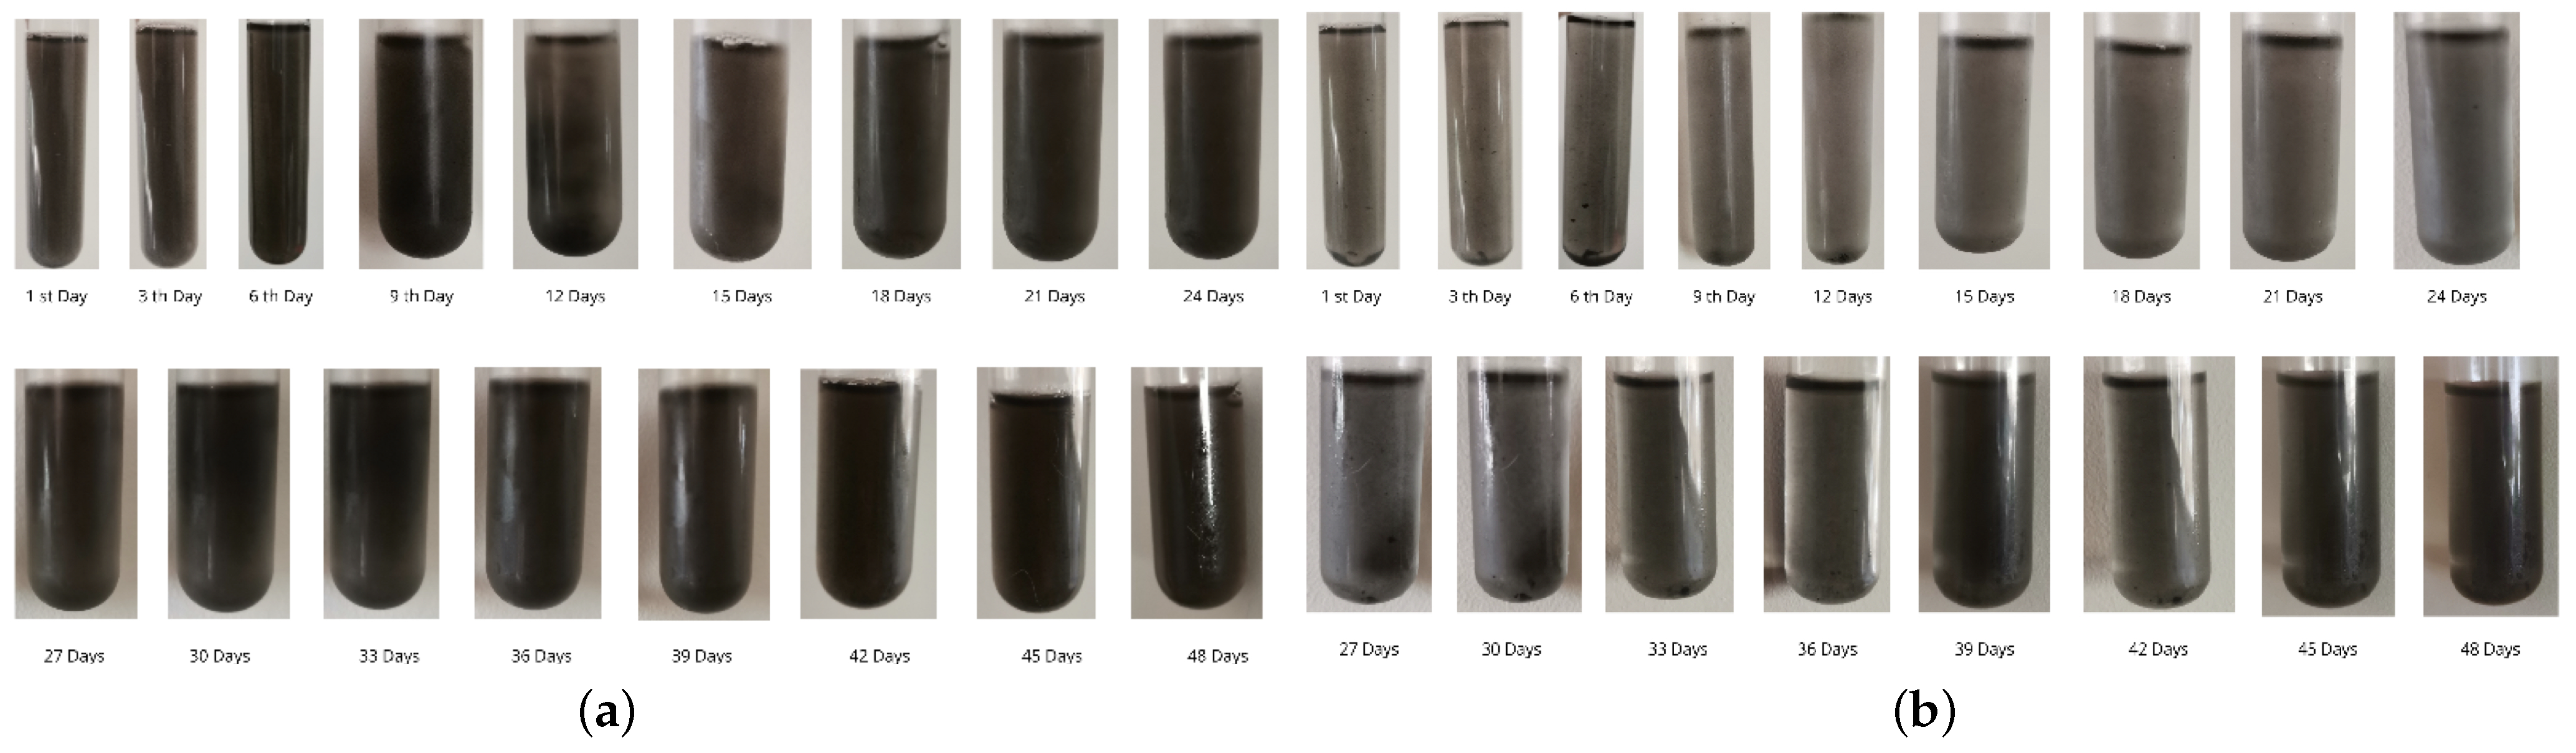
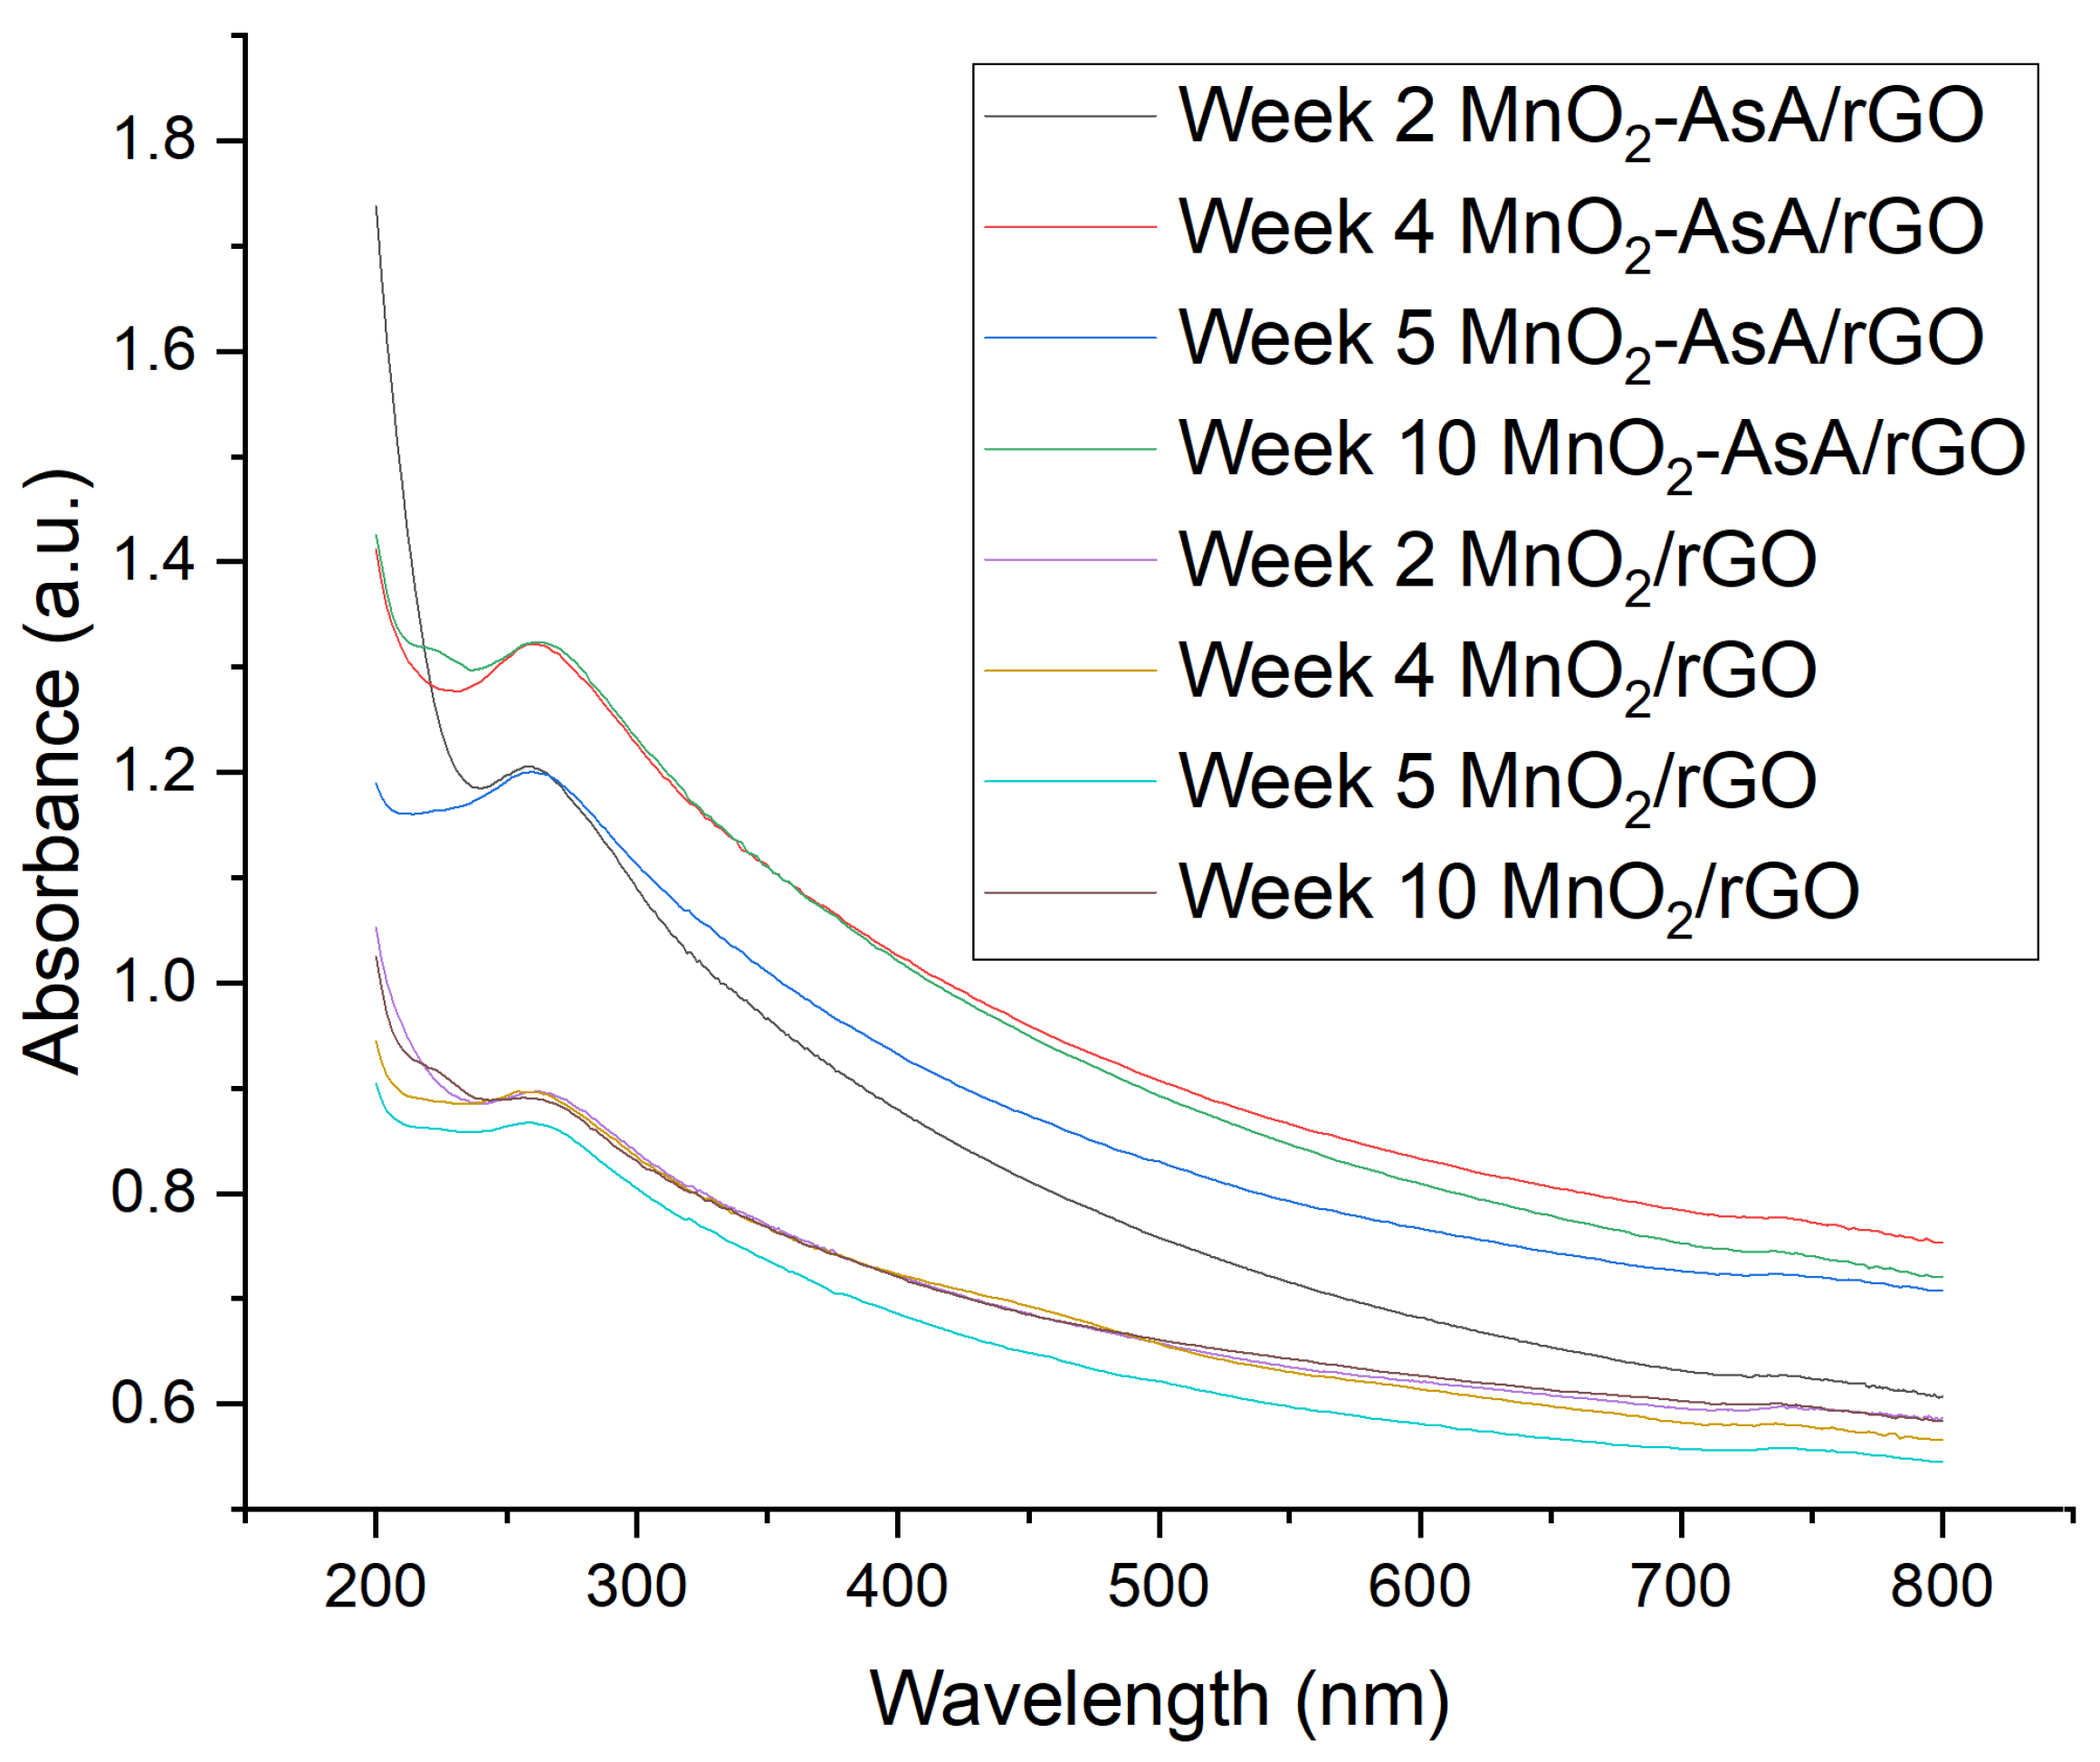
2.5. Stability Test
3. Results and Analysis
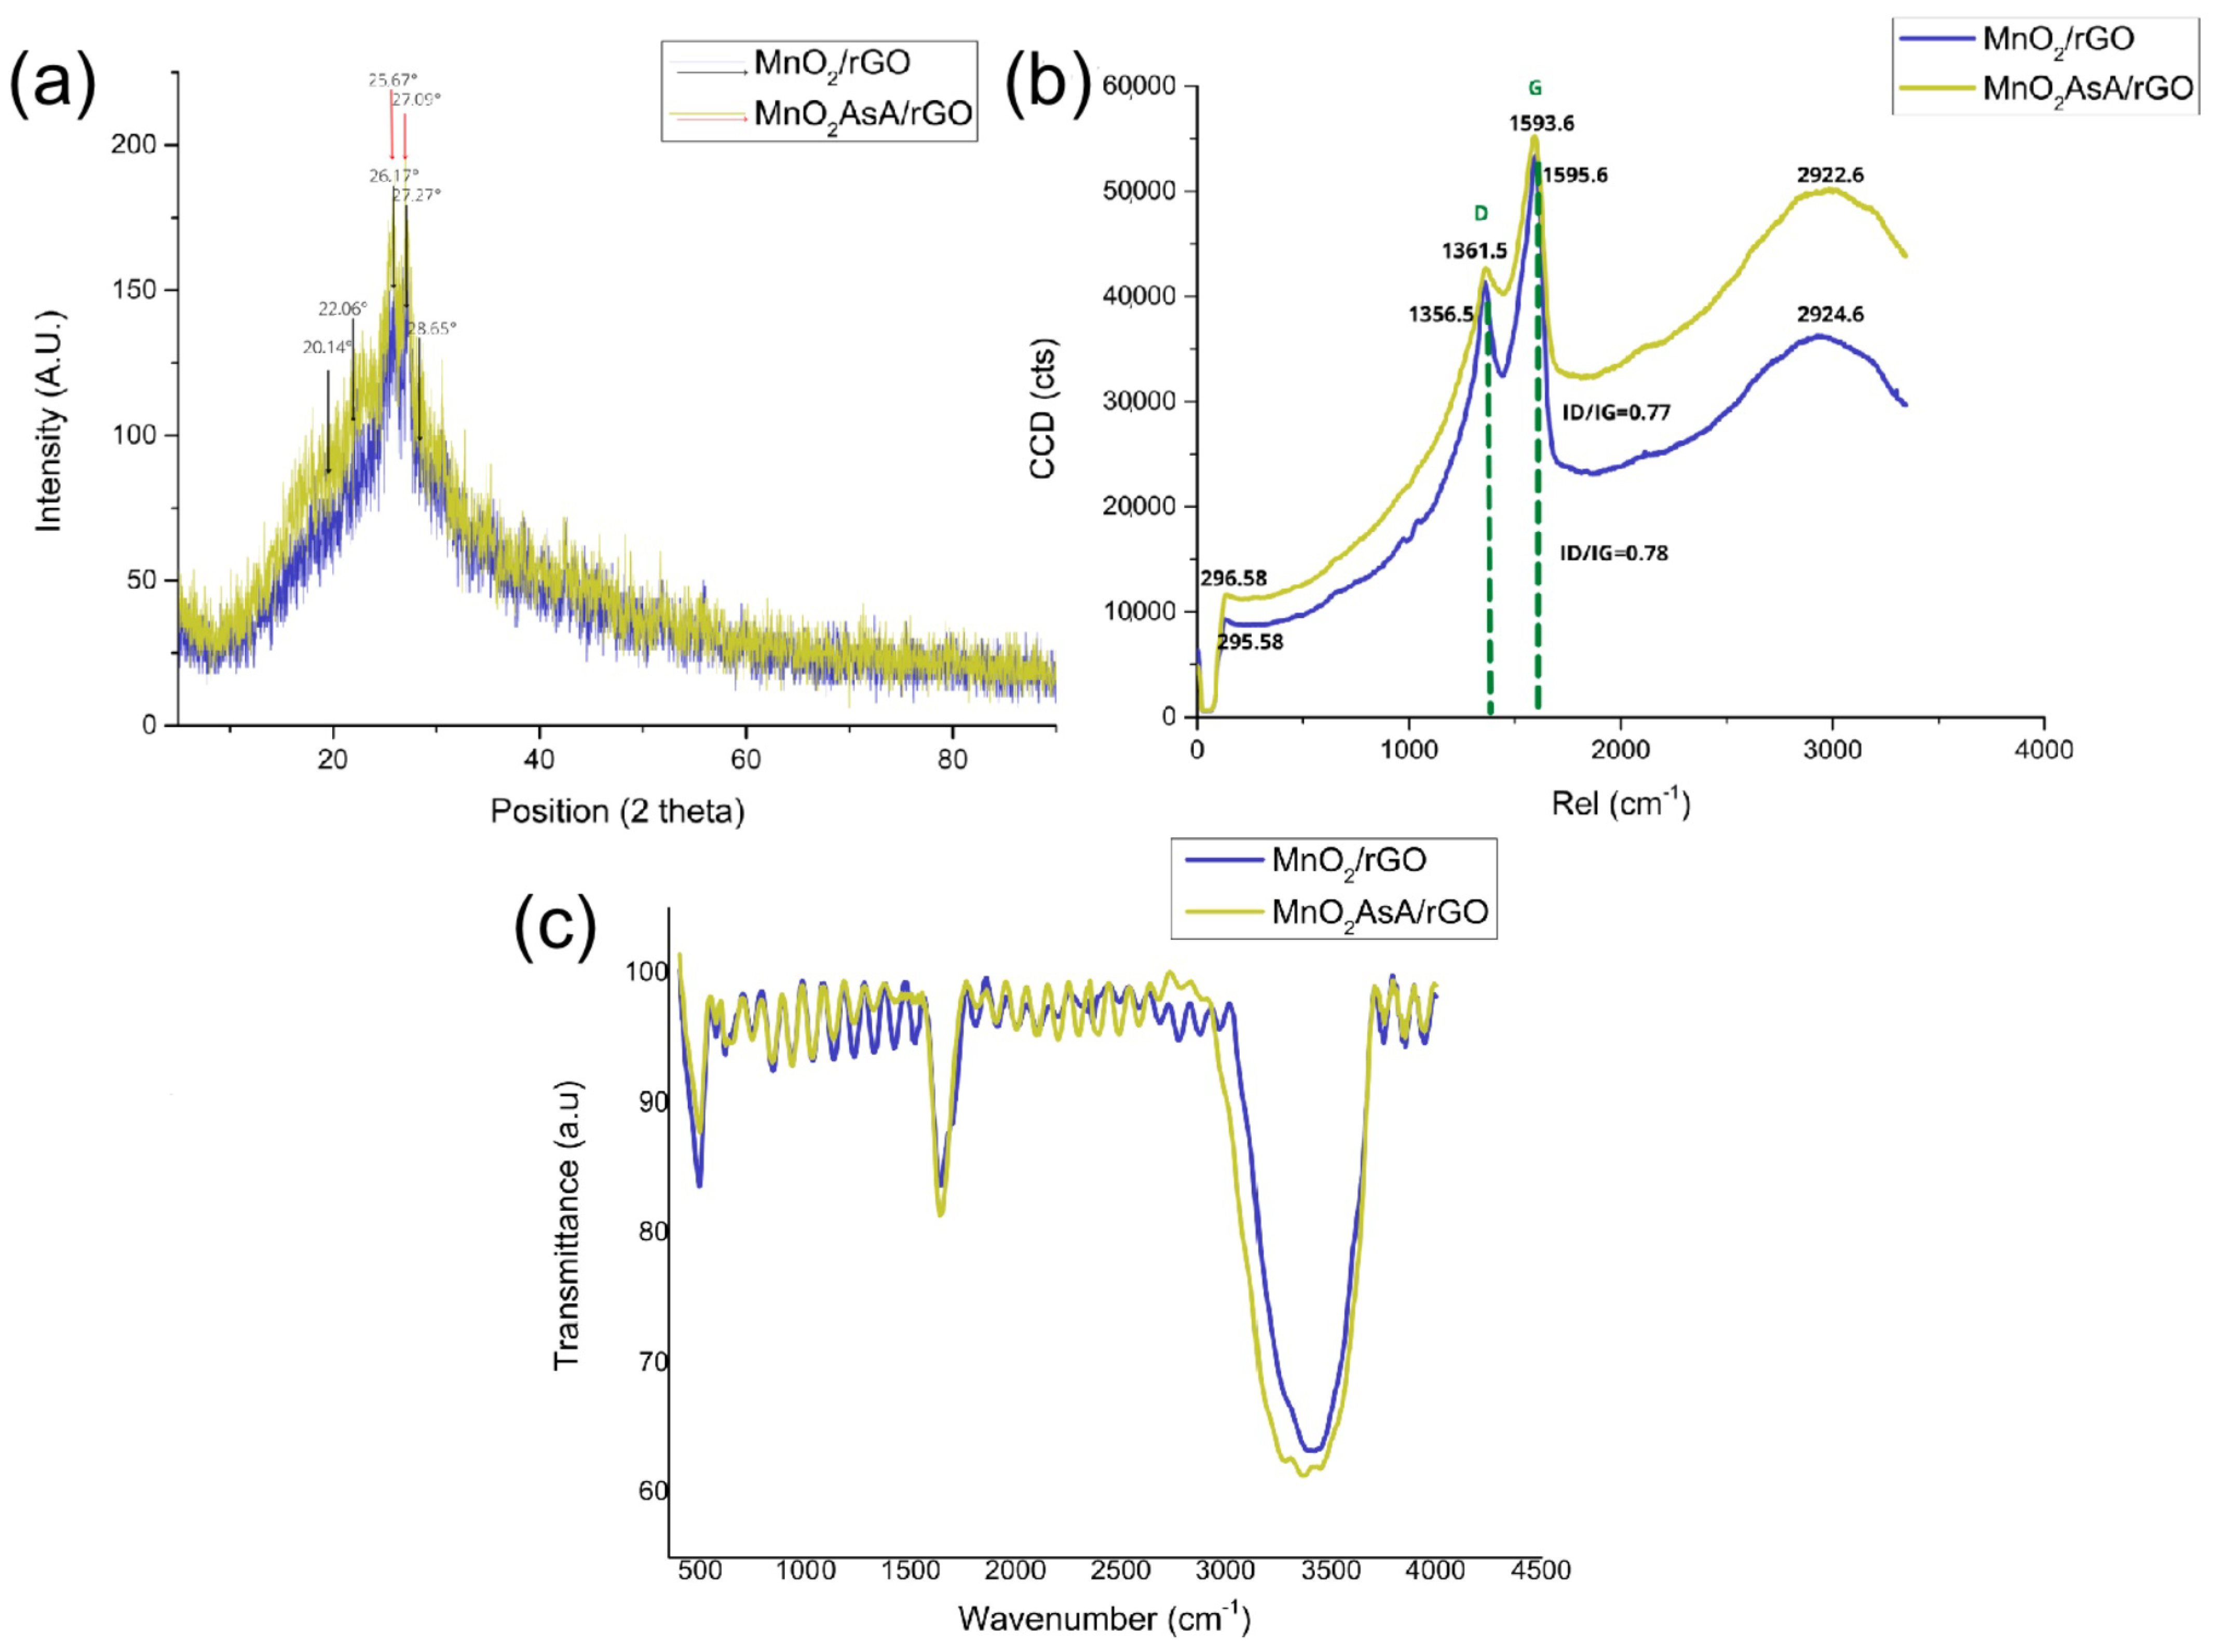
3.1. XRD
3.2. Raman Spectroscopy
3.3. FT-IR
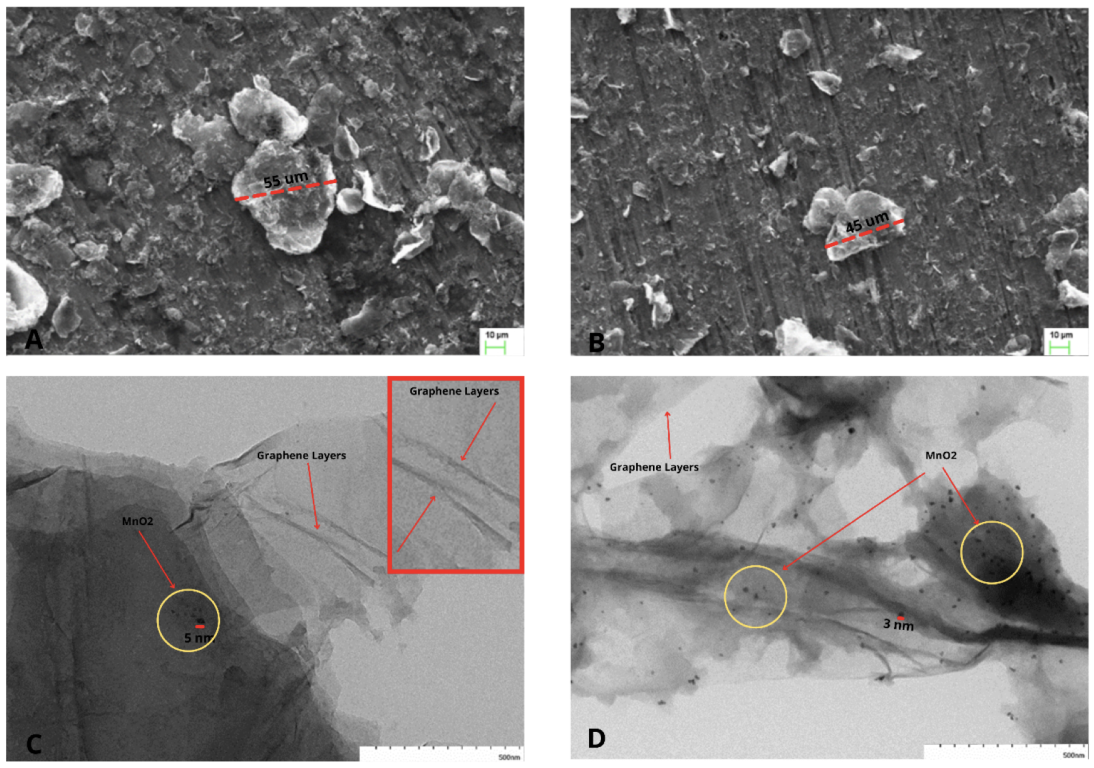
3.4. SEM-TEM
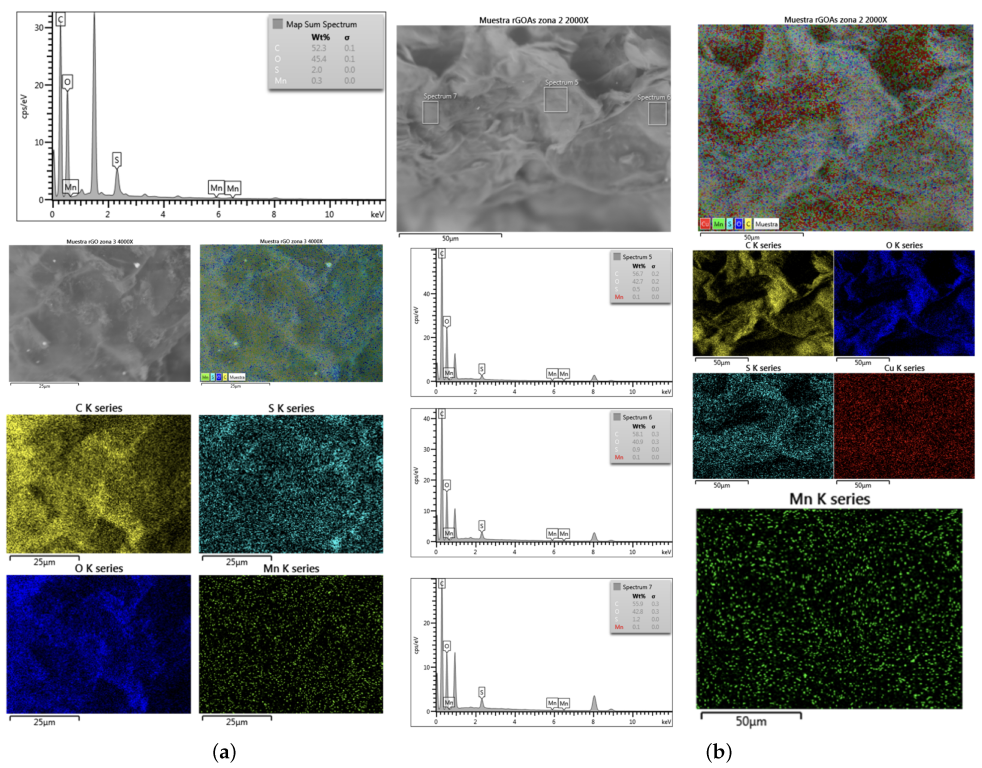
3.5. EDS (Energy-Dispersive Spectroscopy)
3.6. Stability of the Nanofluids
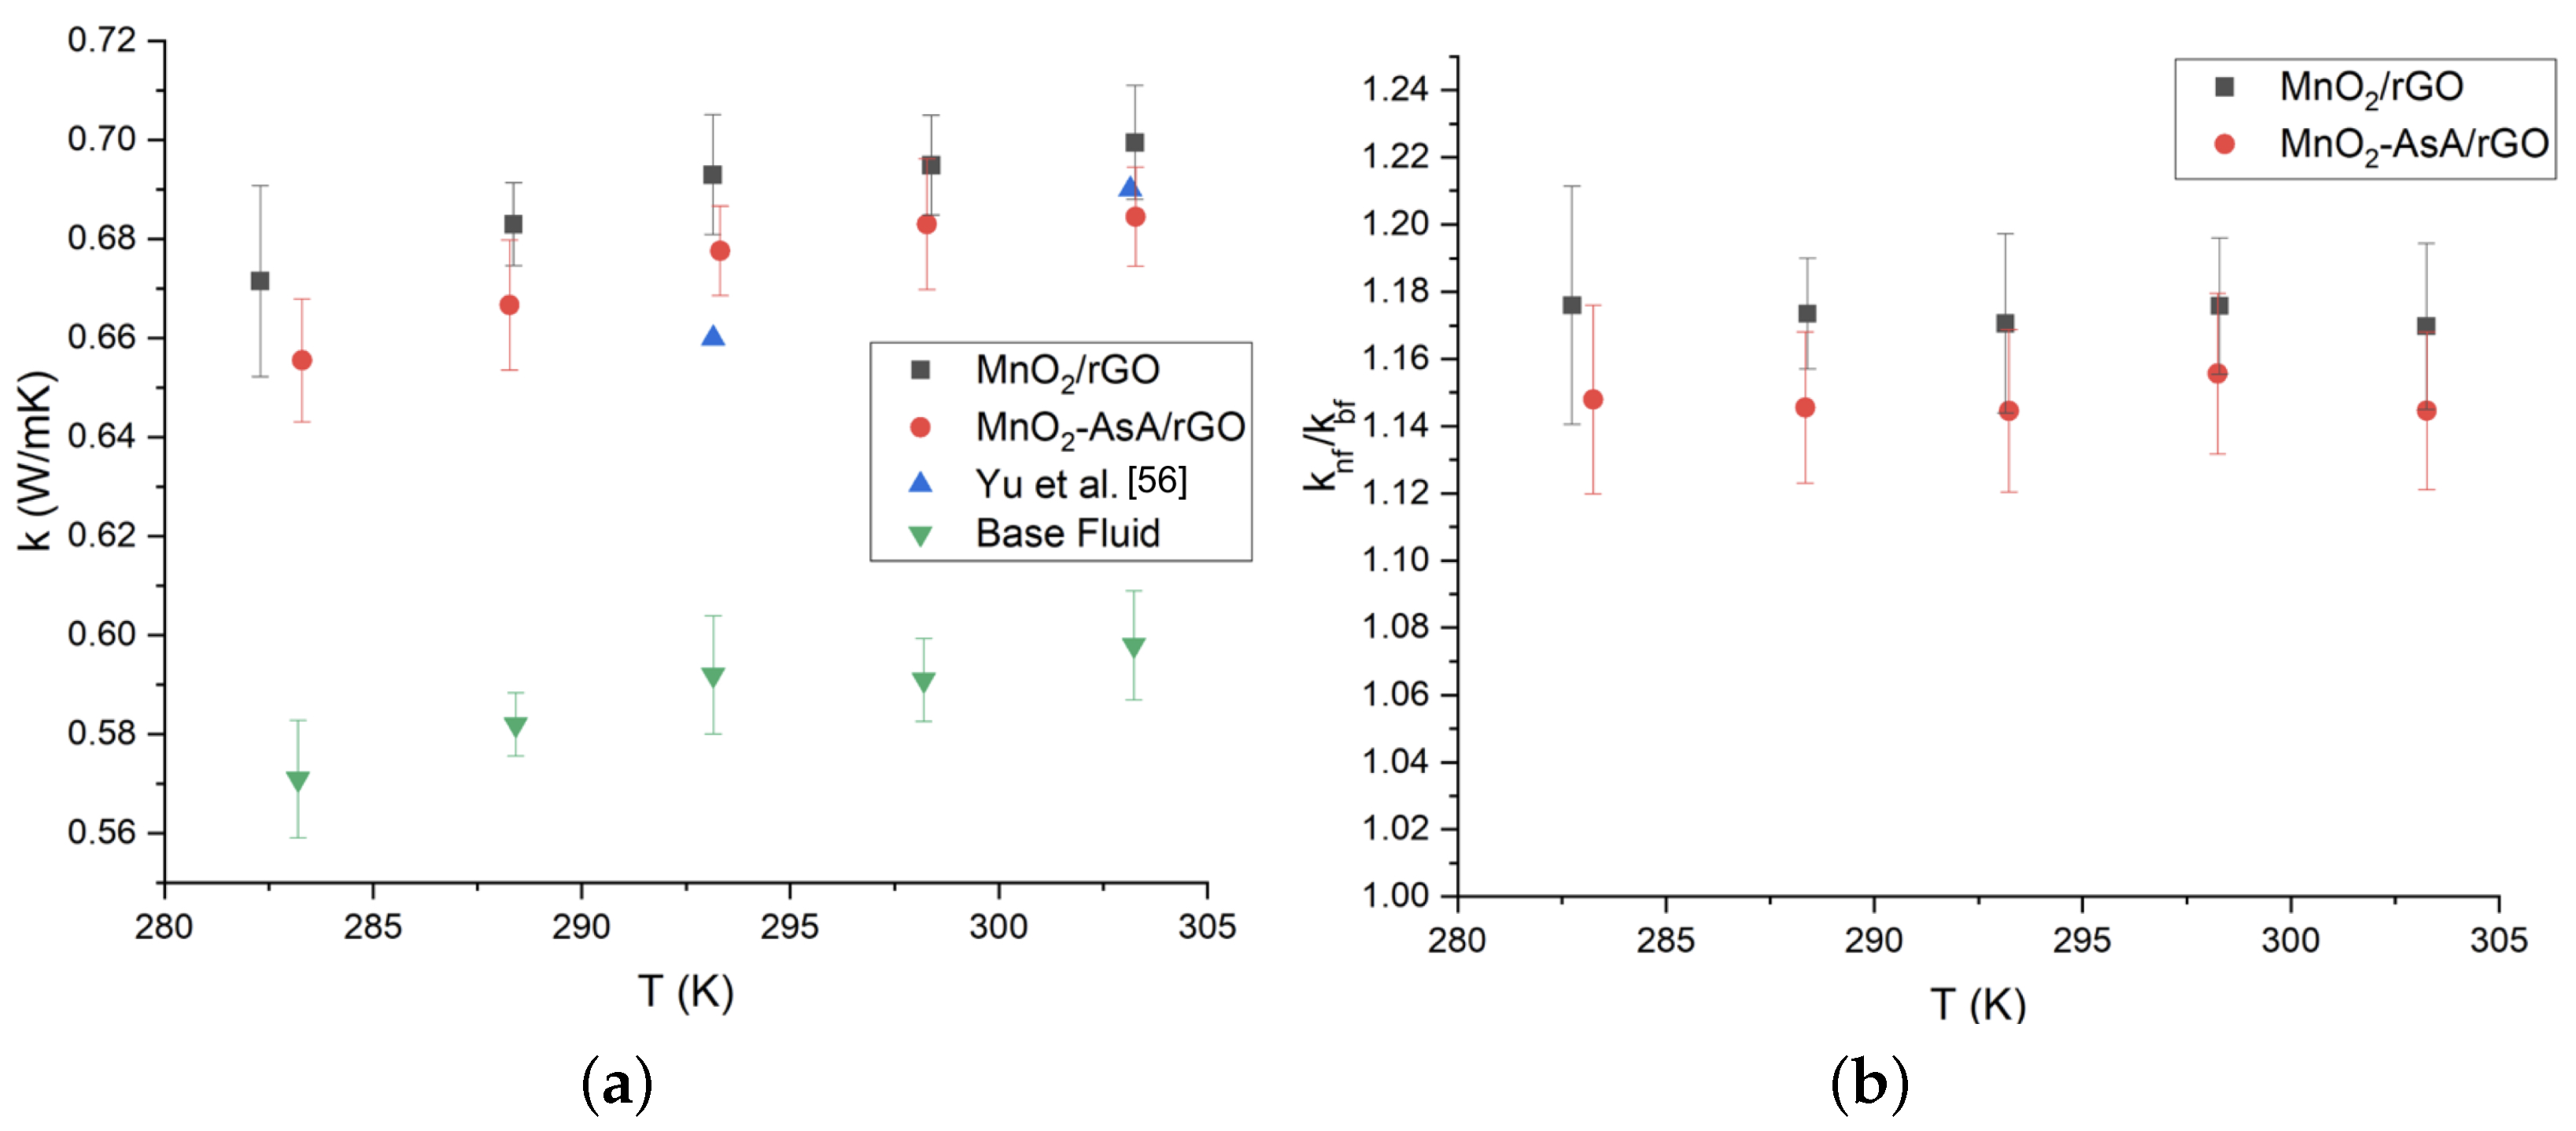
3.7. Thermal Conductivity of the Nanofluids
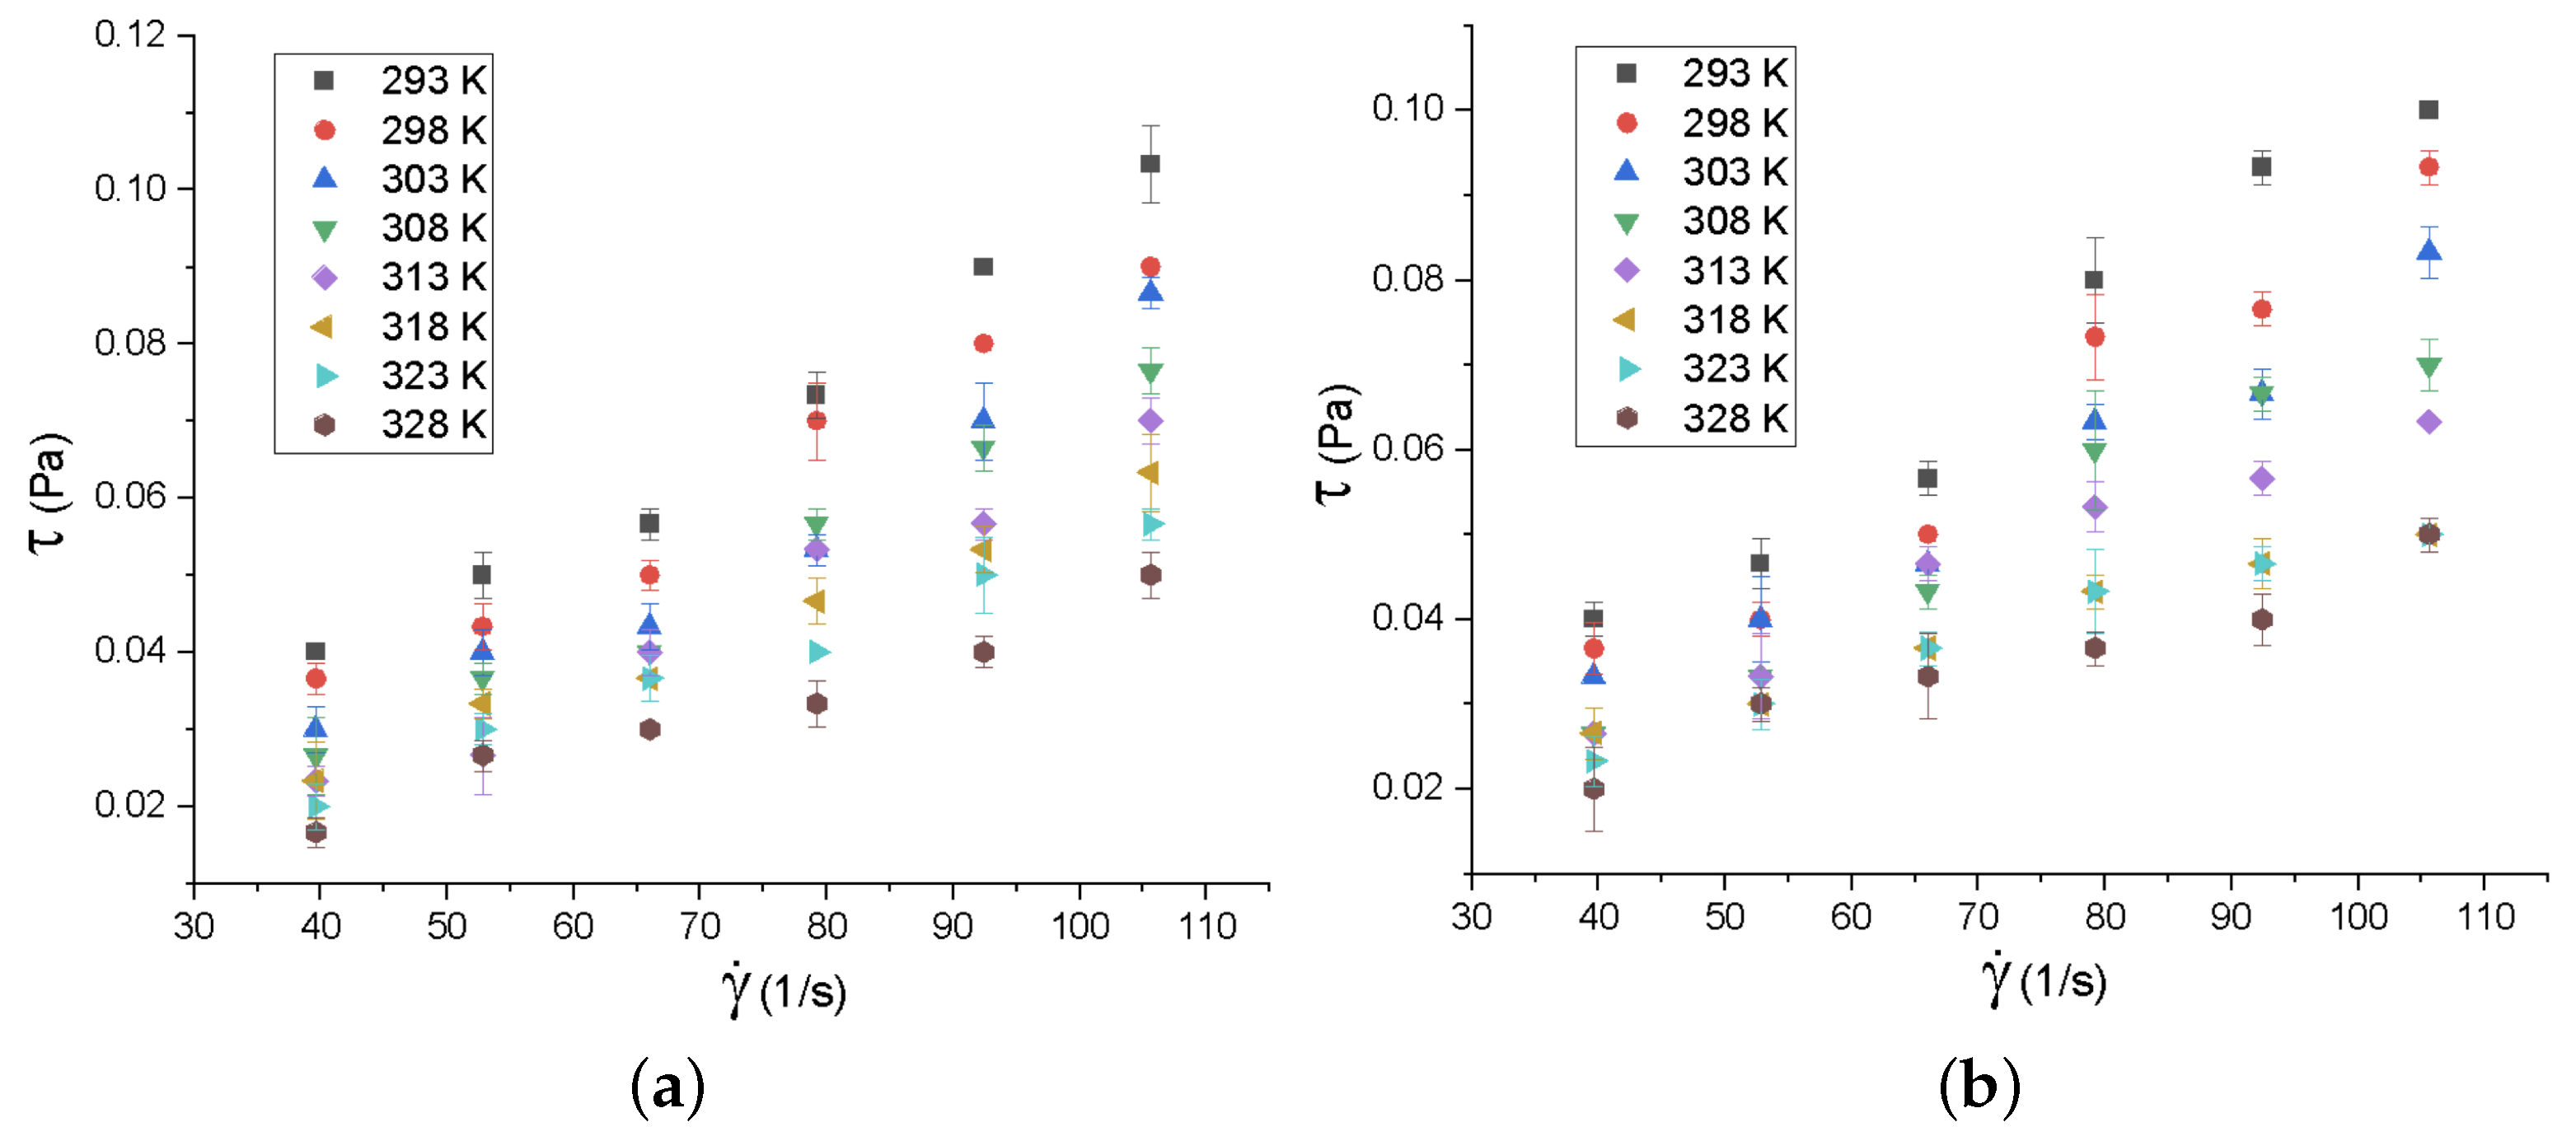
3.8. Rotational Rheology of the Nanofluids
4. Conclusions
Author Contributions
Funding
Data Availability Statement
Conflicts of Interest
References
- Carbajal-Valdéz, R.; Rodríguez, A.; Jiménez, J.L.; Sánchez, J.F.; Cruz, A.; Correa, Z.N.; Macias, M.; Luna, J.L. Experimental investigation on thermal properties of Ag nanowire nanofluids at low concentrations. Thermochim. Acta 2019, 671, 83–88. [Google Scholar] [CrossRef]
- Bahiraei, M.; Heshmatian, S. Graphene family nanofluids: A critical review and future research directions. Energy Convers. Manag. 2019, 196, 1222–1256. [Google Scholar] [CrossRef]
- Yu, W.; Xie, H.; Wang, X.; Wang, X. Significant thermal conductivity enhancement for nanofluids containing graphene nanosheets. Phys. Lett. Sect. A Gen. At. Solid State Phys. 2011, 375, 1323–1328. [Google Scholar] [CrossRef]
- Demirkır, Ç.; Ertürk, H. Rheological and thermal characterization of graphene-water nanofluids: Hysteresis phenomenon. Int. J. Heat Mass Trans. 2020, 149, 3–11. [Google Scholar] [CrossRef]
- Sarsam, W.S.; Amiri, A.; Kazi, S.N.; Badarudin, A. Stability and thermophysical properties of non-covalently functionalized graphene nanoplatelets nanofluids. Energy Convers. Manag. 2016, 116, 101–111. [Google Scholar] [CrossRef]
- Wusiman, K.; Jeong, H.; Tulugan, K.; Afrianto, H.; Chung, H. Thermal performance of multi-walled carbon nanotubes (MWCNTs) in aqueous suspensions with surfactants SDBS and SDS. Int. Commum. Heat Mass Trans. 2013, 41, 28–33. [Google Scholar] [CrossRef]
- Shazali, S.S.; Amiri, A.; Zubir, M.N.M.; Rozali, S.; Zabri, M.Z.; Sabri, M.F.M.; Soleymaniha, M. Investigation of the thermophysical properties and stability performance of non-covalently functionalized graphene nanoplatelets with Pluronic P-123 in different solvents. Mater. Chem. Phys. 2018, 206, 94–102. [Google Scholar] [CrossRef]
- Ghozatloo, A.; Shariaty-Niasar, M.; Rashidi, A.M. Preparation of nanofluids from functionalized Graphene by new alkaline method and study on the thermal conductivity and stability. Int. Commun. Heat Mass Transf. 2013, 42, 89–94. [Google Scholar] [CrossRef]
- Seong, H.; Kim, G.; Jeon, J.; Jeong, H.; Noh, J.; Kim, Y.; Kim, H.; Huh, S. Experimental study on characteristics of grinded graphene nanofluids with surfactants. Materials 2018, 11, 950. [Google Scholar] [CrossRef]
- Ilyas, S.U.; Ridha, S.; Kareem, F.A.A. Dispersion stability and surface tension of SDS-Stabilized saline nanofluids with graphene nanoplatelets. Colloids Surfaces A Physicochem. Eng. Asp. 2020, 592, 124584. [Google Scholar] [CrossRef]
- Rueda-García, D.; Rodríguez-Laguna, M.D.; Chávez-Angel, E.; Dubal, D.P.; Cabán-Huertas, Z.; Benages-Vilau, R.; Gómez-Romero, P. From thermal to electroactive graphene nanofluids. Energies 2019, 12, 4545. [Google Scholar] [CrossRef]
- Lin, Y.; Zhang, H.; He, C.; Li, Y.; Wang, S.; Hong, H. A new kind of water-based nanofluid with a low loading of three-dimensional porous graphene. J. Mater. Sci. 2017, 52, 10485–10496. [Google Scholar] [CrossRef]
- Hadadian, M.; Goharshadi, E.K.; Youssefi, A. Electrical conductivity, thermal conductivity, and rheological properties of graphene oxide-based nanofluids. J. Nanoparticle Res. 2014, 16, 2788. [Google Scholar] [CrossRef]
- Zaaba, N.I.; Foo, K.L.; Hashim, U.; Tan, S.J.; Liu, W.W.; Voon, C.H. Synthesis of graphene oxide using modified hummers method: Solvent influence. Procedia Eng. 2017, 184, 469–477. [Google Scholar] [CrossRef]
- Zubir, N.A.; Yacou, C.; Motuzas, J.; Zhang, X.; Costa, J.C.D.D. Structural and functional investigation of graphene oxide-Fe3O4 nanocomposites for the heterogeneous Fenton-like reaction. Sci. Rep. 2014, 4, 4594. [Google Scholar] [CrossRef]
- Esfahani, M.R.; Languri, E.M.; Nunna, M.R. Effect of particle size and viscosity on thermal conductivity enhancement of graphene oxide nanofluid. Int. Commun. Heat Mass Transf. 2016, 76, 308–315. [Google Scholar] [CrossRef]
- Shen, X.; Lin, X.; Jia, J.; Wang, Z.; Li, Z.; Kim, J.-K. Tunable thermal conductivities of graphene oxide by functionalization and tensile loading. Carbon N. Y. 2014, 80, 235–245. [Google Scholar] [CrossRef]
- Hajjar, Z.; Rashidi, A.M.; Ghozatloo, A. Enhanced thermal conductivities of graphene oxide nanofluids. Int. Commun. Heat Mass Transf. 2014, 57, 128–131. [Google Scholar] [CrossRef]
- Xu, Y.; Nguyen, Q.; Malekahmadi, O.; Hadi, R.; Jokar, Z.; Mardani, A.; Karimipour; Ranjbarzadeh, R.; Li, Z.; Bach, Q. Synthesis and characterization of additive graphene oxide nanoparticles dispersed in water: Experimental and theoretical viscosity prediction of non-Newtonian nanofluid. Math. Methods Appl. Sci. 2020. Early View. [Google Scholar] [CrossRef]
- Yu, W.; Xie, H.; Chen, W. Experimental investigation on thermal conductivity of nanofluids containing graphene oxide nanosheets. J. Appl. Phys. 2010, 107, 094317. [Google Scholar] [CrossRef]
- Akhavan-Zanjani, H.; Saffar-Avval, M.; Mansourkiaei, M.; Ahadi, M.; Sharif, F. Turbulent Convective Heat Transfer and Pressure Drop of Graphene–Water Nanofluid Flowing Inside a Horizontal Circular Tube. J. Dispers. Sci. Technol. 2014, 35, 1230–1240. [Google Scholar] [CrossRef]
- Zhang, H.; Wang, S.; Lin, Y.; Feng, M.; Wu, Q. Stability, thermal conductivity, and rheological properties of controlled reduced graphene oxide dispersed nanofluids. Appl. Therm. Eng. 2017, 119, 132–139. [Google Scholar] [CrossRef]
- Baby, T.T.; Ramaprabhu, S. Experimental investigation of the thermal transport properties of a carbon nanohybrid dispersed nanofluid. Nanoscale 2011, 3, 2208–2214. [Google Scholar] [CrossRef]
- Askari, S.; Koolivand, H.; Pourkhalil, M.; Lotfi, R.; Rashidi, A. Investigation of Fe3O4/Graphene nanohybrid heat transfer properties: Experimental approach. Int. Commun. Heat Mass Transf. 2017, 87, 30–39. [Google Scholar] [CrossRef]
- Selvaraj, V.; Krishnan, H. Synthesis of graphene encased alumina and its application as nanofluid for cooling of heat-generating electronic devices. Powder Technol. 2020, 363, 665–675. [Google Scholar] [CrossRef]
- Sarode, H.A.; Barai, D.P.; Bhanvase, B.A.; Ugwekar, R.P.; Saharan, V. Investigation on preparation of graphene oxide-CuO nanocomposite based nanofluids with the aid of ultrasound assisted method for intensified heat transfer properties. Mater. Chem. Phys. 2020, 251, 123102. [Google Scholar] [CrossRef]
- Ghozatloo, A.; Rashidi, A.; Shariaty-Niassar, M. Convective heat transfer enhancement of graphene nanofluids in shell and tube heat exchanger. Exp. Therm. Fluid Sci. 2014, 53, 136–141. [Google Scholar] [CrossRef]
- Dhar, P.; Ansari, M.H.D.; Gupta, S.S.; Siva, V.M.; Pradeep, T.; Pattamatta, A.; Das, S.K. Percolation network dynamicity and sheet dynamics governed viscous behavior of polydispersed graphene nanosheet suspensions. J. Nanoparticle Res. 2013, 15, 2095. [Google Scholar] [CrossRef]
- Said, Z.; Abdelkareem, M.A.; Rezk, H.; Nassef, A.M.; Atwany, H.Z. Stability, thermophysical and electrical properties of synthesized carbon nanofiber and reduced-graphene oxide-based nanofluids and their hybrid along with fuzzy modeling approach. Powder Technol. 2020, 364, 795–809. [Google Scholar] [CrossRef]
- Padhi, D.K.; Baral, A.; Parida, K.; Singh, S.K.; Ghosh, M.K. Visible light active single-crystal nanorod/needle-like α-MnO2 RGO nanocomposites for efficient photoreduction of Cr (VI). J. Phys. Chem. C 2017, 121, 6039–6049. [Google Scholar] [CrossRef]
- Essajai, R.; Tabtab, I.; Mzerd, A.; Mounkachi, O.; Hassanain, N.; Qjani, M. Molecular dynamics study of thermal properties of nanofluids composed of one-dimensional (1-D) network of interconnected gold nanoparticles. Results Phys. 2019, 15, 102576. [Google Scholar] [CrossRef]
- Gensheimer, J.; Broaddus, J.; Lin, Y.; Cao, Y. Scalable Production of Reduced Graphene Oxide (rGO) from Graphite Oxide (GO). Young Sci. J. 2015, 3, 39–42. [Google Scholar]
- Rashin, M.N.; Hemalatha, J. Synthesis and viscosity studies of novel ecofriendly ZnO-coconut oil nanofluid. Exp. Therm. Fluid Sci. 2013, 51, 312–318. [Google Scholar] [CrossRef]
- Sarafraz, M.M.; Nikkhah, V.; Nakhjavani, M.; Arya, A. Thermal performance of a heat sink microchannel working with biologically produced silver-water nanofluid: Experimental assessment. Exp. Therm. Fluid Sci. 2018, 91, 509–519. [Google Scholar] [CrossRef]
- Kamatchi, R.; Venkatachalapathy, S.; Srinivas, B.A. Synthesis, stability, transport properties, and surface wettability of reduced graphene oxide/water nanofluids. Int. J. Therm. Sci. 2015, 97, 17–25. [Google Scholar] [CrossRef]
- Eid, C.; Assaf, E.; Habchi, R.; Miele, P.; Bechelany, M. Tunable properties of GO-doped CoFe2O4 nanofibers elaborated by electrospinning. RSC Adv. 2015, 5, 97849–97854. [Google Scholar] [CrossRef]
- Mehrali, M.; Sadeghinezhad, E.; Akhiani, A.R.; Latibari, S.T.; Talebian, S.; Dolatshahi-Pirouz, A.; Metselaar, H.; Mehrali, M. An ecofriendly graphene-based nanofluid for heat transfer applications. J. Clean. Prod. 2016, 137, 555–566. [Google Scholar] [CrossRef]
- Melaibari, A.A.; Khetib, Y.; Alanazi, A.K.; Sajadi, S.M.; Sharifpur, M.; Cheraghian, G. Applying Artificial Neural Network and Response Surface Method to Forecast the Rheological Behavior of Hybrid Nano-Antifreeze Containing Graphene Oxide and Copper Oxide Nanomaterials. Sustainability 2021, 13, 1505. [Google Scholar] [CrossRef]
- Cabaleiro, D.; Estellé, P.; Navas, H.; Desforges, A.; Vigolo, B. Dynamic viscosity and surface tension of stable graphene oxide and reduced graphene oxide aqueous nanofluids. J. Nanofluids 2018, 7, 1081–1088. [Google Scholar] [CrossRef]
- Mrabet, A.; García-Borrego, A.; Jiménez-Araujo, A.; Fernández-Bolaños, J.; Sindic, M.; Rodríguez-Gutiérrez, G. Phenolic extracts obtained from thermally treated secondary varieties of dates: Antimicrobial and antioxidant properties. LWT Food Sci. Technol. 2017, 79, 416–422. [Google Scholar] [CrossRef]
- Sarafraz, M.M.; Hormozi, F.; Peyghambarzadeh, S.M. Thermal performance and efficiency of a thermosyphon heat pipe working with a biologically ecofriendly nanofluid. Int. Commun. Heat Mass Transf. 2014, 57, 297–303. [Google Scholar] [CrossRef]
- Kumar, A.; Rout, L.; Dhaka, R.S.; Samal, S.L.; Dash, P. Design of a graphene oxide-SnO2 nanocomposite with superior catalytic efficiency for the synthesis of β-enaminones and β-enaminoesters. RSC Adv. 2015, 5, 39193–39294. [Google Scholar] [CrossRef]
- Bhanvase, B.A.; Shende, T.P.; Sonawane, S.H. A review on graphene–TiO2 and doped graphene–TiO2 nanocomposite photocatalyst for water and wastewater treatment. Environ. Technol. Rev. 2017, 6, 1–14. [Google Scholar] [CrossRef]
- Lozano-Steinmetz, F.; Martínez, V.A.; Vasco, D.A.; Sepúlveda-Mualin, A.; Singh, D.P. The Effect of Ag-Decoration on rGO/Water Nanofluid Thermal Conductivity and Viscosity. Nanomaterials 2022, 12, 1095. [Google Scholar] [CrossRef]
- Baby, T.T.; Sundara, R. Synthesis and transport properties of metal oxide decorated graphene dispersed nanofluids. J. Phys. Chem. 2011, 115, 8527–8533. [Google Scholar] [CrossRef]
- Batmunkh, M.; Tanshen, M.R.; Nine, M.J.; Myekhlai, M.; Choi, H.; Chung, H.; Jeong, H. Thermal Conductivity of TiO2 Nanoparticles Based Aqueous Nanofluids with an Addition of a Modified Silver Particle. Ind. Eng. Chem. Res. 2014, 53, 8445–8451. [Google Scholar] [CrossRef]
- Yarm, H.; Gharehkhani, S.; Ahmadi, G.; Shirazi, S.F.S.; Baradaran, S.; Montazer, E.; Zubir, M.; Alehashem, M.; Kazi, S.N.; Dahari, M. Graphene nanoplatelets-silver hybrid nanofluids for enhanced heat transfer. Energy Convers. Manag. 2015, 100, 419–428. [Google Scholar] [CrossRef]
- Aravind, S.S.J.; Ramaprabhu, S. Graphene wrapped multiwalled carbon nanotubes dispersed nanofluids for heat transfer applications. J. Appl. Phys. 2012, 112, 124304. [Google Scholar] [CrossRef]
- Baby, T.T.; Ramaprabhu, S. Synthesis and nanofluid application of silver nanoparticles decorated graphene. J. Mater. Chem. 2011, 21, 9702–9709. [Google Scholar] [CrossRef]
- Sawangphruk, M.; Srimuk, P.; Chiochan, P.; Krittayavathananon, A.; Luanwuthi, S.; Limtrakul, J. High-performance supercapacitor of manganese oxide/reduced graphene oxide nanocomposite coated on flexible carbon fiber paper. Carbon N. Y. 2013, 60, 109–116. [Google Scholar] [CrossRef]
- Wang, Y.; Guan, H.; Du, S.; Wang, Y. A facile hydrothermal synthesis of MnO2 nanorod-reduced graphene oxide nanocomposites possessing excellent microwave absorption properties. JRSC Adv. 2015, 5, 88979–88988. [Google Scholar] [CrossRef]
- Zhu, X.; Liu, Q.; Zhu, X.; Li, C.; Xu, M.; Liang, Y. Reduction of graphene oxide via ascorbic acid and its application for simultaneous detection of dopamine and ascorbic acid. Int. J. Electrochem. Sci. 2012, 7, 5172–5184. [Google Scholar]
- Guo, H.L.; Wang, X.F.; Qian, Q.Y.; Wang, F.B.; Xia, X.H. A green approach to the synthesis of graphene nanosheets. ACS Nano 2009, 3, 2653–2669. [Google Scholar] [CrossRef]
- Sumi, V.S.; Meera, M.S.; Sha, M.A.; Shibli, S.M.A. Effect of rGO on Fe2O3–TiO2 composite incorporated NiP coating for boosting hydrogen evolution reaction in alkaline solution. Int. J. Hydrogen Energy 2020, 45, 2460–2477. [Google Scholar] [CrossRef]
- Julien, C.; Massot, M.; Rangan, S.; Lemal, M.; Guyomard, D. Study of structural defects in γ-MnO2 by Raman spectroscopy. J. Raman Spectrosc. 2002, 33, 223–228. [Google Scholar] [CrossRef]
- Zhang, J.; Yang, H.; Shen, G.; Cheng, P.; Zhang, J.; Guo, S. Reduction of graphene oxide vial-ascorbic acid. Chem. Commun. 2010, 46, 1112–1114. [Google Scholar] [CrossRef]
- Yu, X.; Wu, Q.; Zhang, H.; Zeng, G.; Li, W.; Qian, Y.; Li, Y.; Yang, G.; Chen, M. Investigation on synthesis, stability, and thermal conductivity properties of water-based SnO2/reduced graphene oxide nanofluids. Materials 2017, 11, 38. [Google Scholar] [CrossRef]
- Konios, D.; Stylianakis, M.M.; Stratakis, E.; Kymakis, E. Dispersion behaviour of graphene oxide and reduced graphene oxide. J. Colloid Interface Sci. 2014, 430, 108–112. [Google Scholar] [CrossRef]
- Vinodha, G.; Cindrella, L.; Sithara, V.; Philip, J.; Shima, P.D. Synthesis, characterization, thermal conductivity and rheological studies in magnetite-decorated graphene oxide nanofluids. J. Nanofluids 2018, 7, 11–20. [Google Scholar] [CrossRef]
- Joseph, P.S.; Roy, G.; Nguyen, C.T. Heat transfer enhancement with the use of nanofluids in radial flow cooling systems considering temperature-dependent properties. Appl. Therm. Eng. 2006, 26, 2209–2218. [Google Scholar]
- Kumar, D.H.; Patel, H.E.; Kumar, V.R.; Sundararajan, T.; Pradeep, T.; Das, S.K. Model for heat conduction in nanofluids. Phys. Rev. Lett. 2004, 93, 144301. [Google Scholar] [CrossRef] [PubMed]
- Geim, A.K.; Novoselov, K.S. The rise of graphene. Nat. Mater. 2004, 6, 183–191. [Google Scholar] [CrossRef] [PubMed]
- Mahanta, N.K.; Abramson, A.R. Thermal conductivity of graphene and graphene oxide nanoplatelets. In Proceedings of the 13th InterSociety Conference on Thermal and Thermomechanical Phenomena in Electronic Systems, San Diego, CA, USA, 30 May–1 June 2012. [Google Scholar]
- Slifka, A.J.; Filla, B.J.; Phelps, J.M. Thermal Conductivity of Magnesium Oxide From Absolute, Steady-State Measurements. J. Res. Natl. Inst. Stand. Technol. 1998, 103, 357–363. [Google Scholar] [CrossRef] [PubMed]
- Jang, P.; Seok; Choi, S.U.S. Effects of various parameters on nanofluid thermal conductivity. J. Heat Transf. 2007, 129, 617–623. [Google Scholar] [CrossRef]
- Feng, X.; Huang, X.; Wang, X. Thermal conductivity and secondary porosity of single anatase TiO2/nanowire. Nanotechnology 2012, 23, 185701. [Google Scholar] [CrossRef]
- Kalbani, K.S.A.; Alam, M.S.; Rahman, M.M. Finite element analysis of natural convective heat transfer flow of nanofluids inside a tilted square enclosure in the presence of oriented magnetic field. Am. J. Heat Mass Transf. 2016, 3, 186–224. [Google Scholar] [CrossRef]
- Yang, G.; Yu, X.; Wu, Q.; Zhang, H.; Li, W.; Qian, Y. Preparation and Thermal Conductivity of Alumina/Reduced Graphene Oxide Composite Dispersed Aqueous Nanofluids. IOP Conf. Ser. Mater. Sci. Eng. 2018, 381, 012071. [Google Scholar] [CrossRef]
- Yarm, H.; Gharehkhani, S.; Shirazi, S.F.; Goodarzi, M.; Amiri, A.; Sarsam, W.S.; Alehashem, M.S.; Dahari, M.; Kazi, S.N. Study of synthesis, stability and thermo-physical properties of graphene nanoplatelet/platinum hybrid nanofluid. Int. Commun. Heat Mass Transf. 2016, 77, 15–21. [Google Scholar]
- Li, L.; Hu, Z.; Yang, Y.; Liang, P.; Lu, A.; Xu, H.; Hu, Y.; Wu, H. Hydrothermal Self-assembly Synthesis of Mn3O4/Reduced Graphene Oxide Hydrogel and Its High Electrochemical Performance for Supercapacitors. Chin. J. Chem. 2013, 31, 1290–1298. [Google Scholar] [CrossRef]
- Zhao, X.; Zhang, L.; Murali, S.; Stoller, M.D.; Zhang, Q. Incorporation of Manganese Dioxide within Ultraporous Activated Graphene for High-Performance Electrochemical Capacitors. ACS Nano 2012, 6, 5404–5412. [Google Scholar] [CrossRef]
- Buongiorno, J.; Venerus, D.C.; Prabhat, N.; McKrell, T.; Townsend, J.; Christianson, R.; Tolmachev, Y.V.; Keblinski, P.; Hu, L.W.; Alvarado, J.L.; et al. A benchmark study on the thermal conductivity of nanofluids. J. Appl. Phys 2009, 106, 094312. [Google Scholar] [CrossRef]
- Nguyen, C.T.; Desgranges, F.; Galanis, N.; Roy, G.; Maré, T.; Boucher, S.; Mintsa, H.A. Viscosity data for Al2O3–water nanofluid—Hysteresis: Is heat transfer enhancement using nanofluids reliable? Int. J. Therm. Sci. 2008, 47, 103–111. [Google Scholar] [CrossRef]


| Nanofluid | [W/mK] | [W/mK] |
|---|---|---|
| MnO/rGO | ||
| MnOAsA/rGO |
| Nanomaterial | Thermal Conductivity [W/mK] |
|---|---|
| Graphene | 5000 [62] |
| GO | 0.5–18 [63] |
| rGO | 1390–2275 [63] |
| MgO | 8–29 [64] |
| CuO | 18 [65] |
| TiO | 5.6 [66] |
| AlO | 42.3 [65] |
| FeO | 80.4 [67] |
| Nanofluid | a [Pa· s/K] | b [Pa· s/K] | c [Pa· s] |
|---|---|---|---|
| MnO/rGO | |||
| MnOAsA/rGO |
Publisher’s Note: MDPI stays neutral with regard to jurisdictional claims in published maps and institutional affiliations. |
© 2022 by the authors. Licensee MDPI, Basel, Switzerland. This article is an open access article distributed under the terms and conditions of the Creative Commons Attribution (CC BY) license (https://creativecommons.org/licenses/by/4.0/).
Share and Cite
Lozano-Steinmetz, F.; Ramírez-Navarro, M.P.; Vivas, L.; Vasco, D.A.; Singh, D.P.; Zambra-Sazo, C. Thermal and Rheological Characterization of Aqueous Nanofluids Based on Reduced Graphene Oxide (rGO) with Manganese Dioxide Nanocomposites (MnO2). Nanomaterials 2022, 12, 3042. https://doi.org/10.3390/nano12173042
Lozano-Steinmetz F, Ramírez-Navarro MP, Vivas L, Vasco DA, Singh DP, Zambra-Sazo C. Thermal and Rheological Characterization of Aqueous Nanofluids Based on Reduced Graphene Oxide (rGO) with Manganese Dioxide Nanocomposites (MnO2). Nanomaterials. 2022; 12(17):3042. https://doi.org/10.3390/nano12173042
Chicago/Turabian StyleLozano-Steinmetz, Felipe, María Paz Ramírez-Navarro, Leonardo Vivas, Diego A. Vasco, Dinesh Pratap Singh, and Carlos Zambra-Sazo. 2022. "Thermal and Rheological Characterization of Aqueous Nanofluids Based on Reduced Graphene Oxide (rGO) with Manganese Dioxide Nanocomposites (MnO2)" Nanomaterials 12, no. 17: 3042. https://doi.org/10.3390/nano12173042
APA StyleLozano-Steinmetz, F., Ramírez-Navarro, M. P., Vivas, L., Vasco, D. A., Singh, D. P., & Zambra-Sazo, C. (2022). Thermal and Rheological Characterization of Aqueous Nanofluids Based on Reduced Graphene Oxide (rGO) with Manganese Dioxide Nanocomposites (MnO2). Nanomaterials, 12(17), 3042. https://doi.org/10.3390/nano12173042