
Recent Advances in the Label-Free Characterization of Exosomes for Cancer Liquid Biopsy: From Scattering and Spectroscopy to Nanoindentation and Nanodevices

 ,
,  ,
,  ,
,  ,
,  ,
,  ,
,
Abstract
1. Introduction
2. Extracellular Vesicles Classification and Biogenesis
2.1. Exosomes
2.2. Microvesicles
2.3. Apoptotic Bodies
3. Exosome Isolation
3.1. Ultracentrifugation
3.2. Polymer-Based Separation
3.3. Size Exclusion Chromatography
3.4. Immunoaffinity Techniques
4. Scattering and Diffraction Provide Unique Information on EV Lipid Bilayer Arrangement, Composition, and Interaction with Nanosized Objects
5. Vibrational Spectroscopies for Label-Free Exosome Molecular Profiling in the Omics Era
5.1. FTIR Is an Effective Tool for the Label-Free Characterization of Exosomes and Allows for Their Automated Classification in Diagnostics
5.2. Exosome Characterization with Raman Spectroscopy: From Bulk Sample to Single Molecule
6. Nanoindentation: Searching for an Exosome Mechanical Fingerprint of the Disease
7. Label-Free Microfluidic Devices for Exosome Isolation
7.1. Microfluidics-Based Devices
7.2. Electrofluidics-Based Devices
7.3. Acoustofluidics-Based Devices
8. Discussion and Perspectives
Author Contributions
Funding
Institutional Review Board Statement
Informed Consent Statement
Data Availability Statement
Acknowledgments
Conflicts of Interest
References
- Krishnamurthy, N.; Spencer, E.; Torkamani, A.; Nicholson, L. Liquid biopsies for cancer: Coming to a patient near you. J. Clin. Med. 2017, 6, 3. [Google Scholar] [CrossRef]
- Parikh, A.R.; Leshchiner, I.; Elagina, L.; Goyal, L.; Levovitz, C.; Siravegna, G.; Livitz, D.; Rhrissorrakrai, K.; Martin, E.E.; Van Seventer, E.E. Liquid versus tissue biopsy for detecting acquired resistance and tumor heterogeneity in gastrointestinal cancers. Nat. Med. 2019, 25, 1415–1421. [Google Scholar] [CrossRef]
- Siravegna, G.; Marsoni, S.; Siena, S.; Bardelli, A. Integrating liquid biopsies into the management of cancer. Nat. Rev. Clin. Oncol. 2017, 14, 531–548. [Google Scholar] [CrossRef]
- Wyatt, A.W.; Annala, M.; Aggarwal, R.; Beja, K.; Feng, F.; Youngren, J.; Foye, A.; Lloyd, P.; Nykter, M.; Beer, T.M. Concordance of circulating tumor DNA and matched metastatic tissue biopsy in prostate cancer. JNCI J. Natl. Cancer Inst. 2017, 109. [Google Scholar] [CrossRef]
- Crowley, E.; Di Nicolantonio, F.; Loupakis, F.; Bardelli, A. Liquid biopsy: Monitoring cancer-genetics in the blood. Nat. Rev. Clin. Oncol. 2013, 10, 472. [Google Scholar] [CrossRef] [PubMed]
- Di Santo, R.; Digiacomo, L.; Quagliarini, E.; Capriotti, A.L.; Laganà, A.; Zenezini Chiozzi, R.; Caputo, D.; Cascone, C.; Coppola, R.; Pozzi, D. Personalized graphene oxide-protein corona in the human plasma of pancreatic cancer patients. Front. Bioeng. Biotechnol. 2020, 8, 491. [Google Scholar] [CrossRef]
- Giannopoulou, L.; Zavridou, M.; Kasimir-Bauer, S.; Lianidou, E.S. Liquid biopsy in ovarian cancer: The potential of circulating miRNAs and exosomes. Transl. Res. 2019, 205, 77–91. [Google Scholar] [CrossRef] [PubMed]
- Li, S.; Yi, M.; Dong, B.; Tan, X.; Luo, S.; Wu, K. The role of exosomes in liquid biopsy for cancer diagnosis and prognosis prediction. Int. J. Cancer 2021, 148, 2640–2651. [Google Scholar] [CrossRef]
- Chun-Yan, L.; Zi-Yi, Z.; Tian-Lin, Y.; Yi-Li, W.; Bao, L.; Jiao, L.; Wei-Jun, D. Liquid biopsy biomarkers of renal interstitial fibrosis based on urinary exosome. Exp. Mol. Pathol. 2018, 105, 223–228. [Google Scholar] [CrossRef] [PubMed]
- Li, G.; Tang, W.; Yang, F. Cancer liquid biopsy using integrated microfluidic exosome analysis platforms. Biotechnol. J. 2020, 15, 1900225. [Google Scholar] [CrossRef]
- Cui, S.; Cheng, Z.; Qin, W.; Jiang, L. Exosomes as a liquid biopsy for lung cancer. Lung Cancer 2018, 116, 46–54. [Google Scholar] [CrossRef] [PubMed]
- Zhang, W.; Xia, W.; Lv, Z.; Xin, Y.; Ni, C.; Yang, L. Liquid biopsy for cancer: Circulating tumor cells, circulating free DNA or exosomes? Cell. Physiol. Biochem. 2017, 41, 755–768. [Google Scholar] [CrossRef]
- Halvaei, S.; Daryani, S.; Eslami-S, Z.; Samadi, T.; Jafarbeik-Iravani, N.; Bakhshayesh, T.O.; Majidzadeh-A, K.; Esmaeili, R. Exosomes in cancer liquid biopsy: A focus on breast cancer. Mol. Ther. Nucleic Acids 2018, 10, 131–141. [Google Scholar] [CrossRef]
- György, B.; Szabó, T.G.; Pásztói, M.; Pál, Z.; Misják, P.; Aradi, B.; László, V.; Pállinger, E.; Pap, E.; Kittel, A. Membrane vesicles, current state-of-the-art: Emerging role of extracellular vesicles. Cell. Mol. life Sci. 2011, 68, 2667–2688. [Google Scholar] [CrossRef]
- Petrovčíková, E.; Vičíková, K.; Leksa, V. Extracellular vesicles—Biogenesis, composition, function, uptake and therapeutic applications. Biologia 2018, 73, 437–448. [Google Scholar] [CrossRef]
- Bebelman, M.P.; Smit, M.J.; Pegtel, D.M.; Baglio, S.R. Biogenesis and function of extracellular vesicles in cancer. Pharmacol. Ther. 2018, 188, 1–11. [Google Scholar] [CrossRef] [PubMed]
- Akers, J.C.; Gonda, D.; Kim, R.; Carter, B.S.; Chen, C.C. Biogenesis of extracellular vesicles (EV): Exosomes, microvesicles, retrovirus-like vesicles, and apoptotic bodies. J. Neurooncol. 2013, 113, 1–11. [Google Scholar] [CrossRef] [PubMed]
- Margolis, L.; Sadovsky, Y. The biology of extracellular vesicles: The known unknowns. PLoS Biol. 2019, 17, 1–12. [Google Scholar] [CrossRef]
- Logozzi, M.; De Milito, A.; Lugini, L.; Borghi, M.; Calabro, L.; Spada, M.; Perdicchio, M.; Marino, M.L.; Federici, C.; Iessi, E. High levels of exosomes expressing CD63 and caveolin-1 in plasma of melanoma patients. PLoS ONE 2009, 4, e5219. [Google Scholar] [CrossRef]
- Tai, Y.; Chen, K.; Hsieh, J.; Shen, T. Exosomes in cancer development and clinical applications. Cancer Sci. 2018, 109, 2364–2374. [Google Scholar] [CrossRef] [PubMed]
- Xiao, Y.; Li, Y.; Yuan, Y.; Liu, B.; Pan, S.; Liu, Q.; Qi, X.; Zhou, H.; Dong, W.; Jia, L. The potential of exosomes derived from colorectal cancer as a biomarker. Clin. Chim. Acta 2019, 490, 186–193. [Google Scholar] [CrossRef]
- De Rubis, G.; Krishnan, S.R.; Bebawy, M. Liquid biopsies in cancer diagnosis, monitoring, and prognosis. Trends Pharmacol. Sci. 2019, 40, 172–186. [Google Scholar] [CrossRef]
- Contreras-Naranjo, J.C.; Wu, H.-J.; Ugaz, V.M. Microfluidics for exosome isolation and analysis: Enabling liquid biopsy for personalized medicine. Lab Chip 2017, 17, 3558–3577. [Google Scholar] [CrossRef] [PubMed]
- Zhang, Y.; Bi, J.; Huang, J.; Tang, Y.; Du, S.; Li, P. Exosome: A review of its classification, isolation techniques, storage, diagnostic and targeted therapy applications. Int. J. Nanomed. 2020, 15, 6917–6934. [Google Scholar] [CrossRef] [PubMed]
- Mihály, J.; Deák, R.; Szigyártó, I.C.; Bóta, A.; Beke-Somfai, T.; Varga, Z. Characterization of extracellular vesicles by IR spectroscopy: Fast and simple classification based on amide and C[sbnd]H stretching vibrations. Biochim. Biophys. Acta-Biomembr. 2017, 1859, 459–466. [Google Scholar] [CrossRef]
- Ludwig, N.; Razzo, B.M.; Yerneni, S.S.; Whiteside, T.L. Optimization of cell culture conditions for exosome isolation using mini-size exclusion chromatography (mini-SEC). Exp. Cell Res. 2019, 378, 149–157. [Google Scholar] [CrossRef]
- Hessvik, N.P.; Llorente, A. Current knowledge on exosome biogenesis and release. Cell. Mol. Life Sci. 2018, 75, 193–208. [Google Scholar] [CrossRef] [PubMed]
- Hauser, P.; Wang, S.; Didenko, V.V. Apoptotic bodies: Selective detection in extracellular vesicles. In Methods in Molecular Biology; Humana Press Inc.: Totowa, NJ, USA, 2017; Volume 1554, pp. 193–200. [Google Scholar]
- Jovic, M.; Sharma, M.; Rahajeng, J.; Caplan, S. The early endosome: A busy sorting station for proteins at the crossroads. Histol. Histopathol. 2010, 25, 99. [Google Scholar]
- Scott, C.C.; Gruenberg, J. Ion flux and the function of endosomes and lysosomes: pH is just the start: The flux of ions across endosomal membranes influences endosome function not only through regulation of the luminal pH. Bioessays 2011, 33, 103–110. [Google Scholar] [CrossRef]
- Hu, Y.B.; Dammer, E.B.; Ren, R.J.; Wang, G. The endosomal-lysosomal system: From acidification and cargo sorting to neurodegeneration. Transl. Neurodegener. 2015, 4, 1–10. [Google Scholar] [CrossRef] [PubMed]
- Scott, C.C.; Vacca, F.; Gruenberg, J. Endosome maturation, transport and functions. Semin. Cell Dev. Biol. 2014, 31, 2–10. [Google Scholar] [CrossRef]
- Van Niel, G.; d’Angelo, G.; Raposo, G. Shedding light on the cell biology of extracellular vesicles. Nat. Rev. Mol. cell Biol. 2018, 19, 213. [Google Scholar] [CrossRef] [PubMed]
- Pols, M.S.; Klumperman, J. Trafficking and function of the tetraspanin CD63. Exp. Cell Res. 2009, 315, 1584–1592. [Google Scholar] [CrossRef] [PubMed]
- Hemler, M.E. Tetraspanin functions and associated microdomains. Nat. Rev. Mol. Cell Biol. 2005, 6, 801–811. [Google Scholar] [CrossRef]
- Schmidt, O.; Teis, D. The ESCRT machinery. Curr. Biol. 2012, 22, R116–R120. [Google Scholar] [CrossRef]
- Hurley, J.H. The ESCRT complexes. Crit. Rev. Biochem. Mol. Biol. 2010, 45, 463–487. [Google Scholar] [CrossRef] [PubMed]
- James H, H. ESCRTs are everywhere. EMBO J. 2015, 34, 2398–2407. [Google Scholar]
- Ren, X.; Hurley, J.H. VHS domains of ESCRT-0 cooperate in high-avidity binding to polyubiquitinated cargo. EMBO J. 2010, 29, 1045–1054. [Google Scholar] [CrossRef]
- Babst, M. MVB vesicle formation: ESCRT-dependent, ESCRT-independent and everything in between. Curr. Opin. Cell Biol. 2011, 23, 452–457. [Google Scholar] [CrossRef]
- Katzmann, D.J.; Babst, M.; Emr, S.D. Ubiquitin-dependent sorting into the multivesicular body pathway requires the function of a conserved endosomal protein sorting complex, ESCRT-I. Cell 2001, 106, 145–155. [Google Scholar] [CrossRef]
- Hurley, J.H.; Odorizzi, G. Get on the exosome bus with ALIX. Nat. Cell Biol. 2012, 14, 654–655. [Google Scholar] [CrossRef]
- Christ, L.; Wenzel, E.M.; Liestøl, K.; Raiborg, C.; Campsteijn, C.; Stenmark, H. ALIX and ESCRT-I/II function as parallel ESCRT-III recruiters in cytokinetic abscission. J. Cell Biol. 2016, 212, 499–513. [Google Scholar] [CrossRef] [PubMed]
- Van Niel, G.; Charrin, S.; Simoes, S.; Romao, M.; Rochin, L.; Saftig, P.; Marks, M.S.; Rubinstein, E.; Raposo, G. The tetraspanin CD63 regulates ESCRT-independent and-dependent endosomal sorting during melanogenesis. Dev. Cell 2011, 21, 708–721. [Google Scholar] [CrossRef] [PubMed]
- Charrin, S.; Jouannet, S.; Boucheix, C.; Rubinstein, E. Tetraspanins at a glance. J. Cell Sci. 2014, 127, 3641–3648. [Google Scholar] [CrossRef]
- Bretscher, M.S. Asymmetrical lipid bilayer structure for biological membranes. Nat. New Biol. 1972, 236, 11–12. [Google Scholar] [CrossRef] [PubMed]
- Daleke, D.L. Phospholipid flippases. J. Biol. Chem. 2007, 282, 821–825. [Google Scholar] [CrossRef] [PubMed]
- Daleke, D.L. Regulation of transbilayer plasma membrane phospholipid asymmetry. J. Lipid Res. 2003, 44, 233–242. [Google Scholar] [CrossRef]
- Stout, J.G.; Sims, P.J.; Wiedmer, T. Isolation of an erythrocyte membrane protein that mediates Ca2+-dependent transbilayer movement of phospholipid. J. Biol. Chem. 1996, 271, 17205–17210. [Google Scholar]
- Bevers, E.M.; Williamson, P.L. Phospholipid scramblase: An update. FEBS Lett. 2010, 584, 2724–2730. [Google Scholar] [CrossRef]
- Taylor, J.; Bebawy, M. Proteins Regulating Microvesicle Biogenesis and Multidrug Resistance in Cancer. Proteomics 2019, 19. [Google Scholar] [CrossRef]
- Beer, K.B.; Wehman, A.M. Mechanisms and functions of extracellular vesicle release in vivo—what we can learn from flies and worms. Cell Adhes. Migr. 2017, 11, 135–150. [Google Scholar] [CrossRef] [PubMed]
- Muralidharan-Chari, V.; Clancy, J.; Plou, C.; Romao, M.; Chavrier, P.; Raposo, G.; D’Souza-Schorey, C. ARF6-regulated shedding of tumor cell-derived plasma membrane microvesicles. Curr. Biol. 2009, 19, 1875–1885. [Google Scholar] [CrossRef]
- Jadli, A.S.; Ballasy, N.; Edalat, P.; Patel, V.B. Inside(sight) of tiny communicator: Exosome biogenesis, secretion, and uptake. Mol. Cell. Biochem. 2020, 467, 77–94. [Google Scholar] [CrossRef]
- Atkin-Smith, G.K.; Poon, I.K.H. Disassembly of the dying: Mechanisms and functions. Trends Cell Biol. 2017, 27, 151–162. [Google Scholar] [CrossRef]
- Norbury, C.J.; Hickson, I.D. Cellular responses to DNA damage. Annu. Rev. Pharmacol. Toxicol. 2001, 41, 367–401. [Google Scholar] [CrossRef] [PubMed]
- Elmore, S. Apoptosis: A review of programmed cell death. Toxicol. Pathol. 2007, 35, 495–516. [Google Scholar] [CrossRef]
- Povea-Cabello, S.; Oropesa-Ávila, M.; la Cruz-Ojeda, D.; Villanueva-Paz, M.; De la Mata, M.; Suárez-Rivero, J.M.; Álvarez-Córdoba, M.; Villalón-García, I.; Cotán, D.; Ybot-González, P. Dynamic reorganization of the cytoskeleton during apoptosis: The two coffins hypothesis. Int. J. Mol. Sci. 2017, 18, 2393. [Google Scholar] [CrossRef]
- Robertson, J.D.; Orrenius, S.; Zhivotovsky, B. Nuclear events in apoptosis. J. Struct. Biol. 2000, 129, 346–358. [Google Scholar] [CrossRef]
- Doonan, F.; Cotter, T.G. Morphological assessment of apoptosis. Methods 2008, 44, 200–204. [Google Scholar] [CrossRef]
- Taylor, R.C.; Cullen, S.P.; Martin, S.J. Apoptosis: Controlled demolition at the cellular level. Nat. Rev. Mol. cell Biol. 2008, 9, 231–241. [Google Scholar] [CrossRef]
- Taabazuing, C.Y.; Okondo, M.C.; Bachovchin, D.A. Pyroptosis and apoptosis pathways engage in bidirectional crosstalk in monocytes and macrophages. Cell Chem. Biol. 2017, 24, 507–514. [Google Scholar] [CrossRef]
- Battistelli, M.; Falcieri, E. Apoptotic bodies: Particular extracellular vesicles involved in intercellular communication. Biology (Basel) 2020, 9, 21. [Google Scholar] [CrossRef]
- Martínez, M.C.; Freyssinet, J.-M. Deciphering the plasma membrane hallmarks of apoptotic cells: Phosphatidylserine transverse redistribution and calcium entry. BMC Cell Biol. 2001, 2, 1–11. [Google Scholar] [CrossRef][Green Version]
- Friedl, P.; Vischer, P.; Freyberg, M.A. The role of thrombospondin-1 in apoptosis. Cell. Mol. Life Sci. 2002, 59, 1347–1357. [Google Scholar] [CrossRef]
- Kalluri, R.; LeBleu, V.S. The biology, function, and biomedical applications of exosomes. Science 2020, 367. [Google Scholar] [CrossRef]
- Kowal, J.; Arras, G.; Colombo, M.; Jouve, M.; Morath, J.P.; Primdal-Bengtson, B.; Dingli, F.; Loew, D.; Tkach, M.; Théry, C. Proteomic comparison defines novel markers to characterize heterogeneous populations of extracellular vesicle subtypes. Proc. Natl. Acad. Sci. USA 2016, 113, E968–E977. [Google Scholar] [CrossRef]
- Webber, J.; Clayton, A. How pure are your vesicles? J. Extracell. Vesicles 2013, 2, 19861. [Google Scholar] [CrossRef] [PubMed]
- Sódar, B.W.; Kittel, Á.; Pálóczi, K.; Vukman, K.V.; Osteikoetxea, X.; Szabó-Taylor, K.; Németh, A.; Sperlágh, B.; Baranyai, T.; Giricz, Z.; et al. Low-density lipoprotein mimics blood plasma-derived exosomes and microvesicles during isolation and detection. Sci. Rep. 2016, 6, 1–12. [Google Scholar] [CrossRef]
- Baranyai, T.; Herczeg, K.; Onódi, Z.; Voszka, I.; Módos, K.; Marton, N.; Nagy, G.; Mäger, I.; Wood, M.J.; El Andaloussi, S.; et al. Isolation of exosomes from blood plasma: Qualitative and quantitative comparison of ultracentrifugation and size exclusion chromatography methods. PLoS ONE 2015, 10, 1–13. [Google Scholar] [CrossRef]
- Van Deun, J.; Mestdagh, P.; Sormunen, R.; Cocquyt, V.; Vermaelen, K.; Vandesompele, J.; Bracke, M.; De Wever, O.; Hendrix, A. The impact of disparate isolation methods for extracellular vesicles on downstream RNA profiling. J. Extracell. Vesicles 2014, 3. [Google Scholar] [CrossRef]
- Zhang, M.; Jin, K.; Gao, L.; Zhang, Z.; Li, F.; Zhou, F.; Zhang, L. Methods and Technologies for Exosome Isolation and Characterization. Small Methods 2018, 2, 1800021. [Google Scholar] [CrossRef]
- Momen-Heravi, F.; Balaj, L.; Alian, S.; Mantel, P.Y.; Halleck, A.E.; Trachtenberg, A.J.; Soria, C.E.; Oquin, S.; Bonebreak, C.M.; Saracoglu, E.; et al. Current methods for the isolation of extracellular vesicles. Biol. Chem. 2013, 394, 1253–1262. [Google Scholar] [CrossRef] [PubMed]
- Momen-Heravi, F. Isolation of Extracellular Vesicles by Ultracentrifugation. Extracell. Vesicles 2017, 25–32. [Google Scholar] [CrossRef]
- Gupta, S.; Rawat, S.; Arora, V.; Kottarath, S.K.; Dinda, A.K.; Vaishnav, P.K.; Nayak, B.; Mohanty, S. An improvised one-step sucrose cushion ultracentrifugation method for exosome isolation from culture supernatants of mesenchymal stem cells. Stem Cell Res. Ther. 2018, 9, 180. [Google Scholar] [CrossRef]
- Batrakova, E.V.; Kim, M.S. Using exosomes, naturally-equipped nanocarriers, for drug delivery. J. Control. Release 2015, 219, 396–405. [Google Scholar] [CrossRef]
- Zeringer, E.; Barta, T.; Li, M.; Vlassov, A.V. Strategies for isolation of exosomes. Cold Spring Harb. Protoc. 2015, 2015, 319–323. [Google Scholar] [CrossRef] [PubMed]
- Li, P.; Kaslan, M.; Lee, S.H.; Yao, J.; Gao, Z. Progress in exosome isolation techniques. Theranostics 2017, 7, 789–804. [Google Scholar] [CrossRef]
- Taylor, D.D.; Zacharias, W.; Gercel-Taylor, C. Exosome isolation for proteomic analyses and RNA profiling. Methods Mol. Biol. 2011, 728, 235–246. [Google Scholar] [CrossRef]
- Hou, R.; Li, Y.; Sui, Z.; Yuan, H.; Yang, K.; Liang, Z.; Zhang, L.; Zhang, Y. Advances in exosome isolation methods and their applications in proteomic analysis of biological samples. Anal. Bioanal. Chem. 2019, 411, 5351–5361. [Google Scholar] [CrossRef]
- Hage, D.S.; Matsuda, R. Affinity chromatography: A historical perspective. Methods Mol. Biol. 2015, 1286. [Google Scholar] [CrossRef]
- Gámez-Valero, A.; Monguió-Tortajada, M.; Carreras-Planella, L.; Franquesa, M.; Beyer, K.; Borràs, F.E. Size-Exclusion Chromatography-based isolation minimally alters Extracellular Vesicles’ characteristics compared to precipitating agents. Sci. Rep. 2016, 6, 1–9. [Google Scholar] [CrossRef] [PubMed]
- Böing, A.N.; van der Pol, E.; Grootemaat, A.E.; Coumans, F.A.W.; Sturk, A.; Nieuwland, R. Single-step isolation of extracellular vesicles by size-exclusion chromatography. J. Extracell. Vesicles 2014, 3, 1–11. [Google Scholar] [CrossRef] [PubMed]
- Lozano-Ramos, I.; Bancu, I.; Oliveira-Tercero, A.; Armengol, M.P.; Menezes-Neto, A.; Del Portillo, H.A.; Lauzurica-Valdemoros, R.; Borràs, F.E. Size-exclusion chromatography-based enrichment of extracellular vesicles from urine samples. J. Extracell. Vesicles 2015, 4, 1–11. [Google Scholar] [CrossRef] [PubMed]
- Muller, L.; Hong, C.S.; Stolz, D.B.; Watkins, S.C.; Whiteside, T.L. Isolation of biologically-active exosomes from human plasma. J. Immunol. Methods 2014, 411, 55–65. [Google Scholar] [CrossRef] [PubMed]
- Konoshenko, M.Y.; Lekchnov, E.A.; Vlassov, A.V.; Laktionov, P.P. Isolation of Extracellular Vesicles: General Methodologies and Latest Trends. BioMed Res. Int. 2018, 2018, 1–27. [Google Scholar] [CrossRef]
- Sidhom, K.; Obi, P.O.; Saleem, A. A review of exosomal isolation methods: Is size exclusion chromatography the best option? Int. J. Mol. Sci. 2020, 21, 6466. [Google Scholar] [CrossRef]
- Chen, B.Y.; Sung, C.W.H.; Chen, C.; Cheng, C.M.; Lin, D.P.C.; Te Huang, C.; Hsu, M.Y. Advances in exosomes technology. Clin. Chim. Acta 2019, 493, 14–19. [Google Scholar] [CrossRef] [PubMed]
- Boriachek, K.; Islam, M.N.; Möller, A.; Salomon, C.; Nguyen, N.T.; Hossain, M.S.A.; Yamauchi, Y.; Shiddiky, M.J.A. Biological Functions and Current Advances in Isolation and Detection Strategies for Exosome Nanovesicles. Small 2018, 14, 1–21. [Google Scholar] [CrossRef] [PubMed]
- Yoo, C.E.; Kim, G.; Kim, M.; Park, D.; Kang, H.J.; Lee, M.; Huh, N. A direct extraction method for microRNAs from exosomes captured by immunoaffinity beads. Anal. Biochem. 2012, 431, 96–98. [Google Scholar] [CrossRef]
- Walls, D.; Walker, J.M. Protein Chromatography: Methods and Protocols. Methods Mol. Biol. 2017, 1485, 27–48. [Google Scholar] [CrossRef]
- Logozzi, M.; Di Raimo, R.; Mizzoni, D.; Fais, S. Immunocapture-based ELISA to characterize and quantify exosomes in both cell culture supernatants and body fluids. Methods Enzymol. 2020, 645, 155–180. [Google Scholar] [CrossRef]
- Chen, C.; Skog, J.; Hsu, C.-H.; Lessard, R.T.; Balaj, L.; Wurdinger, T.; Carter, B.S.; Breakefield, X.O.; Toner, M.; Irimia, D. Microfluidic isolation and transcriptome analysis of serum microvesicles. Lab Chip 2010, 10, 1–7. [Google Scholar] [CrossRef]
- Zhao, Z.; Yang, Y.; Zeng, Y.; He, M. A Microfluidic ExoSearch Chip for Multiplexed Exosome Detection Towards Blood-based Ovarian Cancer Diagnosis. Lab Chip 2016, 16, 489–496. [Google Scholar] [CrossRef] [PubMed]
- Vaidyanathan, R.; Naghibosadat, M.; Rauf, S.; Korbie, D.; Carrascosa, L.G.; Shiddiky, M.J.A.; Trau, M. Detecting exosomes specifically: A multiplexed device based on alternating current electrohydrodynamic induced nanoshearing. Anal. Chem. 2014, 86, 11125–11132. [Google Scholar] [CrossRef]
- Koliha, N.; Wiencek, Y.; Heider, U.; Jü Ngst, C.; Kladt, N.; Krauthä User, S.; Johnston, I.C.D.; Bosio, A.; Schauss, A.; Wild, S. A novel multiplex bead-based platform highlights the diversity of extracellular vesicles Cologne Excellence Cluster on Cellular Stress Responses in Aging-Associated Diseases. J. Extracell. Vesicles 2016, 1, 1–15. [Google Scholar]
- Cai, S.; Luo, B.; Jiang, P.; Zhou, X.; Lan, F.; Yi, Q.; Wu, Y. Immuno-modified superparamagnetic nanoparticles via host-guest interactions for high-purity capture and mild release of exosomes. Nanoscale 2018, 10, 14280–14289. [Google Scholar] [CrossRef]
- Feigin, L.A.; Svergun, D.I. Structure Analysis by Small-Angle X-ray and Neutron Scattering; Plenum Press: New York, NY, USA, 1987. [Google Scholar]
- Svergun, D.I. Restoring low resolution structure of biological macromolecules from solution scattering using simulated annealing. Biophys. J. 1999. [Google Scholar] [CrossRef]
- Ciasca, G.; Chiarpotto, M.; Campi, G.; Bocca, B.; Rodio, M.; Pino, A.; Ricci, A.; Poccia, N.; Rossi, C.; Alimonti, A.; et al. Reconstitution of aluminium and iron core in horse spleen apoferritin. J. Nanoparticle Res. 2011, 13, 6149–6155. [Google Scholar] [CrossRef]
- Chiarpotto, M.; Ciasca, G.; Vassalli, M.; Rossi, C.; Campi, G.; Ricci, A.; Bocca, B.; Pino, A.; Alimonti, A.; De Sole, P.; et al. Mechanism of aluminium bio-mineralization in the apoferritin cavity. Appl. Phys. Lett. 2013, 103. [Google Scholar] [CrossRef]
- Svergun, D.I.; Koch, M.H.J. Small-angle scattering studies of biological macromolecules in solution. Rep. Prog. Phys. 2003. [Google Scholar] [CrossRef]
- Campi, G.; Fratini, M.; Bukreeva, I.; Ciasca, G.; Burghammer, M.; Brun, F.; Tromba, G.; Mastrogiacomo, M.; Cedola, A. Imaging collagen packing dynamics during mineralization of engineered bone tissue. Acta Biomater. 2015, 23. [Google Scholar] [CrossRef]
- De Felici, M.; Felici, R.; Ferrero, C.; Tartari, A.; Gambaccini, M.; Finet, S. Structural characterization of the human cerebral myelin sheath by small angle x-ray scattering. Phys. Med. Biol. 2008. [Google Scholar] [CrossRef] [PubMed]
- Jensen, T.H.; Bech, M.; Bunk, O.; Thomsen, M.; Menzel, A.; Bouchet, A.; Le Duc, G.; Feidenhans’L, R.; Pfeiffer, F. Brain tumor imaging using small-angle x-ray scattering tomography. Phys. Med. Biol. 2011. [Google Scholar] [CrossRef] [PubMed]
- Cedola, A.; Campi, G.; Pelliccia, D.; Bukreeva, I.; Fratini, M.; Burghammer, M.; Rigon, L.; Arfelli, F.; Chang Chen, R.; Dreossi, D.; et al. Three dimensional visualization of engineered bone and soft tissue by combined X-ray micro-diffraction and phase contrast tomography. Phys. Med. Biol. 2014, 59, 189–201. [Google Scholar] [CrossRef]
- Campi, G.; Cristofaro, F.; Pani, G.; Fratini, M.; Pascucci, B.; Corsetto, P.A.; Weinhausen, B.; Cedola, A.; Rizzo, A.M.; Visai, L.; et al. Heterogeneous and self-organizing mineralization of bone matrix promoted by hydroxyapatite nanoparticles. Nanoscale 2017, 9, 17274–17283. [Google Scholar] [CrossRef]
- Pilz, I.; Glatter, O.; Kratky, O. Small-angle x-ray scattering. Methods Enzymol. 1979. [Google Scholar] [CrossRef]
- Neylon, C. Small angle neutron and X-ray scattering in structural biology: Recent examples from the literature. Eur. Biophys. J. 2008, 37, 531–541. [Google Scholar] [CrossRef] [PubMed]
- Antonov, L.D.; Olsson, S.; Boomsma, W.; Hamelryck, T. Bayesian inference of protein ensembles from SAXS data. Phys. Chem. Chem. Phys. 2016. [Google Scholar] [CrossRef] [PubMed]
- Walther, D.; Cohen, F.E.; Doniach, S. Reconstruction of low-resolution three-dimensional density maps from one-dimensional small-angle X-ray solution scattering data for biomolecules. J. Appl. Crystallogr. 2000. [Google Scholar] [CrossRef]
- Seung, J.K.; Dumont, C.; Gruebele, M. Simulation-based fitting of protein-protein interaction potentials to SAXS experiments. Biophys. J. 2008. [Google Scholar] [CrossRef]
- Perini, G.; Ciasca, G.; Minelli, E.; Papi, M.; Palmieri, V.; Maulucci, G.; Nardini, M.; Latina, V.; Corsetti, V.; Florenzano, F.; et al. Dynamic structural determinants underlie the neurotoxicity of the N-terminal tau 26-44 peptide in Alzheimer’s disease and other human tauopathies. Int. J. Biol. Macromol. 2019, 141. [Google Scholar] [CrossRef]
- Bianconi, A.; Ciasca, G.; Tenenbaum, A.; Battisti, A.; Campi, G. Temperature and solvent dependence of the dynamical landscape of tau protein conformations. J. Biol. Phys. 2012. [Google Scholar] [CrossRef] [PubMed]
- Battisti, A.; Ciasca, G.; Grottesi, A.; Tenenbaum, A. Thermal compaction of the intrinsically disordered protein tau: Entropic, structural, and hydrophobic factors. Phys. Chem. Chem. Phys. 2017, 19. [Google Scholar] [CrossRef]
- Svergun, D.; Barberato, C.; Koch, M.H. CRYSOL—A program to evaluate X-ray solution scattering of biological macromolecules from atomic coordinates. J. Appl. Crystallogr. 1995. [Google Scholar] [CrossRef]
- Tria, G.; Mertens, H.D.T.; Kachala, M.; Svergun, D.I. Advanced ensemble modelling of flexible macromolecules using X-ray solution scattering. IUCrJ 2015. [Google Scholar] [CrossRef] [PubMed]
- van der Pol, E.; Coumans, F.; Varga, Z.; Krumrey, M.; Nieuwland, R. Innovation in detection of microparticles and exosomes. J. Thromb. Haemost. 2013, 11, 36–45. [Google Scholar] [CrossRef]
- Bouwstra, J.A.; Gooris, G.S.; Bras, W.; Talsma, H. Small angle X-ray scattering: Possibilities and limitations in characterization of vesicles. Chem. Phys. Lipids 1993, 64, 83–98. [Google Scholar] [CrossRef]
- Castorph, S.; Riedel, D.; Arleth, L.; Sztucki, M.; Jahn, R.; Holt, M.; Salditt, T. Structure parameters of synaptic vesicles quantified by small-angle X-Ray scattering. Biophys. J. 2010. [Google Scholar] [CrossRef] [PubMed]
- Varga, Z.; Yuana, Y.; Grootemaat, A.E.; Van der Pol, E.; Gollwitzer, C.; Krumrey, M.; Nieuwland, R. Towards traceable size determination of extracellular vesicles. J. Extracell. Vesicles 2014, 3, 23298. [Google Scholar] [CrossRef] [PubMed]
- Accardo, A.; Tirinato, L.; Altamura, D.; Sibillano, T.; Giannini, C.; Riekel, C.; Di Fabrizio, E. Superhydrophobic surfaces allow probing of exosome self organization using X-ray scattering. Nanoscale 2013, 5, 2295–2299. [Google Scholar] [CrossRef]
- Romancino, D.P.; Buffa, V.; Caruso, S.; Ferrara, I.; Raccosta, S.; Notaro, A.; Campos, Y.; Noto, R.; Martorana, V.; Cupane, A. Palmitoylation is a post-translational modification of Alix regulating the membrane organization of exosome-like small extracellular vesicles. Biochim. Biophys. Acta (BBA)-General Subj. 2018, 1862, 2879–2887. [Google Scholar] [CrossRef] [PubMed]
- Montis, C.; Salvatore, A.; Valle, F.; Paolini, L.; Carlà, F.; Bergese, P.; Berti, D. Biogenic supported lipid bilayers as a tool to investigate nano-bio interfaces. J. Colloid Interface Sci. 2020, 570, 340–349. [Google Scholar] [CrossRef] [PubMed]
- Sibillano, T.; De Caro, L.; Altamura, D.; Siliqi, D.; Ramella, M.; Boccafoschi, F.; Ciasca, G.; Campi, G.; Tirinato, L.; Di Fabrizio, E.; et al. An optimized table-top small-angle X-ray scattering set-up for the nanoscale structural analysis of soft matter. Sci. Rep. 2014, 4. [Google Scholar] [CrossRef] [PubMed]
- Movasaghi, Z.; Rehman, S.; Rehman, I.U. Fourier transform infrared (FTIR) spectroscopy of biological tissues. Appl. Spectrosc. Rev. 2008, 43, 134–179. [Google Scholar] [CrossRef]
- Caetano, P.C.; Strixino, J.F.; Raniero, L. Analysis of saliva by fourier transform infrared spectroscopy for diagnosis of physiological stress in athletes. Rev. Bras. Eng. Biomed. 2015, 31, 116–124. [Google Scholar] [CrossRef]
- Talari, A.C.S.; Martinez, M.A.G.; Movasaghi, Z.; Rehman, S.; Rehman, I.U. Advances in Fourier transform infrared (FTIR) spectroscopy of biological tissues. Appl. Spectrosc. Rev. 2017, 52, 456–506. [Google Scholar] [CrossRef]
- Sodo, A.; Verri, M.; Palermo, A.; Naciu, A.M.; Sponziello, M.; Durante, C.; Di Gioacchino, M.; Paolucci, A.; di Masi, A.; Longo, F.; et al. Raman Spectroscopy Discloses Altered Molecular Profile in Thyroid Adenomas. Diagnostics 2020, 11, 43. [Google Scholar] [CrossRef] [PubMed]
- Sbroscia, M.; Di Gioacchino, M.; Ascenzi, P.; Crucitti, P.; di Masi, A.; Giovannoni, I.; Longo, F.; Mariotti, D.; Naciu, A.M.; Palermo, A.; et al. Thyroid cancer diagnosis by Raman spectroscopy. Sci. Rep. 2020. [Google Scholar] [CrossRef]
- Primiano, A.; Persichilli, S.; Di Giacinto, F.; Ciasca, G.; Baroni, S.; Ferraro, P.M.; De Spirito, M.; Urbani, A.; Gervasoni, J. Attenuated total reflection-fourier transform infrared spectroscopy (ATR-FTIR) detection as a rapid and convenient screening test for cystinuria. Clin. Chim. Acta 2021, 518, 128–133. [Google Scholar] [CrossRef]
- Baddela, V.S.; Nayan, V.; Rani, P.; Onteru, S.K.; Singh, D. Physicochemical Biomolecular Insights into Buffalo Milk-Derived Nanovesicles. Appl. Biochem. Biotechnol. 2016, 178, 544–557. [Google Scholar] [CrossRef] [PubMed]
- Krafft, C.; Wilhelm, K.; Eremin, A.; Nestel, S.; von Bubnoff, N.; Schultze-Seemann, W.; Popp, J.; Nazarenko, I. A specific spectral signature of serum and plasma-derived extracellular vesicles for cancer screening. Nanomed. Nanotechnol. Biol. Med. 2017, 13, 835–841. [Google Scholar] [CrossRef]
- Pascucci, L.; Coccè, V.; Bonomi, A.; Ami, D.; Ceccarelli, P.; Ciusani, E.; Viganò, L.; Locatelli, A.; Sisto, F.; Doglia, S.M.; et al. Paclitaxel is incorporated by mesenchymal stromal cells and released in exosomes that inhibit in vitro tumor growth: A new approach for drug delivery. J. Control. Release 2014, 192, 262–270. [Google Scholar] [CrossRef]
- Martins, T.S.; Magalhães, S.; Rosa, I.M.; Vogelgsang, J.; Wiltfang, J.; Delgadillo, I.; Catita, J.; da Cruz e Silva, O.A.B.; Nunes, A.; Henriques, A.G. Potential of FTIR Spectroscopy Applied to Exosomes for Alzheimer’s Disease Discrimination: A Pilot Study. J. Alzheimer Dis. 2020, 1–16. [Google Scholar] [CrossRef]
- Zlotogorski-Hurvitz, A.; Dekel, B.Z.; Malonek, D.; Yahalom, R.; Vered, M. FTIR-based spectrum of salivary exosomes coupled with computational-aided discriminating analysis in the diagnosis of oral cancer. J. Cancer Res. Clin. Oncol. 2019, 145, 685–694. [Google Scholar] [CrossRef] [PubMed]
- Lee, J.; Wen, B.; Carter, E.A.; Combes, V.; Grau, G.E.R.; Lay, P.A. Infrared spectroscopic characterization of monocytic microvesicles (microparticles) released upon lipopolysaccharide stimulation. FASEB J. 2017, 31, 2817–2827. [Google Scholar] [CrossRef] [PubMed]
- Fernandez, A.; João Canha Pereira, M.; Ramalhete, L.; Aleixo, S.; Lobato da Silva, C.; Cabral, J.; Calado, C.R. Evaluating the Impact of Culture Conditions on Human Mesenchymal Stem / Stromal Cell-derived Exosomes through FTIR Spectroscopy. In Proceedings of the 2019 Engineering Conferences International (ECI), Coronado, CA, USA, 27–31 January 2019. [Google Scholar]
- Romanò, S.; Di Giacinto, F.; Primiano, A.; Mazzini, A.; Panzetta, C.; Papi, M.; Di Gaspare, A.; Ortolani, M.; Gervasoni, J.; De Spirito, M.; et al. Fourier Transform Infrared Spectroscopy as a useful tool for the automated classification of cancer cell-derived exosomes obtained under different culture conditions. Anal. Chim. Acta 2020. [Google Scholar] [CrossRef] [PubMed]
- Yap, X.-L.; Ong, T.-A.; Lim, J.; Wood, B.; Lee, W.-L. Study of prostate cancer-derived extracellular vesicles in urine using IR spectroscopy. Prog. Drug Discov. Biomed. Sci. 2019, 2, 4–7. [Google Scholar] [CrossRef]
- Yan, Z.; Dutta, S.; Liu, Z.; Yu, X.; Mesgarzadeh, N.; Ji, F.; Bitan, G.; Xie, Y.H. A Label-free platform for identification of exosomes from different sources. ACS Sens. 2019. [Google Scholar] [CrossRef] [PubMed]
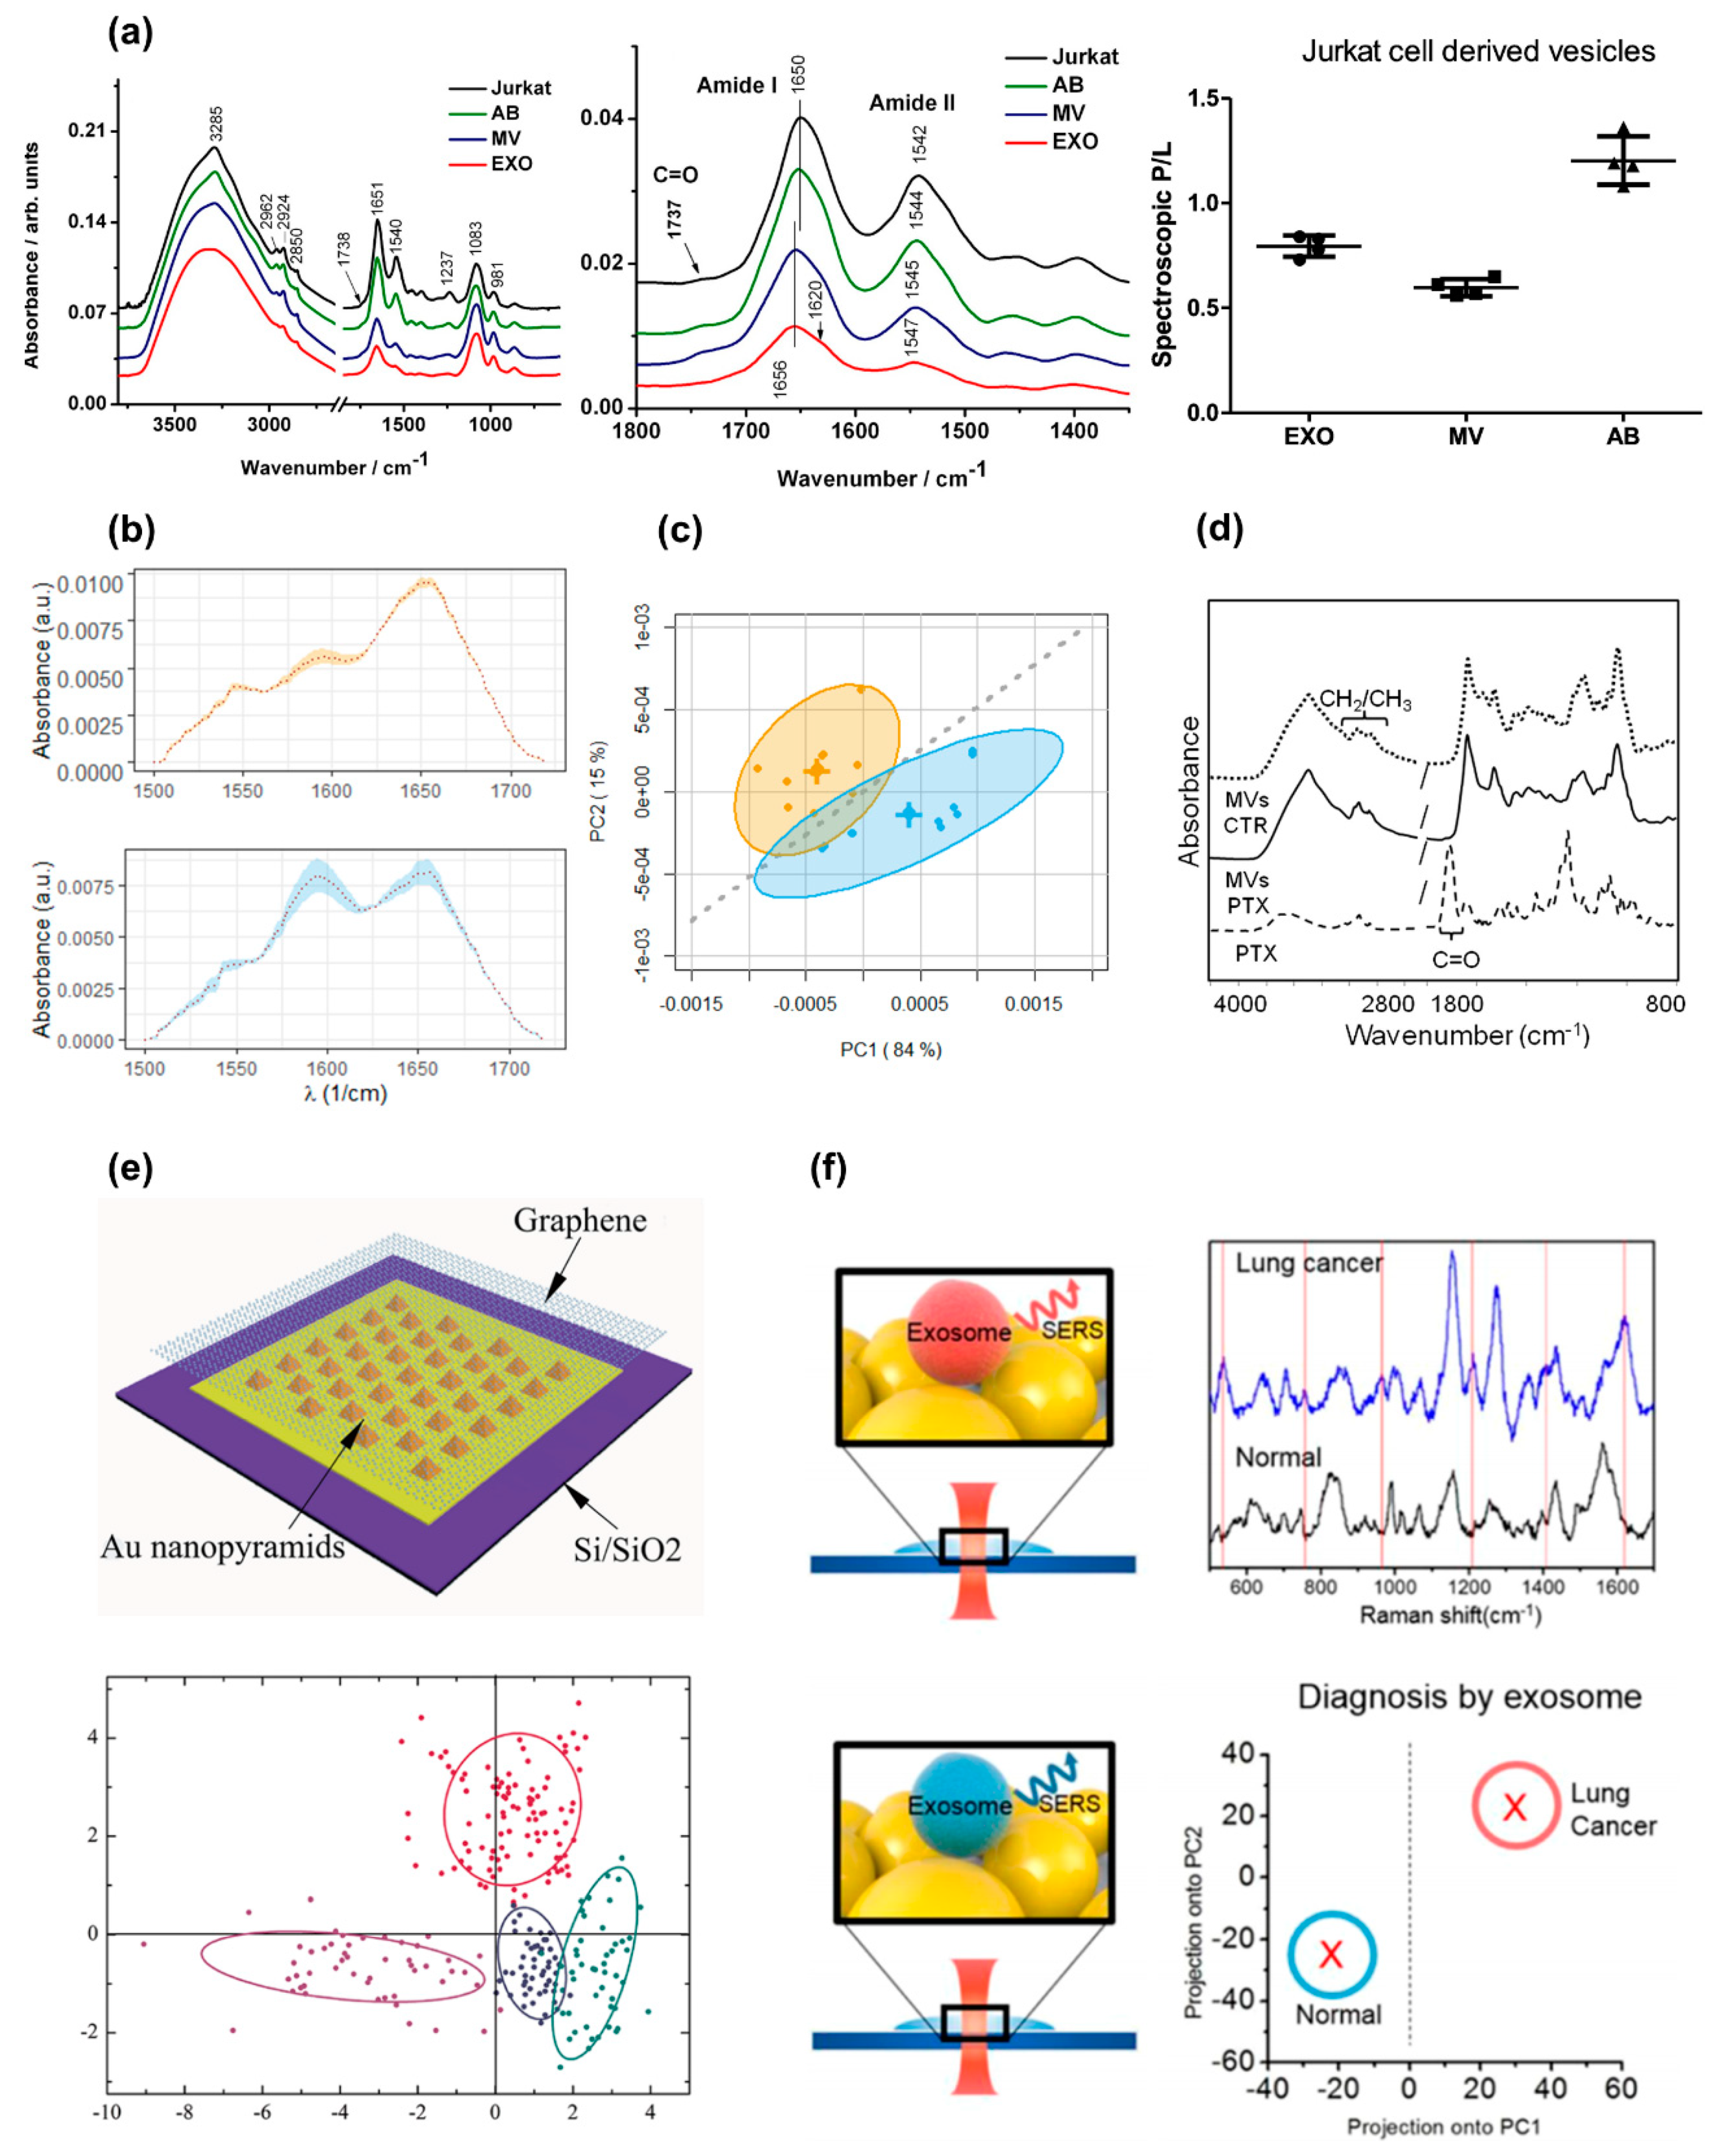
- Park, J.; Hwang, M.; Choi, B.; Jeong, H.; Jung, J.H.; Kim, H.K.; Hong, S.; Park, J.H.; Choi, Y. Exosome Classification by Pattern Analysis of Surface-Enhanced Raman Spectroscopy Data for Lung Cancer Diagnosis. Anal. Chem. 2017. [Google Scholar] [CrossRef] [PubMed]
- Lavialle, F.; Deshayes, S.; Gonnet, F.; Larquet, E.; Kruglik, S.G.; Boisset, N.; Daniel, R.; Alfsen, A.; Tatischeff, I. Nanovesicles released by Dictyostelium cells: A potential carrier for drug delivery. Int. J. Pharm. 2009. [Google Scholar] [CrossRef]
- Van Der Pol, E.; Hoekstra, A.G.; Sturk, A.; Otto, C.; Van Leeuwen, T.G.; Nieuwland, R. Optical and non-optical methods for detection and characterization of microparticles and exosomes. J. Thromb. Haemost. 2010, 8, 2596–2607. [Google Scholar] [CrossRef] [PubMed]
- Merdalimova, A.; Chernyshev, V.; Nozdriukhin, D.; Rudakovskaya, P.; Gorin, D.; Yashchenok, A. Identification and analysis of exosomes by surface-enhanced Raman spectroscopy. Appl. Sci. 2019, 9, 1135. [Google Scholar] [CrossRef]
- Tirinato, L.; Gentile, F.; Di Mascolo, D.; Coluccio, M.L.; Das, G.; Liberale, C.; Pullano, S.A.; Perozziello, G.; Francardi, M.; Accardo, A.; et al. SERS analysis on exosomes using super-hydrophobic surfaces. Microelectron. Eng. 2012, 97, 337–340. [Google Scholar] [CrossRef]
- De Angelis, F.; Gentile, F.; Mecarini, F.; Das, G.; Moretti, M.; Candeloro, P.; Coluccio, M.L.; Cojoc, G.; Accardo, A.; Liberale, C.; et al. Breaking the diffusion limit with super-hydrophobic delivery of molecules to plasmonic nanofocusing SERS structures. Nat. Photonics 2011. [Google Scholar] [CrossRef]
- Gentile, F.; Moretti, M.; Limongi, T.; Falqui, A.; Bertoni, G.; Scarpellini, A.; Santoriello, S.; Maragliano, L.; Proietti Zaccaria, R.; Di Fabrizio, E. Direct imaging of DNA fibers: The visage of double helix. Nano Lett. 2012. [Google Scholar] [CrossRef] [PubMed]
- Campi, G.; Ciasca, G.; Poccia, N.; Ricci, A.; Fratini, M.; Bianconi, A. Controlling photoinduced electron transfer via defects self-organization for novel functional macromolecular systems. Curr. Protein Pept. Sci. 2014, 15. [Google Scholar] [CrossRef]
- Ciasca, G.; Businaro, L.; Papi, M.; Notargiacomo, A.; Chiarpotto, M.; De Ninno, A.; Palmieri, V.; Carta, S.; Giovine, E.; Gerardino, A.; et al. Self-assembling of large ordered DNA arrays using superhydrophobic patterned surfaces. Nanotechnology 2013, 24. [Google Scholar] [CrossRef]
- Ciasca, G.; Businaro, L.; De Ninno, A.; Cedola, A.; Notargiacomo, A.; Campi, G.; Papi, M.; Ranieri, A.; Carta, S.; Giovine, E.; et al. Wet sample confinement by superhydrophobic patterned surfaces for combined X-ray fluorescence and X-ray phase contrast imaging. Microelectron. Eng. 2013, 111. [Google Scholar] [CrossRef]
- Ciasca, G.; Papi, M.; Businaro, L.; Campi, G.; Ortolani, M.; Palmieri, V.; Cedola, A.; De Ninno, A.; Gerardino, A.; Maulucci, G.; et al. Recent advances in superhydrophobic surfaces and their relevance to biology and medicine. Bioinspir. Biomim. 2016, 11. [Google Scholar] [CrossRef]
- Stremersch, S.; Marro, M.; El Pinchasik, B.; Baatsen, P.; Hendrix, A.; De Smedt, S.C.; Loza-Alvarez, P.; Skirtach, A.G.; Raemdonck, K.; Braeckmans, K. Identification of individual exosome-like vesicles by surface enhanced raman spectroscopy. Small 2016. [Google Scholar] [CrossRef]
- Shin, H.; Jeong, H.; Park, J.; Hong, S.; Choi, Y. Correlation between Cancerous Exosomes and Protein Markers Based on Surface-Enhanced Raman Spectroscopy (SERS) and Principal Component Analysis (PCA). ACS Sens. 2018. [Google Scholar] [CrossRef] [PubMed]
- Shin, H.; Oh, S.; Hong, S.; Kang, M.; Kang, D.; Ji, Y.; Choi, B.H.; Kang, K.-W.; Jeong, H.; Park, Y.; et al. Early-Stage Lung Cancer Diagnosis by Deep Learning-Based Spectroscopic Analysis of Circulating Exosomes. ACS Nano 2020. [Google Scholar] [CrossRef] [PubMed]
- Kerr, L.T.; Gubbins, L.; Weiner Gorzel, K.; Sharma, S.; Kell, M.; McCann, A.; Hennelly, B.M. Raman spectroscopy and SERS analysis of ovarian tumour derived exosomes (TEXs): A preliminary study. Biophotonics Photonic Solut. Better Health Care IV 2014, 9129, 91292Q. [Google Scholar] [CrossRef]
- Zhang, P.; Wang, L.; Fang, Y.; Zheng, D.; Lin, T.; Wang, H. Label-free exosomal detection and classification in rapid discriminating different cancer types based on specific Raman phenotypes and multivariate statistical analysis. Molecules 2019, 24, 2947. [Google Scholar] [CrossRef]
- Sivashanmugan, K.; Huang, W.L.; Lin, C.H.; Der Liao, J.; Lin, C.C.; Su, W.C.; Wen, T.C. Bimetallic nanoplasmonic gap-mode SERS substrate for lung normal and cancer-derived exosomes detection. J. Taiwan Inst. Chem. Eng. 2017. [Google Scholar] [CrossRef]
- Lee, C.; Carney, R.P.; Hazari, S.; Smith, Z.J.; Knudson, A.; Robertson, C.S.; Lam, K.S.; Wachsmann-Hogiu, S. 3D plasmonic nanobowl platform for the study of exosomes in solution. Nanoscale 2015. [Google Scholar] [CrossRef]
- Avella-Oliver, M.; Puchades, R.; Wachsmann-Hogiu, S.; Maquieira, A. Label-free SERS analysis of proteins and exosomes with large-scale substrates from recordable compact disks. Sens. Actuators B Chem. 2017. [Google Scholar] [CrossRef]
- Tatischeff, I.; Larquet, E.; Falcón-Pérez, J.M.; Turpin, P.Y.; Kruglik, S.G. Fast characterisation of cell-derived extracellular vesicles by nanoparticles tracking analysis, cryo-electron microscopy, and Raman tweezers microspectroscopy. J. Extracell. Vesicles 2012, 1. [Google Scholar] [CrossRef]
- Smith, Z.J.; Lee, C.; Rojalin, T.; Carney, R.P.; Hazari, S.; Knudson, A.; Lam, K.; Saari, H.; Ibañez, E.L.; Viitala, T.; et al. Single exosome study reveals subpopulations distributed among cell lines with variability related to membrane content. J. Extracell. Vesicles 2015, 4. [Google Scholar] [CrossRef]
- Gualerzi, A.; Niada, S.; Giannasi, C.; Picciolini, S.; Morasso, C.; Vanna, R.; Rossella, V.; Masserini, M.; Bedoni, M.; Ciceri, F.; et al. Raman spectroscopy uncovers biochemical tissue-related features of extracellular vesicles from mesenchymal stromal cells. Sci. Rep. 2017, 7, 1–11. [Google Scholar] [CrossRef]
- Kruglik, S.G.; Royo, F.; Guigner, J.M.; Palomo, L.; Seksek, O.; Turpin, P.Y.; Tatischeff, I.; Falcón-Pérez, J.M. Raman tweezers microspectroscopy of: Circa 100 nm extracellular vesicles. Nanoscale 2019. [Google Scholar] [CrossRef] [PubMed]
- Krieg, M.; Fläschner, G.; Alsteens, D.; Gaub, B.M.; Roos, W.H.; Wuite, G.J.L.; Gaub, H.E.; Gerber, C.; Dufrêne, Y.F.; Müller, D.J. Atomic force microscopy-based mechanobiology. Nat. Rev. Phys. 2019, 1, 41–57. [Google Scholar] [CrossRef]
- Raposo, M.; Ferreira, Q.; Ribeiro, P.A. A guide for atomic force microscopy analysis of soft-condensed matter. Mod. Res. Educ. Top. Microsc. 2007, 1, 758–769. [Google Scholar]
- Wilson, L.; Matsudaira, P.T.; Jena, B.P.; Horber, J.K.H. Atomic Force Microscopy in Cell Biology; Academic Press: Cambridge, MA, USA, 2002; ISBN 0080549446. [Google Scholar]
- Kuznetsova, T.G.; Starodubtseva, M.N.; Yegorenkov, N.I.; Chizhik, S.A.; Zhdanov, R.I. Atomic force microscopy probing of cell elasticity. Micron 2007, 38, 824–833. [Google Scholar] [CrossRef]
- Azeloglu, E.U.; Costa, K.D. Atomic force microscopy in mechanobiology: Measuring microelastic heterogeneity of living cells. Methods Mol. Biol. 2011, 736, 303–329. [Google Scholar] [PubMed]
- Ciasca, G.; Sassun, T.E.; Minelli, E.; Antonelli, M.; Papi, M.; Santoro, A.; Giangaspero, F.; Delfini, R.; De Spirito, M. Nano-mechanical signature of brain tumours. Nanoscale 2016, 8, 19629–19643. [Google Scholar] [CrossRef] [PubMed]
- Rianna, C.; Radmacher, M. Comparison of viscoelastic properties of cancer and normal thyroid cells on different stiffness substrates. Eur. Biophys. J. 2017, 46, 309–324. [Google Scholar] [CrossRef]
- Ciasca, G.; Pagliei, V.; Minelli, E.; Palermo, F.; Nardini, M.; Pastore, V.; Papi, M.; Caporossi, A.; De Spirito, M.; Minnella, A.M. Nanomechanical mapping helps explain differences in outcomes of eye microsurgery: A comparative study of macular pathologies. PLoS ONE 2019, 14, e0220571. [Google Scholar] [CrossRef]
- Di Giacinto, F.; Tartaglione, L.; Nardini, M.; Mazzini, A.; Romanò, S.; Rizzo, G.E.; Papi, M.; De Spirito, M.; Pitocco, D.; Ciasca, G. Searching for the Mechanical Fingerprint of Pre-diabetes in T1DM: A Case Report Study. Front. Bioeng. Biotechnol. 2020, 8. [Google Scholar] [CrossRef]
- Vorselen, D.; Piontek, M.C.; Roos, W.H.; Wuite, G.J.L. Mechanical Characterization of Liposomes and Extracellular Vesicles, a Protocol. Front. Mol. Biosci. 2020, 7, 1–14. [Google Scholar] [CrossRef]
- Tian, M.; Li, Y.; Liu, W.; Jin, L.; Jiang, X.; Wang, X.; Ding, Z.; Peng, Y.; Zhou, J.; Fan, J.; et al. The nanomechanical signature of liver cancer tissues and its molecular origin. Nanoscale 2015, 7, 12988–13010. [Google Scholar] [CrossRef] [PubMed]
- Moreno-Flores, S.; Benitez, R.; Vivanco, M.D.M.; Toca-Herrera, J.L. Stress relaxation and creep on living cells with the atomic force microscope: A means to calculate elastic moduli and viscosities of cell components. Nanotechnology 2010, 21, 445101. [Google Scholar] [CrossRef]
- Lekka, M.; Fornal, M.; Pyka-Fościak, G.; Lebed, K.; Wizner, B.; Grodzicki, T.; Styczeń, J. Erythrocyte stiffness probed using atomic force microscope. Biorheology 2005, 42, 307–317. [Google Scholar] [PubMed]
- Spedden, E.; Staii, C. Neuron biomechanics probed by atomic force microscopy. Int. J. Mol. Sci. 2013, 14, 16124–16140. [Google Scholar] [CrossRef]
- Cappella, B.; Dietler, G. Force-distance curves by atomic force microscopy. Surf. Sci. Rep. 1999. [Google Scholar] [CrossRef]
- Mazzini, A.; Palermo, F.; Pagliei, V.; Romanò, S.; Papi, M.; Zimatore, G.; Falsini, B.; Rizzo, S.; De Spirito, M.; Ciasca, G.; et al. A time-dependent study of nano-mechanical and ultrastructural properties of internal limiting membrane under ocriplasmin treatment. J. Mech. Behav. Biomed. Mater. 2020, 110, 103853. [Google Scholar] [CrossRef] [PubMed]
- Kulkarni, T.; Tam, A.; Mukhopadhyay, D.; Bhattacharya, S. AFM study: Cell cycle and probe geometry influences nanomechanical characterization of Panc1 cells. Biochim. Biophys. Acta-Gen. Subj. 2019. [Google Scholar] [CrossRef]
- Rianna, C.; Radmacher, M. Cell mechanics as a marker for diseases: Biomedical applications of AFM. In Proceedings of the AIP Conference Proceedings, Kedah, Malaysia, 11–13 April 2016. [Google Scholar]
- Kim, S.Y.; Khanal, D.; Kalionis, B.; Chrzanowski, W. High-fidelity probing of the structure and heterogeneity of extracellular vesicles by resonance-enhanced atomic force microscopy infrared spectroscopy. Nat. Protoc. 2019, 14, 576–593. [Google Scholar] [CrossRef]
- Minelli, E.; Ciasca, G.; Sassun, T.E.; Antonelli, M.; Palmieri, V.; Papi, M.; Maulucci, G.; Santoro, A.; Giangaspero, F.; Delfini, R.; et al. A fully-automated neural network analysis of AFM force-distance curves for cancer tissue diagnosis. Appl. Phys. Lett. 2017, 111, 143701. [Google Scholar] [CrossRef]
- Müller, P.; Abuhattum, S.; Möllmert, S.; Ulbricht, E.; Taubenberger, A.V.; Guck, J. nanite: Using machine learning to assess the quality of atomic force microscopy-enabled nano-indentation data. BMC Bioinform. 2019, 20, 1–9. [Google Scholar] [CrossRef]
- Ciasca, G.; Mazzini, A.; Sassun, T.E.; Nardini, M.; Minelli, E.; Papi, M.; Palmieri, V.; de Spirito, M. Efficient Spatial Sampling for AFM-Based Cancer Diagnostics: A Comparison between Neural Networks and Conventional Data Analysis. Condens. Matter 2019, 4, 58. [Google Scholar] [CrossRef]
- Ilieva, N.I.; Galvanetto, N.; Allegra, M.; Brucale, M.; Laio, A. Automatic classification of single-molecule force spectroscopy traces from heterogeneous samples. Bioinformatics 2020, 36, 5014–5020. [Google Scholar] [CrossRef]
- Leo, M.; Di Giacinto, F.; Nardini, M.; Mazzini, A.; Rossi, C.; Porceddu, E.; Papi, M.; Grieco, A.; de Spirito, M.; Ciasca, G. Erythrocyte viscoelastic recovery after liver transplantation in a cirrhotic patient affected by spur cell anaemia. J. Microsc. 2020. [Google Scholar] [CrossRef]
- Minelli, E.; Sassun, T.E.; Papi, M.; Palmieri, V.; Palermo, F.; Perini, G.; Antonelli, M.; Gianno, F.; Maulucci, G.; Ciasca, G.; et al. Nanoscale mechanics of brain abscess: An Atomic Force Microscopy study. Micron 2018, 113, 34–40. [Google Scholar] [CrossRef]
- Sharma, S.; Rasool, H.I.; Palanisamy, V.; Mathisen, C.; Schmidt, M.; Wong, D.T.; Gimzewski, J.K. Structural-mechanical characterization of nanoparticle exosomes in human saliva, using correlative AFM, FESEM, and force spectroscopy. ACS Nano 2010, 4, 1921–1926. [Google Scholar] [CrossRef]
- LeClaire, M.; Gimzewski, J.; Sharma, S. A review of the biomechanical properties of single extracellular vesicles. Nano Sel. 2021, 2, 1–15. [Google Scholar] [CrossRef]
- Vorselen, D.; van Dommelen, S.M.; Sorkin, R.; Piontek, M.C.; Schiller, J.; Döpp, S.T.; Kooijmans, S.A.A.; van Oirschot, B.A.; Versluijs, B.A.; Bierings, M.B. The fluid membrane determines mechanics of erythrocyte extracellular vesicles and is softened in hereditary spherocytosis. Nat. Commun. 2018, 9, 1–9. [Google Scholar] [CrossRef] [PubMed]
- Ridolfi, A.; Brucale, M.; Montis, C.; Caselli, L.; Paolini, L.; Borup, A.; Boysen, A.T.; Loria, F.; van Herwijnen, M.J.C.; Kleinjan, M.; et al. AFM-based High-Throughput Nanomechanical Screening of Single Extracellular Vesicles. Anal. Chem. 2020, 92, 10274–10282. [Google Scholar] [CrossRef] [PubMed]
- Li, M.; Xu, X.; Xi, N.; Wang, W.; Xing, X.; Liu, L. Multiparametric atomic force microscopy imaging of single native exosomes. Acta Biochim. Biophys. Sin. (Shanghai) 2021, 53, 385–388. [Google Scholar] [CrossRef] [PubMed]
- Parisse, P.; Rago, I.; Severino, L.U.; Perissinotto, F.; Ambrosetti, E.; Paoletti, P.; Ricci, M.; Beltrami, A.P.; Cesselli, D.; Casalis, L. Atomic force microscopy analysis of extracellular vesicles. Eur. Biophys. J. 2017, 46, 813–820. [Google Scholar] [CrossRef] [PubMed]
- Dokukin, M.E.; Guz, N.V.; Sokolov, I. Quantitative study of the elastic modulus of loosely attached cells in AFM indentation experiments. Biophys. J. 2013, 104, 2123–2131. [Google Scholar] [CrossRef] [PubMed]
- Vorselen, D.; Marchetti, M.; López-Iglesias, C.; Peters, P.J.; Roos, W.H.; Wuite, G.J.L. Multilamellar nanovesicles show distinct mechanical properties depending on their degree of lamellarity. Nanoscale 2018, 10, 5318–5324. [Google Scholar] [CrossRef]
- Guedes, A.F.; Carvalho, F.A.; Malho, I.; Lousada, N.; Sargento, L.; Santos, N.C. Atomic force microscopy as a tool to evaluate the risk of cardiovascular diseases in patients. Nat. Nanotechnol. 2016. [Google Scholar] [CrossRef] [PubMed]
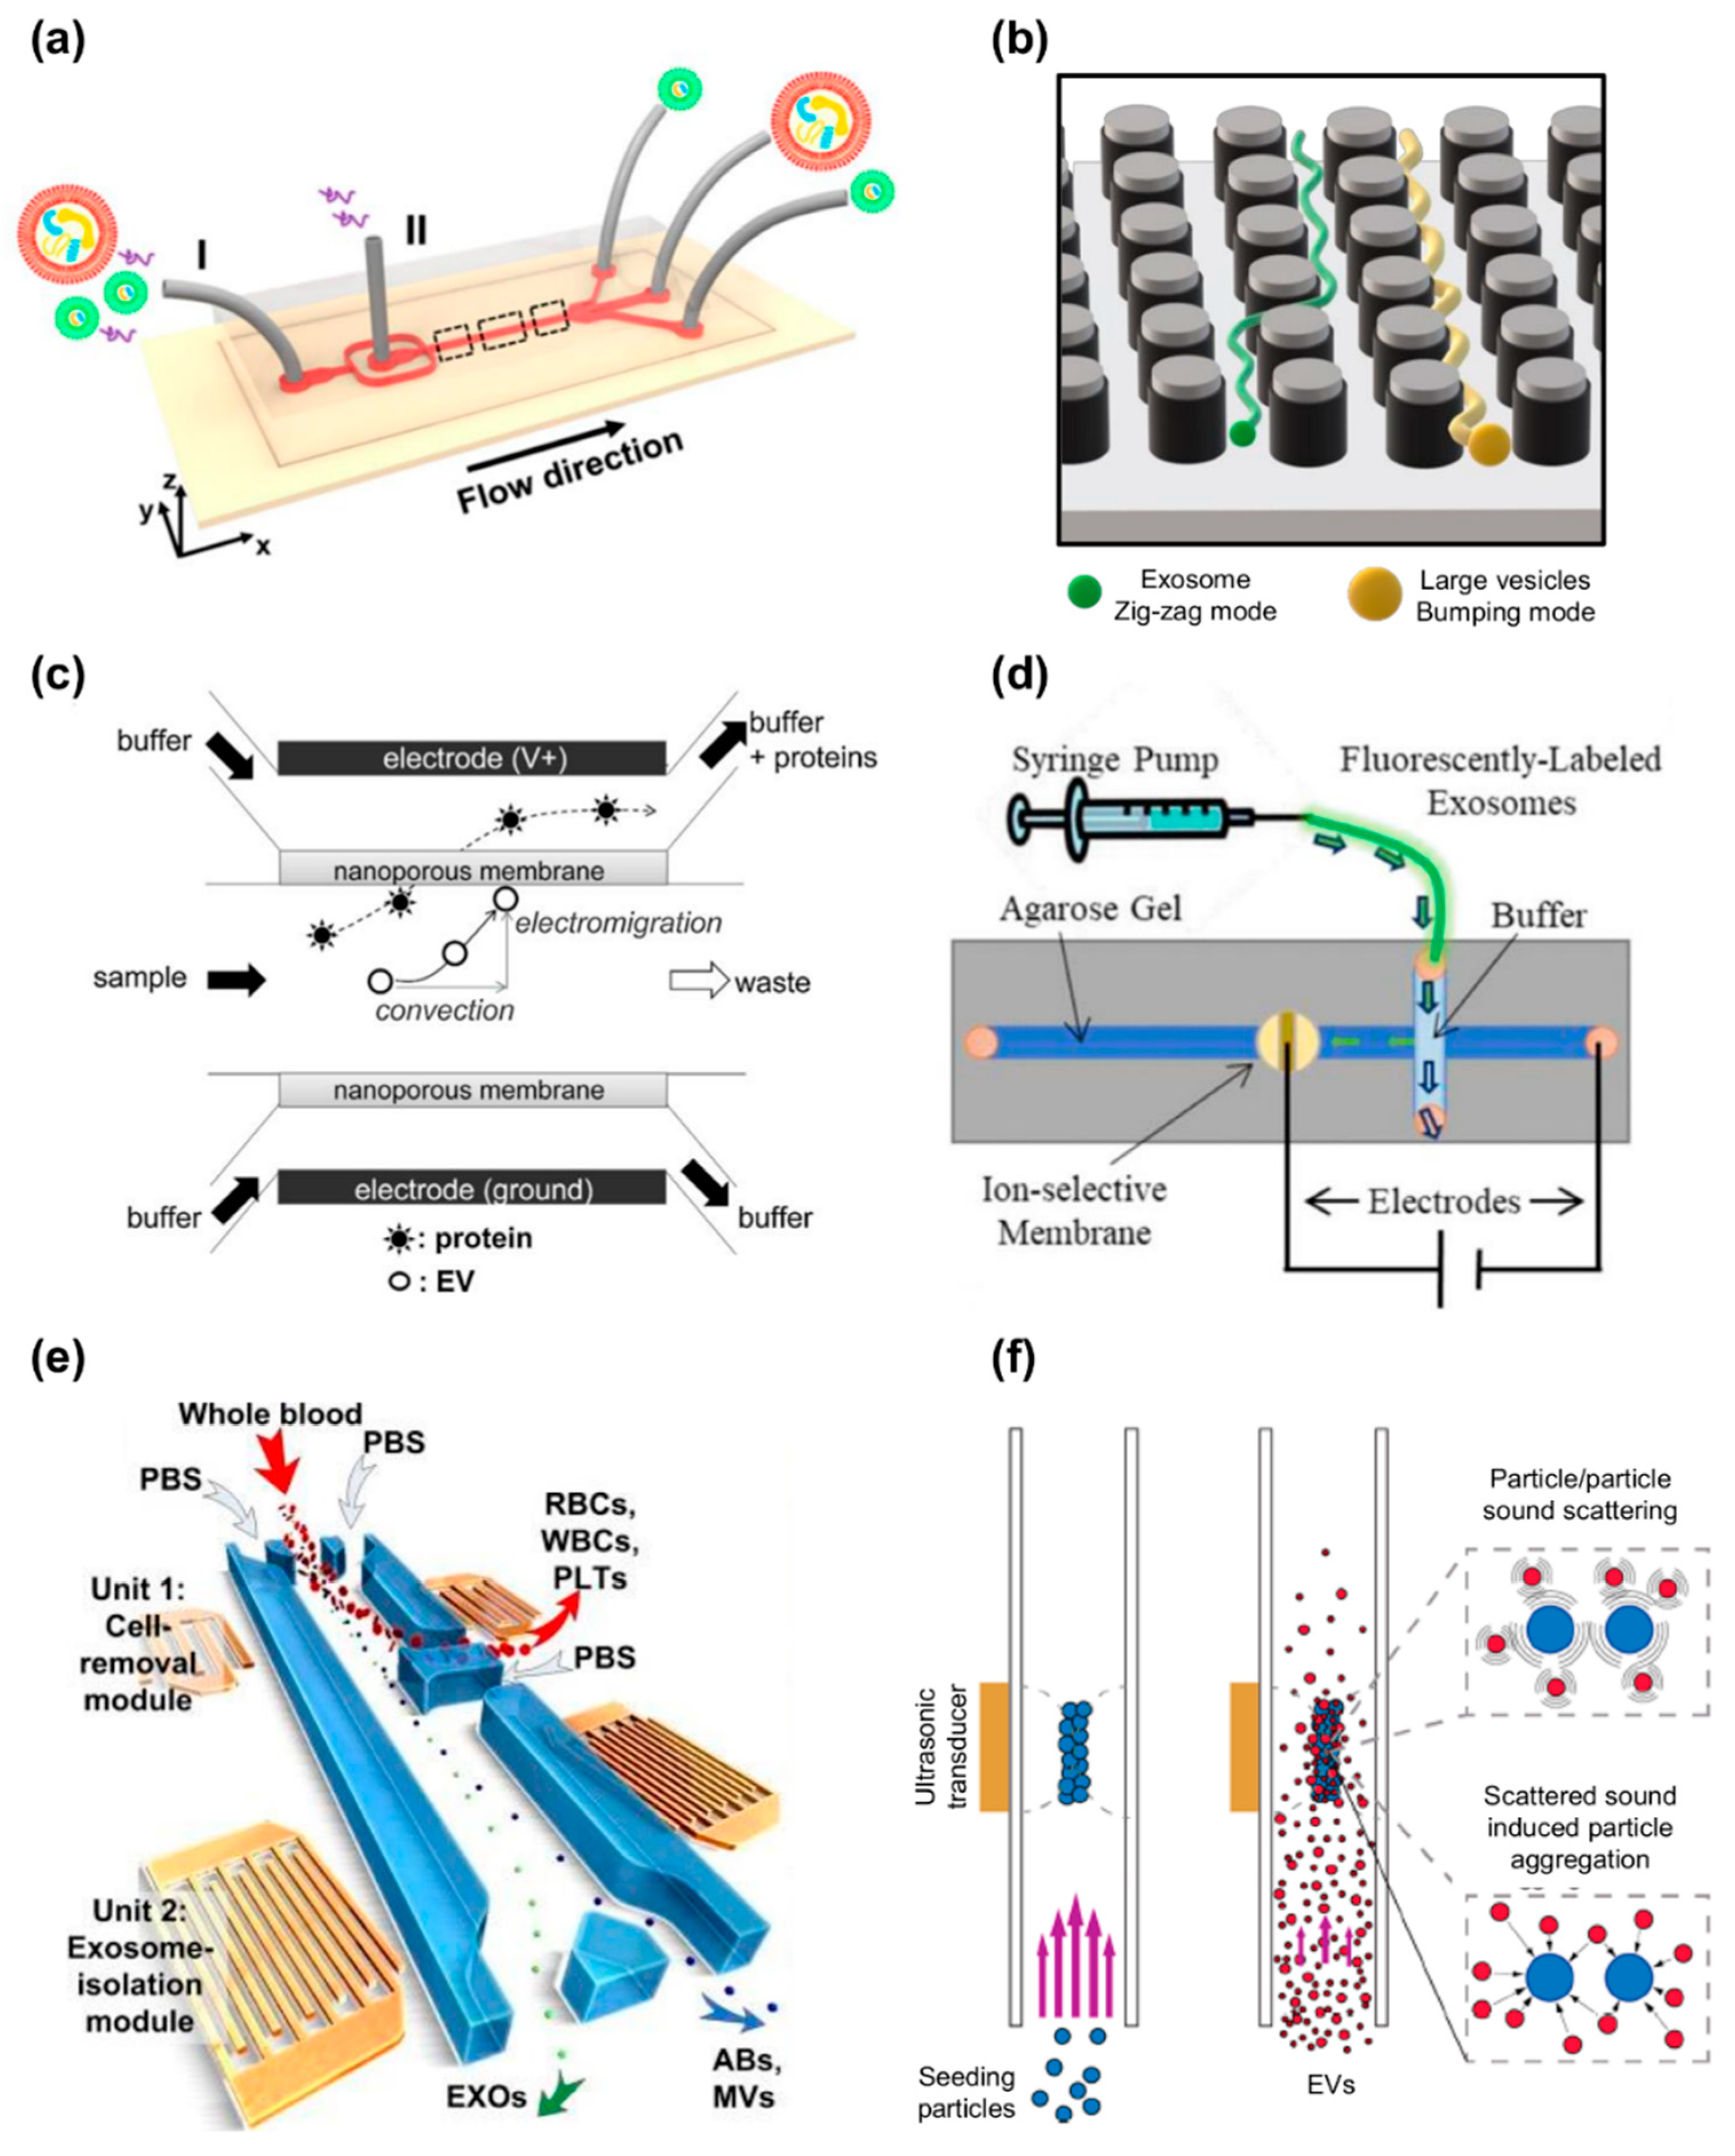
- Liu, C.; Guo, J.; Tian, F.; Yang, N.; Yan, F.; Ding, Y.; Wei, J.; Hu, G.; Nie, G.; Sun, J. Field-Free Isolation of Exosomes from Extracellular Vesicles by Microfluidic Viscoelastic Flows. ACS Nano 2017, 11, 6968–6976. [Google Scholar] [CrossRef]
- Wunsch, B.H.; Smith, J.T.; Gifford, S.M.; Wang, C.; Brink, M.; Bruce, R.L.; Austin, R.H.; Stolovitzky, G.; Astier, Y. Nanoscale lateral displacement arrays for the separation of exosomes and colloids down to 20 nm. Nat. Nanotechnol. 2016, 11, 936–940. [Google Scholar] [CrossRef]
- Liu, F.; Vermesh, O.; Mani, V.; Ge, T.J.; Madsen, S.J.; Sabour, A.; Hsu, E.-C.; Gowrishankar, G.; Kanada, M.; Jokerst, J.V. The exosome total isolation chip. ACS Nano 2017, 11, 10712–10723. [Google Scholar] [CrossRef] [PubMed]
- Cho, S.; Jo, W.; Heo, Y.; Kang, J.Y.; Kwak, R.; Park, J. Isolation of extracellular vesicle from blood plasma using electrophoretic migration through porous membrane. Sens. Actuators B Chem. 2016, 233, 289–297. [Google Scholar] [CrossRef]
- Marczak, S.; Richards, K.; Ramshani, Z.; Smith, E.; Senapati, S.; Hill, R.; Go, D.B.; Chang, H.-C. Simultaneous isolation and preconcentration of exosomes by ion concentration polarization. Electrophoresis 2018, 39, 2029–2038. [Google Scholar] [CrossRef] [PubMed]
- Shi, L.; Kuhnell, D.; Borra, V.J.; Langevin, S.M.; Nakamura, T.; Esfandiari, L. Rapid and label-free isolation of small extracellular vesicles from biofluids utilizing a novel insulator based dielectrophoretic device. Lab Chip 2019, 19, 3726–3734. [Google Scholar] [CrossRef] [PubMed]
- Wu, M.; Ouyang, Y.; Wang, Z.; Zhang, R.; Huang, P.H.; Chen, C.; Li, H.; Li, P.; Quinn, D.; Dao, M.; et al. Isolation of exosomes from whole blood by integrating acoustics and microfluidics. Proc. Natl. Acad. Sci. USA 2017, 114, 10584–10589. [Google Scholar] [CrossRef] [PubMed]
- Lee, K.; Shao, H.; Weissleder, R.; Lee, H. Acoustic purification of extracellular microvesicles. ACS Nano 2015, 9, 2321–2327. [Google Scholar] [CrossRef] [PubMed]
- Ku, A.; Lim, H.C.; Evander, M.; Lilja, H.; Laurell, T.; Scheding, S.; Ceder, Y. Acoustic Enrichment of Extracellular Vesicles from Biological Fluids. Anal. Chem. 2018, 90, 8011–8019. [Google Scholar] [CrossRef]
- Di Santo, R.; Quagliarini, E.; Palchetti, S.; Pozzi, D.; Palmieri, V.; Perini, G.; Papi, M.; Capriotti, A.L.; Laganà, A.; Caracciolo, G. Microfluidic-generated lipid-graphene oxide nanoparticles for gene delivery. Appl. Phys. Lett. 2019, 114. [Google Scholar] [CrossRef]
- Di Santo, R.; Digiacomo, L.; Palchetti, S.; Palmieri, V.; Perini, G.; Pozzi, D.; Papi, M.; Caracciolo, G. Microfluidic manufacturing of surface-functionalized graphene oxide nanoflakes for gene delivery. Nanoscale 2019, 11, 2733–2741. [Google Scholar] [CrossRef] [PubMed]
- Businaro, L.; De Ninno, A.; Schiavoni, G.; Lucarini, V.; Ciasca, G.; Gerardino, A.; Belardelli, F.; Gabriele, L.; Mattei, F. Cross talk between cancer and immune cells: Exploring complex dynamics in a microfluidic environment. Lab Chip 2013, 13. [Google Scholar] [CrossRef]
- Quagliarini, E.; Di Santo, R.; Palchetti, S.; Ferri, G.; Cardarelli, F.; Pozzi, D.; Caracciolo, G. Effect of protein corona on the transfection efficiency of lipid-coated graphene oxide-based cell transfection reagents. Pharmaceutics 2020, 12, 113. [Google Scholar] [CrossRef]
- Wang, J.-C.; Bégin, L.R.; Bérubé, N.G.; Chevalier, S.; Aprikian, A.G.; Gourdeau, H.; Chevrette, M. Down-regulation of CD9 expression during prostate carcinoma progression is associated with CD9 mRNA modifications. Clin. Cancer Res. 2007, 13, 2354–2361. [Google Scholar] [CrossRef] [PubMed][Green Version]
- Peinado, H.; Alečković, M.; Lavotshkin, S.; Matei, I.; Costa-Silva, B.; Moreno-Bueno, G.; Hergueta-Redondo, M.; Williams, C.; García-Santos, G.; Ghajar, C.M. Melanoma exosomes educate bone marrow progenitor cells toward a pro-metastatic phenotype through MET. Nat. Med. 2012, 18, 883–891. [Google Scholar] [CrossRef] [PubMed]
- Jin, H.; Liu, P.; Wu, Y.; Meng, X.; Wu, M.; Han, J.; Tan, X. Exosomal zinc transporter ZIP4 promotes cancer growth and is a novel diagnostic biomarker for pancreatic cancer. Cancer Sci. 2018, 109, 2946–2956. [Google Scholar] [CrossRef] [PubMed]
- Sandfeld-Paulsen, B.; Jakobsen, K.R.; Bæk, R.; Folkersen, B.H.; Rasmussen, T.R.; Meldgaard, P.; Varming, K.; Jørgensen, M.M.; Sorensen, B.S. Exosomal proteins as diagnostic biomarkers in lung cancer. J. Thorac. Oncol. 2016, 11, 1701–1710. [Google Scholar] [CrossRef]
- Kimura, H.; Yamamoto, H.; Harada, T.; Fumoto, K.; Osugi, Y.; Sada, R.; Maehara, N.; Hikita, H.; Mori, S.; Eguchi, H. CKAP4, a DKK1 receptor, is a biomarker in exosomes derived from pancreatic cancer and a molecular target for therapy. Clin. Cancer Res. 2019, 25, 1936–1947. [Google Scholar] [CrossRef]
- Jafari, A.; Babajani, A.; Abdollahpour-Alitappeh, M.; Ahmadi, N.; Rezaei-Tavirani, M. Exosomes and cancer: From molecular mechanisms to clinical applications. Med. Oncol. 2021, 38, 1–17. [Google Scholar] [CrossRef]
- Roy, S.; Hochberg, F.H.; Jones, P.S. Extracellular vesicles: The growth as diagnostics and therapeutics; a survey. J. Extracell. Vesicles 2018, 7, 1438720. [Google Scholar] [CrossRef]
- Fuhrmann, G.; Herrmann, I.K.; Stevens, M.M. Cell-derived vesicles for drug therapy and diagnostics: Opportunities and challenges. Nano Today 2015, 10, 397–409. [Google Scholar] [CrossRef]
- Liga, A.; Vliegenthart, A.D.B.; Oosthuyzen, W.; Dear, J.W.; Kersaudy-Kerhoas, M. Exosome isolation: A microfluidic road-map. Lab Chip 2015, 15, 2388–2394. [Google Scholar] [CrossRef] [PubMed]
- Zhou, B.; Xu, K.; Zheng, X.; Chen, T.; Wang, J.; Song, Y.; Shao, Y.; Zheng, S. Application of exosomes as liquid biopsy in clinical diagnosis. Signal Transduct. Target. Ther. 2020, 5, 1–14. [Google Scholar] [CrossRef] [PubMed]
- Sahoo, S.; Adamiak, M.; Mathiyalagan, P.; Kenneweg, F.; Kafert-Kasting, S.; Thum, T. Therapeutic and diagnostic translation of extracellular vesicles in cardiovascular diseases: Roadmap to the clinic. Circulation 2021, 143, 1426–1449. [Google Scholar] [CrossRef] [PubMed]
- Théry, C.; Witwer, K.W.; Aikawa, E.; Alcaraz, M.J.; Anderson, J.D.; Andriantsitohaina, R.; Antoniou, A.; Arab, T.; Archer, F.; Atkin-Smith, G.K.; et al. Minimal information for studies of extracellular vesicles 2018 (MISEV2018): A position statement of the International Society for Extracellular Vesicles and update of the MISEV2014 guidelines. J. Extracell. Vesicles 2018, 7. [Google Scholar] [CrossRef]
- Witwer, K.W.; Buzás, E.I.; Bemis, L.T.; Bora, A.; Lässer, C.; Lötvall, J.; Nolte-’t Hoen, E.N.; Piper, M.G.; Sivaraman, S.; Skog, J.; et al. Standardization of sample collection, isolation and analysis methods in extracellular vesicle research. J. Extracell. Vesicles 2013, 2. [Google Scholar] [CrossRef] [PubMed]
- Ayers, L.; Pink, R.; Carter, D.R.F.; Nieuwland, R. Clinical requirements for extracellular vesicle assays. J. Extracell. Vesicles 2019, 8, 1593755. [Google Scholar] [CrossRef]
- Reiner, A.T.; Witwer, K.W.; Van Balkom, B.W.M.; De Beer, J.; Brodie, C.; Corteling, R.L.; Gabrielsson, S.; Gimona, M.; Ibrahim, A.G.; De Kleijn, D. Concise review: Developing best-practice models for the therapeutic use of extracellular vesicles. Stem Cells Transl. Med. 2017, 6, 1730–1739. [Google Scholar] [CrossRef] [PubMed]
- Lee, M.; Ban, J.-J.; Im, W.; Kim, M. Influence of storage condition on exosome recovery. Biotechnol. Bioprocess Eng. 2016, 21, 299–304. [Google Scholar] [CrossRef]
- Businaro, L.; Limaj, O.; Giliberti, V.; Ortolani, M.; Di Gaspare, A.; Grenci, G.; Ciasca, G.; Gerardino, A.; De Ninno, A.; Lupi, S. Mid-infrared nanoantenna arrays on silicon and CaF 2 substrates for sensing applications. Microelectron. Eng. 2012, 97. [Google Scholar] [CrossRef]
- De Ninno, A.; Ciasca, G.; Gerardino, A.; Calandrini, E.; Papi, M.; De Spirito, M.; Nucara, A.; Ortolani, M.; Businaro, L.; Baldassarre, L. An integrated superhydrophobic-plasmonic biosensor for mid-infrared protein detection at the femtomole level. Phys. Chem. Chem. Phys. 2015, 17. [Google Scholar] [CrossRef] [PubMed]
- Plodinec, M.; Loparic, M.; Monnier, C.A.; Obermann, E.C.; Zanetti-Dallenbach, R.; Oertle, P.; Hyotyla, J.T.; Aebi, U.; Bentires-Alj, M.; Lim, R.Y.H.; et al. The nanomechanical signature of breast cancer. Nat. Nanotechnol. 2012, 7, 757. [Google Scholar] [CrossRef]
- Suresh, S. Biomechanics and biophysics of cancer cells. Acta Mater. 2007, 55, 3989–4014. [Google Scholar] [CrossRef]
- Napodano, C.; Callà, C.; Fiorita, A.; Marino, M.; Taddei, E.; Di Cesare, T.; Passali, G.C.; Di Santo, R.; Stefanile, A.; Fantoni, M. Salivary Biomarkers in COVID-19 Patients: Towards a Wide-Scale Test for Monitoring Disease Activity. J. Pers. Med. 2021, 11, 385. [Google Scholar] [CrossRef]


| Exosomes (EXOs) | Microvesicles (MVs) | Apoptotic Bodies (ABs) | |
|---|---|---|---|
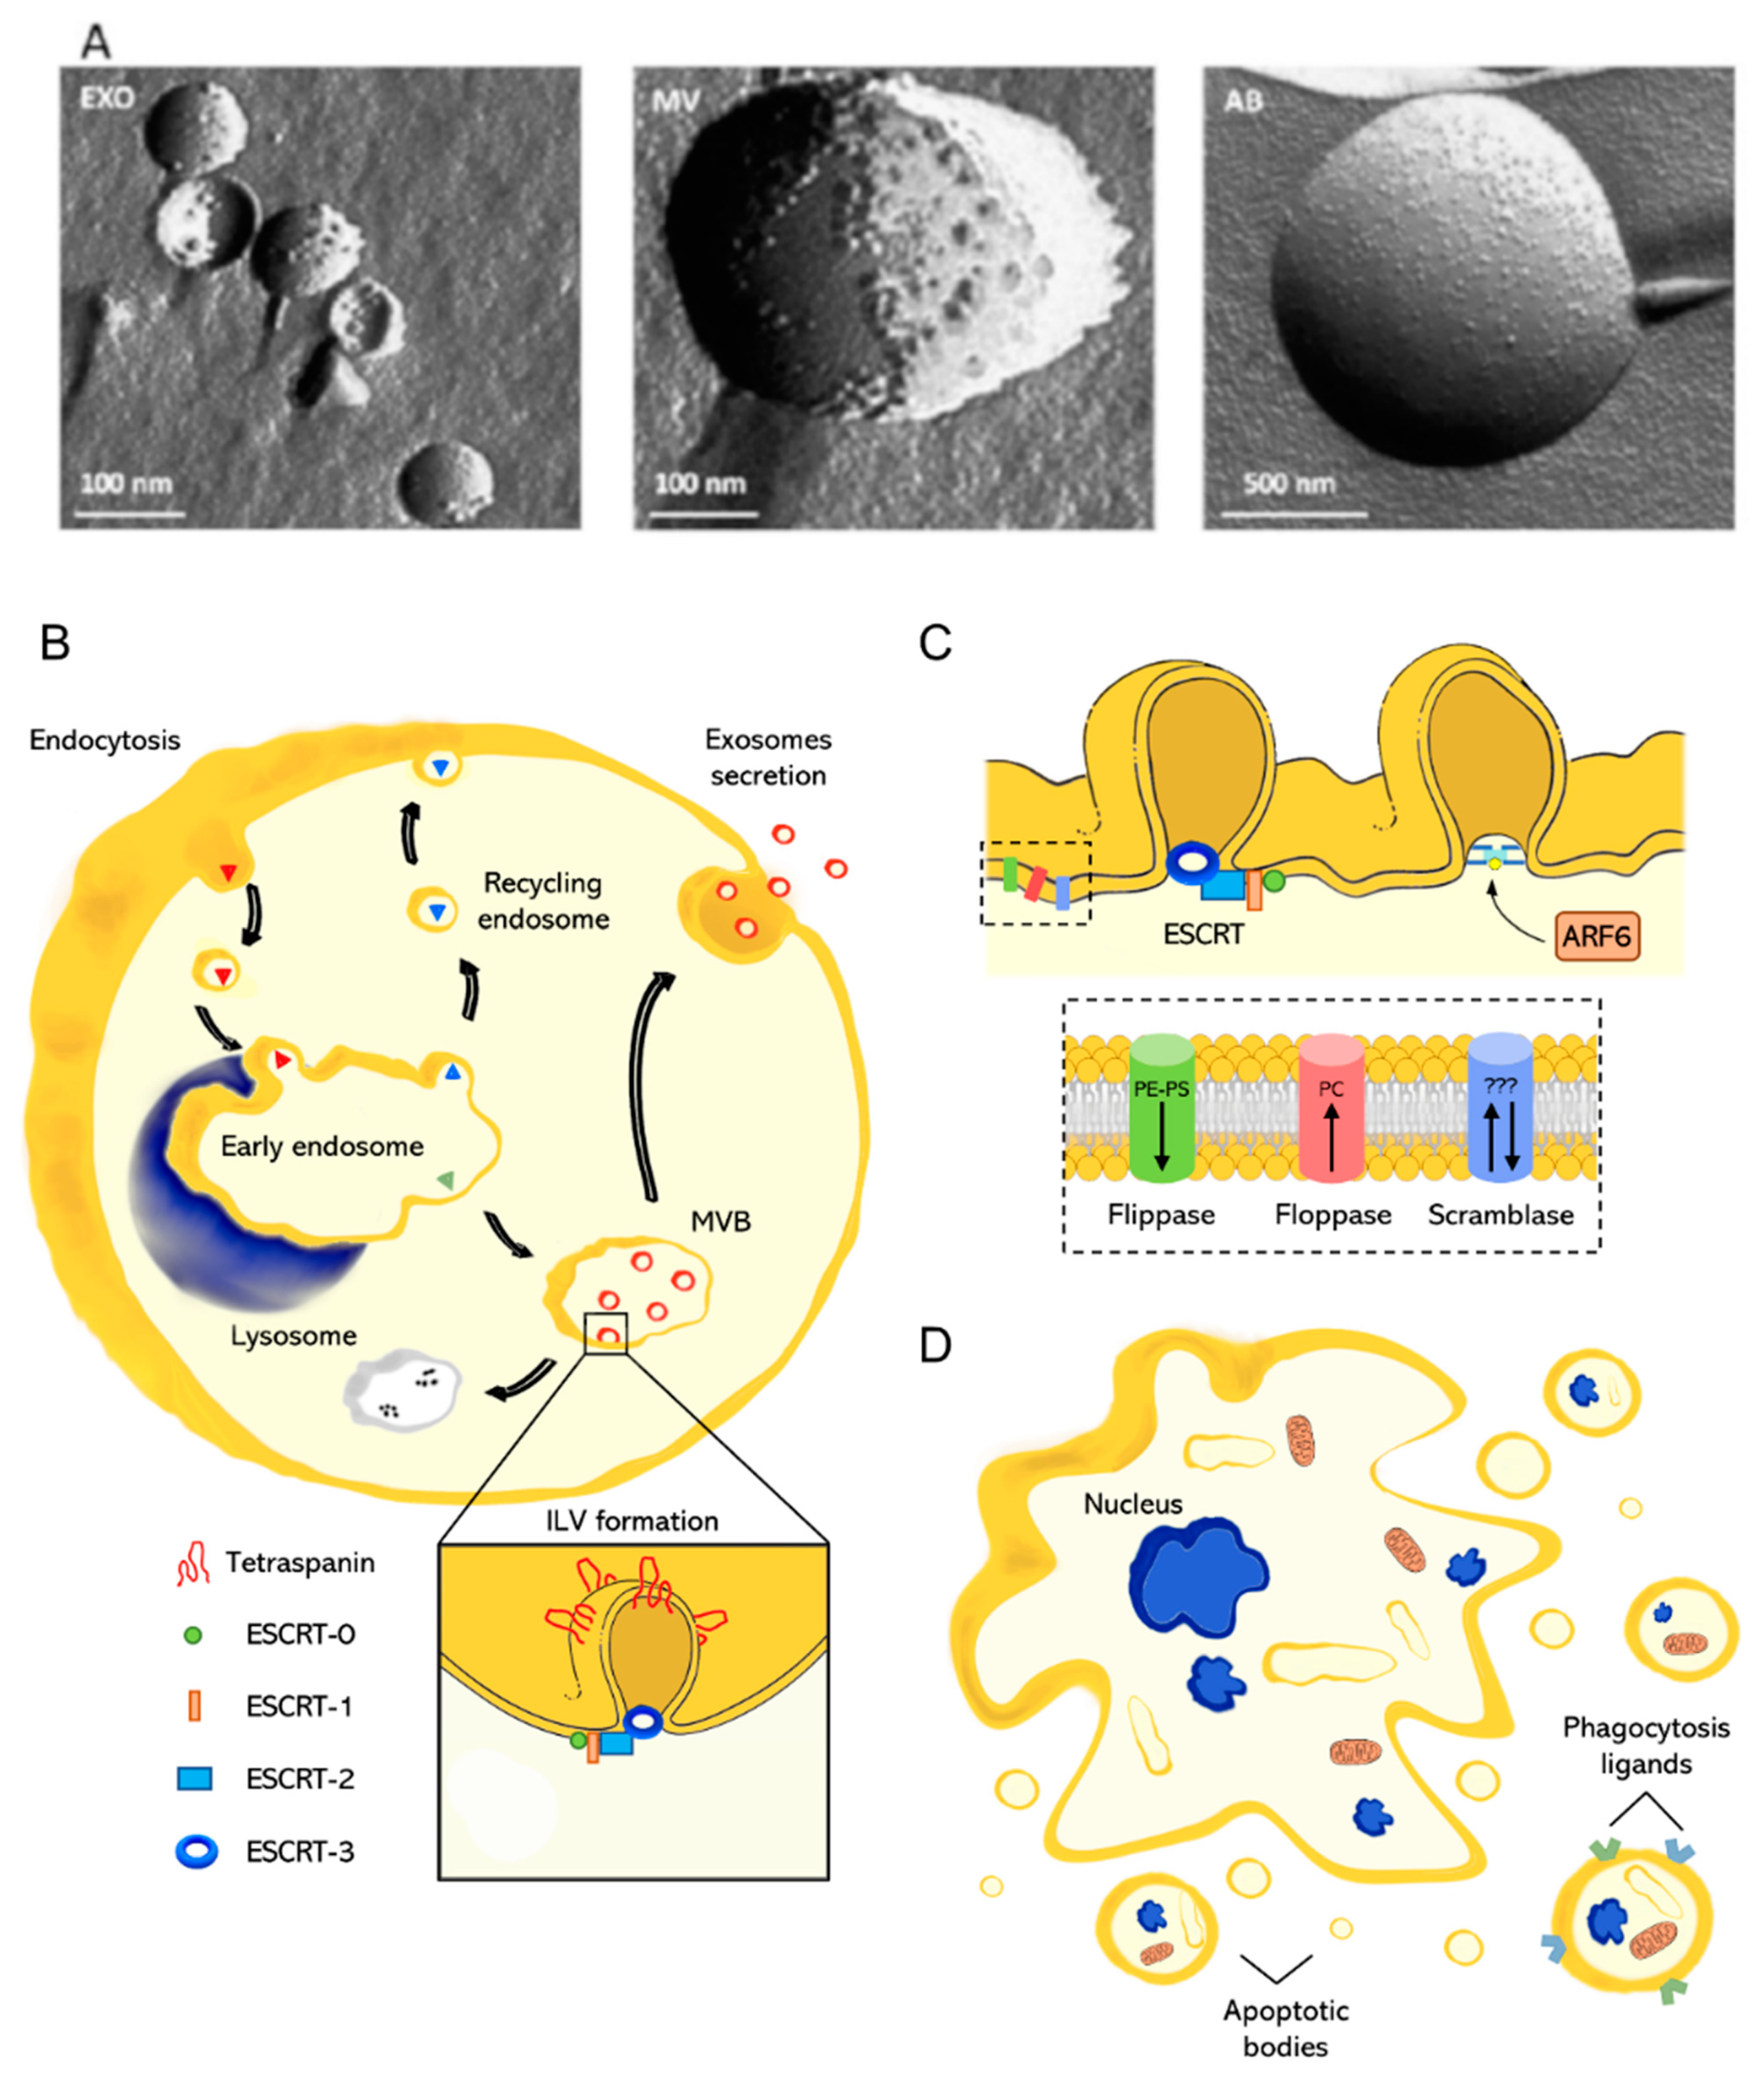
| Diameter (nm) | 30–150 | 100–1000 | 100–5000 |
| Biogenesis | Budding from endosome lumen (Figure 2B) | Budding from the plasma membrane (Figure 2C) | Released during apoptosis (Figure 2D) |
| Biogenesis Steps |
|
|
|
| Paper | Aim | Sample/Extraction | Technique (Q-Range nm−1) | Model | Main Findings |
|---|---|---|---|---|---|
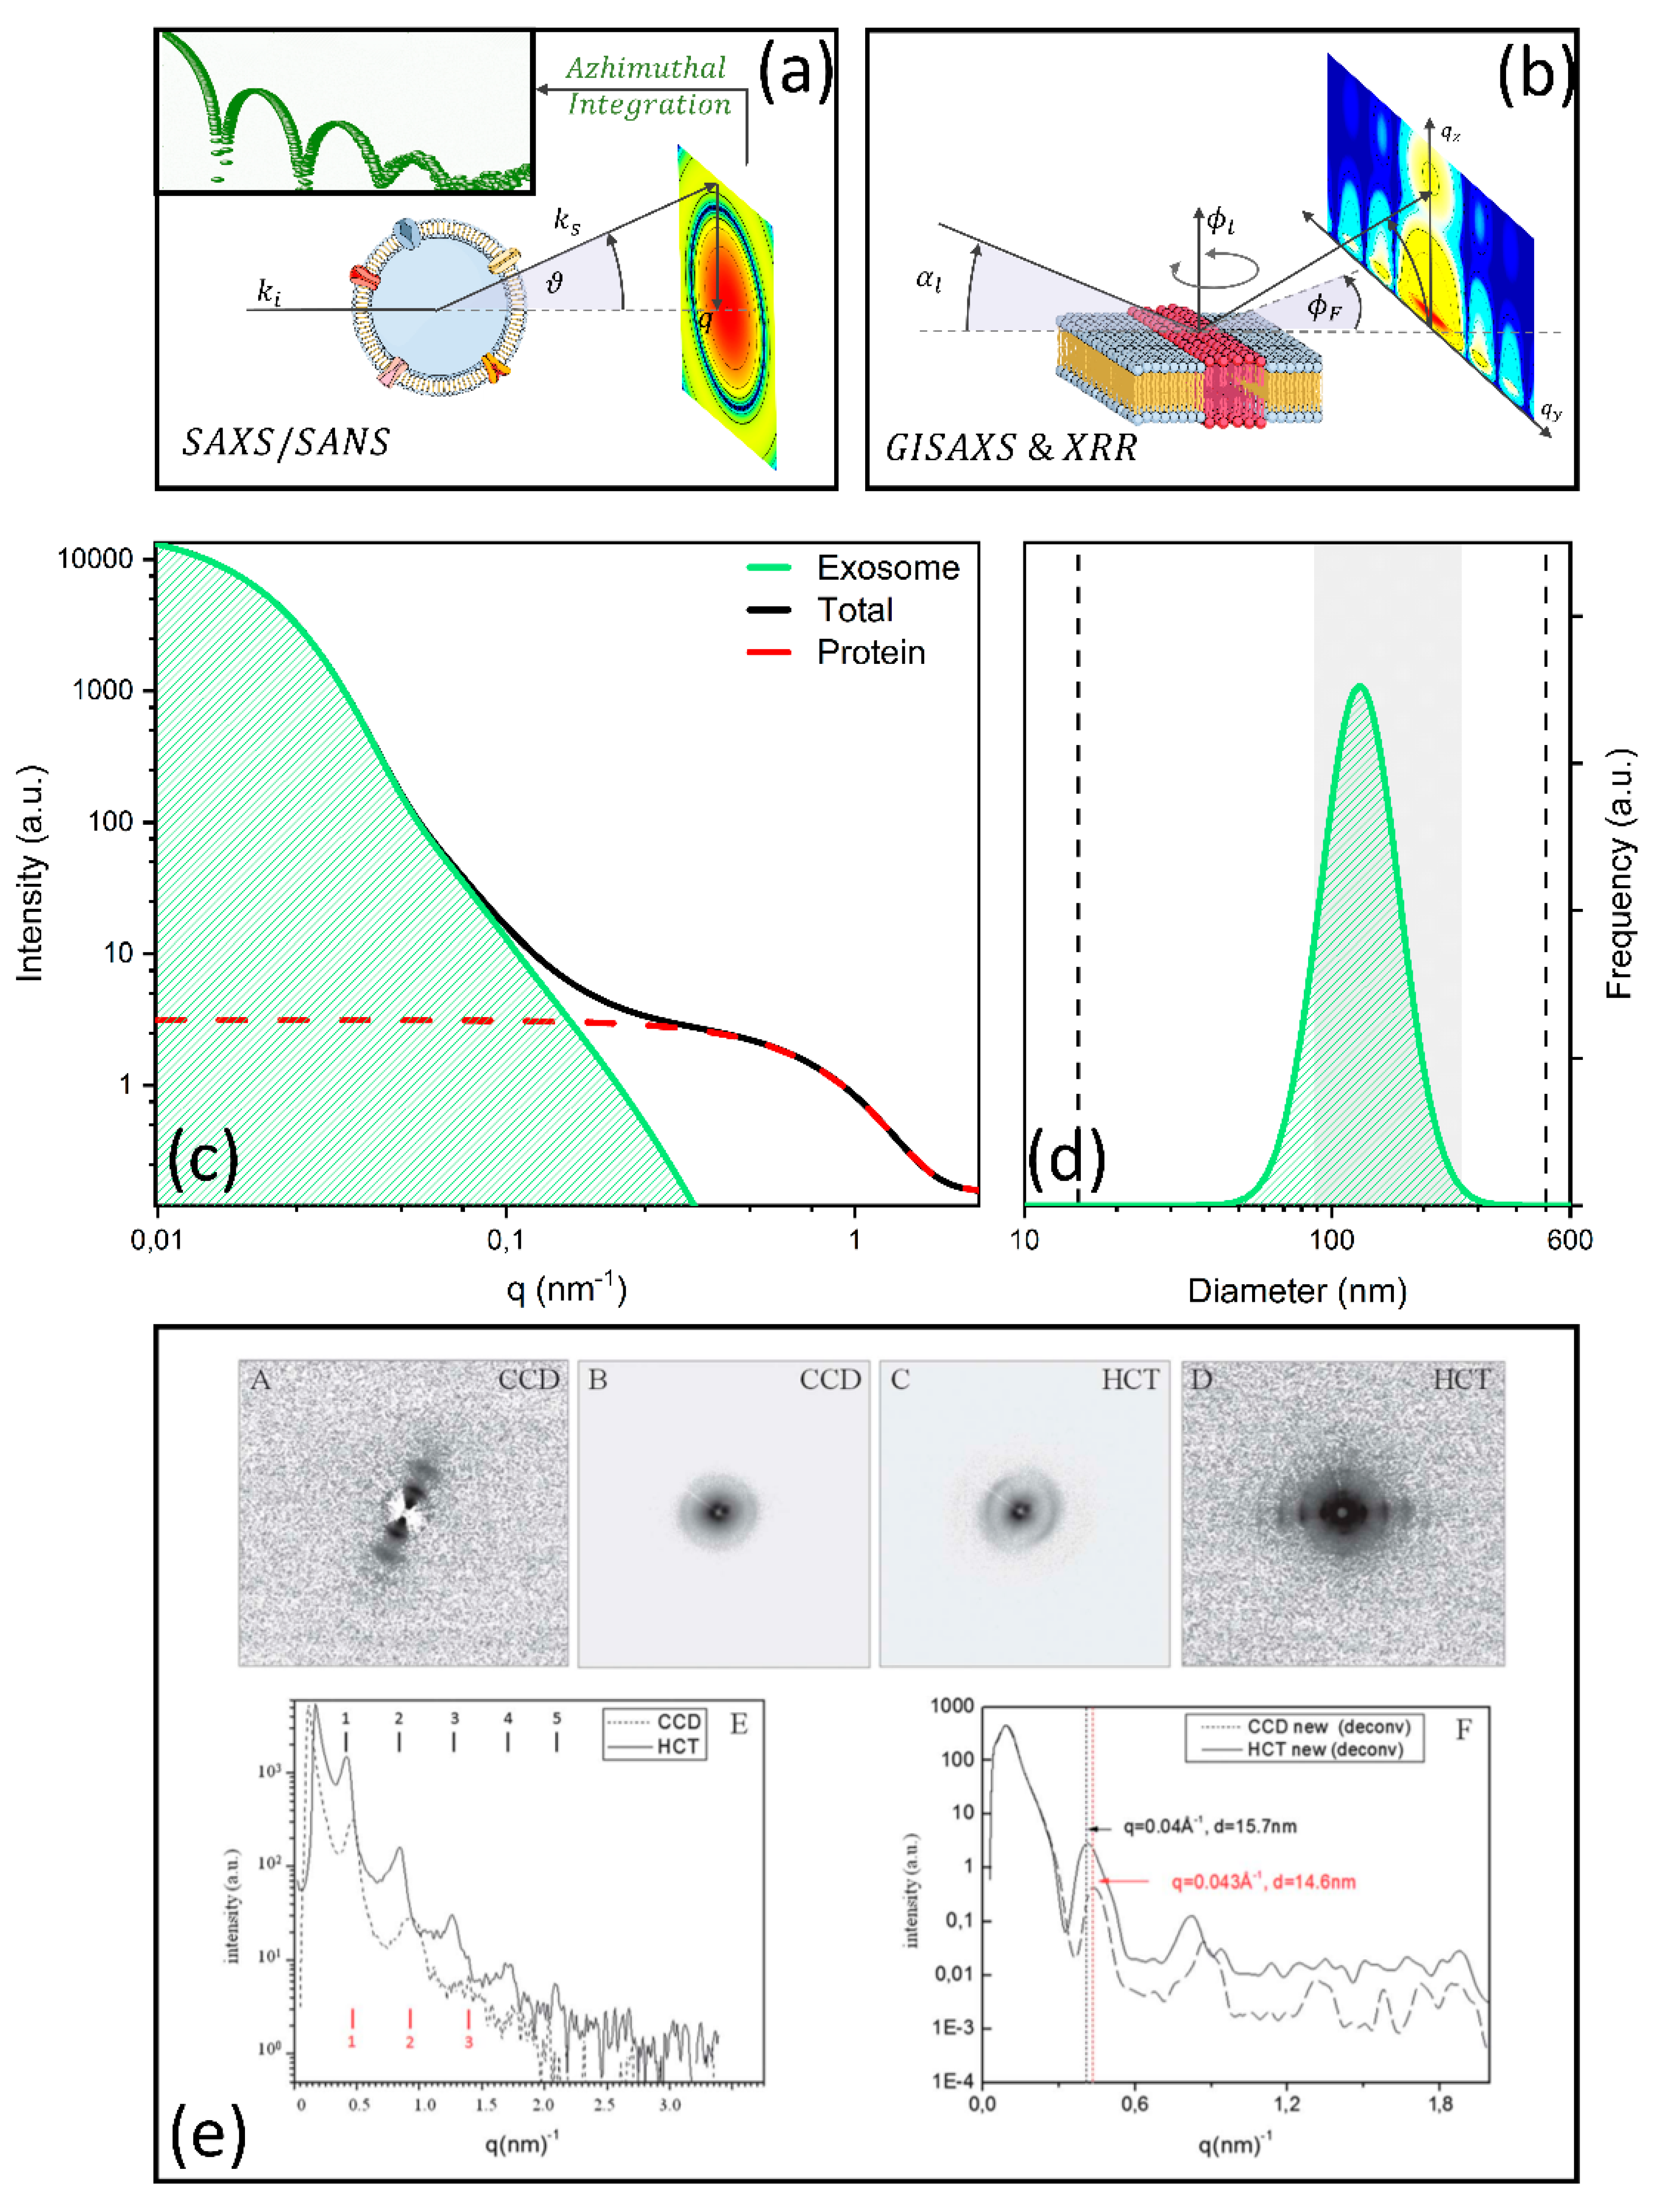
| Varga et al., 2014 [121] | Investigating biophysical properties, i.e., shape and size distribution, of EVs isolated from erythrocytes. | Erythrocyte-derived EVs/RBCs were removed by 2 centrifugation steps at 1550× g, t = 20 min and 20 °C. Next, the supernatant was centrifuged (18,890× g, 30 min) to concentrate EVs | SAXS (0.015–2.5) | Scattering intensity comprises three contributions:
| Proper modelling of the scattering curve enabled obtaining the size distribution of EVs and discerning EV scattering from contaminants (which can co-precipitate during the purification process). |
| Romancino et al., 2018 [123] | Exploring the structural arrangement of the lipid bilayer of EV membranes with altered S-palmitoylation state. | EVs secreted by skeletal muscle cells (C2C12 myotubes) at the 3rd day of differentiation (untreated and treated to inhibit S-palmitoylation)/ Ultracentrifugation at 118,000× g for 70 min | SAXS (0.03–6.0) SANS (0.05–4.0) | Model-free analysis of SAXS and SANS profiles with neutron contrast variation. Analysis of a hump in the SAXS/SANS scattering profile centered at approximately q = 1.2 nm−1, which provide structural information on the bilayer organization (2π/q = 5.2 nm) | SAXS and SANS with neutron contrast variation enables detecting subtle changes in the lipid membrane arrangement in terms of phospholipid head groups and hydrophilic tails associated with the S-palmitoylation state. |
| Montis et al., 2020 [124] | Studying the interaction between EV-derived supported lipid bilayers (EVSLBs) and gold-coated superparamagnetic iron oxide nanoparticles (SPIONs). Results were compared with artificial SLBs. | EVs secreted by murine prostatic tumor cells (TRAMP-C2 cell line)/ Ultracentrifugation at 100,000× g for 240 min | XRR (0.15–0.25) GISAXS (0.15–0.25) |
| As measured with GISAXS, SPIONs are simply absorbed on both SLB surfaces, without membrane/nanoparticle reorganization and thus, without altering membrane biomechanics. A higher absorption is observed on the EVSLBs compared to POCP-SLB, as a consequence of its higher roughness associated with the protein content of exosomes, as measured with XRR. |
| Accardo et al., 2013 [122] | Classifying exosomes obtained from healthy and cancer cells and concentrated on superhydrophobic patterned surfaces. | Exosomes extracted from two different CCD841-CoN (healthy epithelial colon) cell line and HCT116 (colorectal cancer) cell lines/ ExoQuick Precipitation Solution | WAXS (0.0–3.0) SAXS (0.0–1.8) | Model-free analysis of micro-WAXS/SAXS lamellar peaks in the 3.5 nm−1 q range. Micro SAXS patterns measured with benchtop instruments were deionized with a restoration algorithm. | Micro-SAXS/WAXS measurements highlighted differences in the exosome macroaggregates morphology (i.e., number of orders, periodicity, and peak broadening). The authors hypothesized this was due to a more regular organization of exosomes derived from cancer cells than those one extracted from healthy cells, which could be useful to distinguish exosomes with different origins, also for diagnostic purposes. |
| Paper | Sample/Purification | Methodological Consideration | Main IR Findings | Impact and Application |
|---|---|---|---|---|
| Baddela 2015 [132] | Buffalo’s Milk/ Exoquick | Samples were collected from 3 healthy buffaloes. Band assignment was carried out after averaging 3 spectra. | IR spectra display peculiar absorption bands reflecting exosome composition: (i) 1300–1700 cm−1 (amide I–III) and 2700–3500 cm−1 (CH stretching) for protein and lipids; and (ii) 900–1200 cm−1 for nucleic acids and carbohydrates. | The combined use of IR and miRNA profiles allows for the characterization of bioactive compounds in milk. |
| Mihály J. 2016 [25] | Jurkat T cells/ Centrifugation | Four replicas of the experiment were carried out. The protein–lipid ratio (P/L) was computed as the ratio between the intensity of the amide I–II (1750–1500 cm−1) and the CH stretching (3040–2700 cm−1). ANOVA was used to compare different EV types | Spectra of EVs and parental cells were compared. ABs’ spectra resemble those of parental cells. The following difference among the diverse EV types were observed in the range 1800–1350 cm−1: (i) a shift in the amide I peaks; and (ii) a change in the relative weight of the amide I and II peaks (Figure 5a). The following P/L ratio was measured (Figure 5a): 0.79 ± 0.05 for EXOs; 0.60 ± 0.04 for MVs and 1.20 ± 0.12 for Abs (P < 0.0001) | FTIR provides an effective tool for the classification of different EV types. Classification is based on the shape of amide I–II bands and the P/L ratio. These results impact EV sample control, a key issue in exosome science. |
| Lee 2017 [137] | THP-1 cells/ Centrifugation | Three replicates of the experiment were carried out. Comparison among spectra was performed considering the 2nd derivative. PCA loadings were computed to highlight significant spectral changes. | Monocyte activation upon lipopolysaccharide stimulation (LPS) can be inferred from the analysis of released MVs. An increase in the integrated areas of the lipid ester, α-helical protein, and uracil bands upon LPS is observed. Similar spectral changes were detected on monocytes, as confirmed with PCA and PCA loadings. | Spectra of MVs provide biochemical insights into the LPS-induced monocyte model of sepsis. Moreover, IR analysis of MVs is an effective tool to monitor cellular phenotypes. |
| Pereira al. 2018 [138] | CFPAC-1 Cell line and SR4987 | Six subjects were recruited for the study, and bone marrow mesenchymal stromal cells were isolated. Spectra were analyzed using the first and second derivatives, and PCA. | The authors studied the influence of culture and time conditioning on exosomes released from human BM-MSCs. Cells were cultured in different media (DMEM and XenoFree). PCA, 1st, and 2nd derivatives showed that IR signatures are more affected by culture conditions than donor or conditioning days. | This paper highlights the role of the different culture conditions in EXO research, showing that great attention has to be paid to this aspect to assure experimental reproducibility. |
| Romanò 2020 [139] | HT29 cells/ Exoquick | Ten replicates of the experiments were carried out. PCA–LDA was used to classify exosomes. PCA loadings were employed to highlight the most relevant spectral changes. Sensitivity, specificity, accuracy, and recall were estimated | The authors studied the biochemical changes in EXOs obtained from HT29 cancer cells under different culture conditions (well-fed and starved cells). Differences in the spectral shape of the amide I–II bands can be used to classify exosomes extracted from the two groups using PCA–LDA. Classification has very high accuracy, precision, and recall, especially in the amide I and II regions. | FTIR combined with PCA–LDA allows for the automated classification of EXOs derived from cells cultured under different conditions. Most importantly, FTIR spectroscopy on exosomes provides information on the cellular state. |
| Pascucci 2014 [134] | CFPAC-1/ Centrifugation | Model-free band assignment (see Figure 5d). | The authors applied FTIR to characterize MVs derived from bone marrow mesenchymal cells. MVs were loaded with PTX, an anticancer molecule. Drug loading induces changes in MV spectra between 3000 and 2800 cm−1. These spectral changes show specific features observed in the PTX spectra. | Label-free characterization of EVs with FTIR can provide a quick and effective way of controlling exosome-based nano-cages for drug delivery applications. |
| Zlotorogski-Hurvitz 2019 [136] | Saliva/ Centrifugation | A total of 21 patients diagnosed with oral cancer (OC) and 13 donors (D) were recruited. Machine learning (ML) techniques (PCA–LDA and support vector machine) were used to classify exosomes. Classification performance was evaluated with ROC curves. | The authors highlighted a significant difference in IR spectra between OC and D at 1072 cm−1 (nucleic acids), 2924 cm−1 and 2854 cm−1 (membranous lipids), and 1543 cm−1 (transmembrane proteins). The difference was highlighted through relative intensity ratios. An ML-based classification model showed a sensitivity of 100%, specificity of 89%, and accuracy of 95%. | The paper first validates, in a complex clinical setting, a liquid biopsy approach based on the IR characterization of exosomes. |
| Martins 2020 [135] | Serum/ Exoquick | Two cohorts of patients were recruited, with a total of 21 AD patients and 21 controls. The 2nd derivative of FTIR spectra was calculated and a multivariate (PCA, LDA and QDA) and univariate (Mann–Whitney test) analyses were carried out. | EXOs have higher absorbance than serum spectra in the lipid regions (3000–2800 cm–1 and 1483–1423 cm–1) and the nucleic acids/carbohydrates regions (1200–900 cm–1). A multivariate analysis based on 2nd derivative spectra, PCA, LDA, and QDA shows that serum-derived exosomes have better discriminatory properties than serum. A significant difference among the two groups and in both cohorts is measured at 1064 cm−1, a peak assigned to ester C–O–C symmetric stretching of phospholipids and/or ribose C–O stretching (nucleic acids). | A key paper providing clinical validation of an exosome-based liquid biopsy approach for AD diagnosis. This study has wide application in diagnostics, because a blood test for AD is still lacking, despite the large research effort in this field. |
| Paper | Sample | Methodological Considerations | Outcomes |
|---|---|---|---|
| Tatischeff, (2012) [161] | EVs extracted by UC from D. discoideum cells during growth and starvation and from human urine. | Technique: Raman tweezer microspectroscopy Sample size: 10 replicates (cell experiment); 4 donors (urine). Analysis: Qualitative differences among spectra. | Raman distinguishes EXOs extracted from cells in different conditions (growth and starvation). Raman allows also for the chemical speciation of human EXOs extracted from urine. |
| Tirinato, (2012) [146] | EXOs extracted by IK from epithelial (CCD841-CoN) and cancer (HCT-116) human cells. | Technique: SERS on SHS. Sample size: 50 spectra for CCD841-CoN and HCT-116 cells. Analysis: Qualitative differences among spectra. | Raman signal is improved by combining SERS, that enhances the electromagnetic field, and SHSs, that increase EXO concentrations. The method allowed the authors to distinguish EXOs from epithelial and cancer cells. |
| Kerr, (2014) [156] | EXOs extracted by UC from ovarian carcinoma cells (A2780) in normoxia and hypoxia conditions. | Technique: SERS with AuNPs and Raman microspectroscopy. Sample size: 10 spectra for each condition. Analysis: multivariate (PCA and DFA). | The use of SERS and Raman microspectroscopy (RM) in the diagnostic field was explored. RM outperforms SERS in distinguishing EXOs extracted from the two conditions (normoxia and hypoxia). |
| Smith, (2015) [162] | EXOs extracted by UC from different cell lines: A549, Huh-7, SKOV3, IMR90, Jurkat, Kasumi-1, and 3T3. | Technique: Laser Tweezers Raman Spectroscopy (LTRS); Sample size: From 10 to 20 single EXOs measured for each cell line; Analysis: multivariate (PCA). | LTRS allowed authors to distinguish EXOs derived from several cell lines and different EXOs subpopulations in the same sample, thanks to the single EXO analysis. |
| Lee, (2015) [161] | EXOs extracted by total exosome isolation reagent (TEIR) and UC from ovarian cancer cell line (SKOV-3). | Technique: SERS with silver-coated nanobowl substrates. Sample size: 10 spectra for each time point. Analysis: PCA of the Raman spectra. | Lee et al. developed nanobowl SERS substrates that can capture and allow molecular-level EXO characterization. At the start of analysis, SERS spectra exhibited typical lipids and protein peaks. Later, new peaks developed, suggesting ruptures of EXOs over time, enabling the analysis of EXO content. |
| Stremers(2016) [153] | ELVs extracted by UC from melanoma cancer cells (B16F10) and human RBCs. | Technique: SERS with AuNPs. Analysis: PLS-DA and MCR-ALS. Sample size: 25 (B16F10), 41 (RBCs) and 60–80 spectra for the mixtures. | SERS, in combination with Au nanoparticles, allowed the use of PLS-DA analysis to discriminate spectra between RBC-derived and cancer-derived EXOs. |
| Gualerzi (2017) [163] | EVs extracted by DC from human bone marrow and adipose tissue mesenchymal stromal cells (MSCs), and dermal fibroblasts. | Technique: Micro-Raman. Sample size: 10 independent replicates for each cell type. Analysis: multivariate (PCA of normalized spectra, LDA classification using the first 25 PCs); univariate (ANOVA on PC scores). | The main outcome of this work is the presented Raman analysis can distinctly discern not only vesicles from MSCs and terminally differentiated fibroblasts, but also vesicles of MSCs from bone marrow and adipose tissue. |
| Park, J. (2017) [142] | EXOs were extracted by DC and chromatography from human lung carcinoma (H1299, H522) and PAEpiC cell lines. | Technique: SERS with AuNPs. Sample size: 37 samples of H1299, 34 of H522, and 23 of alveolar cell-derived EXOs. Analysis: PCA of the Raman spectra. | SERS measurements and statistical PCA analysis were used to develop a method for the detection of EXOs derived from cancer cells. |
| Sivashanmugan, (2017) [158] | EXOs extracted by UF from: epithelial (NL-20, Beas-2b), adenocarcinoma (PC9, HCC827 and H197) human cell lines and L929 murine cell line. | Technique: SERS on a substrate of Ag nanocubes (NCs) and Au nanorod (NR) array. Analysis: Qualitative study of the differences between spectra. | Sivashanmugan et al. developed different substrates for SERS analysis of EXOs. EXOs derived from lung adenocarcinoma cells exhibited a stronger and more heterogeneous signal in the protein band than EXOs derived from normal cells. |
| Avella-Oliver, (2017) [160] | EXOs extracted by UC from lung cancer cell line (A549 UC). | Technique: SERS on a silver cover substrate from a compact disk. Analysis: Qualitative observation of the Raman spectra. | Avella-Oliver et al. realized a novel cost-effective substrate for SERS analysis of EXOs based on regular recordable optical disk structures covered with silver. |
| Shin, (2018) [155] | EXOs extracted by chromatography from NSC lung cancer (PC9 and H1299) and pulmonary alveolar epithelial (HPAEC) human cell lines. | Technique: SERS on a substrate of Au nanoparticles coated with cysteamine for in liquid measurements. Sample size: 25 spectra for each sample. Analysis: PCA and ratiometric analysis. | In this work, Shin et al. showed differences in spectra obtained from NSCLC- device EXOs and HPAEC-derived EXOs. These was compared with the spectra of some protein markers to better understand the changes in cancer derived EXO composition, using both PCA and ratiometric approach. |
| Yan, (2019) [141] | EXOs extracted by UC and ExoQuick from HCC827 and H1975 lung adenocarcinoma cell lines, FBS and human serum. | Technique: SERS on hybrid substrate made of a graphene-covered Au surface containing a quasi-periodic array of pyramid. Sample size: 100 spectra for each sample. Analysis: PCA. | The method developed by Yan et al. enabled single EXO measurements. Efficient discrimination between EXOs derived from different biological sources was achieved by unbiased PCA. |
| Kruglik, (2019) [164] | EVs extracted by UC from human urine after an 8 h fasting period and from primary rat hepatocytes with and without Acetaminophen treatment. | Technique: Raman tweezer microspectroscopy (RTM) in the near-infrared region. Analysis: Biomolecular component analysis based on Raman markers. Sample size: 2 donors (urine); 5 and 7 EXO sets, collected from treated and untreated rat hepatocytes, respectively. | Kruglik et al. presented a comprehensive picture of the RTM potentialities and limitations for EXO characterization. The method demonstrates its capacity to unravel the different molecular contribution to EVs (proteins, lipids, nucleic acids, carotenoids, etc.). |
| Zhang, (2019) [162] | EXOs extracted by UC from esophageal (EC109, EC9706 and Kyse150), breast epithelial (M231 and MCF7), and hepatoma (HepG2) human cell lines. | Technique: SERS with AuNPs. Sample size: 35 spectra acquired for each cell line Analysis: PCA/LDA of the Raman spectra and ratiometric approach. | The application of PCA/LDA algorithm to SERS data allowed the classification of EXOs derived from 8 different sources. The authors also found that the 600–760 cm−1 region is associated with great differences in esophageal cells, whereas the 940–1100 cm−1 region is associated with breast cells. |
| Paper | Sample/Purification | AFM Methods | Mechanical Findings | Impact and Application |
|---|---|---|---|---|
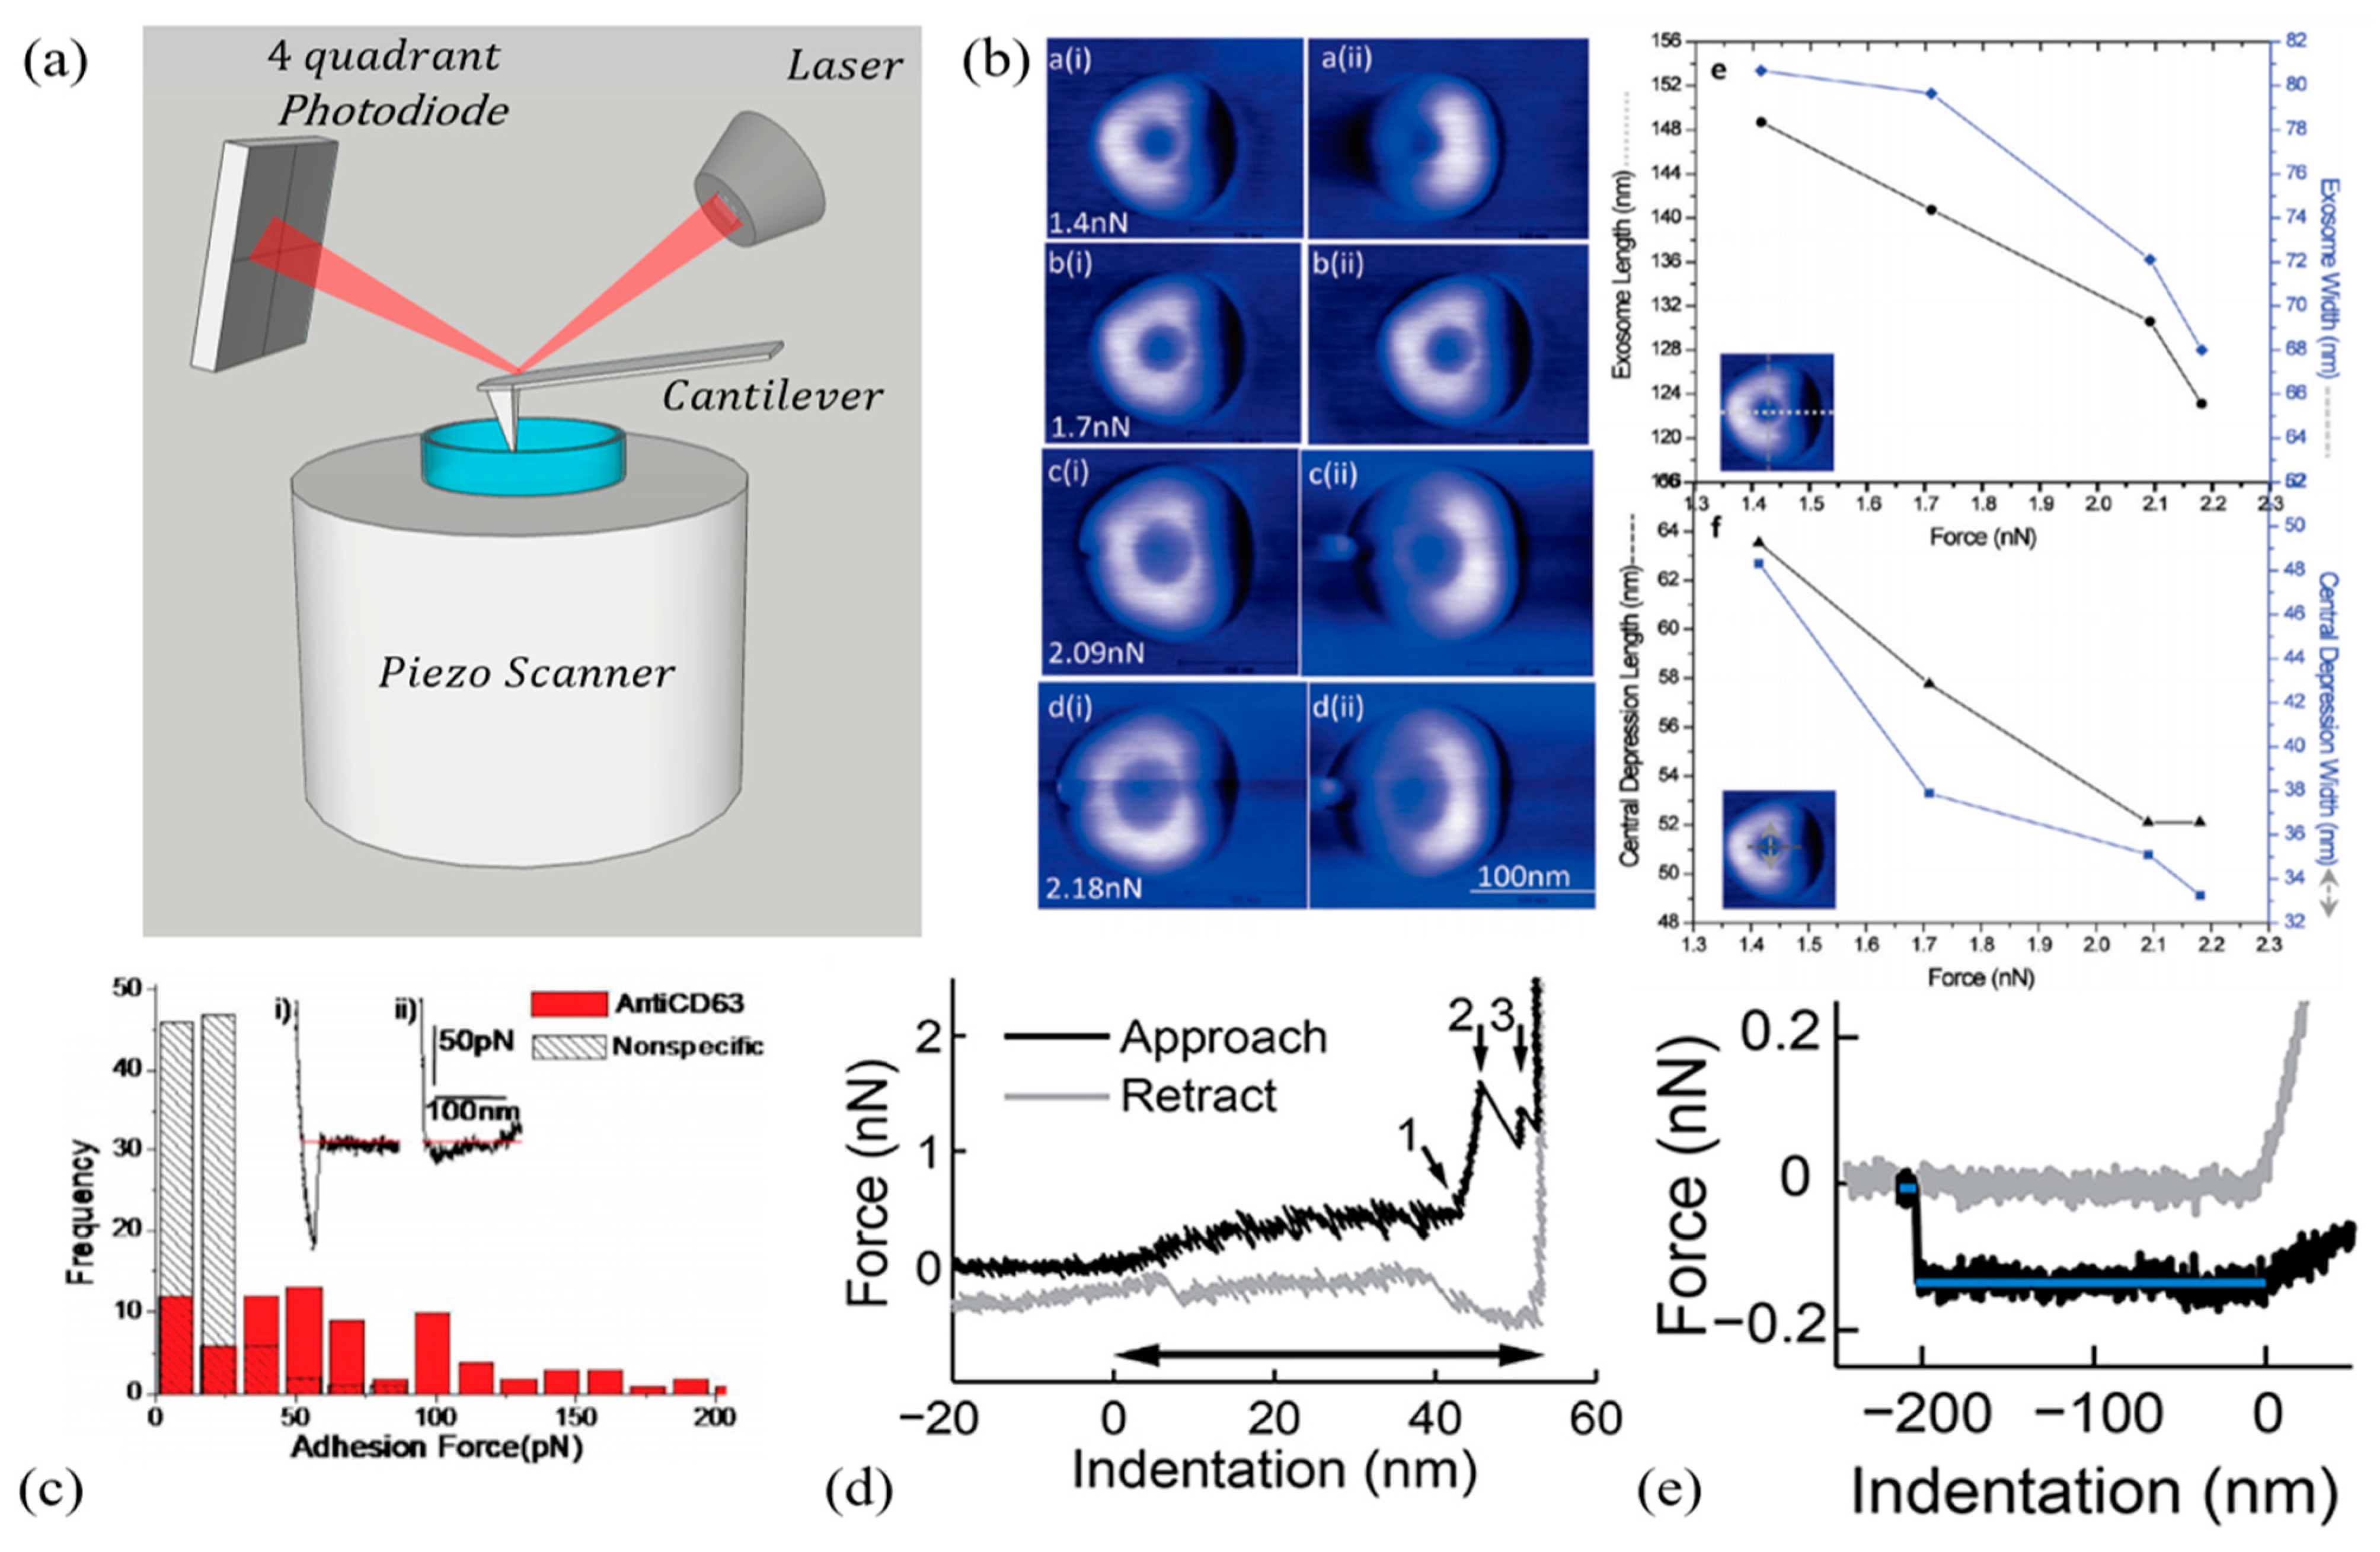
| Sharma 2010 [190] | EXOs extracted from Saliva by Ultracentrifugation (UC). | EXOs were absorbed overnight on mica. Measurements were performed in PBS using a soft (k = 0.02 N/m) MSCT cantilever (Veeco) at 0.25 Hz. AFM was used in the amplitude and phase modulation mode. Applied forces ranged from 1.4 nN to 2.4 nN. | EXOs deform under applied forces. Deformation is accompanied by a tri-lobed-shaped depression region in the particle center. The larger the applied force in the 1.4–2.4 nN, the deeper the depression (Figure 6b). Strong specific adhesions forces were measured using CD63-conjugated tips. | One of the first papers focused on EXO biomechanics highlighting their deformation under applied force and pointing out the need to use low forces for imaging purposes. The paper also shows that AFM can be used for specific exosome detection, through tip conjugation, thus being potentially useful in diagnostics. |
| Li 2021 [194] | EXOs extracted by UC from the bone marrow of lymphoma patients. | EXOs were absorbed on Poly-L-Lysine-coated slides and characterized with peak force tapping (PFT) AFM in PBS with a silicon nitride tip (k = 0.7 N/m, f = 150 kHz, and tip radius 20 nm). | Poly-L-Lysine facilitates AFM measurements of EXOs improving the height/diameter ratio (~0.3) compared to air-drying. PFT is suitable for the quantitative imaging of EXO topography, stiffness, adhesion and dissipative properties, also highlighting the contrast with the substrate. Dissipation is not homogeneous and symmetric on EXO surfaces. | These results demonstrate that AFM in the PFT mode is suitable for a quick and effective quantitative analysis of EXOs, and thus is of potential use for the search of EXO-based biomarkers. |
| Parisse 2013 [195] | SKBR3-derived EXOs. | The IT-AFM experiment was performed in liquid using a cantilever with k = 0.1 N/m and f = 32 kHz. | The typical shape of EXO FD curves is reviewed, highlighting their resemblance with curves acquired on artificial lipid vesicles. | In-depth theoretical models developed for artificial vesicles can be used to analyze extracellular vesicles. |
| Vorselen 2020 [174] | EXOs extracted from serum of healthy donors and patients diagnosed with hereditary spherocytosis. | EVs were absorbed on a poly-L-lysine coverslip. Imaging was performed using FD-based AFM with forces < 0.1 nN, reducing EV compression. Mechanics were measured through FD curves at 0.5 nN at a slow speed of 0.2–1 Hz (elastic response). Higher forces were used to penetrate the lipid bilayer and record membrane tethering. | The paper validates a protocol based on the Canham–Helfrich model to decouple EV bending modulus and La Place pressure. The method uses information from indentation and membrane tethering, which provides surface tension, σ. Steps are detailed for measuring σ, a non-trivial task because of tip contamination. The correct FD curve hallmarks are discussed: (i) a smooth indentation between the contact point and the EV height; (ii) an abrupt increase in reaction force when the two bilayers are pressed together; (iii) two discontinuities indicating 1st and 2nd bilayer rupture; and (iv) the interaction with the substrate. | A key paper in EXO biomechanics, as it provides a unified protocol for performing nanoindentation on vesicles and the subsequent data analysis. The paper guides scientists step by step through sample preparation, FD curve acquisition, model choice and application and statistical analysis of the data. |
| Ridolfi 2019 [193] | EXOs extracted by UC-SEC from milk and nematodes | EXOs were absorbed on Poly-L-Lysine. Measurements were performed in peak force mode in DI water using Bruker SNL-A probes (tip radius 2–12 nm, k = 0.35 N/m). Applied force was 0.15–0.25 nN, cantilever speed < 5 µm/s | The authors developed an AFM protocol to characterize artificial and natural vesicles mechanics in liquid by AFM imaging: (i) the method allowed them to retrieve EV unperturbed geometry and contact angle α in terms of particle height and surface projected radius; (ii) α depends on stiffness and it is roughly independent of EV size; (iii) a deviation from point ii indicates the presence of contaminants; (iv) a calibration curve is provided that allows calculating stiffness (a mechanical parameter) from contact angle (a morphological parameter). | A potential game-changer in the field, this paper presents the first high-throughput method for EXO mechanics based on imaging. The study derives stiffness from contact angles, and it is based on the understanding that EVs are deformed by adhesion forces into an equilibrium shape that is a direct consequence of EV stiffness. The method also allows the removal of contaminants, a key issue in EXO research. |
| Paper | Sample | Purification Strategy | Fabrication and Materials | Flow Conditions and Yield | Main Findings |
|---|---|---|---|---|---|
| C. Liu et al., 2017 [199] | Fetal bovine serum | Microfluidics - Elastic lift forces | Standard soft lithography techniques PDMS |
| The microfluidic device can separate EVs in a size-dependent manner. The separation is based on the generation of high viscoelastic lift forces, exerted on vesicles, due to the addition of a polymer (PEO) in the media. |
| B. Wunsch et al., 2016 [200] | Human urine | Microfluidics- Deterministic lateral displacement | Double-stage lithography (microfluidic channels nanopillars) SiO2 hardmask |
| Wunsch et al. realized DLD arrays of nanopillars (pillar gap sizes ranging from 25 to 235 nm) to separate EXOs smaller than 100 nm from heterogeneous vesicles samples with sharp resolution. |
| F. Liu et al., 2017 [201] | Plasma, urine and lavage fluid | Microfluidics - Filtration chip | PES filters (200 nm pore size) and low protein binding membranes (track-etched polycarbonate, 30–100 nm pore size), assembled in a plastic case. |
| The ExoTIC chip can isolate EVs from several biological sources due to a series of filtration membranes with higher yield and purity of standard methods. This technology meets the ASSURED criteria stated by the WHO; especially, the cost of a single ExoTIC chip is less than USD 1. |
| S. Cho et al., 2016 [202] | Mouse plasma | Electrofluidics - Electrical migration and size exclusion | UV-curable epoxy resin channels, PCTE membranes (30 nm pore size) and disk electrodes. |
| Cho et al. presented a fluidic chamber for EV isolation directly from biological fluids that rely solely on physical interactions, limiting detrimental effects on sample integrity. Notably, an electric field applied across a dialysis membrane aids protein migration but captures EVs on the membrane surface. |
| S. Marczak et al., 2018 [203] | Human serum | Electrofluidics - Electrical migration and size exclusion | Microfluidic chip was made from 300 µm polycarbonate sheets. Cation-exchange membrane has sulfonic or carboxylic acid groups that attract cations. |
| Marczak et al. presented a simple microfluidic device to simultaneously isolate and preconcentrate EXOs by trapping them in agarose gel using an ion-depleting cation-selective membrane. The cation depletion caused by the membrane is exploited to generate a high transverse local electric field. |
| L. Shi et al., 2019 [204] | Cell culture media, serum, plasma and saliva. | Electrofluidics - Dielectrophoresis separation | Micropipettes were fabricated using the laser-assisted puller. PDMS chambers were fabricated and bonded with a glass slide via oxygen plasma cleaner. |
| Shi et al. realized an insulator-based dielectrophoretic device based on micropipettes with conical tip pores, thus enabling the induction of a strong non-uniform electric field. The resulting DEP force—balanced by electroosmosis and electrophoresis forces—creates a region where EXOs are trapped. |
| M. Wu et al., 2017 [205] | Undiluted blood | Acoustofluidics - SSAW | Two SSAW modules arranged in series. The cell-removal module was set at 40 Vpp and 19.6 MHz. The exosome isolation module was set at 45 Vpp and 39.4 MHz. |
| Wu et al. developed an acoustofluidic platform for EXO isolation straight from undiluted blood. The device is composed of two tilted-angle SSAW modules arranged in series. The first module removes particles larger than 1 µm (e.g., blood cells), while the second module particles larger than 140 nm. |
| K. Lee et al., 2015 [206] | Polystyrene beads, cell culture media and RBCs | Acoustofluidics - SSAW | The IDT electrodes for SSAW generation (38.5 MHz) were patterned on a PDMS/LiNbO3 piezoelectric substrate and bonded to the microfluidics. |
| Lee et al. realized an acoustic nano-filter microfluidic system for MVs and EXOs isolation. They designed the device to exert maximal acoustic force on vesicles (>0.1 pN on 1-μm vesicles), enabling size-tunable separation of the latter in a continuous and label-free manner. |
| A. Ku et al., 2018 [207] | Cell culture media, human urine and plasma | Acoustofluidics - Acoustic trapping | Automated trapping device, AcouTrap (AcouSort®). |
| Using acoustic trapping, Ku et al. enriched EVs from several biological sources. This method exploits ultrasonic transducers to apply a primary and secondary acoustic force, to first trap seeding particles, and then to induce particle aggregation between EVs and seeding particles, allowing vesicle isolation. |
Publisher’s Note: MDPI stays neutral with regard to jurisdictional claims in published maps and institutional affiliations. |
© 2021 by the authors. Licensee MDPI, Basel, Switzerland. This article is an open access article distributed under the terms and conditions of the Creative Commons Attribution (CC BY) license (https://creativecommons.org/licenses/by/4.0/).
Share and Cite
Di Santo, R.; Romanò, S.; Mazzini, A.; Jovanović, S.; Nocca, G.; Campi, G.; Papi, M.; De Spirito, M.; Di Giacinto, F.; Ciasca, G. Recent Advances in the Label-Free Characterization of Exosomes for Cancer Liquid Biopsy: From Scattering and Spectroscopy to Nanoindentation and Nanodevices. Nanomaterials 2021, 11, 1476. https://doi.org/10.3390/nano11061476
Di Santo R, Romanò S, Mazzini A, Jovanović S, Nocca G, Campi G, Papi M, De Spirito M, Di Giacinto F, Ciasca G. Recent Advances in the Label-Free Characterization of Exosomes for Cancer Liquid Biopsy: From Scattering and Spectroscopy to Nanoindentation and Nanodevices. Nanomaterials. 2021; 11(6):1476. https://doi.org/10.3390/nano11061476
Chicago/Turabian StyleDi Santo, Riccardo, Sabrina Romanò, Alberto Mazzini, Svetlana Jovanović, Giuseppina Nocca, Gaetano Campi, Massimiliano Papi, Marco De Spirito, Flavio Di Giacinto, and Gabriele Ciasca. 2021. "Recent Advances in the Label-Free Characterization of Exosomes for Cancer Liquid Biopsy: From Scattering and Spectroscopy to Nanoindentation and Nanodevices" Nanomaterials 11, no. 6: 1476. https://doi.org/10.3390/nano11061476
APA StyleDi Santo, R., Romanò, S., Mazzini, A., Jovanović, S., Nocca, G., Campi, G., Papi, M., De Spirito, M., Di Giacinto, F., & Ciasca, G. (2021). Recent Advances in the Label-Free Characterization of Exosomes for Cancer Liquid Biopsy: From Scattering and Spectroscopy to Nanoindentation and Nanodevices. Nanomaterials, 11(6), 1476. https://doi.org/10.3390/nano11061476