Abstract
When the shield machines are constructed in soft soil, excavation may be impeded by the accumulation of cutter head mud. Geological conditions and shield construction are identified as the main factors for cutter head mud formation, based on analysis of its mechanism. In addition to traditional metrics, the imperforation area in the cutter head center is incorporated into the analysis of shield construction factors. The Analytic Hierarchy Process (AHP) is utilized to establish a risk assessment model for shield cutter head mud cake, determining the weight of each sub-factor and enabling a preliminary risk assessment of mud cake occurrence. This study applies Analytic Hierarchy Process (AHP) to classify the factors affecting shield mud by using the Mawan cross-sea channel construction project (Moon Bay Avenue along the Yangtze River) as a case study. Each factor is scored and weighted according to established scoring criteria and evaluation formulas, and then the results of the risk of shield mud cake in the Mawan tunnel are obtained. Moreover, field observations validate the proposed risk model, with the derived risk index demonstrating strong alignment with actual data.
1. Introduction
With the development of rail transit and cross-sea tunneling projects in modern Chinese cities, the shield tunneling method has become extensively utilized in rail transit construction. However, the phenomenon of mudding during shield construction occurs in unfavorable strata, such as weathered rock, sandy clay, clay, and medium sand. During the tunneling process, soil cut by the cutter head adheres to the tool, progressively accumulating around the entire cutter head. This accumulation inhibits the effective discharge of excavated soil. The presence of mud on the cutter head reduces the efficiency of shield propulsion, while simultaneously causing an increase in both the total thrust of the shield and the torque of the cutter head, ultimately resulting in the failure of the shield machine to advance [1]. Previous research indicates that the formation of mud cakes in shield structures can be categorized into two primary factors. The first is the geological condition factors, including plastic index, liquid index, and others. The second category pertains to shield construction factors, such as the flushing system, cutter head opening rate, cutter layout, and others. The issue of mild cutter head mud can be addressed through various methods, including optimizing the cutter head layout, adjusting the soil bin size, modifying the screw machine, and fine-tuning the slurry ratio and other means [2]. The stratum which is easy to mud can also set up a reasonable central flushing system to alleviate the problem of mud cake. However, insufficient awareness of the contributing factors and inadequate consideration of the tunneling risks associated with mud cake can lead to significant economic losses and delays in construction schedules [3]. Therefore, it is essential to analyze and assess the risk of shield mud cake prior to shield construction [4]. Risk analysis can effectively predict construction risk before construction, and then take prevention and control measures in time, which facilitate the smooth progression of the project.
The traditional methods for assessing risks in shield construction primarily include entropy measurement method [5], network analysis method [6], Analytic Hierarchy Process [7], Bayesian network [8], fuzzy analysis method [9], and so on. In subsequent studies on risk assessment models, both domestic and international scholars have enhanced the accuracy of these assessments by combining various models and applying them to shield tunnel projects. For the safety analysis of shield tunnels, Tian [10] integrated fuzzy analysis with the Analytic Hierarchy Process to establish a risk assessment system suitable for double-line shields in soft ground conditions in Tianjin. The system includes 6 first-level factors, 23 second-level factors, and 5 third-level factors, thereby rendering the risk assessment results more intuitive. Cao [11] applied this method to identify safety risks during the shield launching stage. Wang [12] combined nonlinear operators with traditional fuzzy analysis methods to establish a risk assessment model for Earth Pressure Balance (EPB) shield construction in soft soil areas, based on nonlinear fuzzy analysis method. This model effectively eliminates the tedious consistency-checking steps by transforming the fuzzy complementary matrix into a fuzzy consistency judgment matrix. Zhou [13] proposed a dynamic security assessment reasoning model that leverages the cloud model and Bayesian network. While this model offers some accuracy in obtaining prior probabilities through the cloud model, it relies heavily on extensive engineering data. Wu [14] analyzed potential risk factors when constructing shields beneath existing tunnels, proposing a mixed Gaussian Copula Bayesian model that identifies key influencing factors on construction safety and facilitates dynamic assessments. Based on the cloud model and entropy weight method, Wu [15] constructed a model for evaluating the comprehensive risks of underwater shield tunnel construction. This model mitigates the subjectivity inherent in traditional weighted methods. Zhang [16] constructed a safety risk assessment system for shield construction in a collapsible loess area, utilizing the GREY-DEMATEL method to address centrality issues and constructing a two-dimensional cloud model based on risk occurrence probabilities and the degree of potential risk loss.
For rock and soil under complex boundary conditions, Peng [17] proposed to adopt pre-removed segments to solve the construction-risk-control problem of shield tunnel expansion and excavation of metro stations. Mahdi [18] proposed to conduct numerical research on the ultimate bearing capacity of strip foundations by using the finite element method and the upper limit analysis method. Compared with numerical simulation, traditional calculation methods are more capable of simplifying problems. In the realm of shield tunnel engineering, Zheng [19] was the first to apply the fuzzy fault tree model to analyze the cost risks associated with shield tunnels. Wang [20] proposed the use of a Bayesian network as a risk analysis model for construction progress, specifically to assess schedule risks during shield tunneling operations. Due to the challenges in modeling Bayesian networks and the limitations of fuzzy representations for risk information, a combination of fuzzy theory and fault tree analysis was introduced. Leveraging the advantages of all three methodologies to establish a new risk analysis model, Qian [21] applied the algorithm of a decision tree to the environmental risk assessment of shield construction and constructed the decision tree of the risk index system through simple transformations, which enhanced modeling efficiency.
Regarding shield mud cake, Ding [7] established a risk assessment model based on the Analytic Hierarchy Process, which is applicable in practical engineering contexts. However, this model fails to account for issues such as low opening rates, reduced linear velocities, sluggish flow of slag and soil, and the tendency for slagging at the center of the cutter head. Consequently, this paper introduces the parameter of the non-opening area ratio of the cutter head center to refine the evaluation index for shield mud cake.
Based on the analysis methods of previous researchers, a new risk analysis model is established in this paper. Combined with the shield construction project of the Mawan cross-sea channel, the risk of mud cake is quantitatively analyzed, which provides early warning for the risk of shield mud cake and puts forward corresponding solutions.
2. Evaluation Process of Shield Mud Cake in the Initial Stratum
During tunneling through clay or rock strata, mud cake often accumulates on the cutter head and in the soil warehouse. This accumulation can result in abnormal tunneling parameters, significantly impacting both the construction timeline and the safety of the surrounding environment. By integrating research findings with construction experience, this paper systematically analyzes mud cake formation, focusing on geological conditions and shield construction factors. Subsequently, a risk assessment model for mud cake on the shield cutter head is established by using a modified Analytic Hierarchy Process [7].
2.1. The Principle of the Analytic Hierarchy Process
The Analytic Hierarchy Process (AHP) was proposed by Professor Saaty of the University of Pittsburgh in the 1970s [22]. It is a method for qualitative and quantitative analysis of problems with multiple objectives.
For instance, comparing the importance of n items with a weight of ω1, ω2, ω3, …, ωn and recording the weight ratio between two items, it can obtain the weight comparison matrix A.
Make the product operation of the weight comparison matrix A and the weight matrix of the item itself . The calculation is shown in Equation (2).
It can be determined that the comparison matrix A corresponds to the eigenvector of n after calculation. According to matrix theory, n is the unique non-zero maximum eigenvalue of the matrix A, and W is the eigenvector corresponding to the eigenvalue n of matrix A. Therefore, when weighing instruments are unavailable, one can compare the relative weights of the objects individually, thereby obtaining the relative weight ratios for each pair and constructing a comparative judgment matrix. The relative weights of the group can then be calculated by solving for the maximum eigenvalue and the corresponding eigenvector of the judgment matrix [23].
2.2. The Modeling Process of the Analytic Hierarchy Process
The Analytic Hierarchy Process (AHP) is widely used in the evaluation of multi-objective engineering projects. The following six steps can be used to evaluate the risk of the project by using the AHP.
The initial step involves defining the problem and utilizing various levels of factors to establish a hierarchical structure model that influences the issue. Constructing a hierarchical structure model is essential when analyzing a decision-making problem [24].
The second step involves constructing a comparative judgment matrix of project risk utilizing Saaty’s 1~9 scale method of Analytic Hierarchy Process [22]. The meaning of the scale is shown in Table 1. By using a specific element Hs from the upper layer as the criterion for judgment, all factors in the subsequent layer are compared in pairs. For a target element, Hs, aij represents the relative importance of Ai compared to Aj. On the contrary, aji signifies the relative importance of Aj compared to Ai, and aji = 1/aji, therefore, a judgment matrix A = (aji) n*n is obtained.

Table 1.
Definition of each scale value.
The third step involves calculating the maximum eigenvalue of the judgment matrix A and subsequently determining the eigenvector W associated with this maximum eigenvalue, the equation is AW = λmaxW. Then n components of W correspond to the weights of the factors.
The fourth step involves ensuring consistent judgments. It is essential to assess the consistency of the results after calculating the relative importance of the risk factors in matrix A. The calculation of the consistency index is shown in Equation (3).
The corresponding average random consistency index RI can be determined based on the calculated consistency index. The average random consistency index RI for orders to 1~9 as obtained by Liu [25] is shown in Table 2.
Table 2.
Average consistency indicators.
The calculation of the consistency ratio CR is shown in Equation (4).
When CR < 0.1, the judgment matrix A is generally considered reasonable, and A is established accordingly. Otherwise, the judgment matrix A requires further modification.
The fifth step involves calculating the weights of the overall vector. After the final calculation, the weights of the elements in the bottom layer related to the target are obtained.
Taking the three-layer hierarchical model as an example, it is assumed that the total target layer is A and the criterion layer is B, and the weights of B-layer in relation to A-layer are arranged as follows: b1, b2, …, bn. Assuming the scheme layer is C, the weights of C-layer in relation to the A-layer are arranged as follows: c1, c2, …, cn. The total weight is calculated as shown in Table 3.
Table 3.
Synthesis method of weight.
The sixth step involves evaluating the factors based on the established criteria and determining the overall risk value of the event in accordance with the weights of the factors.
3. Risk Model of Shield Mud Cake in the Initial Stratum
3.1. Risk Index Classification of Shield Mud Cake in the Initial Stratum
Based on the characteristics of shield mud cake, the risk levels of shield mud cake are categorized into four levels, namely I (high risk), II (medium risk), III (low risk), and IV (micro-risk). The grading standards for tunnel collapse and the corresponding evaluation indicators are shown in Table 4.
Table 4.
Formation definition of mud cake risk level.
- (1)
- Plasticity index and liquid index.
This paper considers the plasticity index (C1) and the liquid index (C2) as geological condition factors. The risk analysis model for shield mud cake is primarily applied to the initial formation. The risk classification of mud cake is shown in Table 5.
Table 5.
The risk classification of mud cake [26].
- (2)
- Flushing system
Evaluating the risk of mud cake solely based on soil parameters presents a limited perspective. The mud cake formed in the shield is influenced not only by geological conditions but also by factors related to shield construction. Maintaining a sour pipe on the partition board of the shield machine’s excavation warehouse allows the cutter head to be flushed with high-pressure mud or water, which effectively mitigates the formation of mud cake on the cutter head. The risk classification of the flushing system is shown in Table 6.
Table 6.
Risk classification of flushing system [7].
- (3)
- Imperforation area ratio in cutter head center
The imperforation area ratio in cutter head center is defined as the ratio of the area of the non-opening part of the central area to the area of the cutter head center. When the opening rate of the cutter head is too low, a significant area may remain unopened in the central region, increasing the risk of mud formation. In such cases, a flushing port can be incorporated into the cutter center panel to mitigate the risk of mud accumulation in this area. The calculation of the imperforation area ratio in the cutter head center is shown in Equation (5).
Here, δ is the imperforation area ratio in cutter head center; A is the unopened area at the center, m2. M is the central area of the cutter head, m2.
Due to the significant silting issues encountered during the construction of the Wuhan Sanyang Road shield project [27,28], the imperforation area ratio classified as high risk for this project’s cutter head design has been determined to be 0.8. Additionally, a comprehensive analysis of the mud degree in shield cutter heads in Shenzhen, Beijing, and other locations was conducted, leading to a summary of the risk classification for the imperforation area ratio in cutter head center [29,30,31,32], as shown in Table 7.
Table 7.
Risk classification of imperforation area ratio in cutter head center.
- (4)
- Cutter head opening rate
The lower limit for the opening rate of the shield cutter head is set at 33% to prevent mud accumulation on the cutter head and to ensure the normal operation of the shield cutter head [33]. The calculation of the theoretical value of the cutter head opening rate is shown in Equation (6).
Here, [ζ] is the cutter head opening rate; D is diameter of the shield machine, m; p0 and pa are the later earth pressure and active earth pressure on the surface of the shield tunnel, kPa; c and φ are the cohesion and internal friction angle of soil, kPa and °. K0 is the dimensionless static lateral pressure coefficient; γ is the proportion of soil at the top of the tunnel, N/m3; H is the buried depth of tunnel center, m. L is the length of soil bin, m; emax is the maximum percentage of sludge discharge rate. k1 and k2 are the empirical coefficient. k1 = 4.3, k2 = 1.8. The risk classification of the cutter head opening rate is shown in Table 8.
Table 8.
The classification of cutter head opening rate [7].
- (5)
- Cutter layout
The cutter head system governs the crushing mechanism of the stratum. Incorrect selection and irrational arrangement of the cutters can create blind spots in the cutter head and result in uneven soil blocks, ultimately diminishing tunneling efficiency. The risk classification of the cutter layout is shown in Table 9.
Table 9.
The risk classification of cutter layout.
3.2. Construction of Risk Assessment Model for Shield Mud Formation in the Initial Stratum
The hierarchical structure model of shield mud cake is primarily divided into three layers, the target layer, the criterion layer, and the scheme layer. The objective of this paper is to develop a risk assessment model for shield mud cakes, with the target layer representing the mud risk associated with the shield cutter head in the initial stratum. The criterion layer identifies the causes of the mud phenomenon associated with the shield cutter head. Each cause can be further decomposed into various risk sub-factors that contribute to the occurrence of risk events, which are categorized within the scheme layer. The risk hierarchy model of shield mud cakes is constructed and applied during the preparation stage of shield engineering, based on two aspects: geological condition factors and shield construction factors, as shown in Figure 1.
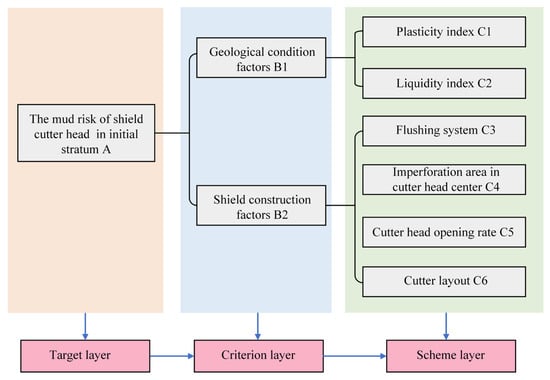
Figure 1.
The hierarchical structure model of shield mud cake risk.
The importance of local factors is determined and the judgment matrix is established through the consultations and discussions with shield engineering experts, as shown in Table 10.
Table 10.
Judgment matrix of local weight (B-A).
It is divided into two aspects: geological condition factors and shield construction factors after the calculation of local influencing factors is completed. A judgment matrix detailing the relationships among the influencing factors in each scheme layer is constructed, as shown in Table 11 and Table 12.
Table 11.
Judgment matrix of geological condition factors (C-B1).
Table 12.
Judgment matrix of shield construction factor (C-B2).
The weights of various levels of factors are derived from hierarchical model of mud risk associated with the shield cutter head. The local weight represents the importance of other parameters within the same level, while the overall weight reflects the primary factors influencing the risk events related to the shield cutter head mud. The overall weight of each mud factor is calculated using a synthesis method, as shown in Table 13.
Table 13.
Weight of influencing factors of shield mud cake.
In summary, the total ranking weight vector of the bottom factors is ω(B-A) = [0.495, 0.165, 0, 0.026, 0.173, 0.09, and 0.051] according to the analysis and calculation of the hierarchical structure model. The order of weight values is as follows: plasticity index, imperforation area ratio in cutter head center, liquid index, cutter head opening rate, cutter layout, and flushing system. Each influencing factor is shown in Figure 2. The figure indicates that, within the overall goal, the plasticity index holds the largest weight, accounting for 49%, followed by the imperforation area at the cutter head center and the liquid index. It is evident that the state of the soil is critical to the mud encountered by the shield cutter head; however, the sub-factors related to shield construction also impact the mud conditions.
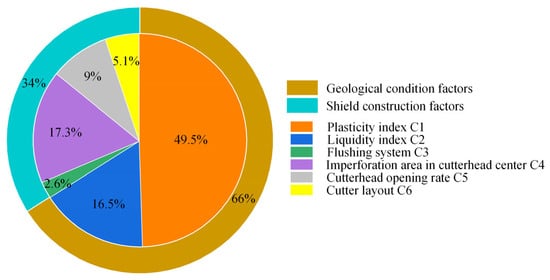
Figure 2.
Histogram of overall weight.
The weights for each index in the shield mud cake risk assessment have been established, and a risk assessment model for shield mud cake has been developed. The classification of mud risk is derived by scoring the underlying factors and integrating these scores with their respective weights. The calculation of the form of the scoring vector is shown in Equation (7).
Here, F is the scoring matrix of each factor; f is the score of each factor; ω is the weight of each factor; S is the value of risk assessment.
4. Engineering Case
4.1. The Project Overview of the Mawan Tunnel
4.1.1. Project Profile
The Mawan Cross-Sea Tunnel Project (Moon Bay Avenue Riverside Expressway) is situated in the western part of Shenzhen City, traversing two regions: Qianhai and Dachan Bay. The route is oriented in a north–south direction, commencing at the intersection of Mawan Avenue and Moon Bay Avenue in the south, crossing the Qianhai Bay sea area to the north, and concluding at the Dachan Bay toll station, where it meets the intersections of Jinwan Avenue and Xixiang Avenue. The total length of the route is approximately 8.05 km, which includes 2.5 km within the Qianhai section, 1.1 km in the sea section, and 4.45 km in the Dachan Bay section. The total length of the shield tunnel in this segment is 2060 m (from LK2 + 280 to LK4 + 340). The starting well of the shield is located within the Qianhai section, with a minimum overburden thickness of 21.6 m. The receiving well is situated in the Dachan Bay section, where the minimum overburden is 10.5 m, while the overburden thickness in the sea section ranges from 20.9 to 28.6 m. A wastewater pump room is positioned near the lowest point of the longitudinal section of the shield tunnel, and there is no connecting channel. The minimum turning radius is 2000 m, and the maximum slope is 3.75%. The plane diagram and profile diagram of the shield tunnel are shown in Figure 3.
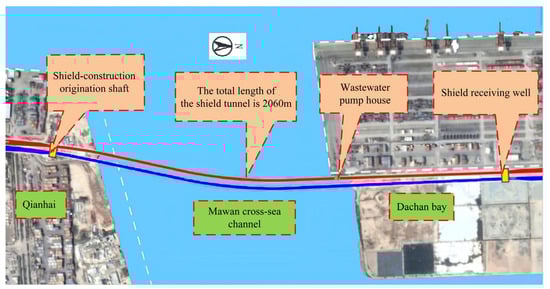
Figure 3.
Plane diagram of shield tunnel.
4.1.2. Geological Conditions of the Shield Section
The front 822 m of the advancing line in the shield section of the Mawan tunnel consists of full-section hard rock; the middle segment of 938 m comprises upper-soft and lower-hard strata, while the final 300 m consists of soft soil. The original landform along the alignment was a shallow bay in the eastern Lingdingyang of the Pearl River estuary. Following artificial filling, this area has been converted into a port wharf, resulting in a geologically poor condition. During the construction of the project, adverse geological effects, such as sand liquefaction, ground subsidence, and ground collapse, may occur. The geological profile of the Mawan tunnel is shown in Figure 4.
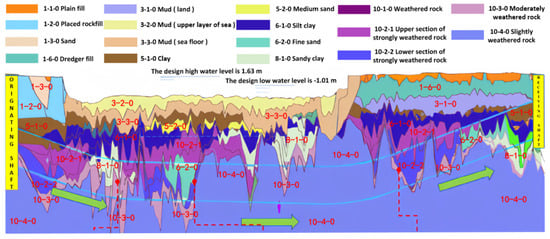
Figure 4.
Geological profile of Mawan tunnel.
The primary strata in the shield tunnel section include 5-1-0 clay, 6-1-0 mucky soil, 8-1-0 sandy silty clay, 10-1-0 fully weathered rock, 10-2-0 strongly weathered rock, 10-3-0 moderately weathered granite, and 10-4-0 slightly weathered granite. Geological data for this construction section were obtained from the geological survey report, as presented in Table 14. The average uniaxial compressive strength of the rock in the shield section is 44.9 MPa, with a maximum strength of 138 MPa. Soil properties are defined according to natural water content Wn, liquid limit WL, and plastic limit WP. With the increase of moisture content, the hard cohesive soil under the plastic limit changes from very hard to hard and reaches the plastic state. In addition, it is no longer a plastic state and becomes a soft liquid under the liquid limit.
Table 14.
Mawan tunnel stratum parameters.
The strata in the shield tunneling section primarily consist of sandy clay and strongly decomposed rock. Only the strata near the starting and ending points include silt, clay, medium sand, muddy clay, and coarse sand. In most sections, medium and slightly weathered rock intrudes upon the shield section.
4.1.3. Design Parameters of the Shield Cutter Head
The Փ15,550 mm composite slurry air pressure balance shield machine is employed in the tunnel project. The total length of the shield machine is approximately 104 m, with a cutter head diameter of Փ15,550 mm and an outer shell diameter of Փ15,510 mm. The length of the shield body is 14,500 mm, and the total weight is approximately 2500 tons. The basic parameters of the shield machine are shown in Table 15 below.
Table 15.
Basic parameters of shield machine.
4.2. Risk Assessment of Mud Cake on Shield Cutter Head Based on AHP
4.2.1. Risk Assessment of Initial Formation Environmental
Draw discrete data points of different liquid–plastic limit grades in the Figure 5 to facilitate the classification of liquid–plastic limit grades. The classification of the plasticity index of the soil fluid is corrected based on the test results [26]. And draw the four risk levels of micro, low, medium, and high based on the boundary points of each level of risk. The parameters of the soil layers in the shield section of the Mawan tunnel are detailed in Table 14. A mud risk assessment of the adhesion of the 1~1030 ring soil layers within the Mawan Tunnel is conducted based on the liquid index and plasticity index of the soil. The size of the circles represents the proportion of soil in the shield section. The results are shown in Figure 6.
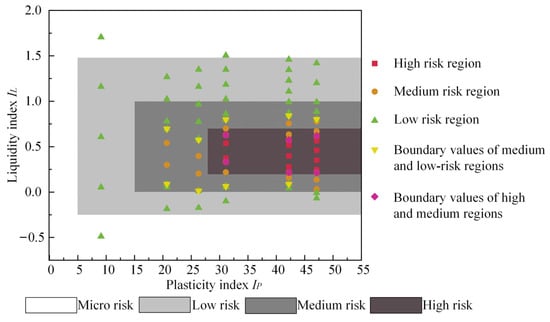
Figure 5.
Classification of plasticity index and liquidity index.
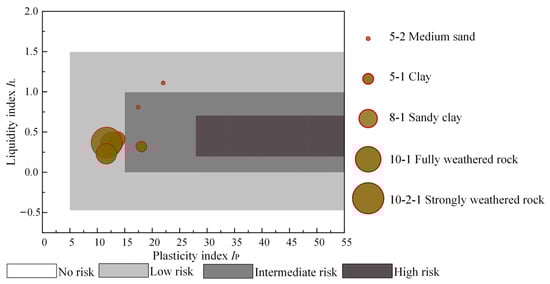
Figure 6.
Mawan tunnel shield silting probability based on geological condition factors.
Figure 6 indicates that most of the soil in the shield section of the Mawan tunnel falls within a low-risk area based on the analysis of geological condition factors, while a smaller portion is categorized as intermediate risk. The entire shield section of the tunnel, which has a certain risk of mud cake formation, is primarily situated in intermediate and low-risk areas. Further evaluation of the risk of mud cake in the Mawan tunnel shield is necessary, considering the factors related to shield construction.
4.2.2. Risk Assessment of Shield Construction Factors in the Initial Stratum
A risk analysis of the shield construction factors for the Mawan tunnel is conducted based on the shield machine parameters and the evaluation criteria established for the project.
- (1)
- Flushing system
The center area of the cutter head is configured with 17-inch disc cutters (6 sets of double-axis double-edged). To address the erosion requirements of the cutter head center, the shield machine is fitted with a P0.1-Pump specifically designed for this purpose, catering to the needs of the six central panels of the cutter head, six nozzles between the cutter head arms, and six buckets. This indicates that the Mawan tunnel is equipped with a flushing system to accommodate special geological conditions, which are assessed to be at a micro-risk level.
- (2)
- Imperforation area in cutter head center
Due to the spatial limitations in the central part of the cutter head and the need to facilitate rock-breaking, openings have been created at the center, where 17-inch hobs are installed. Each blade is capable of a maximum thrust of 267 kN. Figure 7 presents the calibration schematic diagram of the imperforate area in the cutter head center of the Mawan tunnel shield. The black dotted circle is the center area of the cutter, and the open area in the center is the red area in the square diagram. Imperforation area in cutter head center is calculated to be δ = 0.6 according to Equation (7), which is judged to be a medium risk level.
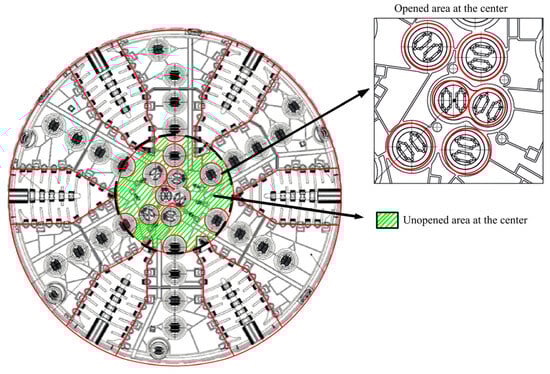
Figure 7.
Calibration of imperforation area ratio of Mawan tunnel in cutter head center.
- (3)
- Cutter head opening rate
The opening rate of the shield cutter head of the Mawan tunnel is 28.5% according to the shield parameters. The risk of mud buildup on the shield cutter head reaches its highest level when the opening rate is below 33%, which is classified as high risk.
- (4)
- Cutter layout
The Mawan tunnel employs a 19-inch disc cutter at the front and surrounding areas, a 17-inch disc cutter in the center, and a disc cutter rolling monitoring system for each blade. Interchangeability of the disc-tooth cutters enables adaptation to varying soft and hard formations. If the layout is rational and there are no cutting blind spots, it is classified as risk-free.
4.2.3. The Results of Mud Cake Risk Assessment
The factors contributing to mud buildup on the shield cutter head have been classified based on prior analysis. The index classification is shown in Table 16.
Table 16.
Risk score table of shield mud factor.
The plasticity index and liquid index of each soil layer are derived from the geological survey of the 1~1030 ring segment of the Mawan tunnel. The tunnel is analyzed independently in increments of 100 rings, with each factor scored according to the criteria outlined in Table 15. Consequently, the mud risk score for each factor in the initial formation prior to the excavation of the Mawan tunnel can be determined, as shown in Table 17.
Table 17.
Mawan tunnel shield mud cake risk assessment score.
The risk score for each shield section of the Mawan tunnel is obtained by using Equation (8). The evaluation results are shown in Figure 8.
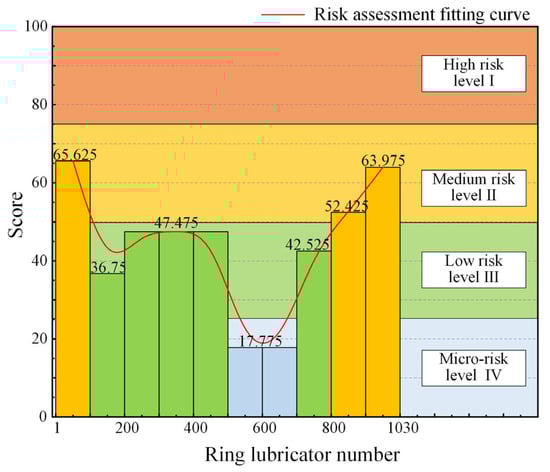
Figure 8.
The histogram of mud risk of the Mawan tunnel.
The parameters of the shield machine are assigned fixed values during the tunneling process. However, the risk level of siltation continuously varies, influenced by geological condition factors. The following conclusions can be drawn: the risk of mud cake is primarily concentrated in the 1~100 ring at the starting position which is in the yellow areas of the picture, while a medium risk level II is observed in the 900~1030 ring at the end of the shield which is in the blue areas of the picture. This observation aligns with the evaluation results of geological condition factors. It can be seen from Figure 4 that the strata in rings 1 to 100 are mainly clay, classified with medium risk level II, which presents a higher risk of mud deposition. Additionally, the stratum in the 500~700 ring, classified within micro-risk level IV, is predominantly composed of weathered granite, which presents an almost negligible risk of mud deposition. These conclusions are consistent with the mud risk assessment curve for the Mawan tunnel.
4.3. Comparative Analysis of Mud Risk Assessment and Measured Data
4.3.1. Comparative Analysis of Shield Tunneling Parameters
The data comes from the construction of the slurry balance shield machine in the 1~560 ring of the Mawan tunnel shield construction project. The shield machine collects over 60,000 operational parameter data points through sensors. Human factors can cause variations in some monitoring results during the shield tunneling process. It is necessary to use data cleaning to remove such data. The remaining data points primarily originate from formation conditions and the shield cutter head design, and are suitable for subsequent analysis by drawing a line chart of shield thrust, torque, cutter head speed, and tunneling speed, as shown in Figure 9, Figure 10, Figure 11 and Figure 12.
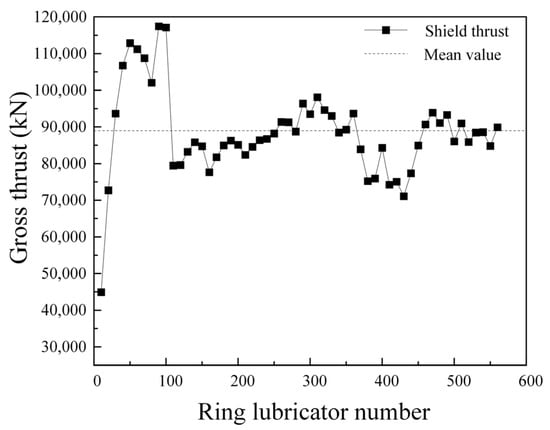
Figure 9.
Shield thrust of 1~560 ring.
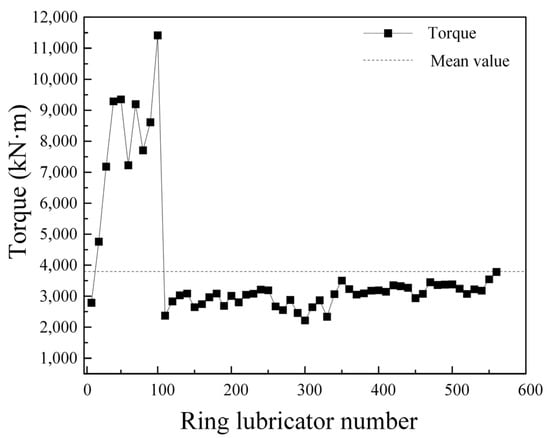
Figure 10.
Shield cutter head torque of 1~560 ring.
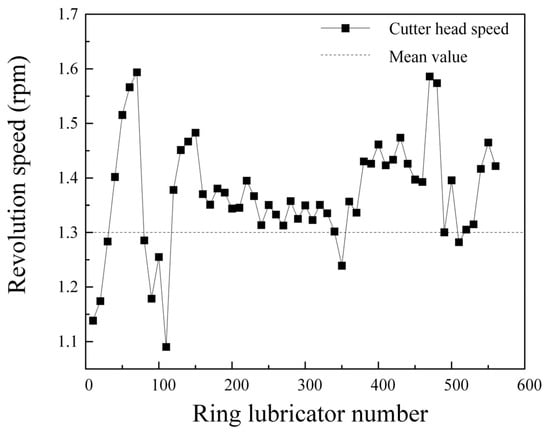
Figure 11.
Shield cutter head speed of 1~560 ring.
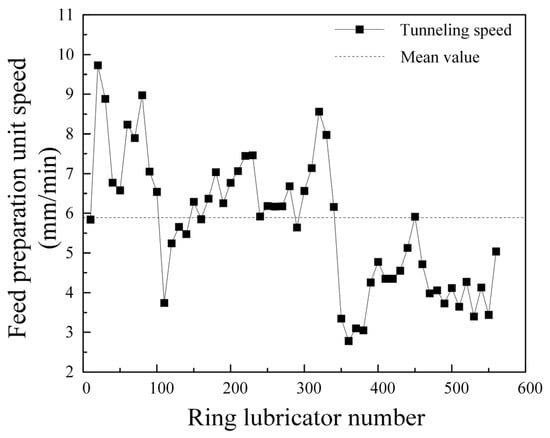
Figure 12.
Shield tunneling speed of 1~560 ring.
The average thrust of the shield cutter head is 8879.2 kN, the average torque of the shield cutter head is 3799.62 kN·m, the average speed of the cutter head is 1.33 rmp, and the average speed of the shield is 5.9 mm/min. Analysis of the data indicates that the thrust in the 1~100 ring section steadily increases from the starting point, reaching a maximum value of 114,697.11 kN, while the torque of the shield cutter head rises to a peak of 10,255.75 kN. The cutter head speed and shield tunneling speed in the 1~100 ring range also show a consistent increase from the starting point, peaking before rapidly decreasing, demonstrating significant fluctuations. The shield thrust in the 200~400 ring interval has a small peak, and the cutter head speed has a local minimum value. The shield tunneling parameters are relatively stable after 500 rings.
4.3.2. Ratio Analysis of Shield Tunneling
The existing measured data are insufficient for accurately assessing the mud risk associated with the cutter head. Therefore, the two indicators proposed by Liu [34], the cutter head torque coefficient and the formation penetration index, are introduced for analyzing the mud conditions. The torque experienced during shield tunneling can be categorized into resistance torque and tunneling torque. The magnitudes of these two types of torque are influenced by several factors, including the friction coefficient between the formation and the cutter head, the cutter head and cutter design, the dimensions of the cutter head, the formation strength, and the condition of the muck. The average tunneling torque value of the shield, relative to the unit tunneling thrust, is calculated by dividing the tunneling torque by the tunneling thrust; this value is defined as the cutter head torque coefficient. This coefficient can be utilized to evaluate the adhesion and cutting properties, as shown in Equation (9).
Here, k is torque coefficient of cutter head; T is torque of tunneling; F is the shield thrust.
The total thrust of the shield can be categorized into resistance thrust and tunneling thrust, both of which are primarily influenced by the design of the shield machine and the strength of the stratum. The formation penetration index reflects the thrust required for a unit of advanced speed or the corresponding degree of penetration. An increase in the formation penetration index indicates that the thrust required by the advance speed of a unit rises, while the penetration of the formation diminishes, as demonstrated in Equation (10).
Here, R is penetration index of stratum; F is the shield thrust; V is tunneling speed.
The shield parameters of 1~560 rings are used to calculate the shield cutter head torque coefficient and the ground penetration index in this paper, as shown in Figure 13 and Figure 14.
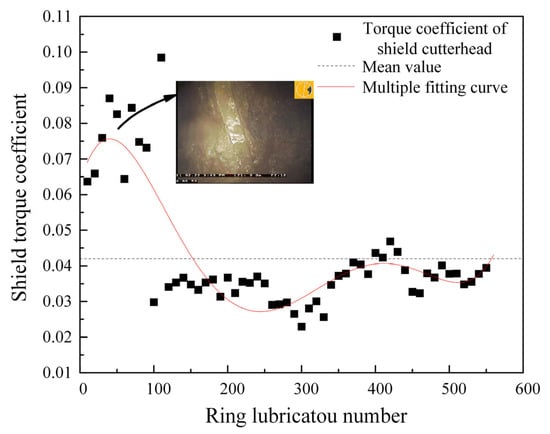
Figure 13.
Shield cutter head torque coefficient of 1~560 ring.
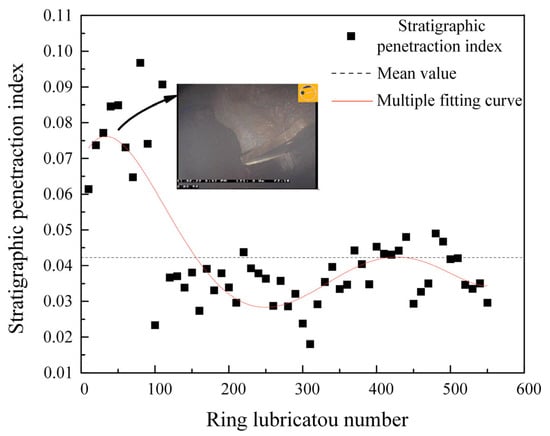
Figure 14.
Formation penetration index of 1~560 ring.
It can be seen from the figure that there are two peaks in the fitting curve of the cutter head torque coefficient and the formation penetration index, those were located at the range of 1~100 rings and 300~500 rings, respectively. Both parameters reach the maximum value in the range of 1~100 rings. The maximum value of the cutter head torque coefficient is 56% higher than the average, while the maximum value of the formation penetration index is 55% above the average. This indicates significant stratum adhesion within this interval, leading to an increased thrust requirement for shield tunneling. Construction workers observed the actual engineering conditions on site and confirmed the occurrence of a mud phenomenon at this time.
Analysis of the fitting curve for the shield tunneling parameters over the first 600 rings, alongside the curve of the stratum penetration index, reveals that the trend of the fitting curve aligns with the risk assessment of initial formation mudding in the Mawan tunnel. This consistency supports the validity of the risk assessment model for initial formation mudding.
5. Conclusions
- (1)
- Research indicates that the influencing factors of shield mud cake can be categorized into two main types: geological condition factors and shield construction factors. In addition to traditional factors such as the flushing system, cutter head opening rate, and cutter layout, the imperforate area ratio in the cutter head center is also considered in the context of shield construction. A risk assessment model for mud cake associated with the shield cutter head has been established using the Analytic Hierarchy Process (AHP). This model has been refined through historical data analysis, influencing factor analysis, and expert experience to effectively assess the probability of mud cake occurrence.
- (2)
- Based on the scoring criteria and evaluation formula, the factors are assigned scores and summed to obtain the mud risk scores for each factor prior to the excavation of the Mawan Tunnel, as well as the risk scores for each shield section. The risk assessment model predicts the likelihood of mud cake formation during the shield construction process of the Mawan Tunnel. It is concluded that the risk of mud cake is highest in the 1–100 ring surrounding the starting position and the 900–1030 ring near the end of the shield, placing these areas in the medium risk level II. Conversely, the middle section, specifically the 500–700 ring, consists mainly of weathered granite, presenting minimal risk of mud cake formation and categorizing it within the micro-risk level IV.
- (3)
- According to the shield construction log for the first 600 rings of the Mawan Tunnel, the distribution patterns of thrust, torque, rotational speed, and tunneling speed of the shield cutterhead were analyzed. Within the 1~100 ring range, both shield thrust and cutterhead torque continue to increase until reaching their maximum values, while the cutterhead speed and tunneling speed initially rise to a peak before rapidly declining, exhibiting significant fluctuations. The cutterhead torque coefficient and the stratum penetration index are utilized to assess construction mud conditions. The results indicate that both the cutterhead torque coefficient and the stratum penetration index increase simultaneously within the 1–100 rings interval, suggesting that the strata in this range necessitate substantial tunneling thrust. It is thus concluded that there may be potential mud-related phenomena during this phase. Overall, the comprehensive data reveal that the mud risk assessment findings align well with the measured data, thereby validating the reliability of the mud cake risk assessment model for the initial stratum shield.
Author Contributions
Conceptualization, S.D., L.L. and H.L. (Huanyu Lin); methodology, S.D.; software, H.L. (Huanyu Lin).; validation, Y.X.; formal analysis, W.C.; investigation, H.L. (Huanyu Lin).; resources, L.L. and Y.B.; data curation, H.L. (Huanyu Lin); writing—original draft preparation, Y.X.; writing—review and editing, S.D.; visualization, W.C.; supervision, S.D. and Y.B.; project administration, S.X. and H.L. (Hui Li); funding acquisition, S.D. All authors have read and agreed to the published version of the manuscript.
Funding
This work was supported by the National Natural Science Foundation of China (No. 52378400); China Communications Construction Company (CCCC) Major Research Program (No. 2023-ZJKJ-15); China First High Way engineering CO., LTD. Grade-A Project (No. 2024-A-02).
Data Availability Statement
All data included in this manuscript are available upon request by contacting with the corresponding author.
Conflicts of Interest
Author Shoubao Xue and Hui Li was employed by the company China First Highway Engineering Co., Ltd. Authors Lin Li and Yun Bai were employed by the company Shanghai Lingyun Civil Engineering Consulting Co., Ltd. The remaining authors declare that the research was conducted in the absence of any commercial or financial relationships that could be construed as a potential conflict of interest.
References
- Wang, Y.B. Cause analysis and treatment of mud cake on cutter head of earth pressure balance shield machine. Eng. Technol. Res. 2021, 6, 134–135. [Google Scholar]
- Huang, Y.; Li, Y.M.; Xie, X.Y.; Liu, Z.; Mie, Y. Research on advanced control of shield tool wear in composite strata. Chin. J. Undergr. Space Eng. 2021, 17, 222–228. [Google Scholar]
- Li, X.W.; Zhu, J.C.; Yuan, F.F.; Dong, Y.Q.; Liu, J. Selection and adaptability analysis of large diameter slurry shield machine in soft and hard composite strata. Build. Technol. Dev. 2022, 49, 162–164. [Google Scholar]
- Guo, S.T.; Yang, X.F.; Meng, Q.J.; Zuo, L.; Yang, L. Research on selection and application of subway shield in Nanning composite stratum. J. Water Resour. Archit. Eng. 2022, 20, 28–34. [Google Scholar]
- Sun, Y.Y. Risk assessment of shield construction in Lanzhou metro based on entropy measurement method. N. Technol. Prods. Chin. 2023, 14, 85–87. [Google Scholar]
- Wu, Q.L.; Wang, M.S.; Yin, M.L. Risk analysis of shield tunneling based on a network analysis method. Chin. J. Undergr. Space Eng. 2019, 15, 1881–1888. [Google Scholar]
- Ding, X.B.; Wei, K.H.; Zou, D.; Shi, Y.; Sheng, J. Risk assessment model of mud cake formation of EPB shield based on multi-source parameter analysis. Chin. Civ. Eng. J. 2022, 55, 119–128. [Google Scholar]
- Yin, Q. Research on Safety Risk Assessment of Subway Shield Construction Based on Dynamic Bayesian Network. Master’s Thesis, Qingdao University of Technology, Qingdao, China, 2023. [Google Scholar]
- Zhao, G.Y. Research on Risk Identification and Evaluation of Subway Shield Construction. Master’s Thesis, Nanjing University, Nanjing, China, 2010. [Google Scholar]
- Tian, Y.H. Study on Ground Deformation and Risk Analysis of Double-Track Subway Shield Tunnel Construction in Tianjin Soft Soil Layer. Master’s Thesis, Beijing Jiaotong University, Beijing, China, 2019. [Google Scholar]
- Cao, P.; Yu, H.L.; Duan, J.C.; Sun, Z. Safety risk assessment of shield launching in special strata based on AHP-fuzzy comprehensive evaluation method. Constr. Technol. 2021, 50, 80–86. [Google Scholar]
- Wang, X.Y.; Gong, H.; Song, Q.Y.; Yan, X.; Luo, Z. Risk assessment of EPB shield construction based on the nonlinear FAHP method. Adv. Civ. Eng. 2022, 2022, 9233833. [Google Scholar] [CrossRef]
- Zhou, L. Dynamic evaluation of safety risk of shield tunneling under railway based on cloud Bayesian network. Ind. Constr. 2023, 53, 226–233. [Google Scholar]
- Wu, Z.T. Analysis of construction risk of shield tunneling under existing tunnel based on Gaussian Copula Bayesian model. Ind. Constr. 2023, 53, 55–64. [Google Scholar]
- Wu, Z.Q.; Zou, S.L. A static risk assessment model for underwater shield tunnel construction. Sadhana 2020, 45, 215. [Google Scholar] [CrossRef]
- Zhang, Y.; Liu, S.; Mou, Y.X. Risk assessment of shield construction of water conveyance tunnel in collapsible loess area. Yangtze Riv. 2024, 55, 184–191. [Google Scholar]
- Peng, Z.Y.; Yang, X.R.; Liu, W.N.; Rad, M.M. Research on Risk Control Parameters of a Shield-Tunnel-enlarged Station, based on Bearing Capacity of Pre-removed Segment. Acta Polytech. Hung. 2023, 20, 213–229. [Google Scholar] [CrossRef]
- Salari, M.; Lezgy-Nazargah, M.; Shafaie, V.; Rad, M.M. Numerical Study of the Ultimate Bearing Capacity of Two Adjacent Rough Strip Footings on Granular Soil: Effects of Rotational and Horizontal Constraints of Footings. Buildings 2024, 14, 1653. [Google Scholar] [CrossRef]
- Zheng, J.J.; Lin, C.F.; Zhao, D.A.; Ding, L.Y. Risk assessment of shield tunnel construction cost based on fuzzy fault tree. Chin. J. Geotech. Eng. 2011, 33, 501–508. [Google Scholar]
- Wang, J.S. Research on Schedule Risk Analysis Model of Shield Tunneling Under High-Speed Railway Under Construction. Master’s Thesis, Lanzhou Jiaotong University, Lanzhou, China, 2023. [Google Scholar]
- Qian, J.X. Research and Application of Environmental Risk Assessment Method for Shield Construction Based on Engineering Data. Master’s Thesis, Nanjing University of Science and Technology, Nanjing, China, 2022. [Google Scholar]
- Saaty, R.W. The analytic hierarchy process-what it is and how it is used. Math. Model. 1987, 9, 161–176. [Google Scholar] [CrossRef]
- Xu, J.; Liu, N. The basic idea and practical application of the analytic hierarchy process. Inf. Res. 2008, 12, 113–115. [Google Scholar]
- Mao, R.J.; You, J.X.; Duan, C.Y.; You, X.Y. Improvement of Supplier Sustainability Assessment Model Based on Fuzzy Random Analytic Hierarchy Process. J. Tongji Univ. (Nat. Sci.) 2018, 46, 1138–1146. [Google Scholar]
- Liu, B.; Xu, S.B.; Zhao, H.C.; He, J.S. Analytic Hierarchy Process-A Tool for Planning Decision. Syst. Eng. 1984, 2, 23–30. [Google Scholar]
- Lin, H.Y. Study on Risk Assessment Model and Freezing Disposal Measures of Mud Cake on Shield Cutterhead in Soft Soil Layer. Master’s Thesis, Nanjing Tech University, Nanjing, China, 2023. [Google Scholar]
- Li, B.; Bao, Z. Key construction technology of Sanyang Road Cross-river Tunnel of Wuhan Rail Transit Line 7. Tunn. Constr. (Engl. Chin.) 2019, 39, 820–831. [Google Scholar]
- Zhou, W.B.; Wu, H.M.; Zhao, J. Tunneling strategy and analysis of normal pressure cutter head shield in mudstone stratum. Mod. Tunn. Technol. 2019, 56, 8–15. [Google Scholar]
- Cui, H. Study on Cutter Head Blocking of Shield Machine in Composite Stratum Considering the Mud Effect of the Cutter Head. Master’s Thesis, Zhengzhou University, Zhengzhou, China, 2023. [Google Scholar]
- Cheng, C.H.; Liao, S.M.; Cheng, L.S.; Zhou, Z.C. Comparative study on the suitability of EPB machine in typical sandy cobble ground in China. Transp. Res. Congr. 2016, 2018, 590–603. [Google Scholar]
- Shi, L.L.; Guo, C.X.; Su, R.; Jiang, X.Q.; Lu, C.G. Risk analysis of lake-crossing of earth pressure balance shield tunnel of Beijing Metro Line 14. Mun. Eng. Technol. 2015, 2, 94–96. [Google Scholar]
- Li, X.G.; Yang, Y.; Li, X.C.; Liu, H.Z. Criteria for cutting head clogging occurrence during slurry shield tunneling. Appl. Sci. 2022, 12, 1001. [Google Scholar] [CrossRef]
- Zhao, L.G.; Chen, Y.J.; Liu, F.Z. Development. Analysis and Research on Tool Layout of Composite Shield. Mod. Tunn. Technol. 2012, 49, 32–37. [Google Scholar]
- Liu, G.Q.; Zhang, B.; Zhu, H.B.; Wang, S.Y. Study on the characteristics of shield tunneling parameters and their correlation with slag state. Constr. Technol. (Engl. Chin.) 2023, 52, 71–77, 102. [Google Scholar]
Disclaimer/Publisher’s Note: The statements, opinions and data contained in all publications are solely those of the individual author(s) and contributor(s) and not of MDPI and/or the editor(s). MDPI and/or the editor(s) disclaim responsibility for any injury to people or property resulting from any ideas, methods, instructions or products referred to in the content. |
© 2025 by the authors. Licensee MDPI, Basel, Switzerland. This article is an open access article distributed under the terms and conditions of the Creative Commons Attribution (CC BY) license (https://creativecommons.org/licenses/by/4.0/).