Abstract
Under the “dual carbon” goals, enhancing the energy supply for communication base stations is crucial for energy conservation and emission reduction. An individual base station with wind/photovoltaic (PV)/storage system exhibits limited scalability, resulting in poor economy and reliability. To address this, a collaborative power supply scheme for communication base station group is proposed. This paper establishes a capacity optimization configuration model for such integrated system and introduces a hybrid solution methodology combining random scenario analysis, Nondominated Sorting Genetic Algorithm II (NSGA-II), and Generalized Power Mean (GPM). Typical scenarios are solved using NSGA-II to generate a candidate solution set, which is then refined under operational constraints. The GPM method is applied to determine the final configuration by accounting for attribute correlations. A case study on a Chinese base station group, considering uncertainties in renewable generation, demonstrates the feasibility and effectiveness of the proposed approach.
1. Introduction
With a large number of communication base stations and high-power consumption, the communication industry is facing severe pressure of energy conservation and emission reduction in the context of “dual carbon”. At the same time, in some remote areas without grid coverage such as plateaus and islands far from the inland, the power supply of communication base stations usually uses diesel engines for power generation. In recent years, wind turbines or photovoltaic cells have also emerged as options for power supply. However, these existing single power supply methods have problems such as low reliability, poor economic benefits, and environmental pollution. Therefore, more research and energy need to be invested in the power supply system of communication base stations.
The structure of wind/PV/storage power supply system for a single communication base station is relatively simple, and its economy and reliability are relatively low. With the development of wind and photovoltaic technology, research related to communication base station group has begun to attract widespread attention. The wind/PV/storage power supply system for communication base station groups can not only effectively integrate wind and photovoltaic power but also achieve energy scheduling and mutual assistance among various wind/PV/storage power supply systems within the group, enhancing the reliability of power supply between each other. Balakrishnan [1] put forward a strategy to enhance the temporal energy utilization of the network. This strategy leverages the identified imbalances through a cooperative energy-sharing mechanism among base stations. Xu et al. [2] utilized a multi-point collaborative smart grid architecture, taking into account the communication energy needs of 5G base stations and the bidirectional energy trading between distributed renewable energy and the grid. Through this strategy, the aim is to improve overall energy utilization efficiency and achieve more sustainable and efficient energy management. Israr et al. [3] pointed out that most of the research on energy cooperation and sharing between base stations includes LTE macro stations. Due to high installation costs, resistive power losses, and other factors, it is not possible to connect base stations over long distances by installing physical power lines. Physical power lines are suitable for energy sharing between base stations in small areas. Tahsin et al. [4] presented an optimal energy cooperation framework for the base stations and formulated it as a multi-objective linear programming problem. Ma et al. [5] considered a multi-base station cooperative system composed of 5G acer stations as the research object and optimized the power and capacity of energy storage configuration.
The wind/PV/storage power supply system for communication base station group is a large-scale and structurally complex system, and capacity optimization configuration directly affects the system performance. Wind and solar energy are influenced by factors such as climate and geographical location and have characteristics such as randomness, volatility, and intermittency, which can affect the stability and reliability of wind/PV/storage power supply system for communication base station group. Therefore, when optimizing capacity configuration, it is necessary to consider the uncertainty of wind and photovoltaic power output. The optimization methods for considering uncertainty mainly include scenario analysis method [6,7,8], stochastic programming [9,10,11], fuzzy programming [12,13], robust optimization [14], interval optimization [15,16,17], etc. The wind and photovoltaic power output have typical seasonality, so the scenario analysis method is suitable for optimizing the capacity configuration of wind/PV/storage power supply system for communication base station group considering the uncertainty of wind and photovoltaic power output. This method is supported by the law of large numbers and achieves coverage of uncertain factor values by traversing a large amount of scene data. Bai [18] established probability density functions for wind power output and photovoltaic output using kernel density estimation method, and based on this, fitted the joint probability density function for wind and photovoltaic power output using Copula basis function. Then, multiple sets of scene data were generated through sampling and clustering, which were then used for the optimization configuration problem of multi-energy complementary microgrid systems. Xue [19] studied the capacity optimization configuration problem of grid-connected microgrid based on multiple sets of scenario data. The process of generating scenario data was as follows: Latin hypercube sampling technology was used to extract N sets of wind power output power data and N sets of photovoltaic output power data, and the two sampling data were all coupled into N2 sets of data. Synchronous backpropagation reduction technology was used to screen out typical scenario data. Bai [20] established a stochastic optimization model for the location and capacity determination of distributed power sources in distribution networks. The stochastic optimization model was transformed into a deterministic optimization problem through approximation and then optimized under multiple sets of scenario data constructed.
Generally, multi-objective optimization is used to solve capacity-optimization configuration problems. For single objective optimization, the optimal solution is often obtained, while for multi-objective optimization problems, there may be conflicts between objectives, and the optimal solution is often not obtained [21]. For multi-objective optimization, the following methods are generally used [21].
- Transforming multi-objective optimization problems into single objective optimization problems to solve. Li et al. [22] added up the economic cost, environmental conversion cost, and active network loss cost of microgrid as the optimization objective. Zhao et al. [23] established a multi-objective optimization model for independent microgrid capacity allocation and proposed a comprehensive analysis method of weight coefficients by combining fitness deviation sorting method and fuzzy analytic hierarchy process. This type of method requires a reasonable conversion of non-economic objectives into economic objectives. The rationality of the conversion directly affects the objective function and the optimization of capacity allocation results. Therefore, there is a high requirement for the rationality of the conversion and there is currently no unified conversion method [21].
- Utilizing multi-objective optimization algorithms to simultaneously optimize multiple objectives. Li et al. [24] optimized the model with the goal of minimizing costs, minimizing emissions, and minimizing risks simultaneously, and obtained optimization results. This method avoids the economic conversion problem of converting multiple objectives into single objectives, but at the same time, all objectives are considered equally important, failing to fully consider the objective fact that the importance of each objective is different [21].
- Using multi-objective optimization algorithms to obtain a set of candidate solutions and then using Multi-Attribute Decision-Making (MADM) theory [25,26,27,28] to rank the solutions in the set of candidate solutions, selecting the most suitable solution. Li et al. [21] set multiple optimization goals, including minimizing the operating cost, maximizing user satisfaction with electricity consumption, minimizing pollution emissions, maximizing power supply reliability, and minimizing the total amount of charging and discharging of batteries. Firstly, the NSGA-II algorithm was used to optimize the two main objective functions of operating cost and user electricity satisfaction, and a candidate set was obtained. In order to determine the final solution, the objective function values were evaluated, corresponding to each candidate solution. By adopting this method, it not only avoids the economic conversion problem of converting multiple objectives into single objectives but also takes into account the objective fact that different objectives have different levels of importance [21].
After solving the capacity optimal configuration model of the wind/PV/storage power supply system for communication base station group, a Pareto solution set is obtained, and a MADM method needs to be adopted to finally determine the capacity configuration scheme. There exist certain correlation relationships among the objective functions of the aforementioned model. Specifically, correlations are generally observed between economic efficiency and pollutant emission level, as well as between economic efficiency and loss of power supply probability (LPSP). Typically, a reduction in system pollutant emissions requires a higher penetration of renewable energy, which in turn improves reliability but compromises economic efficiency. For MADM problems where such correlations exist between attribute values, the inter-attribute correlations must be taken into account during the decision-making process. In addition to considering the correlation between attributes, it is also necessary to consider the overall decision-making process and the risk preferences of decision-makers. Traditional MADM methods (e.g., Technique for Order Preference by Similarity to an Ideal Solution (TOPSIS) and VlseKriterijumska Optimizacija I Kompromisno Resenje (VIKOR)) usually assume that attributes are mutually independent. However, the GPM operator [29] combines the power mean (PM) operator [30] and Heronian mean operator [31,32,33,34,35,36], which has the properties of the PM operator and Heronian operator. It can reflect the overall decision, the correlation between attributes, and the risk preference of decision-makers. Therefore, the adoption of the GPM operator is more in line with actual decision-making requirements.
The rest of this paper is organized as follows: in Section 2, the power generation model for each equipment of the system is determined, and the objective functions and constraint conditions for capacity optimization configuration are given. In Section 3, a solution method for the capacity optimization configuration model is provided. Section 4 presents the background data for the example analysis and the scene generation results. Section 5 presents the capacity optimization configuration results. In Section 6, we discuss the method comparison and sensitivity analysis. Finally, the conclusion of this paper is presented in Section 7.
2. Optimization Model
This section constructs a mathematical model for the capacity optimization configuration of wind/PV/storage system for communication base station group. Firstly, Section 2.1 describes the mathematical models of the key equipment. Then, Section 2.2 presents the objective functions, and Section 2.3 presents the constraints of the model. Finally, Section 2.4 presents the multi-objective optimization model.
2.1. Power Generation Model for Each Equipment
2.1.1. Photovoltaic Power Generation Model
The output power of photovoltaic power generation is affected by different solar irradiance intensities and environmental temperature changes, and it can be expressed as [37]:
where
is the rated output power of the photovoltaic array under standard conditions in kilowatts;
is the solar irradiance under standard conditions, with a value of 1 KW/m2;
is the actual solar irradiance at time t; K is the power temperature coefficient, with a value of −0.0043 °C;
is the working point temperature at time t; and
is the temperature under standard conditions, with a value of 25 °C.
2.1.2. Wind Power Output Model
The relationship between the output power of wind turbine and wind speed can be approximated as [38]:
where
is the rated power of wind;
is the actual wind speed;
is the cut in wind speed;
is the cut out wind speed; and
is the rated wind speed.
2.1.3. Energy Storage
This paper chooses lithium batteries as energy storage batteries. Due to frequent charging or discharging of batteries, the state of charge (SOC) of the battery is constantly changing. To avoid overcharging or discharging, it is necessary to measure or estimate the battery SOC during the charging and discharging process. Based on the power and SOC of the battery at time t − 1, SOC at time t can be calculated using the following formula:
where
is SOC of the i-th base station at time t − 1;
is SOC of the i-th base station energy storage at time t;
is the power stored by the i-th base station at time t;
is the rated capacity of the i-th base station battery; and
is the time interval.
2.1.4. The Load Model of Communication Base Station Group
The load of communication base stations mainly includes direct current (DC) load and alternating current (AC) load. The AC load mainly includes air conditioning equipment and lighting equipment, while the DC load mainly includes base station wireless main equipment, transmission equipment, and other main equipment. The AC load power consumption of the communication load is relatively stable and will not be affected by the access and usage behavior of the base station users, which can be regarded as the static power consumption of the base station. The power consumption of the wireless master device of the base station will vary greatly with the changes in user access and usage behavior, also known as the dynamic power consumption of the base station [39].
The typical energy consumption of base station is represented by Formula (4) as follows:
where
is the base station energy consumption;
is the static power consumption; and
is the dynamic power consumption.
2.1.5. Diesel Generator Model
When encountering continuous rainy weather, insufficient wind and solar energy resources and the energy storage power cannot meet the load power requirements of the base station, diesel generators can be used as backup power sources. The hourly fuel consumption cost of diesel generator can be calculated using the following formula [40]:
where
is the fuel price and
,
are the coefficients of the power generation cost curve.
2.2. Objective Functions
This paper selects reliability, economy, environmental protection, and social benefit as optimization objectives. The communication base station group studied in this paper contains n base stations, where
is the number of photovoltaic modules in the i-th base station;
is the number of wind turbines in the i-th base station;
is the number of batteries in the i-th base station; and
,
, and
are used as optimization variables.
2.2.1. Reliability
LPSP is often used to represent the power supply reliability of a system, which is directly related to the reliable operation of communication base station groups. It is defined as the power deficit of the system divided by the total power requirement of the load during the evaluation period. It can be represented by Formula (6):
where T is the time period; n is the number of base stations in the base station group;
is the load of the i-th base station in the base station group at time t; and
is the total power outage of the base station group at time t.
2.2.2. Economy
The economy of this paper refers to the total cost of the system, including the initial investment cost of photovoltaic arrays, wind turbines, lithium batteries, operating and maintenance costs within the design period (Y), equipment replacement costs, and fuel costs consumed by diesel generators. Formula (7) is used to calculate the total cost:
where
is the total cost of the system;
is the initial investment cost;
is the cost of operation and maintenance;
is the cost of equipment replacement; and
is the fuel cost consumed by the diesel generator.
- The initial investment cost of equipment such as photovoltaic arrays, wind turbines, and lithium batteries is expressed using Formula (8), and installation cost is included in the purchase cost.where is the purchase price of photovoltaic equipment; is the purchase price of wind turbine equipment; is the purchase price of wind turbine installation tower; and is the purchase price of lithium battery.
- The operation and maintenance costs of photovoltaic arrays, wind turbines, and lithium batteries within the design period are expressed using Formula (9).where is the annual maintenance cost of photovoltaic arrays; is the annual maintenance cost of wind turbines; is the annual maintenance cost of installing the tower; is the annual maintenance cost of the battery; and is the number of replacements within the design year Y.
- The replacement cost of lithium batteries within the design period is expressed using Formula (10).where is the number of replacements within the design year Y and is the purchase price of lithium battery.
- The fuel cost consumed by diesel generators within the design period is expressed using Formula (11).
After merging the above costs, the economic cost obtained is expressed as Formula (12):
2.2.3. Environmental Friendliness
Diesel is the main fuel for oil generators, and its pollutants include CO, CO2, unburned hydrocarbons, sulfides, and nitric oxide in the fuel. Considering environmental friendliness means reducing the emissions of these polluting gases, i.e., minimizing pollution emissions. The emission of pollutants is directly related to fuel consumption. The annual emission level is equal to the annual fuel consumption multiplied by its gas emission coefficient [41].
where
is the emission coefficient of pollutant CO2;
is the emission coefficient of pollutant CO;
is the emission coefficient of pollutant HC;
is the emission coefficient of pollutant NO;
is the emission coefficient of pollutant S; and
is the average annual fuel consumption of diesel generator. According to reference [41], this paper assumes
2.2.4. Social Benefit
The social benefit can be represented by Formula (14).
where
is curtailment power of the wind and photovoltaics at time t;
is the output power of the wind turbines in the i-th base station at time t; and
is the output power of the photovoltaic arrays in the i-th base station at time t.
2.3. Constraints
In capacity optimization configuration, in addition to considering the objective functions, it is also necessary to consider the constraints in actual operation. When constructing a communication base station, it is generally self-built on leased land, so there will be certain constraints on the leased area, reflected in the constraints on the number of equipment installed. In addition to considering the constraints on the number of equipment installed, power balance, battery charging and discharging, power constraints on the interconnection line, and constraints on the backup time of communication base stations should also be considered.
2.3.1. Equipment Installation Quantity Constraints
The construction land for communication base station planning is limited and it is necessary to constrain the amount of equipment in the wind/PV/storage power supply system based on the site occupied by the base station. Wind turbines and photovoltaic arrays should avoid obstacles such as buildings and trees. The battery pack is usually placed together with communication equipment in the communication base station room, and the photovoltaic battery pack can be installed on the tower or room roof depending on the load-bearing situation of the tower and room roof. Considering that the nighttime photovoltaic system cannot provide electricity, it mainly relies on wind turbines to maintain the power required by the load. Therefore, wind turbines should be able to at least meet the average power demand of the load. Similarly, during the day, if there is weak or no wind, the photovoltaic system should be able to meet at least the average power demand of the load. Considering the possible situation of no wind and no light, the battery system provides the required power supply for the load. The constraint conditions are represented by Formula (15).
where
is the maximum number of photovoltaic modules for base station i;
is the maximum number of wind turbine components for base station i; and
is the maximum number of batteries in base station i.
2.3.2. Power Balance Constraints
For any time t, wind/PV/storage power supply system for communication base station group must ensure power balance and meet Formula (16).
2.3.3. Battery Charging and Discharging Constraints
For any time t, the
of the battery pack needs to satisfy Formula (17):
For any time t, the charging and discharging power of the battery pack needs to meet Formula (18):
where
is the charging power of the battery pack of the i-th base station at time t and
is the discharge power of the battery pack at the i-th base station at time t.
2.3.4. Power Constraints of Interconnection Lines
The wind/PV/storage power supply system for communication base station group achieves power interconnection through interconnection lines, and the power through interconnection lines cannot exceed its maximum power limit. The constraint conditions are Formula (19):
where
is the exchange power of the base station group through the contact line at time t and
is the maximum power limit.
2.3.5. Constraints on Backup Power Duration for Communication Base Stations
The main difference between base station energy storage and other ordinary user side energy storage is needed to ensure the backup power demand of the base station. This paper sets a communication base station backup power duration requirement of 6 h.
2.4. Construction of Multi-Objective Optimization Model
Establish a multi-objective optimization model based on the weights of the objective functions. After selecting the most important economic cost and LPSP objective functions with minimal weight difference to obtain the Pareto solution set, the MADM is used to determine the final solution. The multi-objective optimization model for capacity optimization configuration is constructed as follows:
Objective functions:
Constraints:
3. Random Scene Technology-NSGA-II-GPM Capacity Optimization Configuration Model Solving Method
In order to obtain the final capacity optimization configuration result, this paper presents a model solving method. The detailed steps are as follows.
- Firstly, wind energy resources are divided into the following three categories: winter, summer, and transitional seasons. In each category, probability density curves are fitted based on historical data to obtain the 24 h wind speed probability distribution for the three categories of scenarios. For solar energy resources, there are three major categories of scenarios: winter, summer, and transitional season. In each category, probability density curves are fitted based on historical data to obtain the probability distribution of 24 h radiation in the three major categories of scenarios.
- Based on the above results, Latin hypercube sampling and backward subtraction methods are used to obtain typical day data for wind turbine and photovoltaic output in winter, summer, and transitional seasons. Input data are related to wind turbines, photovoltaic panels, batteries, and other equipment. According to the area occupied by the base station, the available area in the room, the occupied area of each device, and the requirements for battery backup time set constraints on the number of devices.
- Using three types of scenario data and historical data, calculate the two objective functions of cost and LPSP. Using random scene technology for optimization calculation, the historical data are first used for optimization calculation, and then the generated scene data are read step by step. The NSGA-II algorithm is used to repeat the calculation for four rounds, and each round of calculation is constrained by the results of the previous round. Due to the fact that this paper directly calculates the multi-objective optimization model, the constrains added during the iteration are as follows: in the new round of calculation, the solution set obtained from the previous round is used as the non-dominated solution set for this round of optimization, and it meets the constraints of all scenario data. The added constraints in this round may cause the configuration scheme to lose its optimality for the already calculated scenario, but it effectively addresses the uncertainty of the scenario and increases the robustness of the optimized configuration scheme. Obtain the optimal solution set , where represents the i-th capacity allocation scheme.
- Take the four objective functions of economy, reliability, environmental protection, and social benefit as the attribute set , where = economy, = reliability, = environmental protection, and = social benefit. The attribute weight vector . Obtain the attribute value of solution under attribute through the obtained solution set, and obtain the decision matrix .
- Normalize decision matrix to obtain decision matrix .
- Using the binary form of GWHM operator, which is called GPM operator, the attribute values in the i-th row of the decision matrix are aggregated to obtain the comprehensive attribute values of decision scheme .
- Sort the options using comprehensive attribute values to obtain the final decision result.
The flowchart of random scene technology-NSGA-II-GPM solving method is shown in Figure 1.
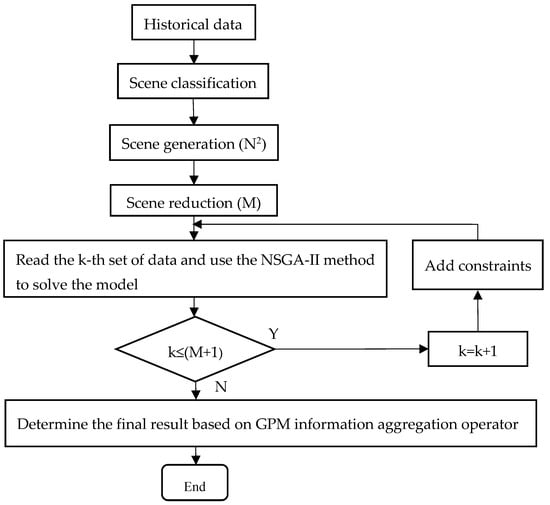
Figure 1.
Solving method flowchart.
4. Example Analysis
4.1. Background Data
Taking communication base station group in China as an example, the communication base stations adopt a cellular network, so the communication base station group is composed of seven adjacent base stations in this paper. The load of each base station consists of DC equipment and AC equipment. The total load of each base station is shown in Figure 2. The wind speed data are shown in Figure 3, and the wind turbine power can be calculated using Formula (2). The solar irradiance data are shown in Figure 4, and the temperature data are shown in Figure 5. The solar cell power can be calculated using Formula (1). The design period is 20 years, and the estimated service life of the battery is 5 years, so the replacement frequency is three. Then,
takes 0.1,
takes 0.9. Each station adopts one diesel generator with a rated power of 10 KW, and the diesel price is 8 yuan/liter. The parameters and costs of wind turbines are shown in Table 1, photovoltaic arrays parameters and costs are shown in Table 2, and battery parameters and costs are shown in Table 3. The analysis is conducted on a computer equipped with an Intel Core i5-4260U CPU (1.40 GHz) and 8 GB of RAM, utilizing MATLAB R2016a.
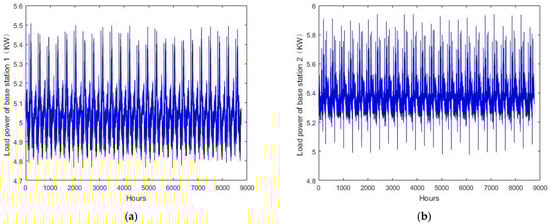
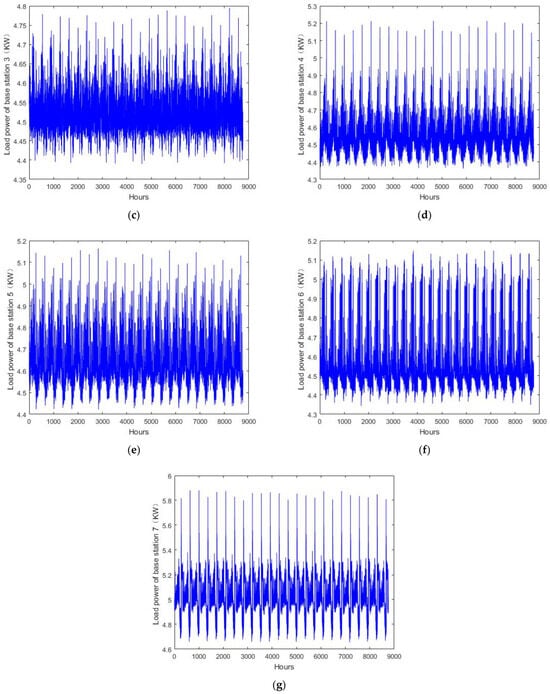
Figure 2.
Load power of each base station. (a) Load power of base station 1. (b) Load power of base station 2. (c) Load power of base station 3. (d) Load power of base station 4. (e) Load power of base station 5. (f) Load power of base station 6. (g) Load power of base station 7.
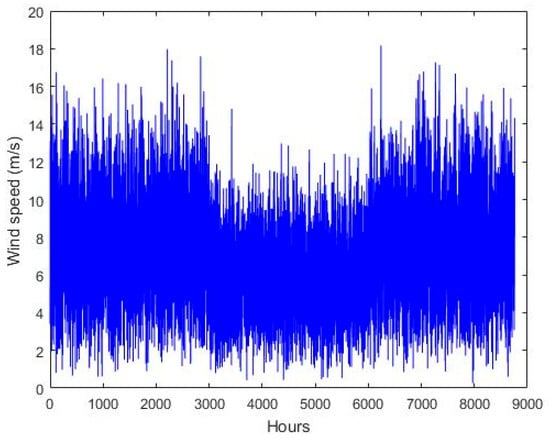
Figure 3.
Wind speed data.
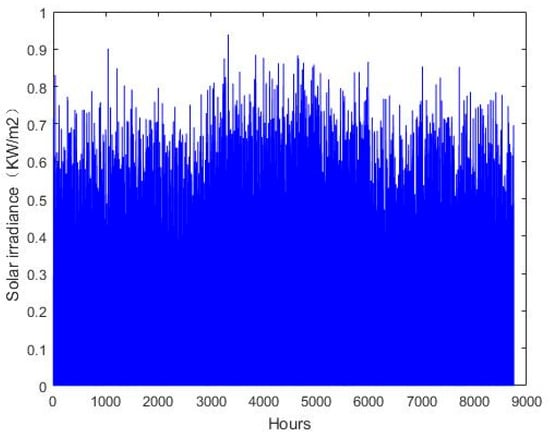
Figure 4.
Solar irradiance data.
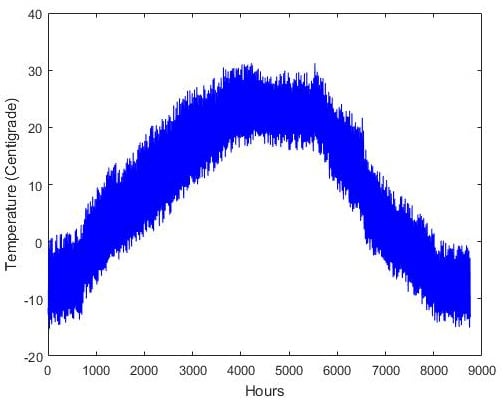
Figure 5.
Temperature data.

Table 1.
Wind turbine parameters.
Table 2.
Photovoltaic arrays parameters.
Table 3.
Battery parameters.
4.2. Scene Generation Results
Based on 8760 h of historical data, the probability density and cumulative probability distribution of winter, transitional season, and summer wind speeds are obtained using mean and variance estimation methods, as shown in Figure 6, where (0–23) represents the time from 0 to 23 o’clock in a day. Similarly, the probability density and cumulative probability distribution of winter, transitional season, and summer irradiance are obtained, as shown in Figure 7, where (7–17) represents the time from 7 to 17 o’clock in a day.
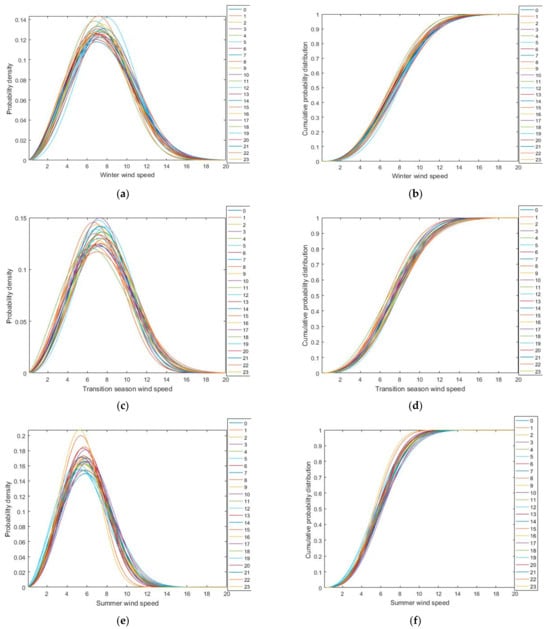
Figure 6.
Probability density and cumulative probability distribution of wind speed. (a) Probability density of winter wind speed. (b) Cumulative probability distribution of winter wind speed. (c) Probability density of wind speed during transition season. (d) Cumulative probability distribution of wind speed during transition season. (e) Probability density of summer wind speed. (f) Cumulative probability distribution of summer wind speed.
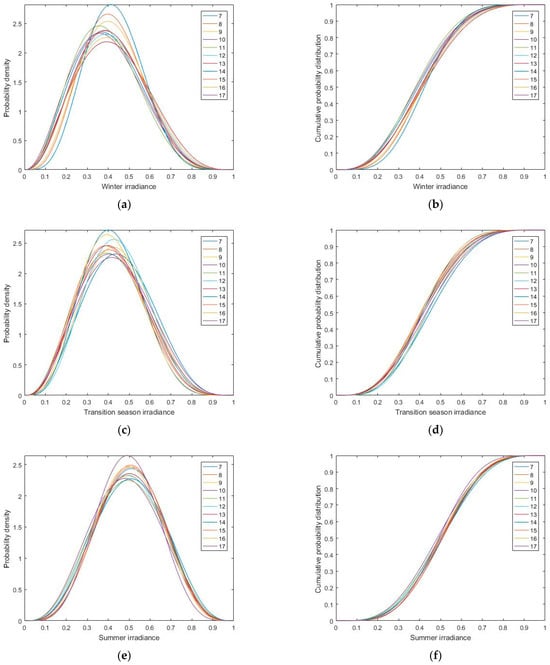
Figure 7.
Probability density and cumulative probability distribution of irradiance. (a) Probability density of winter irradiance. (b) Cumulative probability distribution of winter irradiance. (c) Probability density of transition season irradiance. (d) Cumulative probability distribution of transition season irradiance. (e) Probability density of summer irradiance. (f) Cumulative probability distribution of summer irradiance.
Based on the cumulative probability distribution results obtained above, Latin hypercube sampling method is used for sampling, with a single sample size of 1000. Then, the backward subtraction method is used for scene reduction, generating typical daily scenes for winter, summer, and transitional seasons based on wind speed, as shown in Figure 8. Similarly, typical daily scenarios for winter, summer, and transitional seasons are generated for irradiance, as shown in Figure 9.
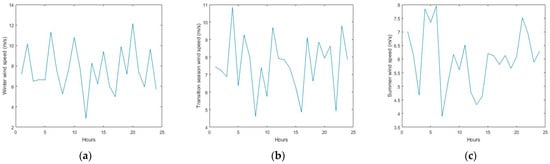
Figure 8.
Typical scene generation results for wind speed. (a) Winter wind speed. (b) Transition season wind speed. (c) Summer wind speed.
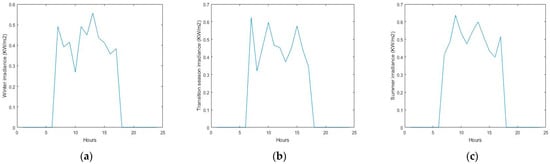
Figure 9.
Typical scene generation results of irradiance. (a) Winter irradiance. (b) Transition season irradiance. (c) Summer irradiance.
5. Results
Based on the scenario generation results in Section 4, this section presents the capacity optimization configuration results. Input the photovoltaic arrays, wind turbines, batteries, and base station load data of seven communication base stations into the program, set constraints, and obtain two objective functions of economic cost and LPSP. Using random scene technology and NSGA-II to solve the model, the Pareto solution set is ultimately obtained, as shown in Figure 10. The parameter values of the NSGA-II algorithm are as follows: the initial population size is 100, the number of iterations is 100, the crossover algorithm selects simulated binary crossover, the mutation algorithm selects polynomial mutation, the crossover probability is 0.9, and the mutation probability is 0.05.
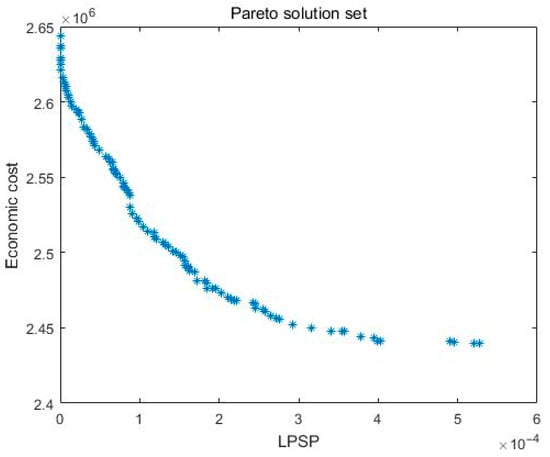
Figure 10.
Pareto solution set.
Figure 11 illustrates the variation tendency of the two objective function values—LPSP and economic cost—with the number of generations during the NSGA-II algorithm-based optimization process. After 100 generations, the optimization process stabilizes, and the optimal Pareto solution set is reached.
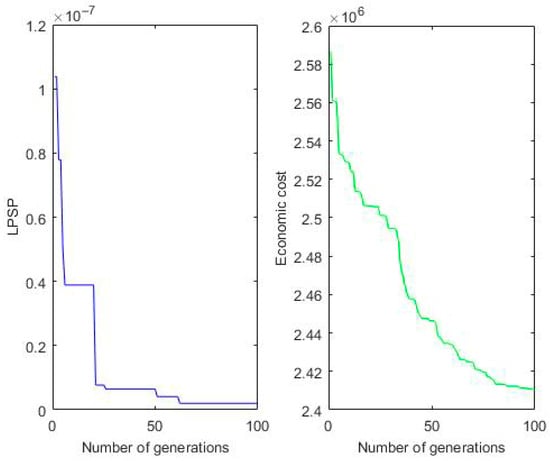
Figure 11.
Number of generations.
Round the obtained Pareto solution set to obtain the capacity configuration of wind turbines, photovoltaic arrays, and batteries for eight candidate schemes (
) to each base station, as shown in Table 4. Among them, PV n represents the number of photovoltaic arrays configured in the n-th base station (unit: blocks), WT n represents the number of wind turbines configured in the nth base station (unit: units), and BR n represents the number of batteries configured in the nth base station (unit: blocks).
Table 4.
Candidate solutions set.
Select the objective function of the candidate scheme (
,
reliability,
, and
social benefit) as the attributes, set the weight of attribute values to
, and use the GPM operator to aggregate the attribute values to determine the final scheme. The objective function values can be obtained from the amount of equipment in each scheme, and the decision matrix is detailed in Table 5.
Table 5.
Decision matrix.
Perform normalization processing to obtain a standardized decision matrix, as shown in Table 6.
Table 6.
Standardized decision matrix.
Use the GPM operator (
) to aggregate the attribute values in the i-th row of the decision matrix. The comprehensive attribute values of each scheme are obtained as follows:
By sorting the eight options,
, the optimal solution is
. In this example, when the parameters
in the GPM,
is adopted as the optimal capacity configuration scheme of wind/PV/storage power supply system for communication base station group.
6. Discussion
6.1. Methods Comparison
In this section, the GPM information aggregation operator is compared with existing weighted arithmetic average (WAA), weighted geometric average (WGA), and ordered weighted average (OWA) operators using the example data from this paper. Use these operators to aggregate the attribute values of eight candidate schemes for the wind/PV/storage power supply system in the communication base station group, obtain the comprehensive attribute values of each scheme, and then sort the schemes. The comparison results are shown in Table 7.
Table 7.
Comparison results.
As can be seen from Table 7, when p = q = 1, the comprehensive attribute values obtained by the GPM operator are consistent with those derived from the WAA operator-based method. This indicates that the method based on GPM operator is equivalent to the WAA operator-based method under this parameter setting. The optimal scheme determined by the WAA operator, WGA operator, and OWA operator is all scheme 4, which verifies the rationality and feasibility of the GPM method.
When
, the ranking results obtained by the GPM operator differ from those of other operators. Since the GPM operator takes into account the correlations between attributes, the ranking results of the method vary with different values of parameters
and
. This demonstrates that the method possesses certain flexibility and a broader scope of application.
6.2. Sensitivity Analysis of Key Parameters
When the parameters
and
take different values, the comprehensive attribute values of each capacity configuration scheme obtained are different. The parameters
and
take different values, and the GPM operator is used to calculate the corresponding comprehensive attribute values for each scheme. Then, the schemes are sorted based on the comprehensive attribute values, and the results are shown in Table 8.
Table 8.
Comprehensive attribute values and ranking results of each scheme with different values of
and
From Table 8, it can be seen that when the parameters p and q take different values, the ranking results of the schemes are not exactly the same, and the best scheme is
or
. In
, the cost, LPSP, environmental friendliness, and social benefit are all moderate. In
, LPSP is the lowest and environmental friendliness is the best. In order to further discuss the impact of the values of parameters p and q on the capacity allocation results, the same values of parameters p and q are taken, and the corresponding comprehensive attribute values for each scheme are calculated using the GPM operator. Then, sort the schemes based on the comprehensive attribute values. The results are shown in Table 9.
Table 9.
Comprehensive attribute values and ranking results of each scheme with same values of
and
From Table 9, it can be seen that when
and
take the same values, as the values of
and
increase, the comprehensive attribute values of each scheme also increase, indicating that the method is flexible. Decision-makers can choose parameters based on their own risk preferences. Pessimistic decision-makers can choose smaller parameters, while optimistic decision-makers can choose larger parameters.
When
and
takes values from 1 to 10, the comprehensive attribute values of each scheme obtained are shown in Figure 12a. When
and
takes values from 1 to 10, the comprehensive attribute values of each scheme obtained are shown in Figure 12b.
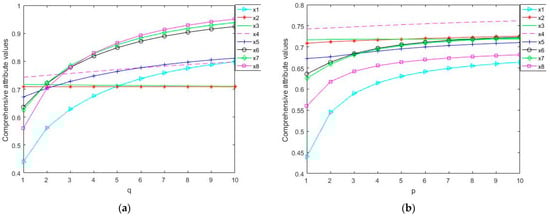
Figure 12.
Comprehensive attribute values of capacity configuration schemes. (a)
(b)
.
From Figure 12, it can be seen that the ranking results of the schemes are not fixed but vary with the variation in parameters. Additionally, as the parameters
and
increase, the comprehensive attribute values of each scheme also increase.
When
and
change, the comprehensive attribute values of each scheme change, as shown in Figure 13.
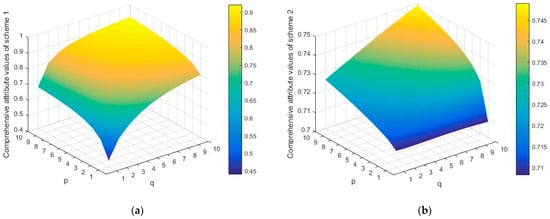
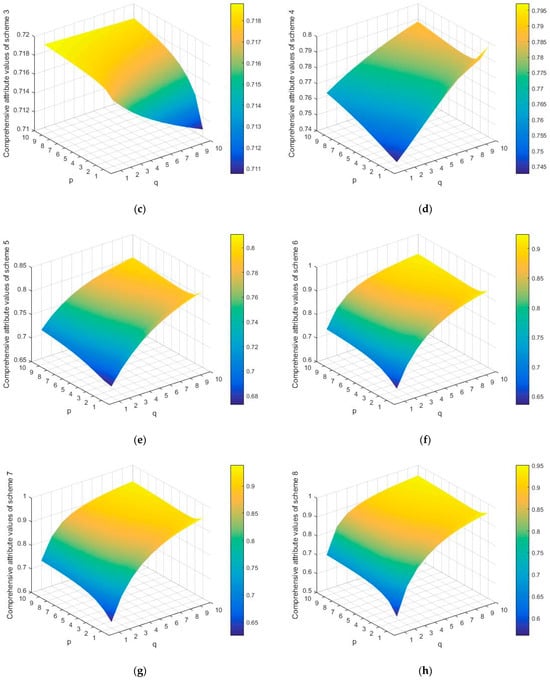
Figure 13.
Comprehensive attribute values of eight capacity configuration schemes. (a) Comprehensive attribute values of scheme 1. (b) Comprehensive attribute values of scheme 2. (c) Comprehensive attribute values of scheme 3. (d) Comprehensive attribute values of scheme 4. (e) Comprehensive attribute values of scheme 5. (f) Comprehensive attribute values of scheme 6. (g) Comprehensive attribute values of scheme 7. (h) Comprehensive attribute values of scheme 8.
In summary, it can be seen that as
and
change, the sorting scheme also changes. The best solution is
or
. From the standardized decision matrix, it can be seen that all indicators of
are in the moderate range;
is the most reliable and environmentally friendly option among several options. Therefore, the decision results are in line with the actual situation. In the decision-making process, decision-makers can choose appropriate parameters based on their risk preferences and determine the final capacity allocation scheme.
7. Conclusions
The reasonable capacity optimization configuration of wind/PV/storage power supply system for communication base station group is not only related to the power supply reliability of the system, but also to the economic, environmental, and social benefit of the system. The full utilization of the advantages of wind/PV/storage power supply system for communication base station group needs to be based on a reasonable capacity configuration of the system. The wind and solar power output have typical seasonality. This paper uses the multi-scene generation method to handle the uncertainty of wind and solar power and conducts capacity optimization configuration research based on the generation of wind and solar power output scenes. Firstly, through multi-scenario generation and reduction, typical scenarios are ultimately obtained to provide data support for subsequent research. Due to the large scale and complex structural relationships of the communication base station group wind-solar storage power supply system, there are many variables, objective functions, and constraint conditions involved in capacity-collaborative configuration. Therefore, the construction of and solution to configuration models are relatively complex. Single objective optimization problems may have optimal solutions, while for multi-objective optimization problems, there may be conflicts between objectives, so it is often not possible to obtain solutions that make all objectives optimal. To solve multi-objective optimization problems, multi-objective optimization algorithms can be used to obtain candidate solution sets, and then MADM theory can be used to rank the solutions in the candidate solution sets, selecting the most suitable solution. Therefore, this article takes economy, reliability, environmental protection, and social benefit as optimization objectives to establish objective functions and construct a capacity optimization configuration model of wind/PV/storage power supply system for communication base station group. Subsequently, research is conducted on the model solving methods. For typical scenarios, the NSGA-II multi-objective optimization algorithm is used to optimize the two important objectives of economy and reliability. While meeting the requirements of typical scenarios, the configuration scheme is gradually revised to obtain a candidate solution set. Then, the objective functions of economy, reliability, environmental protection, and social benefit are taken as attributes of MADM. Considering the certain correlation between the objective functions, the GPM operator is used to determine the final capacity allocation plan. Finally, the effectiveness of the model and solution method constructed in this paper is verified through numerical analysis.
This paper mainly focuses on the wind/PV/storage power supply system for communication base station group. Based on the current status of energy storage technologies, lithium-ion batteries are selected as the energy storage solution for this system. With the future development of new energy and energy storage technologies, research on the application of other new energy sources and energy storage technologies in communication base stations can be further carried out.
Author Contributions
Conceptualization, X.H.; Methodology, X.H.; Software, X.H. and Z.H.; Validation, X.H.; Writing—original draft, X.H.; Writing—review & editing, X.H., S.Y. and Z.H.; Supervision, S.Y.; Funding acquisition, X.H. and Z.H. All authors have read and agreed to the published version of the manuscript.
Funding
This study is supported by batch of project of Hebei Provincial Key Laboratory of Financial Technology Application, Hebei Finance University (No. 2024001, No. 2025004). This study is supported by the “Open bidding for selecting the best candidates” project of Hebei Finance University (No. JB2025011).
Institutional Review Board Statement
Not applicable.
Informed Consent Statement
Not applicable.
Data Availability Statement
The datasets presented in this article are not readily available because they involve sensitive operational data of communication base stations, which are not publicly shareable due to confidentiality restrictions. Requests to access the datasets should be directed to the corresponding author.
Conflicts of Interest
The authors declare that they have no conflict of interest.
Abbreviations
The following abbreviations are used in this manuscript:
| PV | Photovoltaic |
| NSGA-II | Nondominated Sorting Genetic Algorithm II |
| GPM | Generalized Power Mean |
| MADM | Multi-Attribute Decision-Making |
| LPSP | Loss of Power Supply Probability |
| TOPSIS | Technique for Order Preference by Similarity to an Ideal Solution |
| VIKOR | VlseKriterijumska Optimizacija I Kompromisno Resenje |
| SOC | State of Charge |
| DC | Direct Current |
| AC | Alternating Current |
| WAA | Weighted Arithmetic Average |
| WGA | Weighted Geometric Average |
| OWA | Ordered Weighted Average |
References
- Balakrishnan, A.; De, S.; Wang, L.C. Networked energy cooperation in dual powered green cellular networks. IEEE Trans. Commun. 2022, 70, 6977–6991. [Google Scholar] [CrossRef]
- Xu, J.; Zhang, R. Cooperative energy trading in CoMP systems powered by smart grids. IEEE Trans. Veh. Technol. 2016, 65, 2142–2153. [Google Scholar] [CrossRef]
- Israr, A.; Yang, Q.; Li, W.; Zomaya, A.Y. Renewable energy powered sustainable 5G network infrastructure: Opportunities, challenges and perspectives. J. Netw. Comput. Appl. 2021, 175, 102910. [Google Scholar] [CrossRef]
- Tahsin, A.; Roy, P.; Razzaque, M.A.; Rashid, M.O.; Siraj, M.; AlQahtani, S.A.; Hassan, R.; Hassan, M.M. Energy cooperation among sustainable base stations in multi-operator cellular networks. IEEE Access 2023, 11, 19405–19417. [Google Scholar] [CrossRef]
- Ma, X.; Duan, Y.; Meng, X.; Zhu, Q.; Wang, Z.; Zhu, S. Optimal configuration for photovoltaic storage system capacity in 5G base station microgrids. Glob. Energy Interconnect. 2021, 4, 465–475. [Google Scholar] [CrossRef]
- Kecskés, I.; Odry, P. Robust optimization of multi-scenario many-objective problems with auto-tuned utility function. Eng. Optim. 2021, 53, 1135–1155. [Google Scholar] [CrossRef]
- Shen, Z.; Wu, L.; Sedgh, S.A.; Radmehr, F. Optimal operation scheduling of a microgrid using a novel scenario-based robust approach. Eng. Optim. 2024, 56, 338–359. [Google Scholar] [CrossRef]
- Hu, J.; Cao, Y.; Tan, G. A dynamic spatiotemporal graph generative adversarial network for scenario generation of renewable energy with nonlinear dependence. Energy 2025, 335, 138049. [Google Scholar] [CrossRef]
- Wu, H.; Ke, D.; Xu, J.; Song, L.; Liao, S.; Zhang, P. Low-carbon economic dispatch of iron and steel industry empowered by wind-hydrogen energy: Modeling and stochastic programming. Appl. Energy 2025, 387, 125599. [Google Scholar] [CrossRef]
- Son, G.Y.; Acquah, A.M.; Kim, Y.S. Optimal hierarchical modeling of power to X stations through a chance constrained Two-Stage stochastic programming. Int. J. Electr. Power Energy Syst. 2024, 161, 110169. [Google Scholar] [CrossRef]
- Xie, S.; Zhang, J.; Shi, D.; Zhang, Q. Multi-energy scheduling study under uncertainties in iron and steel industry based on multi-objective two-stage robust optimization. Energy 2025, 338, 138798. [Google Scholar] [CrossRef]
- Bihari, R.; Jeevaraj, S.; Kumar, A. A new simplex algorithm for interval-valued Fermatean fuzzy Linear programming problems. Comput. Appl. Math. 2024, 44, 44. [Google Scholar] [CrossRef]
- Sun, X.Y.; Wu, H.; Guo, S.Q.; Zheng, L. Day-Ahead Optimal scheduling of integrated energy system based on type-II fuzzy interval chance-constrained programming. Energies 2022, 15, 6763. [Google Scholar] [CrossRef]
- Gao, Y.; Tahir, M.; Siano, P.; Hussain, S.; Sun, W.; He, Y.; Meng, Q. A bi-level hybrid game framework for stochastic robust optimization in multi-integrated energy microgrids. Sustain. Energy Grids Netw. 2025, 44, 102024. [Google Scholar] [CrossRef]
- Zeng, B.; Zhang, W.; Hu, P.; Sun, J.; Gong, D. Synergetic renewable generation allocation and 5G base station placement for decarbonizing development of power distribution system: A multi-objective interval evolutionary optimization approach. Appl. Energy 2023, 351, 121831. [Google Scholar] [CrossRef]
- Yao, Y.; Wang, L.; Yang, G.; Li, L.; Xu, F.; Al-Zahrani, A. An interval uncertainty optimization algorithm based on radial basis function network differentiation. Eng. Optim. 2024, 56, 896–918. [Google Scholar] [CrossRef]
- Patel, M.; Behera, J.; Kumar, P. Parametric approach for multi-objective enhanced interval linear fractional programming problem. Eng. Optim. 2024, 56, 740–765. [Google Scholar] [CrossRef]
- Bai, K.; Gu, J.; Peng, H.; Zhu, B. Optimal allocation for muti-energy complementary microgrid based on scenario generation of wind power and photovoltaic output. Autom. Electr. Power Syst. 2018, 42, 133–141. [Google Scholar]
- Xue, M.; Zhao, B.; Zhang, X.; Jiang, Q. Integrated plan and evaluation of Grid-connected Microgrid. Autom. Electr. Power Syst. 2015, 39, 6–13. [Google Scholar]
- Bai, X.; Zhao, Z.; Bao, H. DG planning based on CLRA algorithm with consideration of timing characteristics. Electr. Power Autom. Equip. 2016, 36, 14–22. [Google Scholar]
- Li, Y.; Tong, N. Multi-objective optimization of micro-grid operation based on multiple attribute decision making. Electr. Meas. Instrum. 2018, 55, 55–69. [Google Scholar]
- Li, P.; Xu, W.; Zhou, Z.; Li, R. Optimal operation of microgrid based on improved gravitational search algorithm. Proc. CSEE 2014, 34, 3073–3079. [Google Scholar]
- Zhao, N.; Wang, Z. Research of optimization configuration of independent microgrid based on ACPSO algorithm. High Volt. Appar. 2017, 53, 190–197. [Google Scholar]
- Li, C.; Zhang, J.; Li, P. Multi-objective optimization model of micro-grid operation considering cost, pollution discharge and risk. Proc. CSEE 2015, 35, 1051–1058. [Google Scholar]
- Jasińska, A.; Sydor, M. Integration of multi-criteria decision-making and dimensional entropy minimization in furniture design. Information 2025, 16, 692. [Google Scholar] [CrossRef]
- Krishnan, A.R.; Hamid, R.; Lin, R.Y.S.; Tanakinjal, G.H.; Rathakrishnan, B. Making informed decisions to improve restaurant image using a hybrid MADM approach: A case of fast-food restaurants in an island of east malaysia. Information 2022, 13, 219. [Google Scholar] [CrossRef]
- Hu, X.; Yang, S.; Zhu, Y.R. Multiple-attribute decision making based on interval-valued intuitionistic fuzzy generalized weighted Heronian mean. Information 2022, 13, 138. [Google Scholar] [CrossRef]
- Xie, J.; Hao, H. Trajectory prediction and decision optimization for UAV-assisted VEC networks: An integrated LSTM-TD3 framework. Information 2025, 16, 646. [Google Scholar] [CrossRef]
- Hu, X.; Yang, S.; Zhu, Y. Multiple Attribute Decision-Making Based on Three-Parameter Generalized Weighted Heronian Means. Mathematics 2021, 9, 1363. [Google Scholar] [CrossRef]
- Bullen, P.S. Handbook of Means and Their Inequalities; Springer: Dordrecht, The Netherlands, 2003. [Google Scholar]
- Shafiq, A.; Rasheed, W.M.; Habeeb, S.M.; Tasneem, R.; Shabbir, N.; Alameri, A. MAGDM for evaluating the role of computer science in education with PLq-ROF Heronian mean operators and maximizing deviation-MOORA methodology. Int. J. Comput. Intell. Syst. 2025, 18, 208. [Google Scholar] [CrossRef]
- Sarkar, A.; Moslem, S.; Esztergár-Kiss, D.; Akram, M.; Jin, L.; Senapati, T. A hybrid approach based on dual hesitant q-rung orthopair fuzzy Frank power partitioned Heronian mean aggregation operators for estimating sustainable urban transport solutions. Eng. Appl. Artif. Intell. 2023, 124, 106505. [Google Scholar] [CrossRef]
- Bilal, M.; Ali, J.; Tariq, F.M.; Hassan, M.M. Group decision-making framework using generalized Heronian mean operators in quasi rung orthopair fuzzy environment with applications. Sci. Rep. 2025, 15, 13153. [Google Scholar] [CrossRef] [PubMed]
- Kakati, P.; Senapati, T.; Moslem, S.; Pilla, F. Fermatean fuzzy Archimedean Heronian Mean-Based Model for estimating sustainable urban transport solutions. Eng. Appl. Artif. Intell. 2024, 127, 107349. [Google Scholar] [CrossRef]
- Rehman, U.U.; Mahmood, T. A study and performance evaluation of computer network under the environment of bipolar complex fuzzy partition Heronian mean operators. Adv. Eng. Softw. 2023, 180, 103443. [Google Scholar] [CrossRef]
- Kumar, K.; Chen, S.M. Group decision making based on advanced intuitionistic fuzzy weighted Heronian mean aggregation operator of intuitionistic fuzzy values. Inf. Sci. 2022, 601, 306–322. [Google Scholar] [CrossRef]
- Gao, F.; Yan, T.; Tang, W.; Zhang, X.; Zai, H.; Qiao, X. Multi-objective optimal capacity configuration of standalone wind-solar-battery hybrid microgrid. Smart Grid 2016, 4, 802–810. [Google Scholar]
- Wang, Y.; Wang, H.; Li, X.; Fang, H.; Wang, B. Summary of capacity allocation of microgrid hybrid energy storage system based on hydrogen energy storage. J. Guangxi Norm. Univ. (Nat. Sci. Ed.) 2022, 40, 18–36. [Google Scholar]
- Ma, X.F.; Meng, X.Y.; Zhu, Q.P.; Duan, Y.; Wang, Z. Control strategy of 5G base station energy storage considering communication load. Trans. China Electrotech. Soc. 2022, 37, 2878–2887. [Google Scholar]
- Farag, K.A.; Ahmed, E. Bi-objective economic feasibility of hybrid micro-grid systems with multiple fuel options for islanded areas in Egypt. Renew. Energy 2018, 128, 37–56. [Google Scholar]
- Guo, L.; Liu, W.; Jiao, B.; Wang, C. Multi-objective optimal planning design method for stand-alone microgrid system. Proc. CSEE 2014, 34, 524–536. [Google Scholar]
Disclaimer/Publisher’s Note: The statements, opinions and data contained in all publications are solely those of the individual author(s) and contributor(s) and not of MDPI and/or the editor(s). MDPI and/or the editor(s) disclaim responsibility for any injury to people or property resulting from any ideas, methods, instructions or products referred to in the content. |
© 2025 by the authors. Licensee MDPI, Basel, Switzerland. This article is an open access article distributed under the terms and conditions of the Creative Commons Attribution (CC BY) license.