Article

Research on Tongue Image Segmentation and Classification Methods Based on Deep Learning and Machine Learning

1
Institute of Microelectronics of the Chinese Academy of Sciences, Beijing 100029, China
2
School of Integrated Circuits, University of Chinese Academy of Sciences, Beijing 101408, China
*
Authors to whom correspondence should be addressed.
Information 2025, 16(5), 357; https://doi.org/10.3390/info16050357
Submission received: 21 February 2025 / Revised: 18 April 2025 / Accepted: 24 April 2025 / Published: 29 April 2025

Abstract

:
Tongue diagnosis is a crucial method in traditional Chinese medicine (TCM) for obtaining information about a patient’s health condition. In this study, we propose a tongue image segmentation method based on deep learning and a pixel-level tongue color classification method utilizing machine learning techniques such as support vector machine (SVM) and ridge regression. These two approaches together form a comprehensive framework that spans from tongue image acquisition to segmentation and analysis. This framework provides an objective and visualized representation of pixel-wise classification and proportion distribution within tongue images, effectively assisting TCM practitioners in diagnosing tongue conditions. It mitigates the reliance on subjective observations in traditional tongue diagnosis, reducing human bias and enhancing the objectivity of TCM diagnosis. The proposed framework consists of three main components: tongue image segmentation, pixel-wise classification, and tongue color classification. In the segmentation stage, we integrate the Segment Anything Model (SAM) into the overall segmentation network. This approach not only achieves an intersection over union (IoU) score above 0.95 across three tongue image datasets but also significantly reduces the labor-intensive annotation process required for training traditional segmentation models while improving the generalization capability of the segmentation model. For pixel-wise classification, we propose a lightweight pixel classification model based on SVM, achieving a classification accuracy of 92%. In the tongue color classification stage, we introduce a ridge regression model that classifies tongue color based on the proportion of different pixel categories. Using this method, the classification accuracy reaches 91.80%. The proposed approach enables accurate and efficient tongue image segmentation, provides an intuitive visualization of tongue color distribution, and objectively analyzes and quantifies the proportion of different tongue color categories. In the future, this framework holds potential for validation and optimization in clinical practice.

1. Introduction

Tongue diagnosis is a disease-state diagnostic method that has been inherited and developed in China for thousands of years. It is one of the key practices in clinical traditional Chinese medicine and has made significant contributions throughout history in combating diseases. Traditional tongue diagnosis relies on the experience and subjective judgment of TCM practitioners, leading to different interpretations of the same patient’s tongue features by different doctors. This subjectivity affects the consistency and accuracy of diagnosis. With the continuous development of artificial intelligence-related technologies, there is a growing market demand for intelligent tongue diagnosis devices. By leveraging technologies such as computer vision and machine learning, quantitative analysis of tongue features can be performed, improving the objectivity and repeatability of diagnosis and promoting the standardization of TCM diagnostics.
Tongue segmentation is a crucial step in the objective study of tongue diagnosis in TCM, and various methods have been proposed in academia to improve the accuracy and efficiency of tongue segmentation. Before the maturity of deep learning technology, research on tongue image segmentation mainly relied on traditional non-deep learning methods, including color thresholding, edge detection, active contour models, and region-growing and -merging methods. However, due to their inherent limitations, these traditional methods often rely on strict prior assumptions and require specific imaging conditions, limiting their generalization ability in complex scenarios. With the advancement of deep learning technology, various deep learning-based segmentation techniques have also been applied to the field of tongue feature segmentation. Jianghang Zhou et al. proposed an accurate and fast tongue segmentation system using a U-Net with a morphological processing layer [1]. Zonghai Huang et al. proposed a novel tongue segmentation method based on an improved U-Net [2]. Xinfeng Zhang et al. introduced an improved tongue image segmentation algorithm based on the Deeplabv3+ framework [3]. Xiaodong Huang et al. proposed TISNet, an enhanced fully convolutional network with an encoder–decoder structure [4]. While deep learning-based tongue segmentation algorithms outperform traditional methods in segmentation accuracy and robustness, training such models typically requires large amounts of high-quality labeled tongue images. However, high-quality annotation of tongue segmentation data is costly, and subjective differences among annotators can affect the model’s generalization ability. Therefore, this paper proposes a segmentation network SATM (Segment Any Tongue Model) based on SAM, specifically designed for tongue segmentation tasks. SATM improves the usage of SAM by eliminating the need for input prompts such as points or bounding boxes and avoiding the need for labeled datasets and training. It can be directly applied to tongue segmentation while maintaining good generalization performance. The experiments demonstrate that SATM performs well across multiple datasets.
Many diseases manifest specific characteristics on the tongue. For example, Naveed S et al. proposed a method for the early detection of diabetes based on tongue features [5]. Jiaming Chen identified tongue features associated with chronic kidney disease [6]. Hsieh Shu Feng et al. discovered the relationship between tongue color and the menstrual cycle in women. Thus, the analysis of tongue-related features has been a popular research topic [7]. Tongue feature analysis is generally divided into tongue body analysis and tongue coating analysis, with tongue color being the most critical aspect of tongue body analysis. Typically, tongue color is classified into five categories: pale white, light red, red, crimson, and purple-red. Different tongue colors can reflect various physiological and pathological states, hemorheology, and pathogen properties, serving as an essential basis for clinical diagnosis, medication guidance, efficacy evaluation, and prognosis analysis. Li Qingli et al. developed a push-broom hyperspectral tongue imaging system, discussed its spectral response calibration method, and proposed a spectrum-based tongue color analysis approach. However, this method requires specialized equipment and fails to achieve an accuracy rate above 90% [8]. Nur Diyana Kamarudin et al. used the HSV color thresholding method to identify and analyze the tongue body and tongue coating, demonstrating good separation of tongue body and tongue coating but poor performance in tongue body color classification [9]. Jinghong Ni et al. were the first to use CapsNet for tongue color research and proposed an improved model, TongueCaps, which combines the advantages of CapsNet and residual block structures. It achieves end-to-end tongue color classification and outperforms other models in terms of accuracy, specificity, sensitivity, computational complexity, and model size. However, the extracted tongue color-related features lack interpretability [10]. Tadaaki Kawanabe et al. applied the K-means clustering algorithm as a machine learning method to quantify tongue body and tongue coating color information. While this approach performs well in separating tongue coating and tongue body colors, it struggles with tongue body color classification [11]. Bob Zhang et al. proposed a deep learning-based medical tongue color analysis system, which classifies tongue color by calculating the ratio of each color in the entire image to form a tongue color feature vector and correlating tongue color with overall health. However, its accuracy is relatively low [12]. L.I.U. Wei et al. used their proposed TCCNet, achieving promising classification results for tongue color, but TCCNet still has a large number of parameters [13]. Bo Yan et al. introduced a two-step deep learning framework to improve tongue color classification performance [14]. However, neural networks, on one hand, require a large number of parameters and significant computational resources; on the other hand, they function as black-box models with poor interpretability, making it difficult to intuitively understand the classification basis.
This paper proposes a pixel-based classification method. First, 2 × 2 feature pixel blocks are sampled from images of pale white, light red, red, crimson, and purple-red tongues to construct a dataset of pixel data. Then, the SVM method is used to classify these pixels and obtain a pixel classification model. Subsequently, this pixel classification model is applied to classify, count, and visualize the pixels in tongue images from the test set, providing an intuitive reference for the objective evaluation of tongue diagnosis in TCM. In terms of tongue color classification, we innovatively use ridge regression to assign different weights to different pixels, simulating the human eye’s perception of various colors. This approach constructs a tongue color classification model based on different pixel proportion conditions. The proposed method demonstrates outstanding performance in terms of objectivity, visualization, and lightweight implementation, making it highly valuable for practical applications.

2. Materials and Methods

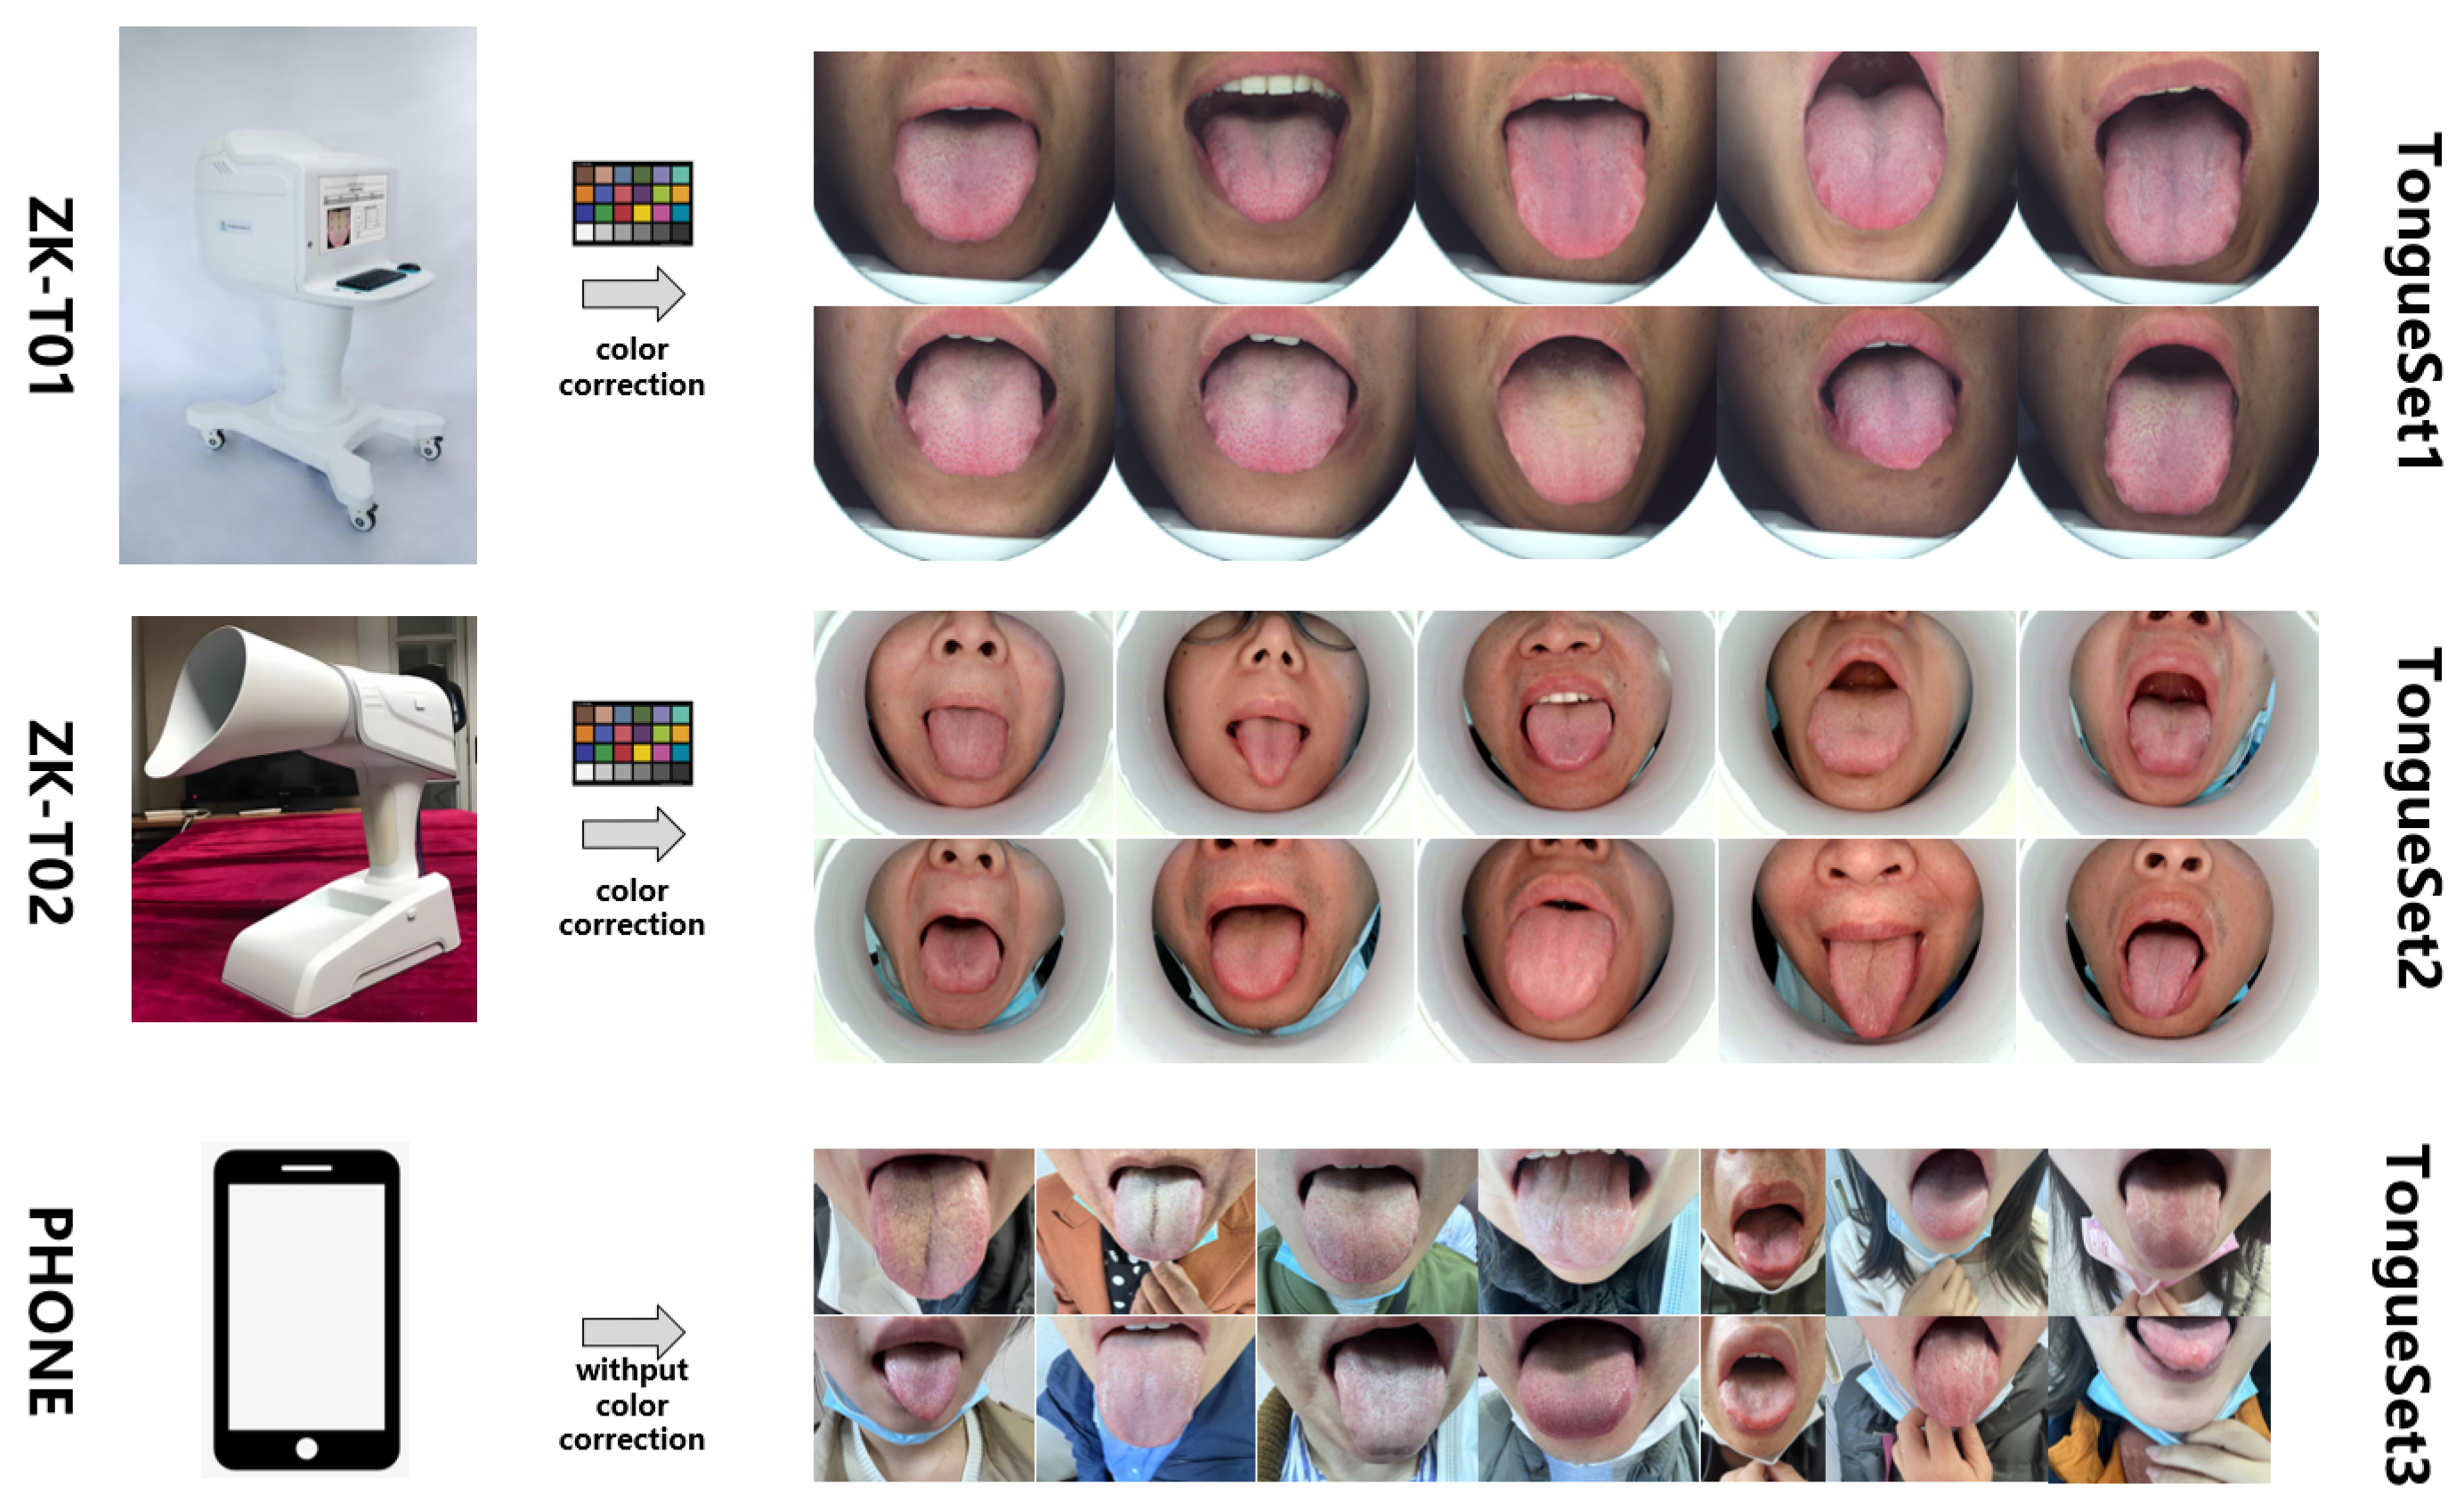
2.1. Datasets for Segmentation

This study utilizes three different datasets. The first dataset, TongueSet1, contains 368 tongue images with a resolution of 2300 × 1944. These images were collected using the digital tongue diagnostic device ZK-T01 (Institute of Microelectronics, Chinese Academy of Sciences, Beijing, China), developed by the Mathematical Health Chip and System Research Laboratory of the Health Electronics R&D Center at the Institute of Microelectronics, Chinese Academy of Sciences. The ZK-T01 consists of a collection chamber, a high-definition color camera, an adjustable color temperature lighting module, an image storage module, and a computing module. It is relatively large in size and suitable for fixed-location use. The second dataset, TongueSet2, consists of 422 tongue images with a resolution of 1920 × 1080. These images were collected using the ZK-T02 tongue diagnostic device (Institute of Microelectronics, Chinese Academy of Sciences, Beijing, China), which is an improved version of the ZK-T01. The ZK-T02 is more compact and portable, featuring a smaller collection chamber and incorporating an NVIDIA Jetson Nano edge computing module for storage and computation. The third dataset, TongueSet3, contains 348 tongue images with varying resolutions. These images were captured and uploaded by different doctors or patients using mobile phones and other non-professional devices and were later curated into a dataset. An overview of the collection devices and datasets is shown in Figure 1.

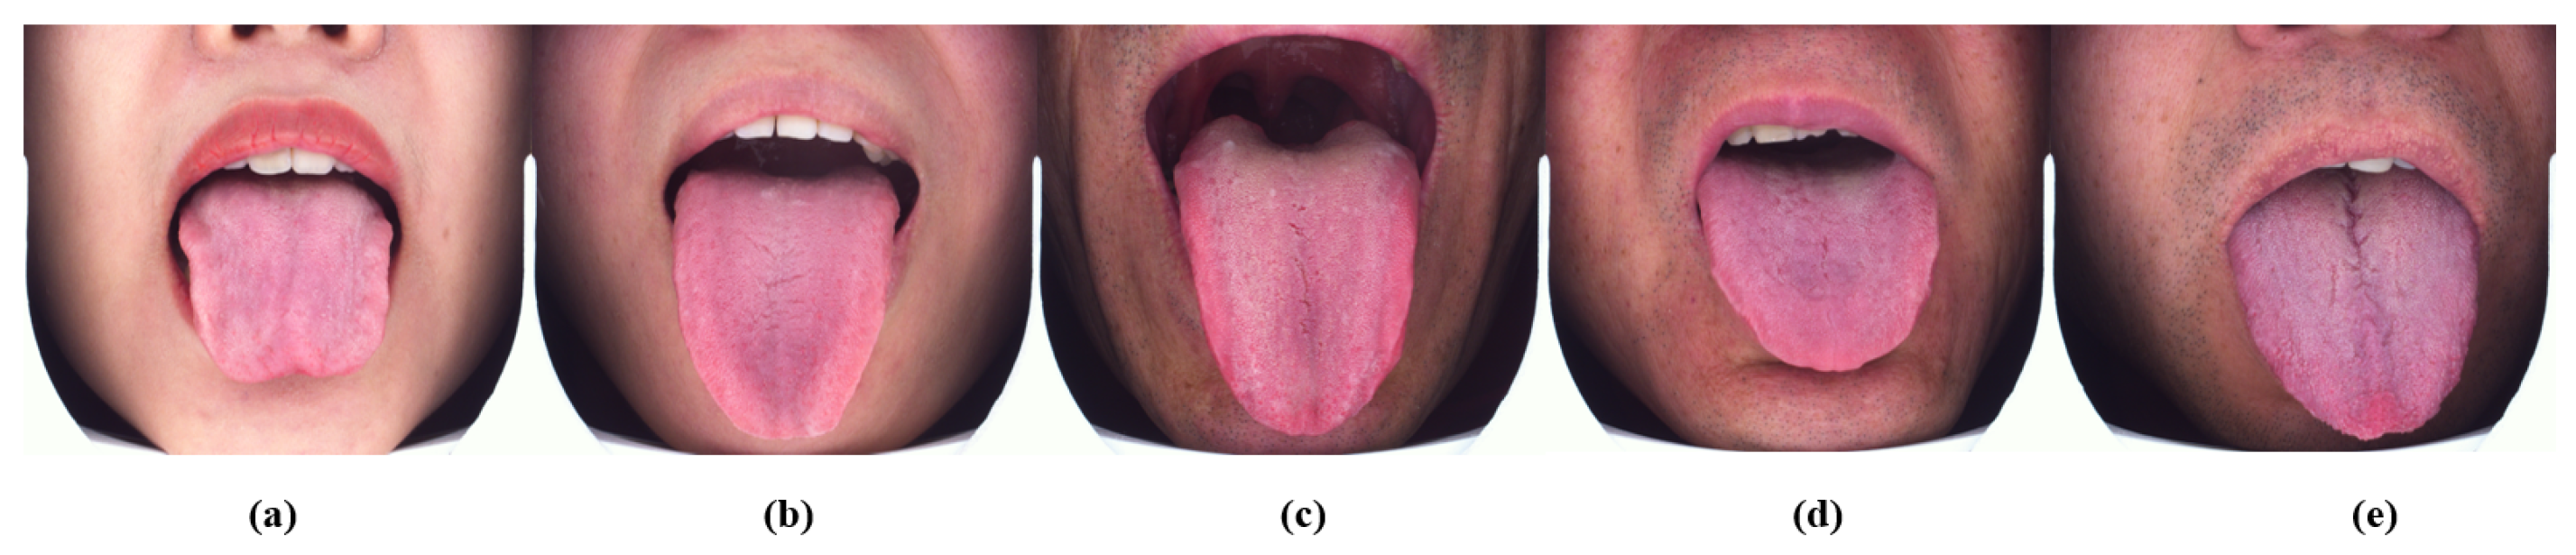
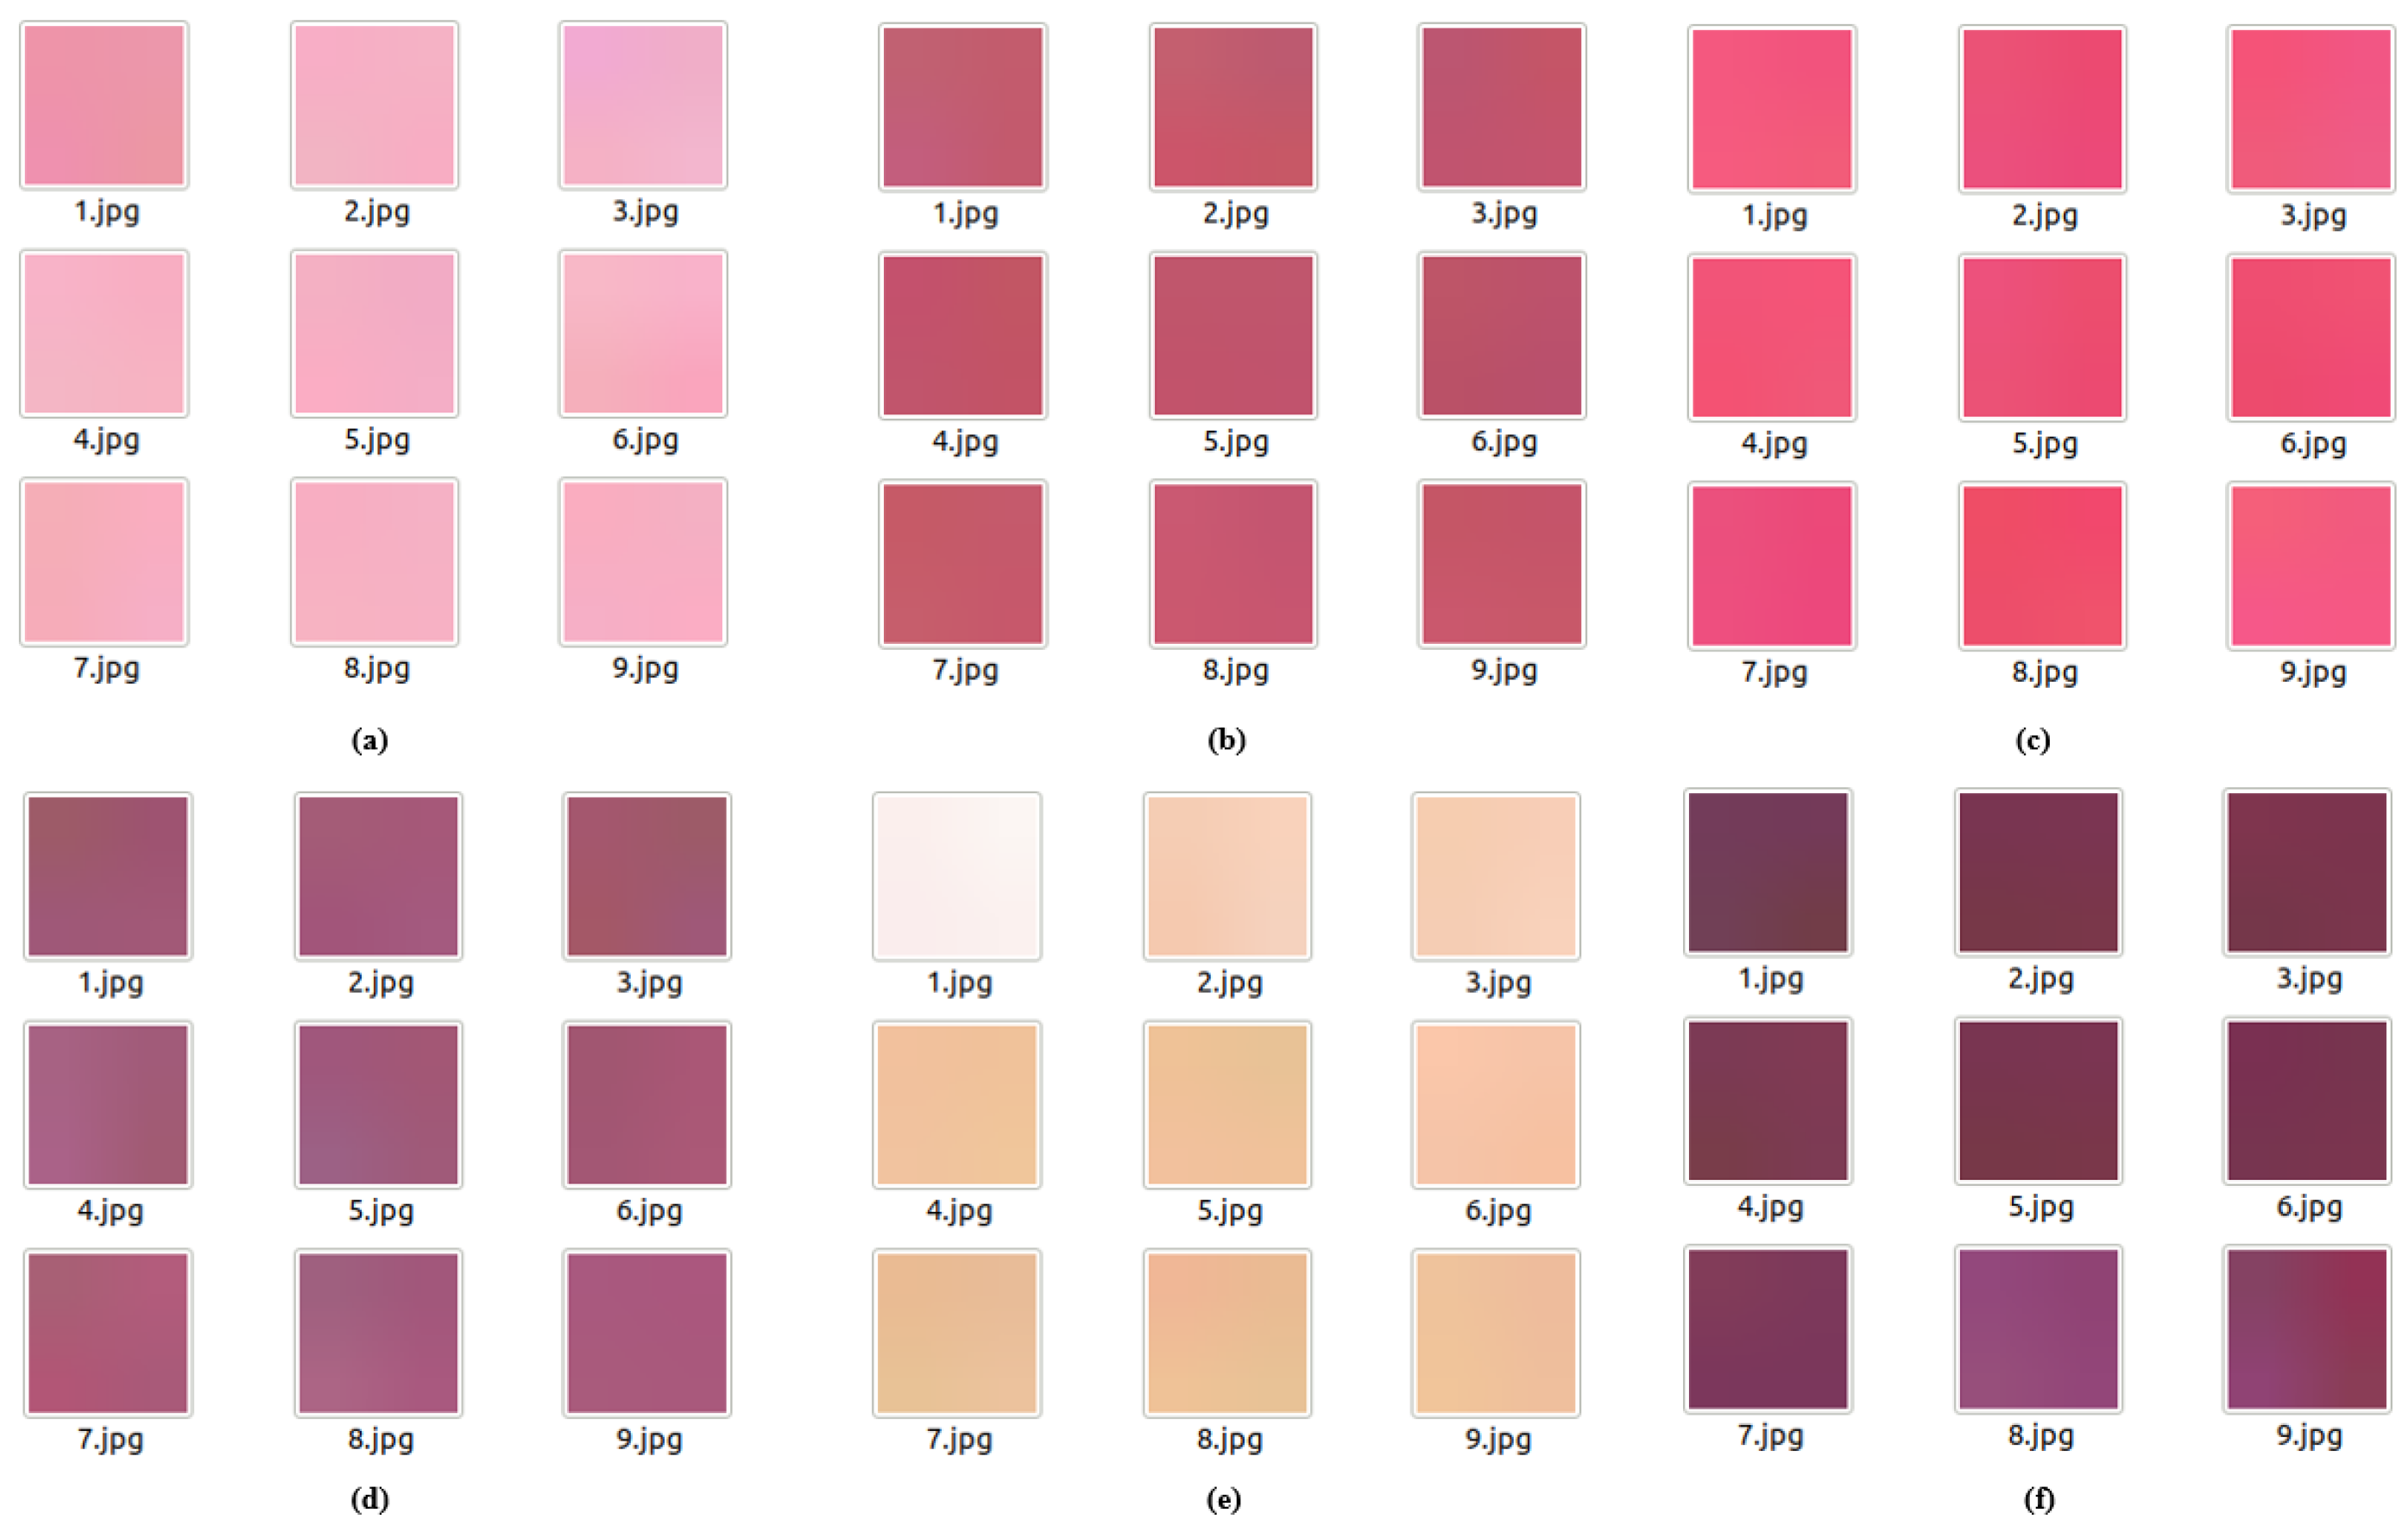
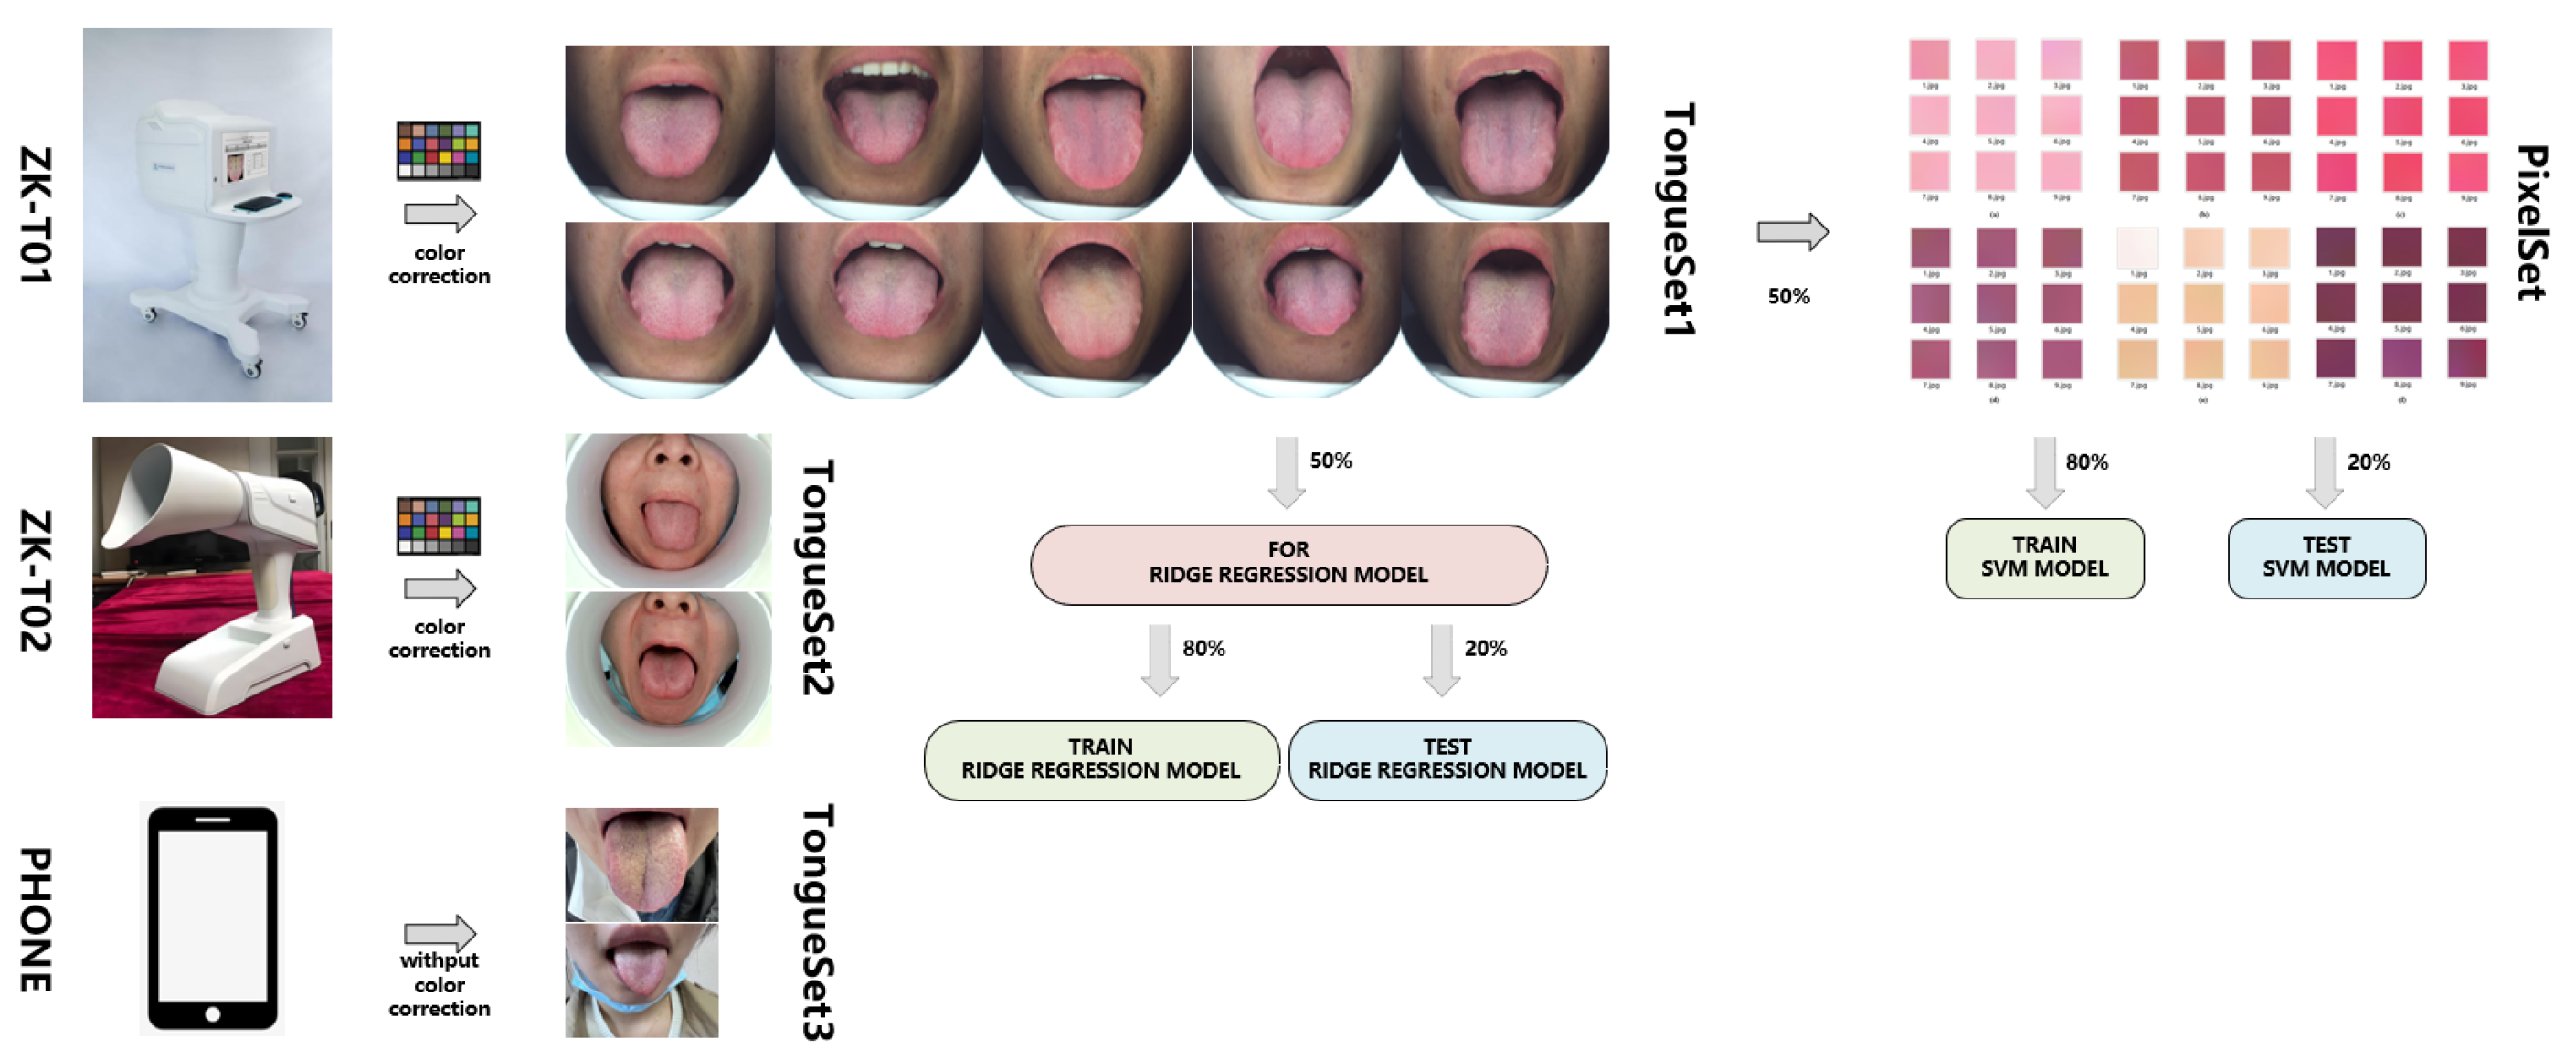
2.2. Datasets for Classification

In order to create uniform lighting conditions at the tongue image collection site, the collection chambers of the ZK-T01 and ZK-T02 tongue diagnostic devices are designed with different sizes of integrating spheres. This structure consists of a cavity sphere with the inner walls coated with a white diffuse reflection material. The light emitted by the light source undergoes multiple reflections off the inner walls of the integrating sphere, ensuring uniform illumination at the collection site. After the tongue image collection system captures the image, color correction is necessary to eliminate minor differences in camera imaging. This paper mainly uses a color correction algorithm based on polynomial regression by comparing the RGB values of a standard 24-color color card with known standard RGB values, aiming to eliminate the deviation between the captured image and the real image.
The standard RGB values of the color block in the i t h color card are denoted as R 0 i , G 0 i , and B 0 i , while the RGB values captured by the illuminated collection module for this color block are denoted as R i , G i , and B i . The regression equation for this color block is shown in Formula (1).
R o i = a 11 v 1 i + a 12 v 2 i + . . . + a 1 i v j i G o i = a 21 v 1 i + a 22 v 2 i + . . . + a 2 i v j i B o i = a 31 v 1 i + a 32 v 2 i + . . . + a 3 i v j i
Formula (1) can be expressed in the form of Formula (2).
X = A T × V
where X is the standard stimulus matrix of dimensions 3 × I .
X = R 01 R 02 . . . R 0 i G 01 G 02 . . . G 0 i B 01 B 02 . . . B 0 i
A is the conversion coefficient matrix.
A = a 11 a 12 a 13 a 21 a 22 a 23 a j 1 a j 2 a j 3
V is the polynomial regression matrix.
V = v 11 v 12 v 13 . . . v 1 i v 21 v 22 v 23 . . . v 2 i v 31 v 32 v 33 . . . v 3 i v j 1 v j 2 v j 3 v j i
The conversion coefficients in Formula (5) can be optimized and obtained using the least squares method, as shown in the following formula.
A = ( V × V T ) 1 ( V × X T )
Finally, by substituting the result from Formula (6) into Formula (1), the color-corrected image can be obtained.
Since the ZK-T01 tongue diagnostic device utilizes a more advanced collection chamber and lighting equipment, the tongue images it captures exhibit greater color consistency. Therefore, the tongue color classification task in this study is based on the TongueSet1 dataset. Regarding the color characteristics of tongue images, we categorize tongues into five types: pale white, light red, red, crimson, and purple-red. Diagnosis is performed by three traditional Chinese medicine experts with associate senior or higher professional titles, following the diagnostic criteria of TCM syndromes. The final classification result is determined based on the consensus of at least two experts. Examples of the five tongue color types are shown in Figure 2.
The tongue surface has various structures, leading to different colors in different regions. For example, a tongue that appears predominantly crimson may still contain other color components. However, our primary focus is on the most representative pixels of each tongue type. We randomly selected 50% of the images from the TongueSet1 dataset to create a pixel dataset. From each tongue type, we extracted several representative 2 × 2 pixel blocks and categorized them to construct a pixel dataset, named PixelSet. The PixelSet is divided into six categories: pale white, light red, red, crimson, tongue coating, and purple-red, with a total of 5185 samples. Specifically, there are 848 samples of pale white, 808 of light red, 830 of red, 815 of crimson, 1087 of tongue coating, and 797 of purple-red. The PixelSet is illustrated in Figure 3.
For model training, we calculated the average RGB values for each 2 × 2 pixel block and organized them into a file sequence for further processing. The remaining 50% of the images in the TongueSet1 dataset were used for training and testing the tongue color classification model. For clarity, the datasets and their corresponding tasks in this study are summarized in Figure 4.
The computer used in this experiment is equipped with an AMD EPYC 75F3 32-core processor (Advanced Micro Devices, Santa Clara, CA, USA) and an NVIDIA RTX A6000 high-performance GPU (NVIDIA, Santa Clara, CA, USA).

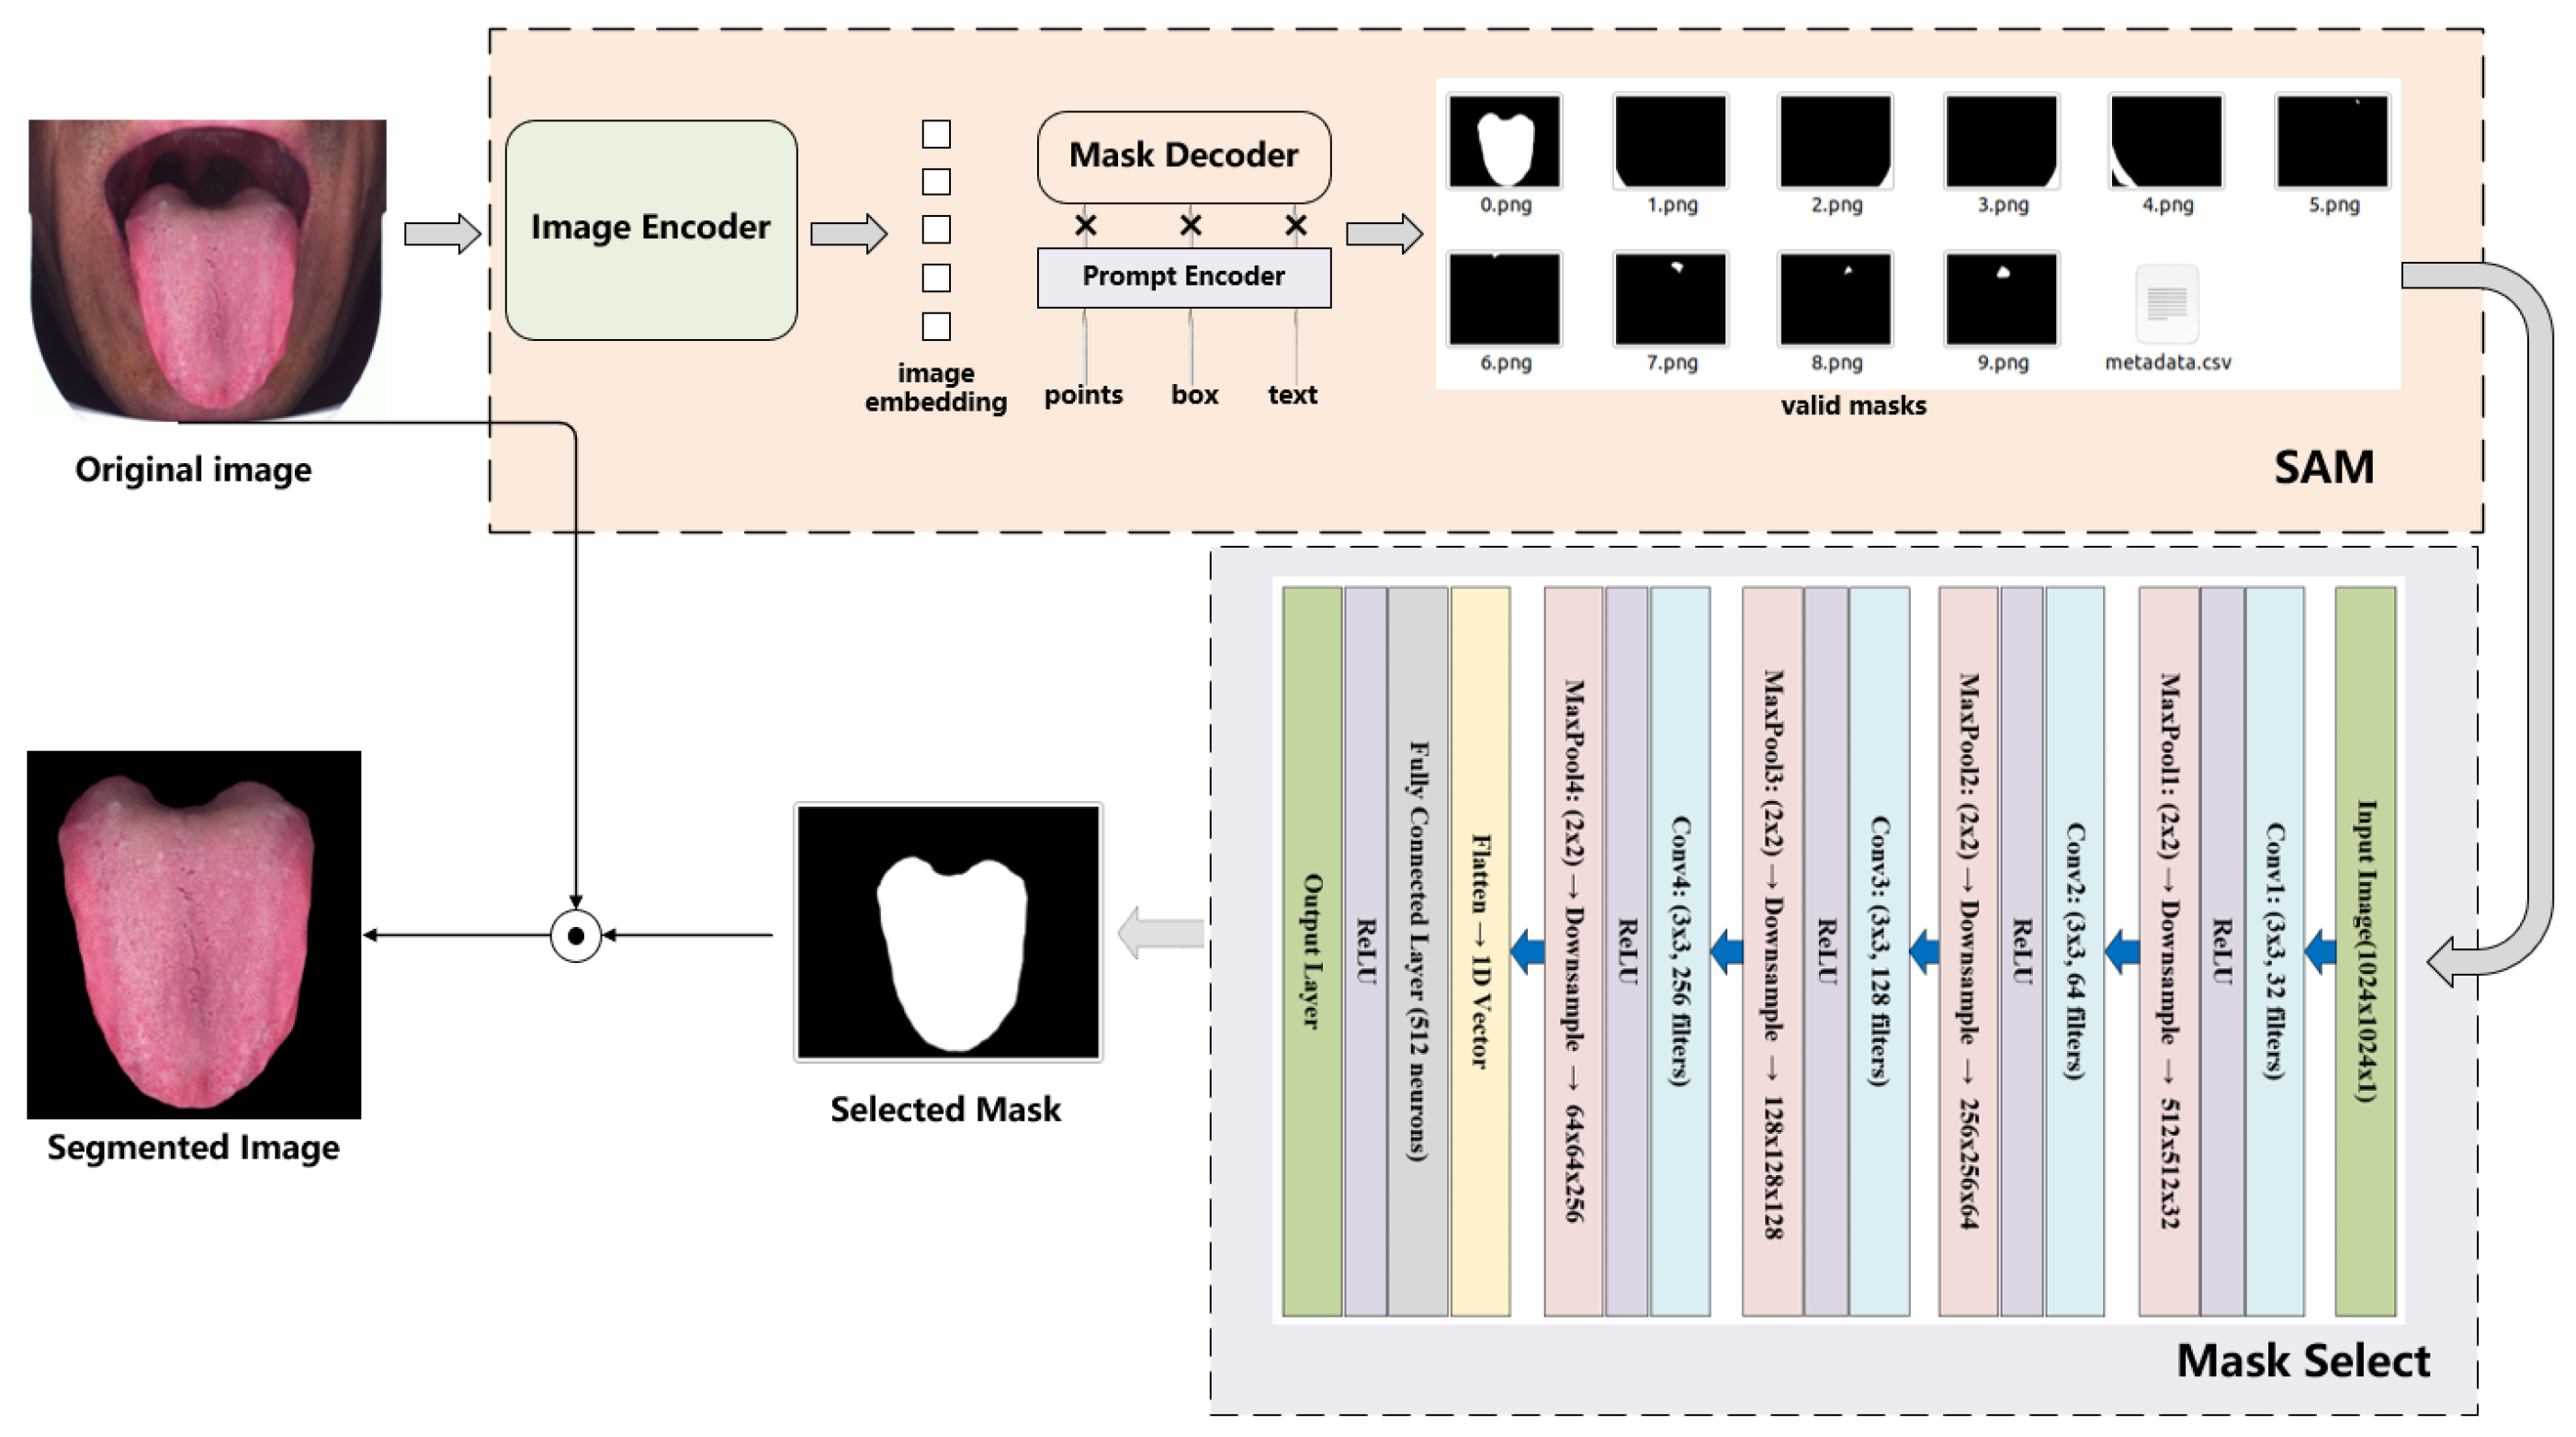
2.3. Proposed Segmentation Model

The SAM (Segment Anything Model) is a general-purpose image segmentation model based on deep learning, developed by Meta. It is designed as a highly versatile foundational model for image segmentation, capable of handling various segmentation tasks, including but not limited to instance segmentation, semantic segmentation, and panoptic segmentation [15,16].
One of SAM’s most notable features is its ability to perform image segmentation in a “0-shot” setting, meaning it does not require specifically labeled training data. Instead, it can accomplish segmentation tasks by simply receiving an input image and relevant prompts. Traditionally, training a tongue image segmentation model requires significant human effort and time for dataset annotation in the early stages, followed by extensive computational resources and manual fine-tuning to achieve satisfactory segmentation performance. SAM’s 0-shot learning capability allows it to perform reasonably well without any specific training data, significantly reducing the need for human labor, time, and computational resources.
However, the official Python 3.10 implementation of SAM requires interactive user input in the form of prompts (e.g., points, boxes, or text) to accurately segment specific targets such as the tongue. This limitation makes it challenging to fully automate the segmentation process for large-scale datasets. To address this, this paper proposes a tongue image segmentation model, SATM (Segment Any Tongue Model), which integrates SAM with a lightweight classification network called Mask Select. The SATM model eliminates the need for user-provided prompts and enables automated batch processing of tongue images captured by tongue diagnostic devices, streamlining the segmentation workflow. Figure 5 illustrates the structure of the SATM segmentation model.
As shown in Figure 5, the segmentation model SATM is mainly composed of two parts: SAM and Mask Select. The SAM part includes the Image Encoder and Mask Decoder, with the Prompt Encoder omitted. To achieve scalability and leverage the powerful pre-training methods, the Image Encoder uses a Vision Transformer (ViT) pre-trained with MAE (Masked Autoencoder) and has been minimally adapted to handle high-resolution inputs. The Mask Decoder, without the Prompt Encoder input, outputs all possible masks. The Mask Select part is primarily a lightweight classification network with MobileNet as the backbone, which can identify the correct tongue mask from the many masks processed by SAM. By performing pixel-wise computation between the tongue mask and the original image captured by the tongue diagnostic device, the final segmented tongue image is obtained.

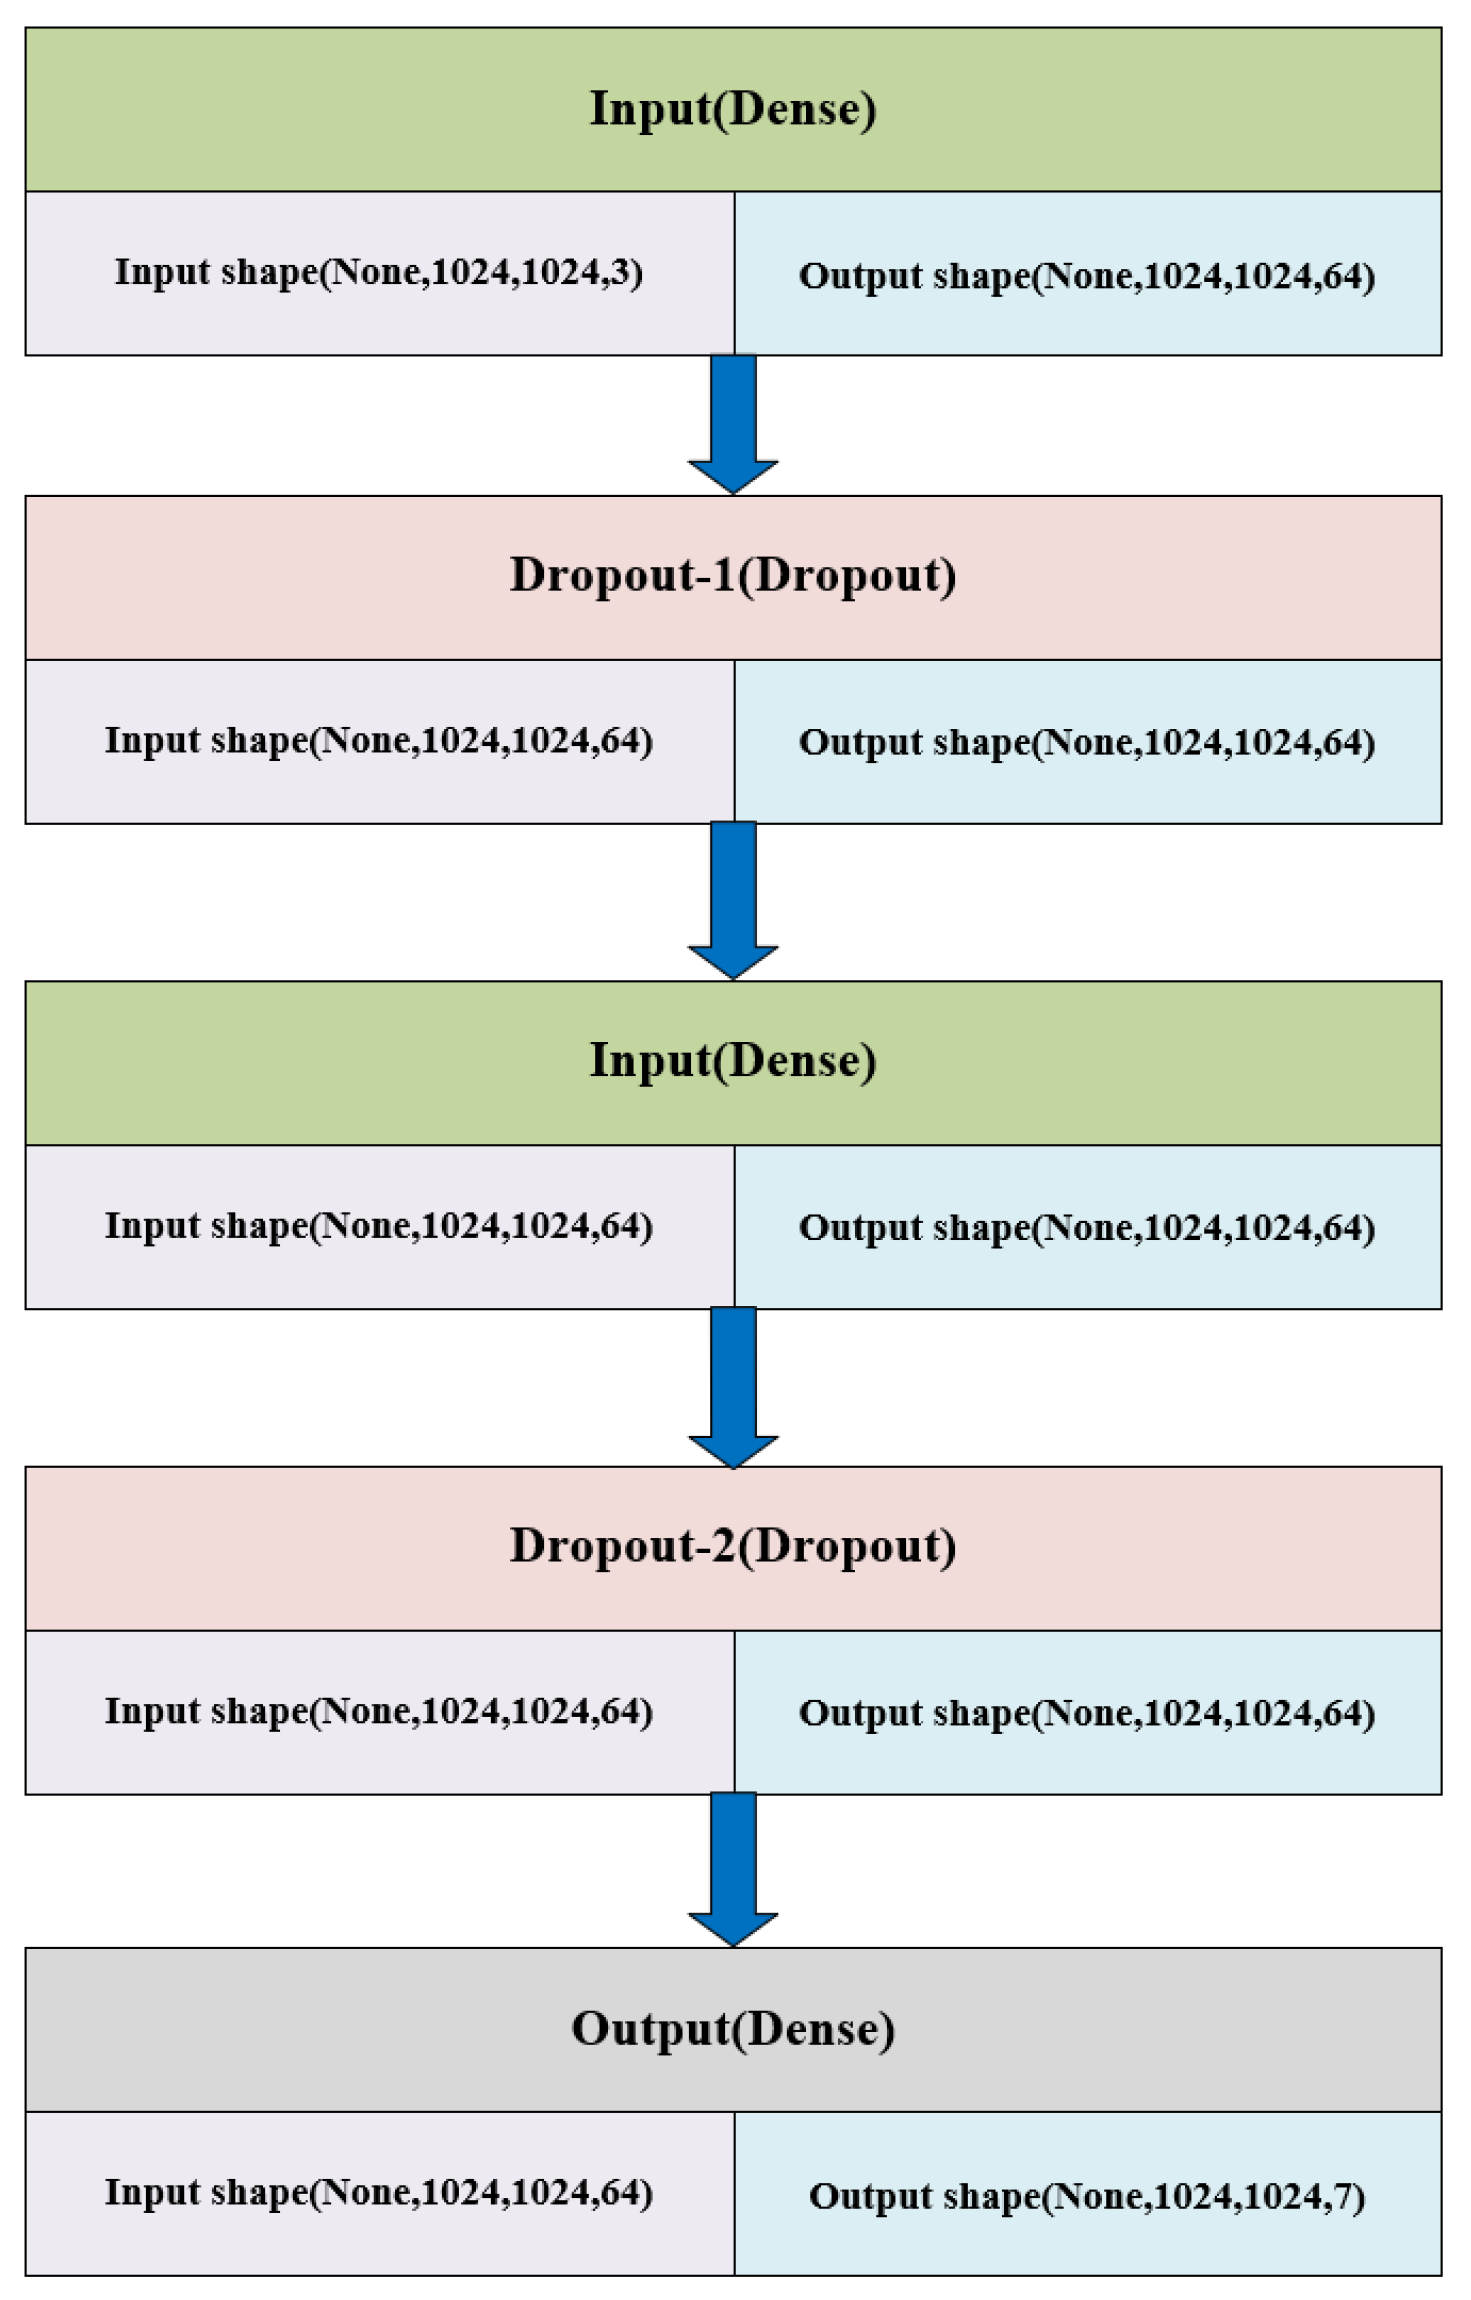
2.4. Proposed Classification Model

The classification of tongue color consists of two main steps: the first step involves classifying the color of feature pixels on the tongue image, and the second step applies the classification model from the first step to classify all the pixels on a new tongue image and calculate the proportions of each type. Based on the proportions of different pixel types in each tongue image, ridge regression is used to determine the final tongue color type.
The first step of tongue color classification is based on support vector machine. SVM is a powerful supervised learning algorithm used for classification or regression tasks, especially suited for handling small sample sizes, nonlinear, and high-dimensional data classification problems [17]. The basic principle of SVM is to find an optimal decision boundary, or hyperplane, that clearly separates different classes in the feature space while maximizing the margin between classes. In this study, we implement the SVM algorithm on both the CPU and GPU. For the CPU implementation, we use the SVC class from sklearn.svm. Scikit-learn (sklearn) is a widely used machine learning library built in Python for data mining and data analysis, providing simple yet powerful interfaces [18]. On the GPU, we use the cuML library for implementation. cuML is an open-source library developed by NVIDIA, part of the Rapids AI ecosystem, which aims to provide high-performance solutions for GPU-accelerated machine learning [19]. It offers an API similar to Scikit-learn and supports a variety of common machine learning algorithms. By leveraging the parallel computing capabilities of NVIDIA GPUs, cuML significantly accelerates data processing, making it particularly well suited for big data analysis and real-time data processing scenarios. cuML integrates seamlessly with other Rapids libraries, allowing for efficient processing and analysis of large datasets.
The second step of tongue color classification applies the pixel color classification model obtained in the first step to the test set. The proportions of different pixel types in the test set are calculated, and ridge regression is used to assign different weights to different pixel types. This simulates the varying effects of different pixel types on human visual perception, thereby automatically and objectively determining the overall tongue color type. This provides an objective reference for traditional Chinese medicine tongue diagnosis.
We assign the labels pale white, light red, red, dark red, and purple-red the values 0, 1, 2, 3, and 4, respectively, and the proportions A, B, C, D, and E, respectively. Let the undetermined coefficients be α , β , γ , δ , and ϵ , and define F as below:
F = α A + β B + γ C + δ D + ϵ E
ensuring that a higher label value corresponds to a higher F value. Using ridge regression for machine learning, we determine the values of the coefficients α , β , γ , δ , and ϵ . Through the machine learning steps described above, F values for the same category will cluster together, while F values for different categories will separate. We can then select an appropriate F value as the threshold to guide the classification of new tongue images.
Ridge regression is an extension of linear regression used to address multicollinearity issues [20]. In multicollinearity, there is high correlation among the independent variables, leading to unstable or even biased parameter estimates in traditional linear regression models. Ridge regression effectively reduces the variance of parameter estimates and improves the model’s generalization ability by adding a regularization term (ridge penalty) to the loss function. The loss function of ridge regression consists of two parts: minimizing the residual sum of squares (RSS) and the regularization term. The regularization term is the product of the sum of squares of parameters and a tuning parameter ( λ ). The parameter λ controls the degree of penalty imposed by the regularization term on parameter estimates. A larger λ results in a more severe penalty, preventing parameter over-inflation.
L o s s F u n c t i o n = y i y i ^ 2 + λ β i 2
In the formula, RSS represents the residual sum of squares, which is the sum of the squares of the differences between the observed values and the values predicted by the model. λ is the regularization parameter used to control the strength of the regularization term. In ridge regression, this is usually a non-negative number. β i represents coefficients in the model. y i is the observed target variable value. y i ^ is the target variable value predicted by the model. The mean square error (MSE) is used to measure the difference between model predictions and true observations. The MSE measures the average squared difference between model predictions and true values. The smaller the MSE, the better the model fit.
M S E = 1 n y i y i ^ 2
In the formula, n is the sample size. y i is the true target value for the i-th sample. y i ^ is the target value of the i-th sample predicted by the ridge regression model.

3. Results

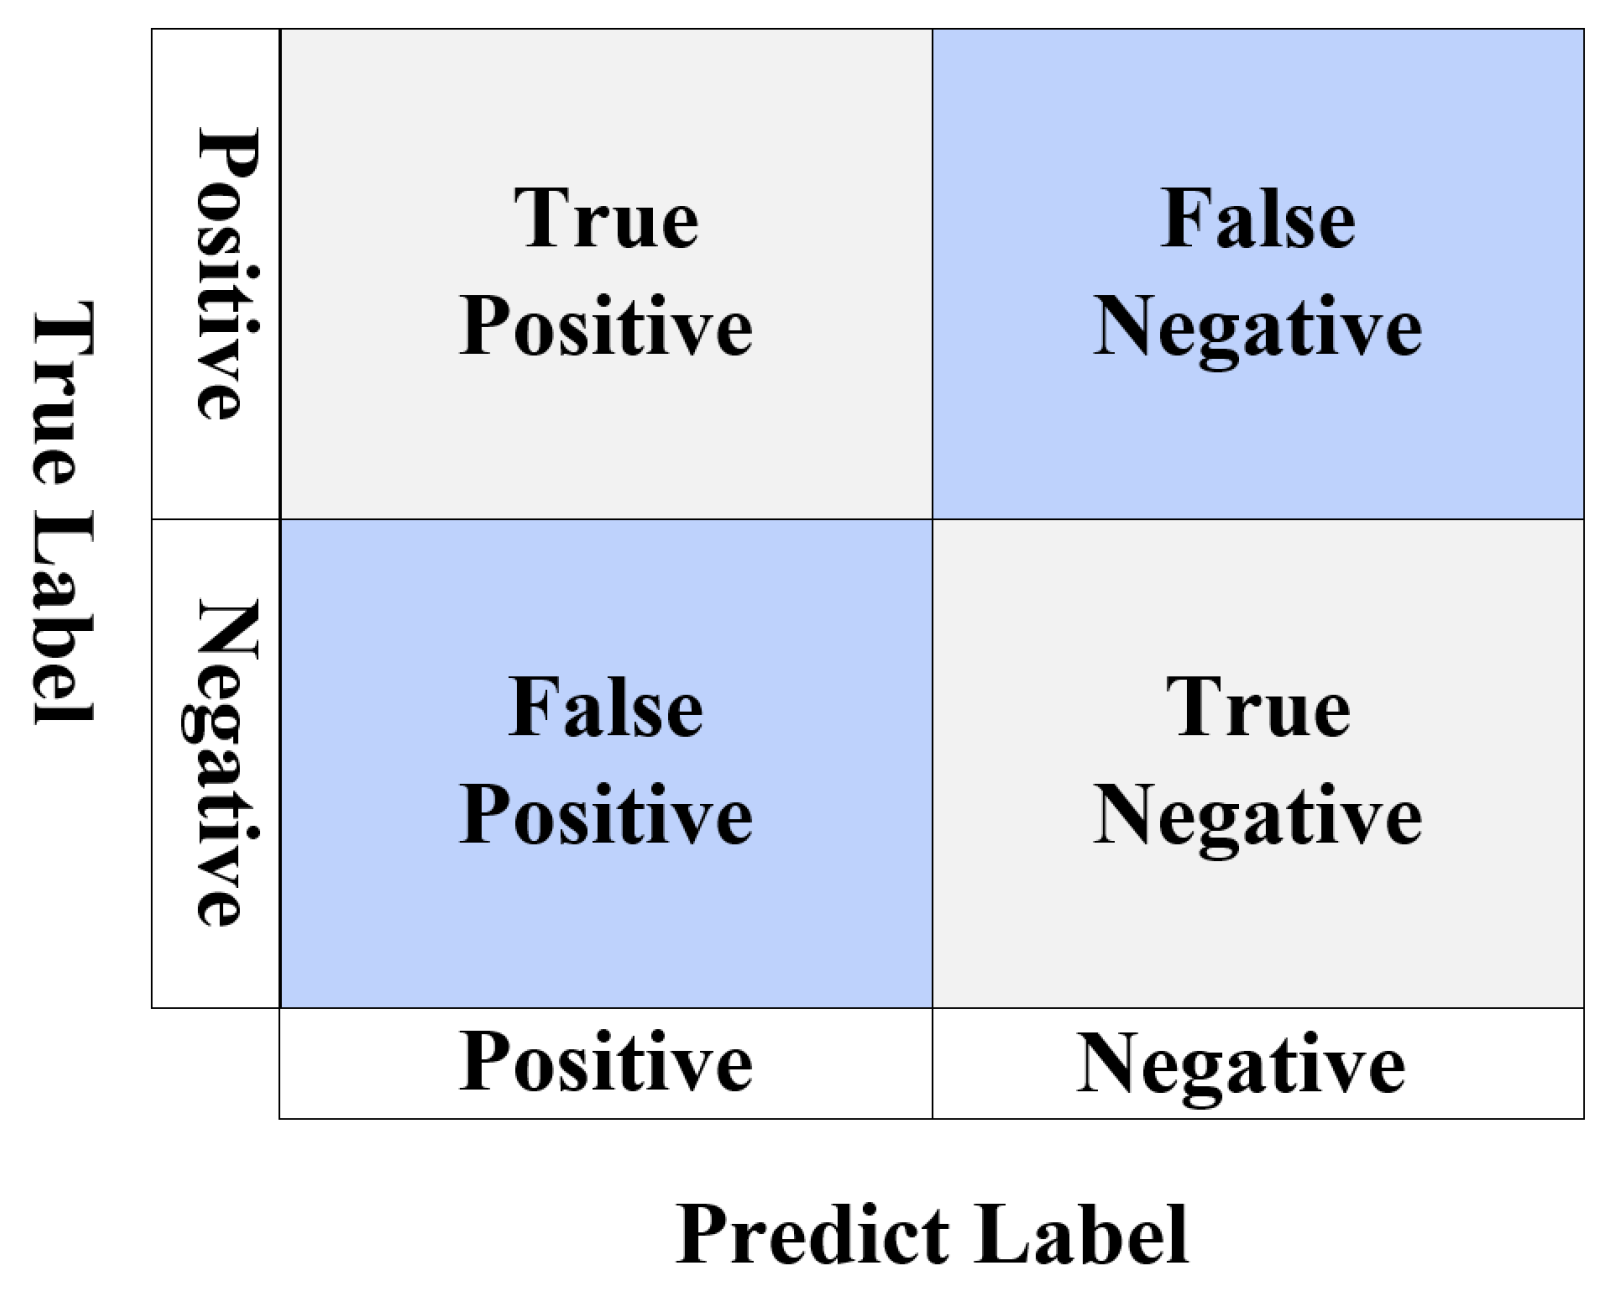
3.1. Evaluation Metrics

Reasonable evaluation metrics are crucial for assessing the performance of a model. In the tongue image segmentation section of this paper, we use the intersection over union (IoU), Dice similarity coefficient (DSC), and accuracy (Acc) to evaluate the effectiveness of the segmentation model.
The IoU measures the overlap between the predicted segmentation and the ground truth segmentation, with a range from 0 to 1. A larger value indicates a better segmentation result. Let the ground truth area be denoted as A, and the predicted area be denoted as B, then the formula for IoU is
I o U = A B A B
DSC is similar to IoU but focuses more on the overlap ratio between the predicted and ground truth areas, and is particularly sensitive in small-object segmentation. The specific formula is
D S C = 2 · A B A + B
In the tongue color classification section, metrics such as accuracy, precision, recall, F1-score, and run time are used to comprehensively evaluate the performance of the method. These metrics involve the confusion matrix, which visually displays the deviation between predicted results and ground truth values. A specific display of a confusion matrix is shown in Figure 6.
Accuracy reflects the proportion of correctly predicted samples out of the total samples. The specific calculation formula is shown in Equation (12).
A c c u r a c y = T P + T N T P + T N + F P + F N
The precision metric reflects the proportion of predicted positive instances that are actually positive. The calculation formula is shown in Equation (13).
P r e c i s i o n = T P T P + F P
Recall reflects the proportion of actual positive instances that are correctly predicted as positive. The calculation formula is shown in Equation (14).
R e c a l l = T P T P + F N
The F1-score is the harmonic mean of precision and recall, used to balance and consider both metrics’ performance. The calculation formula is shown in Equation (15).
F 1 s c o r e = 2 P r e c i s i o n · R e c a l l P r e c i s i o n + R e c a l l
The run time is the average time consumed to infer a tongue image with a resolution of 2300 × 1944 pixels. It is an important metric for evaluating the method’s lightweight performance and practical application value.

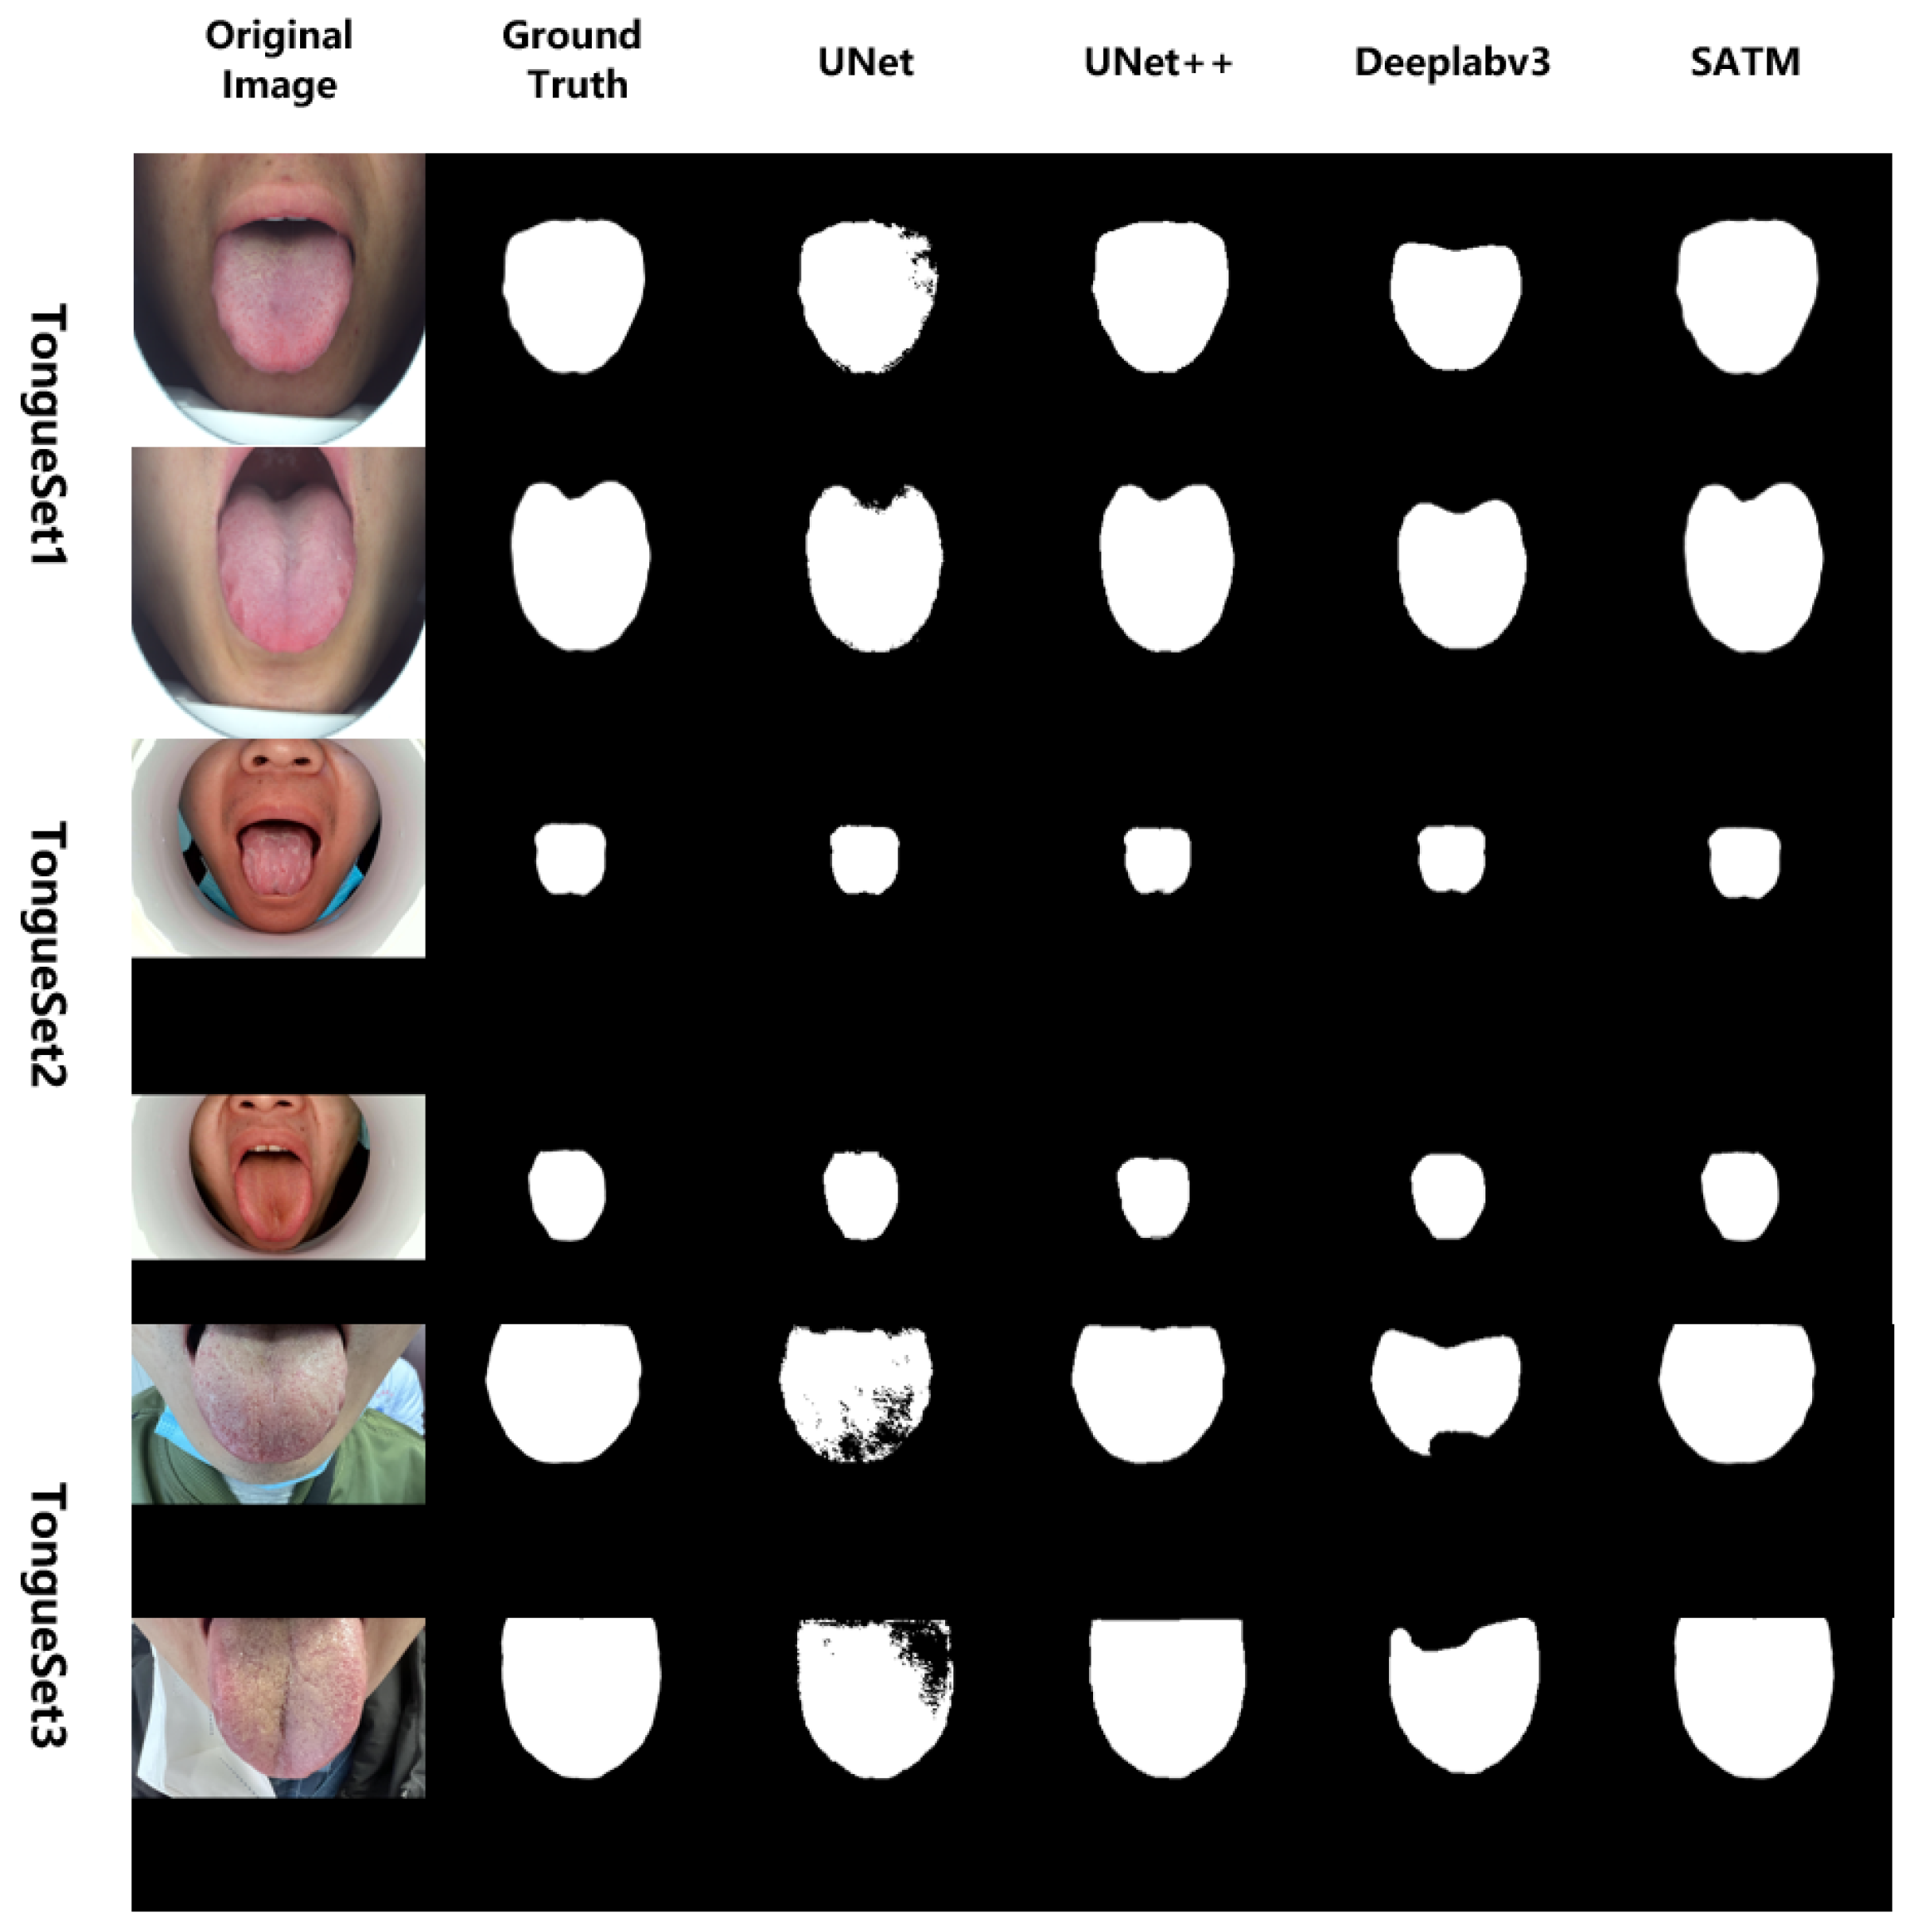
3.2. Experimental Results

In the tongue image segmentation section, this paper compares the proposed segmentation model SATM with U-Net, U-Net++, and DeepLabv3 on TongueSet1, TongueSet2, and TongueSet3, evaluating model performance based on the IoU, DSC, and Acc metrics. The results are shown in Table 1. The segmentation experimental results are shown in Figure 7.
In the first step of the tongue color classification section, SVM and CNN are used separately for training and inference. The obtained results are shown in Table 2. Accuracy, precision, recall, and F1-score are evaluated on the pixel dataset PixelSet, while run time represents the actual time consumed for inferring a tongue image with a resolution of 2300 × 1944 pixels. The run time is a crucial metric for practical applications, as it assesses the lightweight nature of the method.
To compare and evaluate performance with the neural network, we designed a simple neural network with two hidden layers. The first hidden layer consists of a fully connected layer with 64 neurons, a ReLU activation function, and a dropout layer with a 50% dropout rate. The second hidden layer consists of a fully connected layer with 64 neurons, a ReLU activation function, and a dropout layer with a 30% dropout rate. The final output layer contains seven neurons (including a “background” class) and uses a softmax activation function. The network structure is shown in Figure 8.
Based on the previously obtained SVM classifier, the remaining 50% of the images in the tongue image dataset were classified by pixel and re-colored for visualization. The results are shown in Figure 9. It can be seen that the pixel classification is clear, and the categories of the pixels on the tongue are objectively presented, intuitively displaying the color types of the tongue itself. Figure 9 shows examples of the original images and pixel classification results for five types of tongues: pale white, light red, red, crimson, and purple-red.
Additionally, we conducted a statistical analysis of the proportion of different pixel types in each tongue category, and the results are shown in Figure 10. We can observe that it is not simply a matter of selecting the pixel type with the largest proportion as the overall type of the tongue. Different types of pixels have varying effects on the human eye.
In the second step of the tongue color classification, we trained with different tuning parameters, and the results are shown in the table below (Table 3).
The optimal λ value is 0.1, the corresponding MSE is 0.1960, and the corresponding coefficients in Equation (4) are α = −3.6332, β = −1.2689, γ = −0.0365, δ = 2.2087, and ϵ = 2.7300. The F value corresponding to pale white tongue is −0.16174∼0.5061, the F value corresponding to light red tongue is 0.5504∼1.4161, the F value corresponding to red tongue is 1.4789∼2.3981, the F value corresponding to dark red tongue is 2.5097∼2.9223, and the F value corresponding to purple-red tongue is 2.5097∼2.9223. The F value is 3.9655∼5.4848. The classification threshold was set as the average of the maximum F value of the previous category and the minimum F value of the following category; that is, F t h 1 = 0.5283, F t h 2 = 1.4475, F t h 3 = 2.4539, F t h 4 = 3.4439. According to this method, the tongue color classification accuracy can reach 91.80%.

4. Conclusions

In an era where artificial intelligence empowers various fields, establishing a reliable and user-friendly intelligent tongue diagnosis analysis system is essential. In this study, we developed a tongue image segmentation and tongue color classification system that can be applied to existing equipment. After comparing it with existing segmentation and classification methods, the system shows strong progress and practicality. For the specific segmentation task, we used three datasets of tongue images collected from different devices: TongueSet1, TongueSet2, and TongueSet3. We creatively employed the Segment Anything Large Model and Mask Select network for tongue segmentation. The Segment Anything Model, with its powerful versatility and zero-shot generalization capability, allowed us to avoid the tedious process of annotating datasets, as required by traditional segmentation models. This model successfully segments new data without specific annotations, greatly improving work efficiency and segmentation accuracy while significantly reducing the workload for data preparation. For tongue image classification, we adopted a bottom-up approach. First, we collected and classified representative pixels from a specific tongue color. During the classification process, we used the SVM method, which not only reduced training time and computational resource consumption, but also improved testing speed and classification accuracy. The support vector machine is particularly effective for handling high-dimensional data and performs exceptionally well with limited data, making it an ideal choice for our tongue color classification. Each tongue image has a resolution of 2300 pixels × 1944 pixels, meaning each image contains 2300 × 1944 = 4,471,200 pixels. Since each pixel needs to be processed, the computational workload is enormous. Therefore, using lightweight machine learning methods is particularly necessary. By adopting the efficient SVM classification algorithm, we were able to maintain classification accuracy while greatly reducing computational resource demands, making the entire process more efficient. After training the model, we can classify the pixels of new tongue images and visually display the different types of pixels. This method minimizes interference from factors such as human eyesight and display devices, providing a more objective and accurate means of tongue diagnosis. With this technology, doctors can more accurately identify and analyze tongue images, making more reliable diagnostic and treatment decisions. This image-based classification technique for tongue images is of significant importance in traditional Chinese medicine clinical diagnosis. Tongue images are one of the key diagnostic indicators in TCM. Traditional tongue diagnosis relies on the doctor’s experience and visual observation, which involves some subjectivity and uncertainty. By incorporating advanced image processing and machine learning techniques, we can not only enhance the objectivity and accuracy of tongue diagnosis but also provide a standardized and reproducible diagnostic method. This plays a crucial role in the modernization and scientific advancement of TCM diagnosis and is expected to be widely applied in clinical settings in the future.

Author Contributions

Conceptualization, T.S. and B.L.; methodology, B.L.; software, B.L.; validation, B.L.; formal analysis, B.L.; investigation, Z.W.; resources, Z.W.; data curation, Z.W.; writing—original draft preparation, B.L.; writing—review and editing, K.Y.; supervision, H.Y.; project administration, Y.W. and H.Z.; funding acquisition, H.Y. and Y.W. All authors have read and agreed to the published version of the manuscript.

Funding

This work was supported in part by the National Key Research and Development Program of China under Grant 2022YFC3502303.

Institutional Review Board Statement

This study was conducted in accordance with the Declaration of Helsinki, and approved by the Ethics Committee of Xiyuan Hospital, China Academy of Chinese Medical Sciences. (Approval Code: 2022XL-A048-3, Date of approval: 28 April 2022).

Informed Consent Statement

Informed consent for participation was obtained from all subjects involved in the study.

Data Availability Statement

All data used in this study are publicly available at the following DOI: https://doi.org/10.5281/zenodo.15240589, accessed on 17 April 2025. Additional supporting materials are available from the corresponding authors upon reasonable request.

Conflicts of Interest

The authors declare no conflicts of interest.

References

  1. Zhou, J.; Zhang, Q.; Zhang, B.; Chen, X. TongueNet: A Precise and Fast Tongue Segmentation System Using U-Net with a Morphological Processing Layer. Appl. Sci. 2019, 9, 3128. [Google Scholar] [CrossRef]
  2. Huang, Z.; Miao, J.; Song, H.; Yang, S.; Zhong, Y.; Xu, Q.; Tan, Y.; Wen, C.; Guo, J. A novel tongue segmentation method based on improved U-Net. Neurocomputing 2022, 500, 73–89. [Google Scholar] [CrossRef]
  3. Zhang, X.; Bian, H.; Cai, Y.; Zhang, K.; Li, H. An improved tongue image segmentation algorithm based on Deeplabv3+ framework. IET Image Process. 2022, 16, 1473–1485. [Google Scholar] [CrossRef]
  4. Huang, X.; Zhang, H.; Zhuo, L.; Li, X.; Zhang, J. TISNet-Enhanced Fully Convolutional Network with Encoder-Decoder Structure for Tongue Image Segmentation in Traditional Chinese Medicine. Comput. Math. Methods Med. 2020, 2020, 6029258. [Google Scholar] [CrossRef] [PubMed]
  5. Naveed, S.; Geetha, G.; Leninisha, S. Early Diabetes Discovery From Tongue Images. Comput. J. 2022, 65, 237–250. [Google Scholar] [CrossRef]
  6. Chen, J.M.; Chiu, P.F.; Wu, F.M.; Hsu, P.C.; Deng, L.J.; Chang, C.C.; Chiang, J.Y.; Lo, L.C. The tongue features associated with chronic kidney disease. Medicine 2021, 100, e25037. [Google Scholar] [CrossRef] [PubMed]
  7. Hsieh, S.F.; Shen, L.L.; Su, S.Y. Tongue color changes within a menstrual cycle in eumenorrheic women. J. Tradit. Complement. Med. 2016, 6, 269–274. [Google Scholar] [CrossRef] [PubMed]
  8. Li, Q.; Liu, Z. Tongue color analysis and discrimination based on hyperspectral images. Comput. Med. Imaging Graph. 2009, 33, 217–221. [Google Scholar] [CrossRef] [PubMed]
  9. Kamarudin, N.D.; Ooi, C.Y.; Kawanabe, T.; Mi, X. Tongue’s substance and coating recognition analysis using HSV color threshold in tongue diagnosis. In Proceedings of the First International Workshop on Pattern Recognition, Tokyo, Japan, 11–13 May 2016. [Google Scholar] [CrossRef]
  10. Ni, J.; Yan, Z.; Jiang, J. TongueCaps: An Improved Capsule Network Model for Multi-Classification of Tongue Color. Diagnostics 2022, 12, 653. [Google Scholar] [CrossRef] [PubMed]
  11. Kawanabe, T.; Kamarudin, N.D.; Ooi, C.Y.; Kobayashi, F.; Mi, X.; Sekine, M.; Wakasugi, A.; Odaguchi, H.; Hanawa, T. Quantification of tongue colour using machine learning in Kampo medicine. Eur. J. Integr. Med. 2016, 8, 932–941. [Google Scholar] [CrossRef]
  12. Zhang, B.; Wang, X.; You, J.; Zhang, D. Tongue Color Analysis for Medical Application. Evid. Based Complement. Altern. Med. 2013, 2013, 264742. [Google Scholar] [CrossRef] [PubMed]
  13. Liu, W.; Chen, J.; Liu, B.; Hu, W.; Wu, X.; Zhou, H. Tongue image segmentation and tongue color classification based on deep learning. Digit. Chin. Med. 2022, 5, 253–263. [Google Scholar] [CrossRef]
  14. Yan, B.; Zhang, S.; Yang, Z.; Su, H.; Zheng, H. Tongue Segmentation and Color Classification Using Deep Convolutional Neural Networks. Mathematics 2022, 10, 4286. [Google Scholar] [CrossRef]
  15. Kirillov, A.; Mintun, E.; Ravi, N.; Mao, H.; Rolland, C.; Gustafson, L.; Xiao, T.; Whitehead, S.; Berg, A.C.; Lo, W.Y.; et al. Segment Anything. arXiv 2023, arXiv:2304.02643. [Google Scholar]
  16. Segment Anything—Segment-Anything.com. Available online: https://segment-anything.com/ (accessed on 28 May 2024).
  17. Cortes, C.; Vapnik, V. Support-vector networks. Mach. Learn. 1995, 20, 273–297. [Google Scholar] [CrossRef]
  18. Pedregosa, F.; Varoquaux, G.; Gramfort, A.; Michel, V.; Thirion, B.; Grisel, O.; Blondel, M.; Prettenhofer, P.; Weiss, R.; Dubourg, V.; et al. Scikit-learn: Machine Learning in Python. J. Mach. Learn. Res. 2011, 12, 2825–2830. [Google Scholar]
  19. Raschka, S.; Patterson, J.; Nolet, C. Machine Learning in Python: Main developments and technology trends in data science, machine learning, and artificial intelligence. arXiv 2020, arXiv:2002.04803. [Google Scholar] [CrossRef]
  20. Hoerl, A.; Kennard, R. Ridge regression-biased estimation for nonorthogonal problems. Technometrics 1970, 12, 55–67. [Google Scholar] [CrossRef]
Figure 1. Overview of collection devices and datasets.
Information 16 00357 g001
Figure 2. Examples of the five tongue color types: (a) pale white tongue, (b) light red tongue, (c) red tongue, (d) crimson tongue, (e) purple-red tongue.
Information 16 00357 g002
Figure 3. Examples from PixelSet. ((a): pale white pixels; (b): light red pixels; (c): red pixels; (d): crimson pixels; (e): tongue coating pixels; (f): purple-red pixels).
Information 16 00357 g003
Figure 4. Datasets and their application tasks.
Information 16 00357 g004
Figure 5. Structure diagram of SATM.
Information 16 00357 g005
Figure 6. Confusion matrix.
Information 16 00357 g006
Figure 7. The segmentation experimental results.
Information 16 00357 g007
Figure 8. The network structure used for comparison.
Information 16 00357 g008
Figure 9. Classifying pixels and re-coloring using the SVM model. (White represents pale white tongue pixels, gray represents tongue coating pixels, pink represents light red tongue pixels, red represents red tongue pixels, yellow represents crimson tongue pixels, and purple represents purple-red tongue pixels.)
Information 16 00357 g009
Figure 10. The proportion of different types of pixels in the five categories of tongues.
Information 16 00357 g010
Table 1. The segmentation experimental results.
TongueSet1TongueSet2TongueSet3
IoU DSC Acc IoU DSC Acc IoU DSC Acc
U-Net0.85980.92120.96910.87820.92960.99240.83160.88160.9160
U-Net++0.94530.97190.98830.89100.93030.99300.90490.93690.9625
DeepLabv30.79620.83090.93880.90910.95230.99500.81490.87950.9082
SATM0.97070.98000.99070.98010.98770.99610.95440.96290.9695
Table 2. The classification experimental results.
SVM-CPUSVM-GPUCNN
Accuracy0.920.920.91
Precision0.940.930.91
Recall0.920.920.90
F1-score0.930.930.90
Run time (s)22.013.7240.21
Table 3. The effect of different λ values on MSE and accuracy.
λ 0.0010.010.1110100
MSE0.19790.19710.19600.20360.44551.5651
Accuracy0.91620.91770.91800.90180.86730.8238
Disclaimer/Publisher’s Note: The statements, opinions and data contained in all publications are solely those of the individual author(s) and contributor(s) and not of MDPI and/or the editor(s). MDPI and/or the editor(s) disclaim responsibility for any injury to people or property resulting from any ideas, methods, instructions or products referred to in the content.

