Abstract
In recent years, Location-Based Augmented Reality (LAR) systems have been increasingly implemented in various applications for tourism, navigation, education, and entertainment. Unfortunately, the LAR content creation using conventional desktop-based authoring tools has become a bottleneck, as it requires time-consuming and skilled work. Previously, we proposed an in-situ mobile authoring tool as an efficient solution to this problem by offering direct authoring interactions in real-world environments using a smartphone. Currently, the evaluation through the comparison between the proposal and conventional ones is not sufficient to show superiority, particularly in terms of interaction, authoring performance, and cognitive workload, where our tool uses 6DoF device movement for spatial input, while desktop ones rely on mouse-pointing. In this paper, we present a comparative study of authoring performances between the tools across three authoring phases: (1) Point of Interest (POI) location acquisition, (2) AR object creation, and (3) AR object registration. For the conventional tool, we adopt Unity and ARCore SDK. As a real-world application, we target the LAR content creation for pedestrian landmark annotation across campus environments at Okayama University, Japan, and Brawijaya University, Indonesia, and identify task-level bottlenecks in both tools. In our experiments, we asked 20 participants aged 22 to 35 with different LAR development experiences to complete equivalent authoring tasks in an outdoor campus environment, creating various LAR contents. We measured task completion time, phase-wise contribution, and cognitive workload using NASA-TLX. The results show that our tool made faster creations with 60% lower cognitive loads, where the desktop tool required higher mental efforts with manual data input and object verifications.
1. Introduction
Location-Based Augmented Reality (LAR) systems have emerged as a powerful medium for delivering contextually relevant digital content within physical environments. They have been implemented in widespread applications for tourism, navigation, education, and entertainment [,,]. However, creations of the LAR contents often require complex workflows, multiple software development kits (SDKs), and considerable programming expertise [,], since they traditionally rely on desktop-based authoring tools, such as Unity and ARCore SDK [].
Desktop-based authoring tools may introduce bottlenecks in LAR content developments, particularly for manual metadata entry and frequent outdoor verification checks, although they offer extensive functionalities. They can disconnect users from the actual physical contexts where LAR contents are deployed, leading to potential misalignments and inaccuracies in content placements [,].
To address these limitations, we have studied and proposed an in-situ mobile authoring tool for directly creating outdoor location-based augmented reality (LAR) content at the target location environment using a smartphone []. Our tool integrates visual-inertial sensor fusion, combining smartphone’s in-device sensors capabilities with Visual Simultaneous Localization and Mapping (VSLAM) and Google Street View (GSV) imagery to enhance the spatial alignment accuracy of AR anchor points [,].
While this approach shows improved spatial alignments, there is still insufficient understanding of how interaction modalities, authoring performance, and cognitive workload differ from desktop-based tools during LAR content creation. Prior studies only emphasize technical developments and lack user-centered comparisons [,,]. Our in-situ tool uses a six degrees of freedom (6DoF) device movement for spatial input, while desktop tools rely on standard mouse-pointing. Therefore, the shift from desktop to in-situ authoring may introduce new challenges in real-time interaction, spatial understanding, and interface usability. It is significant to investigate and compare the distinct user challenges and bottlenecks between them.
In this paper, we present a comparative study of LAR content authoring between our in-situ mobile authoring tool [] and a conventional desktop-based tool. Our prior work [] primarily introduced the in-situ authoring tool itself, focusing on its system design and technical implementation. In contrast, the present study advances this line of research by conducting a comparative evaluation with desktop-based authoring tool, highlighting differences in interaction modality, authoring performance, and cognitive workload. This explicit comparison addresses practical bottlenecks and user-centered challenges in LAR authoring that were not investigated in our earlier work.
We evaluate user performance across three main authoring phases: (1) Point of Interest (POI) acquisition, (2) AR object creation, and (3) AR object registration. As a real-world application, we intend pedestrian landmark annotation across campus environments at Brawijaya University, Indonesia, and Okayama University, Japan. We identify task-level bottlenecks in both tools. Additionally, we highlight the mental effort required for each authoring phase and quantify the impact on cognitive load using NASA-TLX. By focusing on the LAR content creation performance and user cognitive workload at specific POIs, we fill a gap in the current literature and offer valuable insights into the strengths and weaknesses of each authoring platform.
In our experiments, we asked 20 participants aged 22 to 35 with different LAR development experiences, to complete equivalent authoring tasks of placing various AR objects using both tools in an outdoor campus environment. Quantitative data, including authoring task performance and NASA-TLX scores, were collected and statistically analyzed. The results revealed that our tool’s 6DoF interaction enabled faster AR object creation with lower cognitive load. In contrast, the desktop tool required higher mental effort, despite lower physical demands for experienced users in the AR object creation phase.
The remainder of this article is organized as follows: Section 2 introduces the related work. Section 3 describes the authoring tools and setup for the LAR system used in the experiment. Section 4 presents the experiment design and testing scenarios of the experiment. Section 5 shows the results and discusses the analysis. Finally, Section 6 provides conclusions with future works.
2. Related Work in Literature
In this section, we provide an overview of related works that support the findings presented in this paper. By examining existing approaches and methodologies, we highlight the significance of existing works, identify gaps, and contextualize how our research contributes to this field.
2.1. Standard Authoring Workflow Phases in LAR System
In practice, authoring content in a LAR system typically involves three sequential phases for structured content deployments in real-world environments. They are: (1) POI location acquisition, (2) AR object creation, and (3) AR object registration [,,], as illustrated in Figure 1.
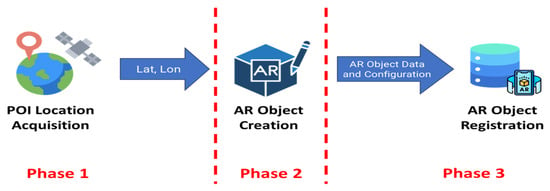
Figure 1.
Three-phase AR authoring workflow: (1) POI location acquisition, (2) AR object creation, and (3) AR object registration.
The POI location acquisition phase involves determining the geographic coordinates (latitude and longitude) of a physical point of interest in the targeted real-world environment. Accurate location acquisition is critical, as it provides the spatial anchor for subsequent LAR content placement.
The AR object creation phase requires the author to select or design digital AR objects, such as directional markers, text labels, or 3D models, and associates them with semantic or navigational meaning. Tasks include labeling the object, adjusting orientation and scale, and visually aligning it with the intended spatial context.
The last AR object registration phase involves anchoring the created AR object to the physical world using the acquired coordinates and storing it in a persistent database.
Collectively, these phases workflow ensure that the LAR content is contextually bound and retrievable for future AR experiences at the same POI location in the outdoor environment [,,].
2.2. Authoring Tools in Outdoor LAR System
The development of efficient authoring tools in outdoor LAR systems is essential for facilitating the rapid creation of virtual content in physical environments. The evolution of authoring tools can generally be classified into two categories: conventional desktop-based environments and in-situ mobile platforms. Each approach offers distinct advantages and limitations in terms of usability, interaction modality, and spatial accuracy [,].
2.2.1. Desktop-Based AR Authoring Tools
Desktop-based AR authoring tools have traditionally been the mainstream AR development environment, offering extensive functionalities and integration with existing 3D content creation pipelines. Authoring platforms, such as Unity3D with ARCore SDK or Vuforia, provide high degrees of control over 3D assets, anchor placement, and interaction design [].
In Ref. [], Cavallo et al. introduced CAVE-AR, a toolkit designed to help designers quickly prototype immersive AR visualizations using both programmatic and graphical user interfaces in a virtual reality environment. However, it remains a desktop-based solution that often produces horizontal inaccuracy in real-world experience, which may not be ideal for real-time debugging. Furthermore, CAVE-AR lacks the capability to extract real-world information to support real-time creations of AR contents.
In Ref. [], Radkowski et al. noted that most AR prototyping tools lack direct interaction with the real environment, which limits the spatial accuracy of anchor placement and real-time feedback. The desktop workflow is inherently detached from the physical deployment context. This disconnection necessitates multiple iterations of outdoor testing to validate object alignment and user perspective, thereby increasing development time and effort.
In Ref. [], Ashtari et al. ran an observational study with 12 software developers to assess how they approach the initial AR creation processes using a desktop-based authoring tool. They emphasize that the desktop environments often require a combination of technical skills, including scripting, asset management, and coordinate system calibration, which introduces a steep learning curve for novice developers.
2.2.2. In-Situ Mobile LAR Authoring
The in-situ mobile LAR authoring tools offer the capability to create and edit LAR content directly in the deployment environment using smartphones or tablets. This approach leverages the real-time sensing capabilities of mobile devices, including camera input, GPS, and inertial measurement units (IMU), to enhance contextual awareness and streamline the authoring process. However, recent works in the in-situ mobile tool are still limited to indoor implementation, and mostly have not introduced spatial interaction mechanisms based on 6DoF device movement [,,,].
In Refs. [,], Mercier et al. introduced an outdoor authoring tool called BiodivAR. Unfortunately, the GNSS accuracy issues occurred, leading to imprecise AR object alignment and placements. Inaccurate AR anchor point information could confuse users, resulting in poor user experiences [].
In Ref. [], our previous work introduced an in-situ authoring tool for outdoor LAR applications and demonstrated its efficiency compared to traditional desktop-based workflows. While initial results showed reduced authoring time, further comparative analysis was required to quantify phase-wise performance.
This paper extends prior work by performing a detailed evaluation of authoring performance across POI acquisition, AR object creation, and registration phases. By comparing desktop and mobile authoring in a real-world setting, we provide new insights into task efficiency and user behavior in outdoor LAR systems.
2.3. Visual-Inertial Sensor Fusion in Outdoor LAR Authoring Tools
Some studies support the use of visual-inertial fusion and visual references such as GSV to enhance outdoor AR localization. In this paper, we adopted VSLAM/GSV image matching as a visual reference layer. This fusion enables improved anchor precision for outdoor LAR without relying solely on Global Navigation Satellite System (GNSS) signals, making the system robust in cluttered or GPS-inconsistent environments.
In Ref. [], Stranner et al. integrate GPS, IMU, and visual SLAM for urban outdoor mapping to address drift and noise issues in GPS-denied areas. While the method improves overall localization stability, the system’s complexity makes it less suitable for lightweight mobile deployment.
In Ref. [], Sumikura et al. present OpenVSLAM, a flexible visual SLAM framework optimized for monocular camera systems. Its adaptability and real-time tracking performance have made it suitable for AR applications on mobile devices. However, it lacks built-in support for large-scale outdoor localization and requires external modules for persistent anchoring.
In Ref. [], Graham et al. investigate the use of GSV as a visual reference database to improve urban AR localization. They demonstrate that matching real-time camera input with GSV imagery can substantially enhance localization accuracy. Nonetheless, real-time constraints and dependency on image database updates remain challenging for dynamic environments.
2.4. LAR Authoring Tool Performance and Experience Measurement
Recent studies have mentioned that the investigation of user performance and experiences in LAR authoring tools can reveal critical insights into the effectiveness and usability of these tools.
In Ref. [], Lacoche et al. provided a comprehensive evaluation on user experience and scene correctness of authoring AR content from free-form text through an in-person survey.
In Ref. [], Lee et al. conduct a performance evaluation of AR systems focusing on rendering delays and registration accuracy. Their findings highlight the impact of hardware constraints on user interaction but do not examine the full authoring workflow.
In Ref. [], Mercier et al. design a usability framework based on a fine-tuned Vision Transformer (ViT) model to measure AR authoring tools, incorporating factors such as task completion time, satisfaction, and ease of use. However, the study only quantifies participants’ dwell time when using a mobile augmented reality application for biodiversity education and does not consider the cognitive workload during the test.
2.5. User Cognitive Workload in LAR Systems
The NASA-TLX questionnaire is a well-known assessment tool to analyze the cognitive workload in various systems, including the mobile AR application. Several factors, such as user performance and mental demand, can be analyzed to understand their correlation with usability and user experience [,].
In Ref. [], Jeffri et al. conducted a comprehensive review on the effects of mental workload and task performance in various AR systems. They employ NASA-TLX and find that spatial complexity significantly increases user workload. However, the study does not distinguish between authoring and consumption tasks.
In Ref. [], Mokmin et al. analyze the cognitive impact of AR in educational environments. Their findings suggest that well-designed AR interfaces can reduce cognitive effort, but the focus remains on learner experiences rather than developer workflows.
In Ref. [], Wang et al. introduce a gesture-based AR authoring system and observe that natural input modalities can reduce perceived task difficulty. Nonetheless, their work is limited to indoor spaces and does not include environmental variables like lighting or terrain.
3. LAR Authoring Tools for Experiments
In this section, we briefly introduce our previous work on the in-situ authoring tool and the desktop authoring tool setup used in this comparative study.
3.1. In-Situ Mobile Tool Setup
The in-situ authoring tool is designed to address the limitations of conventional desktop-based workflows by enabling direct content creation in outdoor environments through a smartphone interface. This tool combines visual-inertial sensors with map-based image references to improve localization accuracy. Specifically, it integrates VSLAM as the primary localization engine with a collection of GSV 360 images as a reference source for visual matching.
The spatial accuracy of our in-situ authoring tool relies on the integration of VSLAM with Google Street View (GSV) image matching. The technical evaluation and quantitative accuracy of this localization pipeline have been thoroughly validated in our prior work []. In this study, we do not re-examine the localization accuracy; instead, we focus on a comparative evaluation of the authoring process between desktop and in-situ tools. This distinction allows us to emphasize user-centered performance and workload aspects, while acknowledging that the localization module provides the foundation for reliable geospatial anchoring.
3.1.1. Overview of VSLAM and GSV Integration in LAR System
The VSLAM component performs local pose tracking by extracting and matching key features across frames using a monocular camera and fusing them with inertial data from the smartphone’s IMU. This allows the tool to estimate the user’s 6DoF pose in real-time. The system periodically retrieves and compares the real-time scene with pre-captured GSV imagery to enhance the global localization precision using a keypoint descriptor matching process. When a high-confidence matching is found, the system re-aligns the user’s pose with georeferenced GSV coordinates to reduce drift and reinforce anchor placement accuracy. This hybrid method supports robust and scalable AR object registration in dynamic outdoor environments, as previously demonstrated in our works [,].
3.1.2. Implementation of In-Situ LAR Authoring System
To support the authoring performance comparison between in-situ and desktop tools, we redeveloped our previous prototype, powered by the ARCore SDK on the Android platform. Building upon our previous work in [], the current system architecture has been enhanced with the integration of the authoring state observer technology to capture the completion time of each authoring state and an AR data management module to provide various predefined 3D asset selections.
The in-situ mobile authoring tool adopts a cloud-based, microservice architecture that leverages smartphone sensors, Google ARCore SDK for AR rendering, VSLAM for localization, and cloud services for processing geospatial data from Google Maps, Google Earth, and GSV. It receives three primary inputs from the smartphone: (1) Camera feed for visual data, (2) IMU (accelerometer and gyroscope) for inertial data, and (3) GPS for initial positioning. The mobile AR authoring interface integrates several core components, including Map View, AR Camera, and the 3D Assets module. The GPS and IMU sensors provide geospatial coordinates and device orientation, while an event handler continuously tracks user actions, and the Authoring State Observer monitors the current state of the authoring workflow. Additionally, the user provides interactive inputs through touch-based UI elements and a 6DoF placement control mechanism to adjust the LAR content. The application also fetches reference imagery from Google Street View through a remote API request based on the device’s initial coordinates.
The VSLAM module extracts features and estimates the user’s pose in real time using keypoint tracking and local map generation. To improve localization accuracy, the system matches live camera frames with the most relevant GSV image segment. Once a POI location is acquired, users can select predefined 3D objects and adjust their positions using smartphone orientations (roll, pitch, yaw). The system uses the Geospatial API and Cloud Anchor API to determine a precise anchor location in AR space. The ARCore SDK facilitates the creation and hosting of Cloud Anchors, generating unique Cloud Anchor IDs associated with each POI.
Once an AR object is placed, the system registers it as a structured dataset containing AR object ID, 3D coordinates (latitude, longitude, and altitude), object type, user orientation (quaternion), and each phase timestamp. This metadata is then stored and uploaded to a Dockerized database hosted on the SEMAR server infrastructure []. The use of Docker ensures a scalable and containerized deployment environment, enabling efficient management and retrieval of anchor data through a REST API in JavaScript Object Notation (JSON) format []. Figure 2 illustrates the detailed system architecture of our in-situ LAR authoring system.
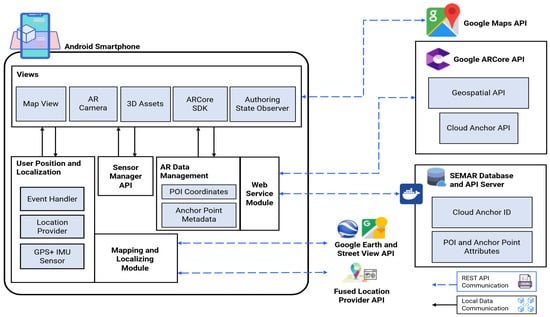
Figure 2.
The improved LAR authoring system architecture, extending our previous study [].
The in-situ mobile LAR authoring tool has three main user interfaces: (1) Map View, which displays the current location and nearby POIs with registered AR objects in 2D presentation; (2) Authoring Scene, where users can visualize the real-world scene and manipulate AR objects using intuitive 6DoF spatial controls; and (3) Review Scene, which allows confirmation and editing of placed objects before final registration. Screens are optimized for minimal interaction steps, quick anchor acquisition, and real-time previewing. Step-by-step instructions are also provided in each phase to assist users during the creation process. Screenshots of developed interfaces are shown in Figure 3.
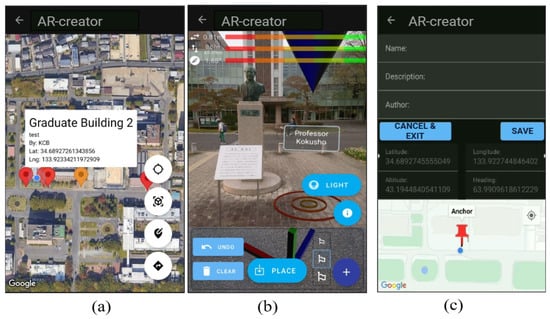
Figure 3.
User interfaces of the in-situ authoring tool, showing (a) 2D map interface, (b) AR creator scene, and (c) POI data registration (adapted from []).
3.2. Desktop Authoring Tool Setup
For performance comparison purposes, we implemented a desktop-based authoring environment using the Unity3D Engine integrated with the ARCore SDK to simulate standard practices in LAR content creation. This system setup follows the conventional workflow used in many AR development pipelines, where virtual content is authored in a simulated 3D environment before outdoor deployment.
The desktop setup enables users to define a POI by manually entering geospatial coordinates (latitude, longitude, and altitude) into the Unity scene. Virtual objects are then placed in relation to the coordinates using a traditional mouse-and-keyboard interface. Object positioning, scaling, and rotation are handled through inspector properties or scene gizmos. To preview alignment and placement, users can simulate AR camera movements within the Unity editor, although this does not replicate environmental conditions such as lighting, occlusion, or real-world scale perception.
This workflow requires repeated iterations between the desktop environment and the physical deployment for verification, which increases the time and cognitive effort involved in authoring. Moreover, metadata, including object orientation, anchor ID, and environment descriptors, must be entered manually, often requiring referencing maps or GPS tools outside the Unity environment.
The desktop authoring system is used as a baseline one in this study to evaluate the performance, task efficiency, and cognitive workload of outdoor LAR content creation in comparison to the in-situ mobile tool. This comparison allows us to assess differences in spatial interaction, interface intuitiveness, and development friction across the two platforms. A screenshot of the desktop authoring interface is shown in Figure 4.
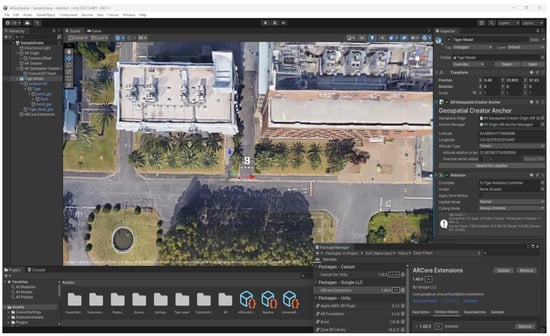
Figure 4.
User interface of Unity with ARCore extension in desktop authoring tool.
3.3. Key Differences in Interaction Models
The primary distinction between the two authoring tools lies in the mode of spatial interaction used to position and register an LAR content. In the desktop-based environment, users manipulate 3D objects using indirect inputs, primarily by mouse and keyboard controls, to adjust their positions, rotations, and scales within a simulated scene. This model depends on visual estimations within a virtual 3D viewport and requires manual entries of geospatial metadata for accurate placements. As a result, spatial understanding is often abstracted and disconnected from the real deployment context, requiring external validation.
In contrast, our in-situ mobile authoring tool enables direct interactions within the physical environment. Users utilize their smartphone’s 6DoF movement and motion tracking to align AR objects in the real-world environment. This tool captures the user’s camera feed and integrates IMU data to support intuitive, direct hands-on placements. The smartphone movement and orientation (roll, pitch, and yaw) are translated into real-world spatial coordinates (X, Y, Z) for the precise AR object placement and rotation, with constraints based on the detected surface anchor. The vertical (Y-axis movement) of the AR object is constrained to the ground or a detected surface to maintain realism. To move the AR object along the horizontal plane (X-axis), the smartphone’s roll orientation is utilized. The depth movement or translation along the Z-axis is managed using the smartphone’s pitch. Tilting the device forward or backward translates the virtual object deeper or closer to the user’s point of view.
Figure 5 illustrates how the mouse motion, and the smartphone movement and orientation (roll, pitch, and yaw) are translated into real-world spatial coordinates (X, Y, Z) for precise AR object placement, emphasizing the contrast between indirect and direct spatial manipulation paradigms.
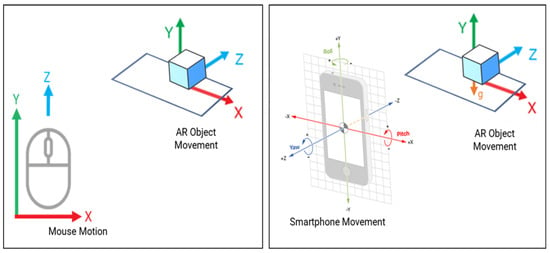
Figure 5.
AR object placement and configuration in desktop−based authoring (left) and in−situ mobile authoring (right, adapted from []).
4. Experimental Methodology
In this section, we outline the overall experimental methodology employed to compare the usability, authoring efficiency, and cognitive workload between an in-situ mobile LAR authoring tool and a conventional desktop-based tool. The design aims to assess performance across distinct authoring phases in real-world outdoor settings.
4.1. User Study Experimental Design
The experiment adopts a within-subjects design. Participants were asked to complete the same authoring tasks using both the desktop-based and in-situ tools. A total of 20 participants aged 22 to 35 years old from Brawijaya University, Indonesia, and Okayama University, Japan, were involved in this study, consisting of both experienced LAR developers and novices. As highlighted by Nielsen [], involving approximately 15 users will offer a practical trade-off between test coverage and resource efficiency.
Participants are randomly assigned to one of two groups to counterbalance order effects to mitigate learning effects. Group A (n = 10) started with the desktop-based tool, and Group B (n = 10) started with the in-situ mobile authoring tool. To account for potential technological bias, each group was balanced to include five novice users (0–1 year of experience with Unity and ARCore) and five experienced users (>3 years). This design allowed us to examine not only expert proficiency but also the usability learning curve effects among non-experts. None of the participants had experience with our tool before this study. This approach is consistent with prior HCI and AR usability research, where including both novice and expert participants has been shown to provide a more comprehensive understanding of system performance and adoption challenges [,].
Following an introductory session, each participant was given a maximum of 15 min to complete the task scenarios using each tool in a controlled outdoor environment. Participants were instructed to place AR objects at predefined outdoor locations using both the desktop and in-situ tools, simulating real-world LAR content creation. To minimize learning effects, the order of the tool usage was counterbalanced. Participants were allowed to rest between sessions and, if needed, conduct the second session on a different day for independent performance and reducing fatigue. Descriptive statistics were employed to analyze the data, providing insights into the effectiveness of the proposed tool for AR object creation. Task success rate and completion time were used as performance metrics to evaluate the tool. After completing all the tasks, the participants filled out a post-study questionnaire to assess the cognitive workload of both authoring tools. The overall experimental design is illustrated in Figure 6.
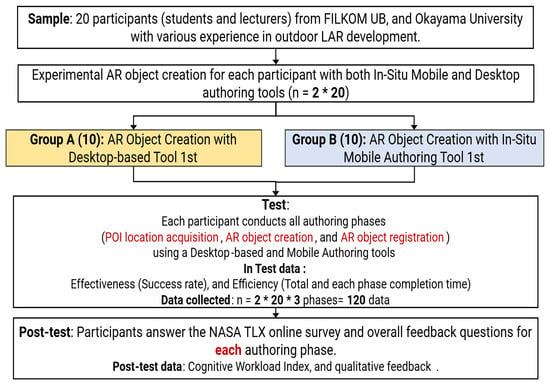
Figure 6.
Experimental design of comparison test.
In total, 120 data points were collected (20 participants × 2 tools × 3 phases). Performance was evaluated in Effectiveness (task success rate), and Efficiency (AR object creation time). After the tests, participants completed a NASA-TLX questionnaire to evaluate cognitive workload for each phase, along with qualitative feedback.
4.2. Hardware Setup for Data Collection
To minimize the adaptation time and simulate the real deployment conditions, the LAR authoring tool was installed on the participant’s smartphones with a minimum Android operating system. Each testing smartphone enables the GPS, camera, IMU sensors, and an active Internet connection.
For the desktop authoring tool, data collections were performed using a Personal Computer (PC) with key specifications as shown in Table 1.

Table 1.
Specification of PC used in this study.
4.3. Testing Locations and Environments
For this comparison study, several urban settings and landmarks at Universitas Brawijaya, Indonesia, and Okayama University, Japan, were used for POI locations. Each testing location was carefully prepared, ensuring GPS data and GSV services were available. The testing session was conducted between 10:00 AM to 5:00 PM to ensure the availability of proper lighting conditions.
4.4. Data Collection and Procedure
We conducted a two-stage user testing protocol for both Group A and Group B. Each participant is required to complete a single LAR content authoring task using both the in-situ mobile and desktop-based authoring tools. The task guideline was adopted from Google Lab hands-on for ARCore creation [], which consists of creating one AR object at a designated POI in an outdoor campus environment as seen in Table 2. They need to complete all three authoring phases for each AR object creation using both tools. Each phase is independently timed and observed to assess completion time, task complexity, and participant interaction efficiency. Data logging mechanisms include screen recordings, and time-tracking scripts were used to collect quantitative data.

Table 2.
User testing task scenario.
While the active participants were carrying out the tasks, their behaviours were observed, and the issues that arose or were experienced by the users were noted. Data on the anchor location, the success rate, the number of AR objects created, and completion times were collected at each testing session.
Figure 7 compares the POI location acquisition phase between the desktop and in-situ authoring workflows. In the desktop approach (left), users must manually obtain geographic coordinates from external sources such as Google Maps and input them into Unity using a georeferencing plugin, introducing extra steps and potential localization errors. In contrast, the in-situ mobile tool (right) automates this process by leveraging built-in GPS and visual-inertial sensors with VSLAM/GSV enhancement to detect the device’s location in real-time. Users simply follow in-app instructions to scan the environment, after which the system automatically creates a cloud anchor at the current position.
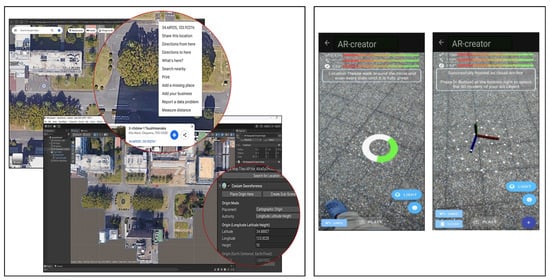
Figure 7.
Phase 1: POI location acquisition in desktop-based authoring (left) and in-situ mobile authoring (right).
Figure 8 illustrates the AR object selection and placement process in both desktop-based and in-situ tools. On the left, the desktop one requires users to manually configure AR objects within Unity, including setting geospatial coordinates and orientation parameters through an inspector panel. In contrast, the in-situ one (right) enables users to directly place AR objects in the physical environment through an intuitive 6DoF object alignment control. Users can browse a list of available 3D assets, then configure them on the scene with real-time feedback. This simplified selection and placement process supports rapid prototyping and lowers the technical barrier for LAR content creation.
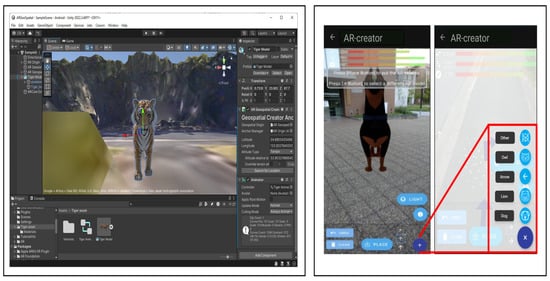
Figure 8.
Phase 2: AR creation screen sample in desktop-based authoring (left) and in-situ mobile authoring (right).
The experimental condition in Figure 9 shows the end-to-end AR data submission workflow in both authoring tools. On the left, the Unity backend needed a hardcoded AR object metadata in a JSON structure. On the right, the in-situ mobile provides generated data from the previous authoring phase in an editable form interface after placing and confirming an AR object. Users can then enter descriptive metadata through the form, while a map preview displays the anchor location.
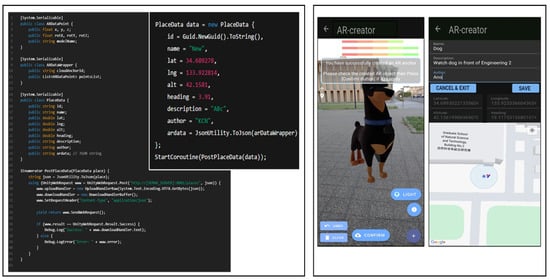
Figure 9.
Phase 3: AR registration screen sample in desktop-based authoring (left) and in-situ mobile authoring (right).
4.5. Post-Test Survey and Questionnaire
Upon completion of the testing scenarios in each authoring tool, the participants filled out the NASA-TLX questionnaire to quantitatively assess the cognitive workload during the authoring process. It assesses cognitive workload across six dimensions: mental demand, physical demand, temporal demand, performance, effort, and frustration. The participants completed the survey immediately after using each tool. Each dimension is rated from 0 to 10 by participants []. The series of NASA-TLX questionnaires used in this study is shown in Table 3.

Table 3.
NASA-TLX’s dimensions and definitions used in this study.
5. Experiment Results and Analysis
In this section, we conducted the descriptive statistics analysis and the significance difference factor analysis for data that were found to meet the statistical assumption of a parameter test (including the NASA-TLX). The two-way ANOVA test was used to evaluate the authoring performance by comparing the task completion by the participants in each authoring phase.
5.1. Task Completion Times Comparison
Table 4 presents a comparative summary of task completion time (in seconds) between the desktop tool and the in-situ tool across three subtasks: (1) POI location acquisition, (2) AR object creation, and (3) AR object registration. The results show that the in-situ mobile tool outperformed the desktop tool in terms of efficiency, with a markedly lower mean total time (50.1 ± 6.06 s) compared to the desktop tool (490.45 ± 184.44 s). All the participants completed the mobile-based tasks, whereas four participants asked for additional step guidance to fully complete the task in the desktop tool. This finding highlights the superior usability and time efficiency of the mobile authoring approach, suggesting its suitability for real-time and intuitive LAR content creation.
5.2. Phase Contribution Comparison
Through the phase contribution comparison, we analyze how each of the three authoring phases (POI Location Acquisition, AR Object Creation, and AR Object Registration) contributes to the overall task completion time across two authoring tools. By isolating the time spent in each phase, this comparison aims to identify which phase is most time-consuming and how the tool and the user group influence the authoring performance at a more granular level. This analysis provides deeper insights into where efficiency gains are realized when using the in-situ mobile authoring tool compared to the desktop one. Table 5 shows the average of phase-wise time contribution from all participants.

Table 4.
Result summary of task completion time (seconds).
Table 4.
Result summary of task completion time (seconds).
| Respondent | Experienced | Group | Desktop Authoring Tool | In-Situ Mobile Authoring Tool | ||||||||
|---|---|---|---|---|---|---|---|---|---|---|---|---|
| Complete Task | POI Location Aquisition | AR Object Creation | AR Object Registration | Total Time | Complete Task | POI Location Aquisition | AR Object Creation | AR Object Registration | Total Time | |||
| R1 | Yes | A | Yes | 136 | 132 | 124 | 392 | Yes | 25 | 15 | 8 | 48 |
| R2 | Yes | B | Yes | 108 | 146 | 119 | 373 | Yes | 28 | 18 | 4 | 50 |
| R3 | No | A | Yes | 185 | 238 | 148 | 571 | Yes | 29 | 17 | 8 | 54 |
| R4 | Yes | A | Yes | 90 | 122 | 123 | 335 | Yes | 25 | 15 | 6 | 46 |
| R5 | Yes | B | Yes | 89 | 109 | 129 | 327 | Yes | 28 | 16 | 5 | 49 |
| R6 | No | A | Yes | 193 | 189 | 134 | 516 | Yes | 39 | 19 | 7 | 65 |
| R7 | Yes | A | Yes | 93 | 115 | 119 | 327 | Yes | 24 | 16 | 5 | 45 |
| R8 | No | B | Yes | 186 | 220 | 157 | 563 | Yes | 37 | 14 | 5 | 56 |
| R9 | Yes | B | Yes | 87 | 109 | 121 | 317 | Yes | 25 | 14 | 5 | 44 |
| R10 | Yes | A | Yes | 86 | 108 | 118 | 312 | Yes | 25 | 12 | 6 | 43 |
| R11 | Yes | B | Yes | 92 | 107 | 122 | 321 | Yes | 26 | 14 | 6 | 46 |
| R12 | No | B | Yes | 189 | 132 | 147 | 468 | Yes | 27 | 18 | 4 | 49 |
| R13 | Yes | B | Yes | 64 | 107 | 119 | 290 | Yes | 22 | 14 | 5 | 41 |
| R14 | Yes | A | Yes | 75 | 129 | 122 | 326 | Yes | 26 | 16 | 4 | 46 |
| R15 | No | B | Partial | 225 | 388 | 191 | 804 | Yes | 35 | 20 | 6 | 61 |
| R16 | No | A | Yes | 146 | 391 | 141 | 678 | Yes | 31 | 18 | 6 | 55 |
| R17 | No | A | Partial | 337 | 297 | 152 | 786 | Yes | 29 | 17 | 8 | 54 |
| R18 | No | A | Yes | 168 | 268 | 148 | 584 | Yes | 28 | 16 | 9 | 53 |
| R19 | No | B | Partial | 253 | 306 | 193 | 752 | Yes | 26 | 17 | 5 | 48 |
| R20 | No | B | Partial | 246 | 334 | 187 | 767 | Yes | 28 | 16 | 5 | 49 |
| Mean ± SD | 490.45 ± 184.44 | 50.1 ± 6.06 | ||||||||||

Table 5.
Phase-wise time contribution of both authoring tools.
Table 5.
Phase-wise time contribution of both authoring tools.
| Tool | Avg. POI Location Aquisition (%) | Avg. AR Object Creation (%) | Avg. AR Object Registration (%) |
|---|---|---|---|
| Dekstop | 30 | 39 | 31 |
| In-Situ Mobile | 56 | 32 | 12 |
This phase-wise time contribution revealed that the mobile tool shifts the time burden from the manual input and verification to be more intuitive and real-time spatial interactions. In the desktop tool, the workload and difficulty are more evenly distributed across all the phases (POI Location Acquisition: 30%, AR Object Creation: 39%, AR Object Registration: 31%), because users needed to manually input geospatial data, configure the object properties, and verify created object placement. They are time-consuming and cognitively demanding.
Conversely, in the in-situ mobile method, more processing time is allocated to the POI location acquisition phase (56%) to ensure accurate localizations through device sensors, environment scanning, and sensor fusion. This upfront effort aims to enhance the localization accuracy, enabling automation and simplifying subsequent phases such as AR object placement and registration, ultimately leading to more efficient overall content creation.
Figure 10 presents a two-way ANOVA analysis comparing task completion time across two authoring tools (desktop and in-situ) and two user groups (Groups A and B) for three authoring phases. The results indicate a statistically significant main effect of the tool type in all phases (F > 53.5, p < 0.001), with the in-situ tool consistently yielding substantially faster completion times than the desktop tool. Conversely, the group factor was not significant (p > 0.05 in all cases), suggesting that the counterbalance group scenario can prevent the learning effect from influencing the user performance. These findings demonstrate that the efficiency benefits of the in-situ mobile tool are consistent across all the participants with various experience levels.
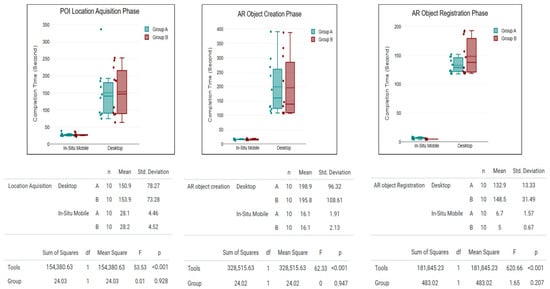
Figure 10.
ANOVA results of phase contribution across groups and authoring phases.
5.3. NASA-TLX Scores per Authoring Phase Analysis
We employed the weights of factors in the NASA-TLX questionnaire results to accurately assess the relative contribution of different workload dimensions to the overall perceived workload during the tasks. In the NASA-TLX method, weights are calculated using pairwise comparisons to capture the relative importance of each dimension component. These weights are used in subsequent calculations to compute a weighted average workload score for each participant in each authoring phase. This approach ensures that the most impactful dimensions have a proportionally greater influence on the final workload assessment, leading to more accurate and meaningful interpretations of how the different navigation systems affect user effort and mental load [].
Table 6 shows the weight contribution used in this study. Each dimension receives a weight from highest (5) to lowest (0), depending on how relevant it is to the task. The highest weight (5) indicates the most relevant subscale, and the lowest (0) indicates the least relevant dimension to the authoring task. This weight emphasizes the predominance of mental demand, task performance, and physical workload, as this study focused on the mental workload and authoring task performance of the participants. Conversely, dimensions such as time pressure are given no weight, indicating a lesser direct influence within our experimental setup. The weighting system aligns with the principles outlined in prior researches, where dimensions related to mental effort and task performance are prioritized due to their significant impacts on users’ performance and experience outcomes [].

Table 6.
Weights of dimensions in NASA-TLX questionnaire.
To calculate each participant’s overall NASA-TLX weighted workload score, we used the standard weighted average method, as shown in Equation (1). Each dimension’s raw rating (on a 0–10 scale) was multiplied by its corresponding predefined weight, then normalized by the total sum of weights.
where is the raw rating score for the i-th NASA-TLX dimension, and is the predefined weight for that dimension based on data in Table 6. This formulation ensures that more influential dimensions contribute proportionally to the overall workload score.
The t-test was used to analyze the significance of each workload dimension mean value from each authoring tool across all the authoring phases. As shown in Table 7, the p-values (p < 0.05) indicate significant differences between the two authoring tools, while the Cohen’s d values [] reveal consistently large to very large effects across all NASA-TLX dimensions.

Table 7.
Result summary of NASA-TLX scores.
5.4. Participant Feedback and Comments
Qualitative responses revealed that the participants generally appreciated the intuitive interaction design of the mobile in-situ authoring tool. Many of them highlighted its seamless flow and natural smartphone gestures for authoring AR objects, describing it as user-friendly even for those with no prior AR development experience. One participant commented, “The app guides me naturally through the process of placing AR objects—it just makes sense”, while another noted, “It feels like painting in the real world; I can instantly see and adjust my AR objects in context”. Participant R4 praised the prototype’s intuitiveness but suggested adding more predefined 3D assets for user experience. Meanwhile, R8, R17, and R20, who had no AR development background, said the app’s features made authoring straightforward and proposed adding an onboarding screen for first-time users. These comments align with the quantitative data.
5.5. Discussion
In this paper, we address a critical research gap concerning the comparative performance, interaction modalities, and cognitive workloads between in-situ mobile and desktop LAR authoring tools, while most previous works mainly focus on emphasizing technical developments [,,]. The findings of this study demonstrate that the in-situ mobile tool can provide more intuitive authoring workflows and significantly enhance the efficiency of outdoor LAR content creations by enabling faster AR object placement with 60% lower cognitive load, compared to a traditional desktop-based tool. The in-situ mobile tool’s superiority in reducing cognitive workloads (as in Table 7) is a direct consequence of its 6DoF spatial interaction, automated and streamlined authoring workflow, and intuitively designed interface with explicit in-app guidance. All of them collectively enhance efficiency and user experiences. The result also aligns with our previous research that highlights the in-situ mobile AR tool provided better user experiences compared to a traditional desktop one for pedestrian navigation scenarios [].
While the mobile tool offers clear advantages in usability and immediacy, desktop-based tools retain notable strengths for complex authoring tasks. Experienced participants highlighted that desktops are better suited for managing large 3D assets due to their larger displays and mainstream mouse–keyboard controls, which enable superior visualization and editing. Prior studies, such as BigSUR’s city-scale AR framework with multi-user synchronization [], LagunAR’s large-scale heritage reconstruction overlays [], and vision-based AR for construction management using dense point clouds [], demonstrate scenarios where mobile devices face critical bottlenecks. In such cases, the limitations of screen size, touch-based input, and constrained processing power can reduce the authoring performance compared to desktop environments.
Our approach emphasizes lightweight, field-based authoring directly on mobile devices, making our in-situ authoring tool particularly suitable for everyday users in navigation and educational AR scenarios involving simple 3D objects across large-scale areas. However, this study was limited to outdoor campus settings with a small participant pool (n = 20), which may not fully reflect diverse real-world conditions.
Since our in-situ authoring tool is based on the VSLAM/GSV module, factors such as unpredictable lighting variable, dynamics pedestrian traffic, and varied terrain could influence authoring performances in less controlled environments. Our previous work evaluated the effect of natural light and weather conditions on the VSLAM/GSV approach across four scenarios: daylight, overcast, rainy, and low-light []. The results indicated no significant performance gap, even in rainy conditions, as long as sufficient illumination was available. More importantly, we identified a minimum illumination threshold (in lx) required for stable localization, showing that light intensity is the dominant factor rather than weather alone. Weather conditions such as heavy rain or dense cloud coverage can possibly reduce illumination, which in turn affects localization. Similarly, high-rise buildings can possibly cause multipath GPS errors and limit the reliability of Google Street View (GSV) retrieval. These factors are critical because real-world LAR deployments often occur in diverse outdoor environments where lighting, weather, and urban density cannot be controlled []. Despite of the after mentioned limitations, the obtained results in this study are valid to answer our research question and support our findings.
This study also underscores the potential of the in-situ mobile authoring tool to democratize LAR content creation and support crowd-sourced LAR development. By lowering technical barriers, it enables non-experts to contribute AR data collaboratively through a shared database, promoting scalable implementations in tourism, navigation, entertainment, and education. Future works should improve the in-situ tool for advanced 3D editing and conduct systematically large-scale validation studies across diverse outdoor AR scenarios and dynamic settings to evaluate its robustness and applicability. New analysis of the in-situ LAR authoring tool, including the correlation between the number of AR objects and frame rate (FPS), may offer insights to improve workflow efficiency.
6. Conclusions
This study presented valuable insights into the user’s authoring performance through comparisons between the in-situ mobile tool and the desktop-based authoring tool for LAR contents creation. The results showed that the participants using the in-situ mobile tool completed the authoring tasks faster and reported 60% lower NASA-TLX cognitive workload levels. A notable weakness of the in-situ tool is its limited capability to manage large-sized 3D content compared to the desktop-based solution. Since this research examined the authoring performance and cognitive workloads with a limited dataset on pedestrian landmark annotation and navigation scenarios, broader investigations will be necessary to extend our findings. Future works should aim to expand the implementation scope to cover more robust outdoor use case scenarios and investigate better frameworks to refine the efficiency and effectiveness of in-situ authoring tools for diverse real-world applications.
Author Contributions
Conceptualization, K.C.B. and N.F.; methodology, K.C.B. and N.F.; software, K.C.B. and N.; visualization, K.C.B. and P.A.R.; investigation, K.C.B., H.H.S.K., and M.M.; writing—original draft, K.C.B.; writing—review and editing, N.F.; supervision, N.F. All authors have read and agreed to the published version of the manuscript.
Funding
This research received no external funding.
Institutional Review Board Statement
Ethical review and approval were waived for this study as involving humans is only for obtaining the real user location coordinates and authoring performances during the testing phases to validate the feasibility of our developed system.
Informed Consent Statement
Informed consent was obtained from all participants before being included in the study.
Data Availability Statement
Data are contained within the article.
Acknowledgments
We would like to thank all the colleagues in the Distributing System Laboratory at Okayama University and FILKOM at Universitas Brawijaya who were involved in this study.
Conflicts of Interest
The authors declare no conflicts of interest.
Abbreviations
The following abbreviations are used in this manuscript:
| AR | Augmented Reality |
| LAR | Location-based Augmented Reality |
| SDK | Software Development Kits |
| POI | Point of Interest |
| VSLAM | Visual Simultaneous Localization and Mapping |
| GSV | Google Street View |
| GPS | Global Positioning System |
| IMU | Inertial Measurement Unit |
| GNSS | Global Navigation Satellite System |
| TLX | Task Load Index |
| DOF | Degree of freedom |
References
- Scholz, J.; Smith, A.N. Augmented reality: Designing immersive experiences that maximize consumer engagement. Bus. Horizons 2016, 59, 149–161. [Google Scholar] [CrossRef]
- Brata, K.C.; Liang, D. An effective approach to develop location-based augmented reality information support. Int. J. Electr. Comput. Eng. 2019, 9, 3060. [Google Scholar] [CrossRef]
- da Silva Santos, J.E.; Magalhães, L.G.M. QuizHuntAR: A location-based Augmented Reality game for education. In Proceedings of the 2021 International Conference on Graphics and Interaction (ICGI), Porto, Portugal, 4–5 November 2021; pp. 1–8. [Google Scholar] [CrossRef]
- Nebeling, M.; Speicher, M. The trouble with augmented reality/virtual reality authoring tools. In Proceedings of the 2018 IEEE International Symposium on Mixed and Augmented Reality Adjunct (ISMAR-Adjunct), Munich, Germany, 16–20 October 2018; pp. 333–337. [Google Scholar] [CrossRef]
- Blanco-Pons, S.; Carrión-Ruiz, B.; Duong, M.; Chartrand, J.; Fai, S.; Lerma, J.L. Augmented Reality markerless multi-image outdoor tracking system for the historical buildings on Parliament Hill. Sustainability 2019, 11, 4268. [Google Scholar] [CrossRef]
- Cheliotis, K.; Liarokapis, F.; Kokla, M.; Tomai, E.; Pastra, K.; Anastopoulou, N.; Bezerianou, M.; Darra, A.; Kavouras, M. A systematic review of application development in augmented reality navigation research. Cartogr. Geogr. Inf. Sci. 2023, 50, 249–271. [Google Scholar] [CrossRef]
- Fajrianti, E.D.; Funabiki, N.; Sukaridhoto, S.; Panduman, Y.Y.F.; Dezheng, K.; Shihao, F.; Surya Pradhana, A.A. INSUS: Indoor navigation system using Unity and smartphone for user ambulation assistance. Information 2023, 14, 359. [Google Scholar] [CrossRef]
- Syed, T.A.; Siddiqui, M.S.; Abdullah, H.B.; Jan, S.; Namoun, A.; Alzahrani, A.; Nadeem, A.; Alkhodre, A.B. In-depth review of augmented reality: Tracking technologies, development tools, AR displays, collaborative AR, and security concerns. Sensors 2022, 23, 146. [Google Scholar] [CrossRef] [PubMed]
- Brata, K.C.; Funabiki, N.; Panduman, Y.Y.F.; Mentari, M.; Syaifudin, Y.W.; Rahmadani, A.A. A proposal of in situ suthoring tool with visual-inertial sensor fusion for outdoor location-based augmented reality. Electronics 2025, 14, 342. [Google Scholar] [CrossRef]
- Brata, K.C.; Funabiki, N.; Sukaridhoto, S.; Fajrianti, E.D.; Mentari, M. An investigation of running load comparisons of ARCore on native Android and Unity for outdoor navigation system using smartphone. In Proceedings of the 2023 Sixth International Conference on Vocational Education and Electrical Engineering (ICVEE), Surabaya, Indonesia, 14–15 October 2023; pp. 133–138. [Google Scholar] [CrossRef]
- Brata, K.C.; Funabiki, N.; Panduman, Y.Y.F.; Fajrianti, E.D. An enhancement of outdoor location-based augmented reality anchor precision through VSLAM and Google Street View. Sensors 2024, 24, 1161. [Google Scholar] [CrossRef]
- Liu, H.; Zhao, L.; Peng, Z.; Xie, W.; Jiang, M.; Zha, H.; Bao, H.; Zhang, G. A low-cost and scalable framework to build large-scale localization benchmark for augmented reality. IEEE Trans. Circuits Syst. Video Technol. 2023, 34, 2274–2288. [Google Scholar] [CrossRef]
- Brata, K.C.; Funabiki, N.; Riyantoko, P.A.; Panduman, Y.Y.F.; Mentari, M. Performance investigations of VSLAM and Google Street View integration in outdoor location-based augmented reality under various lighting conditions. Electronics 2024, 13, 2930. [Google Scholar] [CrossRef]
- Baker, L.; Ventura, J.; Langlotz, T.; Gul, S.; Mills, S.; Zollmann, S. Localization and tracking of stationary users for augmented reality. Vis. Comput. 2024, 40, 227–244. [Google Scholar] [CrossRef]
- Chatzopoulos, D.; Bermejo, C.; Huang, Z.; Hui, P. Mobile augmented reality survey: From where we are to where we go. IEEE Access 2017, 5, 6917–6950. [Google Scholar] [CrossRef]
- Huang, K.; Wang, C.; Shi, W. Accurate and robust rotation-invariant estimation for high-precision outdoor AR geo-registration. Remote. Sens. 2023, 15, 3709. [Google Scholar] [CrossRef]
- Sadeghi-Niaraki, A.; Choi, S.M. A survey of marker-less tracking and registration techniques for health & environmental applications to augmented reality and ubiquitous geospatial information systems. Sensors 2020, 20, 2997. [Google Scholar] [CrossRef]
- Ma, Y.; Zheng, Y.; Wang, S.; Wong, Y.D.; Easa, S.M. A virtual method for optimizing deployment of roadside monitoring lidars at as-built intersections. IEEE Trans. Intell. Transp. Syst. 2023, 24, 11835–11849. [Google Scholar] [CrossRef]
- Wang, Z.; Nguyen, C.; Asente, P.; Dorsey, J. Distanciar: Authoring site-specific augmented reality experiences for remote environments. In Proceedings of the 2021 CHI Conference on Human Factors in Computing Systems, Yokohama, Japan, 7–17 May 2021; pp. 1–12. [Google Scholar] [CrossRef]
- Xu, X.; Wang, P.; Gan, X.; Sun, J.; Li, Y.; Zhang, L.; Zhang, Q.; Zhou, M.; Zhao, Y.; Li, X. Automatic marker-free registration of single tree point-cloud data based on rotating projection. Artif. Intell. Agric. 2022, 6, 176–188. [Google Scholar] [CrossRef]
- Satkowski, M.; Luo, W.; Dachselt, R. Towards in-situ authoring of ar visualizations with mobile devices. In Proceedings of the 2021 IEEE International Symposium on Mixed and Augmented Reality Adjunct (ISMAR-Adjunct), Bari, Italy, 4–8 October 2021; pp. 324–325. [Google Scholar] [CrossRef]
- Langlotz, T.; Mooslechner, S.; Zollmann, S.; Degendorfer, C.; Reitmayr, G.; Schmalstieg, D. Sketching up the world: In situ authoring for mobile augmented reality. Pers. Ubiquitous Comput. 2012, 16, 623–630. [Google Scholar] [CrossRef]
- Vidal-Balea, A.; Blanco-Novoa, Ó.; Fraga-Lamas, P.; Fernández-Caramés, T.M. Developing the next generation of augmented reality games for pediatric healthcare: An open-source collaborative framework based on ARCore for implementing teaching, training and monitoring applications. Sensors 2021, 21, 1865. [Google Scholar] [CrossRef]
- Cavallo, M.; Forbes, A.G. Cave-AR: A VR authoring system to interactively design, simulate, and debug multi-user AR experiences. In Proceedings of the 2019 IEEE Conference on Virtual Reality and 3D User Interfaces (VR), Osaka, Japan, 23–27 March 2019; pp. 872–873. [Google Scholar] [CrossRef]
- Radkowski, R.; Herrema, J.; Oliver, J. Augmented reality-based manual assembly support with visual features for different degrees of difficulty. Int. J. Hum. Comput. Interact. 2015, 31, 337–349. [Google Scholar] [CrossRef]
- Ashtari, N.; Chilana, P.K. How new developers approach augmented reality development using simplified creation tools: An observational study. Multimodal Technol. Interact. 2024, 8, 35. [Google Scholar] [CrossRef]
- Palmarini, R.; Del Amo, I.F.; Ariansyah, D.; Khan, S.; Erkoyuncu, J.A.; Roy, R. Fast augmented reality authoring: Fast creation of AR step-by-step procedures for maintenance operations. IEEE Access 2023, 11, 8407–8421. [Google Scholar] [CrossRef]
- Zhu-Tian, C.; Su, Y.; Wang, Y.; Wang, Q.; Qu, H.; Wu, Y. Marvist: Authoring glyph-based visualization in mobile augmented reality. IEEE Trans. Vis. Comput. Graph. 2019, 26, 2645–2658. [Google Scholar] [CrossRef]
- Wang, T.; Qian, X.; He, F.; Hu, X.; Huo, K.; Cao, Y.; Ramani, K. CAPturAR: An augmented reality tool for authoring human-involved context-aware applications. In Proceedings of the 33rd Annual ACM Symposium on User Interface Software and Technology, Virtual, 20–23 October 2020; pp. 328–341. [Google Scholar] [CrossRef]
- Whitlock, M.; Mitchell, J.; Pfeufer, N.; Arnot, B.; Craig, R.; Wilson, B.; Chung, B.; Szafir, D.A. MRCAT: In situ prototyping of interactive AR environments. In Proceedings of the International Conference on Human-Computer Interaction, Gothenburg, Sweden, 22–27 June 2020; pp. 235–255. [Google Scholar] [CrossRef]
- Mercier, J.; Chabloz, N.; Dozot, G.; Ertz, O.; Bocher, E.; Rappo, D. BiodivAR: A cartographic authoring tool for the visualization of geolocated media in augmented reality. ISPRS Int. J. Geo-Inf. 2023, 12, 61. [Google Scholar] [CrossRef]
- Mercier, J.; Chabloz, N.; Dozot, G.; Audrin, C.; Ertz, O.; Bocher, E.; Rappo, D. Impact of geolocation data on augmented reality usability: A comparative user test. Int. Arch. Photogramm. Remote. Sens. Spat. Inf. Sci. 2023, 48, 133–140. [Google Scholar] [CrossRef]
- Suriya, S. Location based augmented reality–GeoAR. J. IoT Soc. Mobile, Anal. Cloud 2023, 5, 167–179. [Google Scholar] [CrossRef]
- Stranner, M.; Arth, C.; Schmalstieg, D.; Fleck, P. A high-precision localization device for outdoor augmented reality. In Proceedings of the 2019 IEEE International Symposium on Mixed and Augmented Reality Adjunct (ISMAR-Adjunct), Beijing, China, 10–18 October 2019; pp. 37–41. [Google Scholar] [CrossRef]
- Sumikura, S.; Shibuya, M.; Sakurada, K. OpenVSLAM: A versatile visual SLAM framework. In Proceedings of the 27th ACM International Conference on Multimedia, Nice, France, 21–25 October 2019; pp. 2292–2295. [Google Scholar] [CrossRef]
- Graham, M.; Zook, M.; Boulton, A. Augmented reality in urban places: Contested content and the duplicity of code. Mach. Learn. City Appl. Archit. Urban Des. 2022, 341–366. [Google Scholar] [CrossRef]
- Lacoche, J.; Villain, E.; Foulonneau, A. Evaluating usability and user experience of AR applications in VR simulation. Front. Virtual Real. 2022, 3, 881318. [Google Scholar] [CrossRef]
- Lee, D.; Shim, W.; Lee, M.; Lee, S.; Jung, K.D.; Kwon, S. Performance evaluation of ground ar anchor with webxr device api. Appl. Sci. 2021, 11, 7877. [Google Scholar] [CrossRef]
- Mercier, J.; Ertz, O.; Bocher, E. Quantifying dwell time with location-based augmented reality: Dynamic AOI analysis on mobile eye tracking data with vision transformer. J. Eye Mov. Res. 2024, 17, 10–16910. [Google Scholar] [CrossRef]
- Vidal-Balea, A.; Fraga-Lamas, P.; Fernández-Caramés, T.M. Advancing NASA-TLX: Automatic User Interaction Analysis for Workload Evaluation in XR Scenarios. In Proceedings of the 2024 IEEE Gaming, Entertainment, and Media Conference (GEM), Turin, Italy, 5–7 June 2024; pp. 1–6. [Google Scholar] [CrossRef]
- De Paolis, L.T.; Gatto, C.; Corchia, L.; De Luca, V. Usability, user experience and mental workload in a mobile Augmented Reality application for digital storytelling in cultural heritage. Virtual Real. 2023, 27, 1117–1143. [Google Scholar] [CrossRef]
- Jeffri, N.F.S.; Rambli, D.R.A. A review of augmented reality systems and their effects on mental workload and task performance. Heliyon 2021, 7, e06277. [Google Scholar] [CrossRef]
- Mokmin, N.A.M.; Hanjun, S.; Jing, C.; Qi, S. Impact of an AR-based learning approach on the learning achievement, motivation, and cognitive load of students on a design course. J. Comput. Educ. 2024, 11, 557–574. [Google Scholar] [CrossRef]
- Wang, T.; Qian, X.; He, F.; Hu, X.; Cao, Y.; Ramani, K. Gesturar: An authoring system for creating freehand interactive augmented reality applications. In Proceedings of the The 34th Annual ACM Symposium on User Interface Software and Technology, Virtual, 10–14 October 2021; pp. 552–567. [Google Scholar] [CrossRef]
- Panduman, Y.Y.F.; Funabiki, N.; Puspitaningayu, P.; Kuribayashi, M.; Sukaridhoto, S.; Kao, W.C. Design and implementation of SEMAR IOT server platform with applications. Sensors 2022, 22, 6436. [Google Scholar] [CrossRef]
- Kaiser, S.; Haq, M.S.; Tosun, A.Ş.; Korkmaz, T. Container technologies for arm architecture: A comprehensive survey of the state-of-the-art. IEEE Access 2022, 10, 84853–84881. [Google Scholar] [CrossRef]
- Nielsen, J. How Many Test Users in a Usability Study? 2012. Available online: https://www.nngroup.com/articles/how-many-test-users/ (accessed on 11 January 2025).
- Awan, A.B.; Mahmood, A.W.; Sabahat, N. Enhancing user experience: Exploring mobile augmented reality experiences. VFAST Trans. Softw. Eng. 2024, 12, 121–132. [Google Scholar] [CrossRef]
- Vyas, S.; Dwivedi, S.; Brenner, L.J.; Pedron, I.; Gabbard, J.L.; Krishnamurthy, V.R.; Mehta, R.K. Adaptive training on basic AR interactions: Bi-variate metrics and neuroergonomic evaluation paradigms. Int. J. Hum. Comput. Interact. 2024, 40, 6252–6267. [Google Scholar] [CrossRef]
- Google Developers-Get started with Geospatial Creator for Unity. Available online: https://developers.google.com/codelabs/arcore-unity-geospatial-creator#0 (accessed on 11 January 2025).
- Virtanen, K.; Mansikka, H.; Kontio, H.; Harris, D. Weight watchers: NASA-TLX weights revisited. Theor. Issues Ergon. Sci. 2022, 23, 725–748. [Google Scholar] [CrossRef]
- Kosch, T.; Karolus, J.; Zagermann, J.; Reiterer, H.; Schmidt, A.; Woźniak, P.W. A survey on measuring cognitive workload in human-computer interaction. ACM Comput. Surv. 2023, 55, 1–39. [Google Scholar] [CrossRef]
- Babaei, E.; Dingler, T.; Tag, B.; Velloso, E. Should we use the NASA-TLX in HCI? A review of theoretical and methodological issues around Mental Workload Measurement. Int. J. Hum. Comput. Stud. 2025, 201, 103515. [Google Scholar] [CrossRef]
- Bakker, A.; Cai, J.; English, L.; Kaiser, G.; Mesa, V.; Van Dooren, W. Beyond small, medium, or large: Points of consideration when interpreting effect sizes. Educ. Stud. Math. 2019, 102, 1–8. [Google Scholar] [CrossRef]
- Brata, K.C.; Funabiki, N.; Mentari, M.; Fajrianti, E.D. A comparative study on user experiences between in-situ mobile and desktop-based tools for location-based augmented reality content authoring. In Proceedings of the 2025 International Conference on Electrical Engineering and Information Systems (CEEIS), Bali, Indonesia, 28 February–2 March 2025; pp. 8–12. [Google Scholar] [CrossRef]
- Kelly, T.; Femiani, J.; Wonka, P.; Mitra, N.J. BigSUR: Large-scale structured urban reconstruction. ACM Trans. Graph. (TOG) 2017, 36, 1–16. [Google Scholar] [CrossRef]
- Sánchez Berriel, I.; Pérez Nava, F.; Albertos, P.T. LagunAR: A city-scale mobile outdoor augmented reality application for heritage dissemination. Sensors 2023, 23, 8905. [Google Scholar] [CrossRef] [PubMed]
- Jia, S.; Liu, C.; Wu, H.; Guo, Z.; Peng, X. Towards accurate correspondence between BIM and construction using high-dimensional point cloud feature tensor. Autom. Constr. 2024, 162, 105407. [Google Scholar] [CrossRef]
- Paton, M.; Pomerleau, F.; MacTavish, K.; Ostafew, C.J.; Barfoot, T.D. Expanding the limits of vision-based localization for long-term route-following autonomy. J. Field Robot. 2017, 34, 98–122. [Google Scholar] [CrossRef]
Disclaimer/Publisher’s Note: The statements, opinions and data contained in all publications are solely those of the individual author(s) and contributor(s) and not of MDPI and/or the editor(s). MDPI and/or the editor(s) disclaim responsibility for any injury to people or property resulting from any ideas, methods, instructions or products referred to in the content. |
© 2025 by the authors. Licensee MDPI, Basel, Switzerland. This article is an open access article distributed under the terms and conditions of the Creative Commons Attribution (CC BY) license (https://creativecommons.org/licenses/by/4.0/).