Article

Enhancing Walking Accessibility in Urban Transportation: A Comprehensive Analysis of Influencing Factors and Mechanisms

School of Transportation, Southeast University, Nanjing 211189, China
*
Author to whom correspondence should be addressed.
Information 2023, 14(11), 595; https://doi.org/10.3390/info14110595
Submission received: 28 August 2023 / Revised: 12 October 2023 / Accepted: 30 October 2023 / Published: 2 November 2023

Abstract

:
The rise in “urban diseases” like population density, traffic congestion, and environmental pollution has renewed attention to urban livability. Walkability, a critical measure of pedestrian friendliness, has gained prominence in urban and transportation planning. This research delves into a comprehensive analysis of walking accessibility, examining both subjective and objective aspects. This study aims to identify the influencing factors and explore the underlying mechanisms driving walkability within a specific area. Through a questionnaire survey, residents’ subjective perceptions were gathered concerning various factors such as traffic operations, walking facilities, and the living environment. Structural equation modeling was employed to analyze the collected data, revealing that travel experience significantly impacts perceived accessibility, followed by facility condition, traffic condition, and safety perception. In the objective analysis, various types of POI data served as explanatory variables, dividing the study area into grids using ArcGIS, with the Walk Score® as the dependent variable. Comparisons of OLS, GWR and MGWR demonstrated that MGWR yielded the most accurate fitting results. Mixed land use, shopping, hotels, residential, government, financial, and medical public services exhibited positive correlations with local walkability, while corporate enterprises and street greening showed negative correlations. These findings were attributed to the level of development, regional functions, population distribution, and supporting facility deployment, collectively influencing the walking accessibility of the area. In conclusion, this research presents crucial insights into enhancing walkability, with implications for urban planning and management, thereby enriching residents’ walking travel experience and promoting sustainable transportation practices. Finally, the limitations of the thesis are discussed.

1. Introduction

Modern urban planning often prioritizes functional zoning, focusing primarily on developing and constructing spaces for production and industry, sometimes neglecting the city’s essential role as a living space for its inhabitants. In recent years, a rise in “urban diseases” such as population density, traffic congestion, and environmental pollution has compelled society to reevaluate the livability of cities for human well-being. This has led to a renewed focus on the quality of life for urban dwellers.
Japan, as a pioneer, introduced the concept of the “living circle”. This concept represents a fundamental unit designed to meet the daily work and life needs of residents within a reasonable walking distance. Moreover, it aims to cater to both the material and spiritual needs of inhabitants, taking into consideration the well-being of individuals of all ages [1]. Carlos Moreno advocated the “15-minute city” concept, emphasizing that cities should be developed in a way that allows residents to access all essential amenities within a 15 min walk or bike ride [2]. The community living circle emphasizes a more humane and personalized design, integrating functions such as work, life, recreation, and transportation to create a convenient and comfortable living environment while also providing novel ideas and directions for sustainable urban development. Wei et al. highlighted the ideal living space characteristics, including moderate scale, high walkability, open and inclusive public spaces, and convenient transportation based on the balance of supply and demand [3].
Walkability refers to the pedestrian friendliness of the built environment and serves as a measure of how effectively it encourages walking. Studying walkability plays a critical role for urban and transportation planners in creating more pedestrian-friendly cities. Moreover, improving walkability proves to be an effective way to encourage residents to walk more, thereby maintaining their physical and mental health. Hence, it becomes meaningful to study walking accessibility. He et al. quantified walkability based on four pedestrian needs: safety, convenience, continuity, and attractiveness [4]. Ha et al. studied the walkability characteristics of TRIS’ first and last miles using household travel survey data from Seoul’s metropolitan area [5]. Xiao et al. conducted a spatial analysis of survey data collected across the United States to assess the spatial accessibility of National Park System units for different racial groups, considering the relationship between limited spatial accessibility, marginalization, subcultural differences, and discrimination [6]. Other experts utilized the walkability index calculation to conduct walkability analysis and provide insights for future urban construction and transportation planning [7,8].
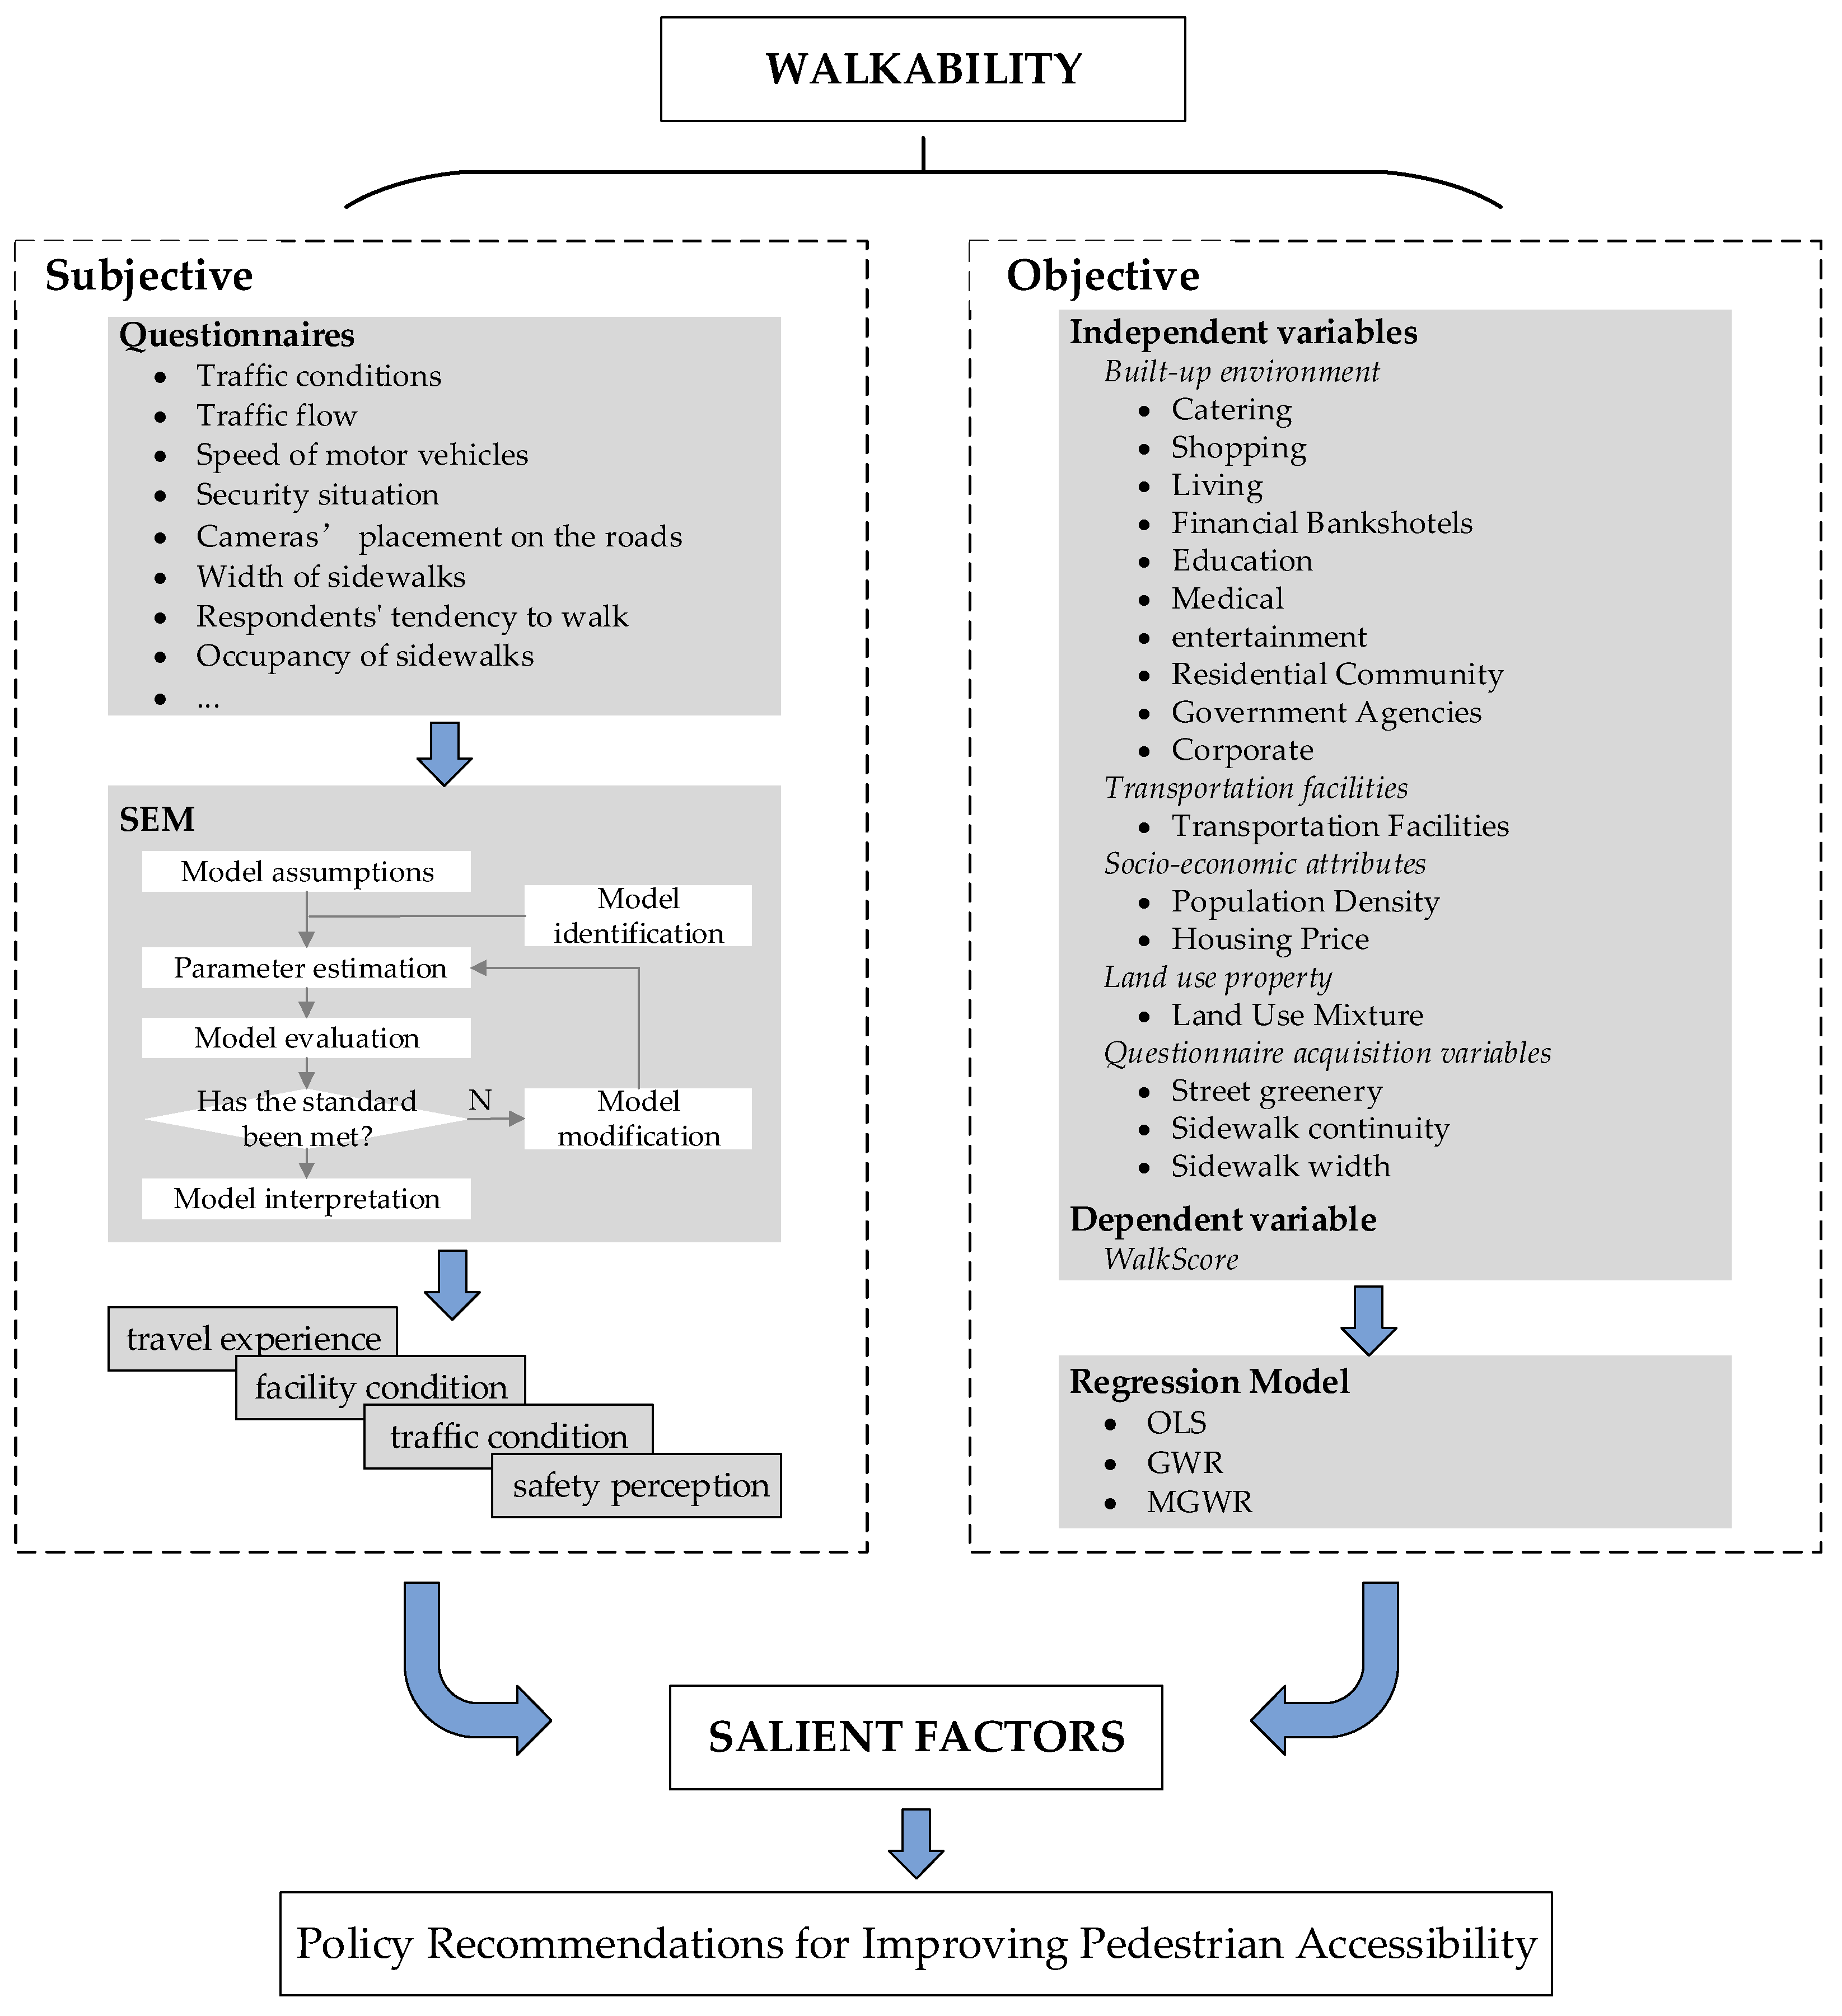
In previous studies, scholars have actively discussed resident walkability from subjective and objective perspectives. This article aims to provide a comprehensive analysis of the influencing mechanisms, using Nanning City as an example. In this paper, we focus on Nanning as the study area. Firstly, we conducted a questionnaire survey based on the perceived walkability of daily service facilities in the community living circle. Subsequently, we developed a structural equation model (SEM) to investigate the relationship between different latent variables and their effects on the perceived walkability of daily service facilities. To study the factors influencing walkability at the objective level, we established least squares regression, geographically weighted regression, and multiscale geographically weighted regression models, using the walk score as the dependent variable and considering built environment, land use, and questionnaire-acquired variables as independent variables. Analyzing the heterogeneity of each explanatory variable in spatial distribution based on the regression results allowed us to re-examine the factors affecting walkability. This analysis has important implications for optimizing residents’ walking trips, improving overall satisfaction, and establishing a more livable city.
The article’s novelty is demonstrated through its comprehensive investigation of the factors influencing walking accessibility in urban transportation. This investigation includes an examination of various subjective factors, such as personal attribute variables, attitudes towards travel experiences, facilities, traffic conditions, safety perceptions, and perceived accessibility. The analysis utilizes a SEM to establish a causal relationship between these factors and regression models to assess objective conditions. The resulting analysis provides targeted policy recommendations and reveals that subjective and objective factors interact with each other, rather than being completely independent. These findings provide crucial insights into enhancing walkability, with significant implications for urban planning and management.
The rest of the paper is organized as follows. Section 2 presents the literature review to organize the current research and methodology and summarize the factors that influence pedestrians’ perception of the walking environment. Section 3 elucidates the methodology, encompassing details on the questionnaire design, introduction to structural equation model (SEM) and regression models, as well as the statistical analysis conducted. Section 4 presents the data and results, encompassing the descriptive data analysis, assessment of the reliability and validity of the measurement model, model fit testing, and visual display of the findings. Section 5 is the discussion, which contains the interpretation of some of the results and policy recommendations based on the results. Section 6 concludes the paper by offering a summary and highlighting this study’s limitations.

2. Literature Review

2.1. Walking Perceived Accessibility

Accessibility plays a crucial role in various aspects, including the evaluation and design of public transportation systems. It enables individuals to engage in social interactions and participate in activities that mitigate social exclusion, discrimination [9,10], and enhance overall well-being [11]. Despite the introduction of the accessibility concept as early as the 1950s [12], perceived accessibility has often been neglected [13]. Perceived accessibility refers to the ease with which individuals can attain life satisfaction through the transportation system [14]. It serves as a complementary approach to the conventional and objective accessibility studies. Objective measures may not adequately capture accessibility in terms of life experiences and feelings [15].
Among the factors affecting the use of transportation systems, a growing number of scholars recognize that people’s participation in daily activities depends on their perception of the safety [16,17] and quality [18] of transportation services. Appropriate facility design can promote walking without compromising safety and convenience [19,20]. Frimann et al. argued that perceived accessibility is closely linked to perceptions of safety and service quality [21]. The level of pedestrian satisfaction with walking accessibility is closely linked to the perceived ease of access to daily living facilities, which are necessary for fulfilling walking needs in urban environments. Table 1 presents a comprehensive list of factors identified in various studies that have an impact on the perceived walkability.

2.2. Study of Objective Influences on Walking Accessibility

Walkability is influenced by various objective factors, mainly divided into dimensions such as the built environment, policy, and socioeconomic attributes. Researchers used estimated least squares regression and geographically weighted regression models (GWR) to study the relationship between service accessibility and sociodemographic and environmental variables [34,35,36]. Duncan et al. demonstrated that Walk Score® effectively estimates neighborhood walkability across multiple geographic locations and spatial scales [37]. Because of its effectiveness and affordability, perhaps not surprisingly, use and acceptance of Walk Score® as a means to assess walkability has increased over time. However, Walk Score primarily emphasizes the proximity to amenities while disregarding other crucial facets of pedestrian accessibility. There exist diverse conceptualizations and definitions of walkability, and researchers have examined various factors associated with it. Consequently, most studies refrain from solely relying on Walk Score® as the sole measure of walkability. Instead, they incorporate additional indicators to provide a more comprehensive assessment [38]. Wang et al. proposed a spatial probit model of commuters’ mode choice (cycling versus noncycling), considering spatial autocorrelation [39]. Scholars have also focused on walkability inequality in urban community living circles and explored its relationship with disadvantaged groups within communities from spatial and statistical perspectives [40]. Xu et al. argued that significant social inequalities in park accessibility exist under public transport, walking, and cycling modes [41]. Imran et al. analyzed three social indicators of health, education, and municipal facilities using global and local Moran indices [42]. The results of their study will aid policy-makers in prioritizing resources to achieve spatial and opportunity equality.

3. Methods

In this paper, urban walkability is discussed comprehensively from both subjective and objective aspects, and its technical route is shown in Figure 1.

3.1. Questionnaire Design

RP and SP survey methods are two commonly used methods for investigating transportation behaviors. RP survey methods are based on observing behaviors that have already occurred and can provide reliable data regarding actual behaviors. On the other hand, SP survey methods obtain people’s subjective willingness and preferences through questionnaires, which can offer insights into decision-making processes and potential behaviors. In this paper, we aim to obtain information about respondents’ subjective attitudes, preferences, and willingness by presenting a series of scenarios and choices. Respondents will then be able to express their preferences within the virtual scenarios. Therefore, we chose to utilize SP survey methods to collect data for this research.
Based on the literature review, a comprehensive set of 25 variables that may influence people’s perceived walkability were identified. These variables were further examined through a questionnaire survey, which aimed to assess the perceived walking accessibility of various living services within the community’s residential area. The questionnaire comprises two sections: a personal attribute survey and a perceived walkability survey. The personal attribute variables encompass gender, age, occupation, monthly income, household car ownership, district. The assessment of perceived walkability refers to the residents’ satisfaction level with the facilities available within a 15 min walking distance during their daily trips. Drawing on the previous literature, this study identified 25 factors that influence perceived walkability. Each factor was evaluated using a five-point Likert scale with the following options: very satisfied, satisfied, average, not very satisfied, and very dissatisfied. The questions of the survey are shown in Table 2.

3.2. Structural Equation Modeling

Structural equation modeling (SEM) can incorporate various sources of data, including survey data obtained in this study. The data include both observable and unobservable variables. SEM can simultaneously analyze the relationships between these variables, providing a thorough and comprehensive analysis. SEM is able to validate the researcher’s hypotheses and identify causal relationships between variables, which can inform policy recommendations. Additionally, SEM models can be evaluated for their quality using goodness-of-fit measures, enhancing the model’s explanatory power and reliability. Its first application dates back to 1980 when it was used to study travel behavior, and subsequently, it has found application in various other fields [31].
In this study, variables are categorized into two types: latent and manifest variables. Manifest variables are directly measurable and obtained through observation. On the other hand, latent variables cannot be directly observed in the model but are measured indirectly through observable indicators. For instance, residential travel satisfaction is challenging to obtain directly through observation. However, it is feasible to quantify users’ perceptions of the convenience and comfort of various transportation modes, and establish the relationship between these variables and satisfaction.
SEM consists of two main components: a measurement model and a structural model [43,44]:
(1) Structural model describing the relationship between latent variables:
η = B η + Γ ξ + ζ
where η is the endogenous latent variable (dependent variable), ξ is the exogenous latent variable (independent variable), B is the structural coefficient matrix of the relationship between the endogenous latent variable, Γ is the structural coefficient matrix of the relationship between the exogenous latent variables and the endogenous latent variables, and ζ is the residual term.
(2) Measurement model describing the correlation between latent variables and explicit variables:
X = Λ X ξ + δ Y = Λ Y η + ε
where η is the endogenous latent variable, ξ is the exogenous latent variable, X is the indicator variable for ξ , Y is the indicator variable for η , Λ X is the factor loading of the indicator variable X , Λ Y is the factor loading of the indicator variable Y , and δ and ε are the measurement errors of epistatic variables.
In this paper, we employ SEM to explore the factors that influence perceived walkability accessibility and to examine the direct and indirect relationships between the variables. The SEM process consists of five key components: model assumptions, parameter estimation, model evaluation, model modification, and model interpretation.

3.3. Regression Model

Theoretically, OSL, GWR and MGWR can all analyze the relationship between objective geographical environment factors and walk score, but the accuracy is different. Among them, the GWR model offer a departure from traditional linear regression models by incorporating nonsmooth spatial relationships through the adaptation of coefficients across various locations [45]. GWR generates distinct local models for each location, unveiling diverse spatial associations between the dependent variable and independent variables [46]. MGWR is an optimization model of GWR that can be used to explore the spatial relationship between the dependent variable and independent variables. Its advantage is that it considers the spatial scale differences of various spatial factors. Here is a brief introduction to GWR and MGWR. The accuracy of these methods is compared in the subsequent chapters of the data analysis.

3.3.1. Geographically Weighted Regression Model (GWR)

The expression of the GWR model is as follows:
y i = β 0 ( u i , v i ) + j = 1 m β j ( u i , v i ) x i j + ε i ,   i = { 1 , 2 , , n }
where n is the number of areas divided, m is the number of independent variables, ( u i , v i ) are the coordinates of the regression analysis point i , β 0 ( u i , v i ) is the intercept coefficient at i , x i j is the j-th independent variable at i , β j ( u i , v i ) is the local coefficient of the j-th independent variable at i , ε i is the error term, y i is the dependent variable.
The estimates of the local coefficients can be obtained by the following equation:
β ^ ( u i , v i ) = [ X T W ( u i , v i ) X ] 1 X T W ( u i , v i ) y
where X is the independent variable matrix m × n ; W ( u i , v i ) is the weight matrix at i , related to the distance between the observations; β ^ ( u i , v i ) is the coefficient vector, y is the vector of observations of the dependent variable.
A spatial kernel function is used to generate the weight matrix for a set of observations. It has been demonstrated that different kernel functions cause only slight variations in the results [45]. In this paper, the Gaussian kernel function is used:
W i j = exp ( d i j / b ) 2 2
where W i j is the weight the value of points near location j for local regression location i , d i j is the distance between i and j , and b is the fixed bandwidth.
Bandwidth is also critical to the results of the GWR model, as it significantly affects the generation of the weight matrix. To obtain the best bandwidth values, existing studies commonly use the golden partition search solution. It narrows the range of candidate bandwidth values by iterations to minimize the adjusted Akaike information criterion ( A I C c ) value, which can be calculated using the following equation:

3.3.2. Multiscale Geographically Weighted Regression Model (MGWR)

The general form of the model is as follows:
y i = j = 1 m β b w j i x i j + ε i
where b w j i is the bandwidth used to calibrate the j-th independent variable.
Unlike GWR, MGWR repeatedly determines the bandwidth of each dependent variable. In the MGWR established in this paper, the spatial kernel function is Bisquare function:
W i j = 1 ( d i j / b ) 2 2 ,   w h e n   j N i 0 ,   w h e n   j N i
where N i is the set of points adjacent to the target point, and b is the threshold distance determined by the farthest neighboring point within N i . If the distance between point j and point i exceeds the threshold distance, W i j is set to zero.
Based on existing studies [47], the threshold value is set to 10 5 in this study. All MGWR models are constructed and calibrated in this paper using MGWR software https://sgsup.asu.edu/sparc/multiscale-gwr.

3.3.3. Variable Selection

Based on previous research [34,36], walkability is influenced by a range of factors such as the built environment, transportation facilities, socioeconomic attributes, and land use mix. In this study, we adopt an approach using ArcGIS to create multiple 500 m × 500 m fishnet grids. With these grids, we employ OLS, GWR and MGWR to examine the various factors affecting walkability.
Walkability as the dependent variable represented by the single-point walk score at the center point of the unit fishnet. The single-point walk score is calculated as follows:
W a l k S c o r e = i = 1 n ( w i ( 1 S i ) ( 1 C r i ) ( 1 R d i ) ) i = 1 n W i × 100
where i is the different types of living service facilities, W i is the weight corresponding to service facility i , w i is the weight corresponding to the different categories of services that people can reach within the specified walking interval at that point, S i is the distance attenuation coefficient from this point to facility i , C r i is the intersection density attenuation coefficient within the specified walking distance interval, and R d i is the road network density attenuation coefficient within the specified walking distance interval.
Prior to constructing the regression model, we performed tests for a multicollinearity and spatial autocorrelation analysis using the SPSS software https://www.ibm.com/spss. Multicollinearity was assessed using the variance inflation factor (VIF). Spatial autocorrelation, which refers to the presence of interdependence between independent variables within a particular region, was examined using Moran’s I test to assess whether the model residuals exhibited spatial autocorrelation.

4. Data and Results

4.1. Study Area

Nanning City is situated in the southern central region of Guangxi Zhuang Autonomous Region. Its topography is characterized by hills and mountains in the north and a comparatively flat terrain in the south, with the Yong River flowing through the central part and cutting across the urban area. As of the end of 2021, the city had a resident population of 8,832,800. The total area of Nanning City is 22,100 km2, and it currently encompasses twelve urban areas, one of which is Qingxiu District [48], as depicted in Figure 2.
Qingxiu District is situated in the southeast of Nanning City and holds a prominent position as one of the core urban areas within Nanning. The administrative division of Qingxiu District is illustrated in Figure 3. The choice of Qingxiu District as the focal point of this research holds significant importance for Nanning’s urban development and transportation planning.

4.2. Data Preparation

Point of interest (POI) data encompass a wide range of facilities in a city’s built environment, reflecting the diverse activities in residents’ daily lives, such as learning, working, resting, recreation, and shopping. For this study, we utilized Python programming software https://www.python.org/doc/versions/ and accessed the Place API interface in Amap to acquire POI data for Nanning. The obtained POI data include various facility types, such as food service, shopping service, and road accessory facilities, totaling 17 categories. To facilitate the analysis, we further classified these POI data into eight categories: residential services, catering services, living services, leisure services, transportation services, medical services, education services, and shopping services. This categorization is based on the community life circle planning and design guidelines, as well as existing research results.
As for the road network data, we obtained them from OpenStreetMap (OSM), encompassing various types of road networks such as highways, urban expressways, national roads, provincial roads, county roads, and pedestrian roads. To support subsequent road network modeling and research, we found out all roads that contain sidewalks, providing a solid basis for our analysis.

4.3. Questionnaire Results

The questionnaire survey was conducted in Nanning, utilizing an online questionnaire format. Out of the 473 questionnaires received, 415 were deemed valid, resulting in a valid return rate of 87.74% (Figure 4).
Figure 5 displays the percentage of residents’ average discretionary time on weekdays and holidays. The figure reveals that the majority of residents have 2 to 6 h of discretionary time on weekdays and 4 to 8 h on holidays. This indicates that during holidays, residents have more time available for non-work activities, such as leisure and recreation.
Figure 6 provides insights into the average number of daily trips made by residents for their daily activities, along with the distribution of reasons hindering their walking trips. The data illustrate that a significant proportion of residents typically make up to three daily trips. Notably, the factors with the most substantial influence on hindering walking trips are identified as lack of time, lack of energy, and limited economic conditions.
Daily life travel holds significant importance for residents, and various external and psychological factors can influence their perceived walkability. Therefore, it becomes crucial to thoroughly investigate the impact of these factors on residents’ perception of walkability concerning life-service facilities. Additionally, exploring the differences in behavioral preferences and facility needs among residents is equally vital.

4.4. Subjective Impact Analysis of Walkability and Structural Equation Model (SEM)

4.4.1. Measurement Model

The reliability and validity analysis results of the measurement model are presented in Table 3. For the reliability analysis, both Cronbach’s α and composite reliability (C.R.) values were employed. The obtained Cronbach’s α values ranged from 0.768 to 0.794, and the C.R. values ranged from 0.733 to 0.816, indicating strong internal reliability for each structure studied.
To establish convergent validity, we calculated the average variance extracted (AVE) and factor loadings. The factor loadings for all factors were greater than 0.6, and the AVE values exceeded 0.5. These results suggest that the measurement instruments exhibit acceptable horizontal convergence validity.
For the results of discriminant validity, the correlation coefficients among the perceived walkability variables are all less than 0.5 and less than the square root of the corresponding AVE. These outcomes suggest that the variables related to the perceived walkability are both correlated and sufficiently differentiated, affirming the ideal discriminant validity of the measurement scale.

4.4.2. Model Results

Based on the correlation analysis and model path adjustment, a total of seven paths are identified: CE → PA, FA → PA, TC → PA, SP → PA, FA → CE, TC → CE, and SP → CE. The factors influencing perceived accessibility are ranked in descending order as follows: travel experience, facilities, traffic condition, and safety perception, with their corresponding coefficients shown in Figure 7.
Notably, travel experience exerts the most significant impact on the perceived walkability of travelers. This finding suggests that providing a positive travel experience is instrumental in enhancing perceived walkability. Improving street cleanliness, implementing more convenient guidance signs, and reducing congestion and travel time contribute to a favorable travel experience. Moreover, well-maintained roadway facilities, such as continuous sidewalks, amenities, and appealing landscaping, are associated with improved pedestrian perceived accessibility. Additionally, unobstructed sidewalks and orderly traffic flow contribute to a favorable traffic environment, enhancing residents’ sense of safety when walking in the community. These factors collectively enhance the overall perceived walkability.

4.5. Objective Impact Analysis of Walkability and Regression Model

4.5.1. Single Point Walk Score

In this study, the single-point walk score of Qingxiu District is calculated using ArcGIS, and the findings are visually presented in Figure 8.
In Qingxiu District, the overall walk score in the western area is higher compared to the eastern area. This suggests that residents in the western area experience greater convenience for walking trips, indicating more comprehensive living facilities in that region. Conversely, the walk score is lower in the central and eastern areas, with some fragmented areas exhibiting higher walk score values. Upon further examination in relation to the administrative division of Qingxiu District, the distribution of the walk score appears to be correlated with the local functional setting of the district. Areas with a higher walk score predominantly coincide with regions characterized by higher population density and increased functionality.

4.5.2. Model Testing

The model’s explanatory variables and their corresponding statistical results are presented in Table 4. It is essential to highlight that transportation facilities, including parking lots, subway stations, and bus stops were consolidated due to the challenges posed by their low density and numerous zero values, which would render the model unsolvable.
Table 5 presents the results of model testing for the explanatory variables. For each explanatory variable, a VIF value greater than 10 indicates a correlation with other predictors, and the variable should be removed to avoid impacting the model results [49]. To ensure the validity of the analysis, we excluded values of variance inflation factor (VIF) greater than 10. After careful examination, it was found that living, house price, and sidewalk continuity failed to meet the requirement of multicollinearity. However, the VIF values for all other explanatory variables were below 10, indicating the absence of multicollinearity, which fulfills the necessary condition for the analysis.
To assess spatial autocorrelation, Moran’s I index was calculated in ArcGIS. The significance test for spatial autocorrelation yielded a p-value of 0.000, indicating a strong spatial pattern in the data. All variables in this study passed this test, confirming the reliability of our results.

4.5.3. Modeling Results and Analysis

In this study, we applied three different regression techniques, namely OLS, GWR, and MGWR, to fit the data. As shown in Table 6, the R 2 value obtained from the MGWR model is 0.679, signifying that the explanatory variables can account for 67.9% of the variation in the dependent variable. This performance is superior to that of both the GWR and OLS models. Furthermore, the A I C c values of the MGWR model are substantially lower than those of the other two models, with the differences of 75.996 and 70.078, respectively. Similarly, the R S S is also lower for the MGWR model, with the differences of 93.505 and 42.362, respectively. These observations provide clear evidence that the MGWR model fits the data best among the three regression techniques.
As depicted in Table 7, the coefficients of each explanatory variable for walkability are not fixed; instead, they exhibit positive and negative values, varying with the spatial location. The spatial variation in these coefficients for different explanatory variables was visualized using ArcGIS, as illustrated in Figure 9.
Figure 9a reveals a negative correlation between catering facilities and walkability, with the coefficient being smaller in areas with higher accessibility. Specifically, the coefficients of the MGWR model are as follows: −0.212 for catering facilities, 0.226 for shopping services, 0.079 for financial facilities, and 0.025 for hotel services. The impact of shopping facilities, financial facilities, and hotel services on walking accessibility is generally positive, indicating that the presence of more of these facilities leads to better walking accessibility. In areas near Vientiane, National Avenue, the southeast area of Xianghu Avenue Interchange, and the eastern part of Xianghu Avenue, where there is a concentration of population and developed commercial services, the shopping, financial, and hotel facilities are also found in larger numbers. These commercially dense regions tend to provide numerous job opportunities and house a larger population, consequently resulting in high levels of walking accessibility.
Figure 9e shows that the coefficient of residential land use in the MGWR model has a mean value greater than 0. The more concentrated the residential communities near Vientiane, National Avenue, the southeast area of Xianghu Avenue Interchange, and the eastern part of Xianghu Avenue, the higher the coefficient value and consequently, the better the walkability. However, it is essential to be cautious about the potential impacts of overconcentration of population on both society and the environment.
In terms of public facilities such as education, medical care, and entertainment (Figure 9f–h), the MGWR model regression coefficients for these three types of facilities are 0.155, 0.174, and 0.169, respectively, all having positive values. Moreover, the areas with higher coefficients are concentrated in the regions mentioned above. It is evident that areas with better access to public facilities tend to exhibit higher levels of pedestrian accessibility.
Figure 9i displays the coefficients of transportation facilities in the MGWR model, with the mean value of the coefficients being 0.024. The presence and location of transportation infrastructure can significantly impact house prices and accessibility to employment opportunities. Public transportation, in particular, plays a crucial role in improving mobility and accessibility for socially disadvantaged groups, which explains its positive correlation in the eastern area of Langdong.
Regarding the variable of firms, the regression coefficients are negative, suggesting that the distribution density of firms has a detrimental effect on walkability. On the other hand, the mean value of the regression coefficients for government institutions is positive, indicating a positive impact on walkability. This observation leads to the hypothesis that firms may be predominantly concentrated in suburban areas lacking adequate pedestrian facilities, resulting in low pedestrian accessibility. Conversely, government institutions with higher coefficient values are concentrated in the central city.
Figure 9m illustrates the distribution of the regression coefficients for the degree of land use mix, and it shows a positive effect. This positive relationship implies that higher degrees of land use mix in an area, characterized by a diverse mix of service facilities, contribute to improved walkability. The areas with larger coefficient values are concentrated in the northwest corner, which corresponds to the old urban area of Qingxiu District. This area is well-planned and equipped with various facilities, further enhancing its walkability.
In Figure 9n,o, the regression coefficients for street greening are negative, while the regression coefficients for sidewalk width are mostly positive. Older neighborhoods often have narrow roads, limiting the possibility of increasing green spaces. Additionally, pedestrian services in these areas may be outdated. Nevertheless, a clear positive correlation is observed between larger sidewalk widths and improved pedestrian friendliness, ultimately leading to better walkability.
Overall, the MGWR model regression results indicate that the eastern part of Qingxiu District exhibits large coefficients. This observation aligns with the Nanning City 2035 Plan, where the Nanning government has highlighted the eastward development of the city, extending from the central city through Qingxiu District to Hengzhou, forming a pattern of one main city and four new subcities. In the central city, the focus will be on renovating old neighborhoods, strengthening service facilities, and constructing historical and cultural neighborhoods. The results of the MGWR model coefficients further support the significant impact of new facilities in the eastern new city on walkability, which is consistent with the findings of this research.

5. Discussion

5.1. Discussion of Walking Accessibility Based on Subjective and Objective Perspectives

Evaluating and improving walking accessibility is a very complex issue that requires a combination of factors.
When discussing walking accessibility from a subjective perspective, it is crucial to take into account an individual’s perceptions and experiences. The results indicate that travel experience has the most significant impact on perceived walkability. This is because an individual’s level of experience directly relates to their familiarity and self-confidence in the walking environment. Accumulated travel experience enables individuals to develop a better understanding of street layout, traffic rules, and pedestrian safety, thereby enhancing their perceived ability to navigate the walking environment. Experienced pedestrians are more adept at discerning travel speeds, traffic flow, and general conditions, allowing them to effectively adapt and respond to various pedestrian situations. Additionally, facility condition, traffic condition, and safety perception are also influential factors that interact with one another, collectively shaping pedestrians’ perception of the walking environment.
Objective discussions often lean towards considering physical environmental factors. Factors such as mixed land use, shopping centers, hotels, residential areas, government institutions, financial establishments, and medical services play a positive role in promoting local walkability. This is primarily due to the concentration of these services and facilities in urban centers and densely populated areas, which naturally become key destinations for pedestrians. The close proximity of these facilities, coupled with the pleasant and convenient walking environment they create, significantly contribute to people’s inclination and ability to choose walking as a mode of transportation, thereby enhancing walkability. In contrast, corporate enterprises and street greening have been observed to negatively impact walkability. Corporate enterprises are primarily located in commercial or industrial areas that tend to have higher traffic flow, congestion, and air pollution levels, making walking inconvenient. The impact of street greening on walkability is nuanced. While it does not necessarily reduce walkability on its own, improper implementation could result in restricted walking space, insufficient pedestrian amenities, and even obstructed views, leading to increased safety risks and uncertainty, ultimately reducing the ease of walking.
It should be noted that subjective and objective factors are not completely independent of each other but rather interact with each other. The study of pedestrian accessibility needs to consider subjective and objective factors comprehensively and analyze them through the integration of multiple methods in order to draw accurate conclusions.

5.2. Policy Implications

Based on the analysis results, we recommend that the government and other management departments introduce corresponding initiatives in the following areas to enhance walking accessibility for urban residents [50,51]:
  • Develop improved walking infrastructure: The government can make investments to develop additional sidewalks, overpasses, and pedestrian walkways to ensure pedestrian safety and convenience. Additionally, it can enhance the quality of road surfaces and emphasize green spaces and landscaping to improve the walking environment’s comfort.
  • Optimize traffic planning: Urban and transportation planners should consider walking an essential mode of travel. By adopting rational planning and layout, it is possible to reduce walking distances and provide convenient walking paths and connections, with the aim of encouraging more people to take up walking as an alternative means of transport.
  • Restrict vehicular traffic: Measures such as constructing pedestrian streets, traffic-narrowed sections and low-speed zones, as well as prohibiting vehicles from certain areas, can be implemented to make walking safer and more comfortable.
  • Boost integration of public transportation and walking: Develop convenient public transportation systems interconnected with walking. Encourage residents to use a combination of public transportation and walking modes.
  • Provide relevant facilities and services: Establish rest areas, bicycle parking facilities, and public restrooms in pedestrianized areas or densely populated neighborhoods to improve walker experience and comfort.
  • Publicity and education: Conduct related publicity events to increase awareness and appreciation of walking. Promote walking as a healthy and environmentally friendly means of travel through enhanced educational initiatives, encouraging people to select walking as their preferred mode of transportation for shorter journeys.
These policy recommendations can help to improve walking accessibility, promoting walking as an eco-friendly, healthy, and convenient transportation mode.

6. Conclusions

This research comprehensively analyzes walking accessibility from both subjective and objective perspectives, aiming to understand the factors influencing it and explore potential underlying mechanisms.
Initially, a questionnaire survey was conducted to capture residents’ subjective perceptions regarding various aspects such as traffic operations, walking facilities, and environmental conditions in their neighborhoods. The collected data underwent structural equation modeling, revealing that travel experience holds the strongest influence on perceived walkability, followed by facility condition, traffic condition, and safety perception. On the objective front, POI data were utilized for the analysis. Using ArcGIS, Qingxiu District was divided into fishnets, and the walk score of each fishnet was considered the dependent variable. Various types of POI data were used as explanatory variables. Comparing the fitting effects of OLS, GWR, and MGWR, it was found that MGWR provided the best fitting results. Mixed land use, shopping, hotels, residential, government, financial, and medical public services demonstrated positive correlations with local walkability, whereas factors such as corporate enterprises and street greening exhibited negative correlations. The underlying reasons were attributed to the development level, regional functions, population distribution, and deployment of supporting facilities, all of which significantly influenced the walkability in the area.
Based on the analysis outcomes, we propose that enhancing traffic conditions and walking facilities, and improving safety perceptions through artificial means, can lead to an improvement in both subjective and objective walking accessibility within the neighborhood. These insights can guide decision-making and management practices, ultimately boosting residents’ satisfaction with walking travel and promoting the adoption of walking as a preferred mode of transportation.
However, this study has certain limitations due to funding and personnel constraints. While the questionnaire data size is appropriate for academic research, to extend its applicability to the entire city, the sample size would need to be expanded according to the actual situation. Additionally, future research could delve deeper into latent variables by exploring more complex structural equation models, providing a more profound understanding of the factors influencing walking accessibility.

Author Contributions

Conceptualization, Y.J. and Y.L.; methodology, X.D.; software, Y.L. and X.D.; validation, Y.L., X.D. and Y.J.; formal analysis, Y.J.; investigation, Y.L.; resources, Y.L.; data curation, X.D.; writing—original draft preparation, X.D.; writing—review and editing, Y.L.; visualization, Y.L.; supervision, Y.J.; project administration, Y.J.; funding acquisition, Y.J. All authors have read and agreed to the published version of the manuscript.

Funding

This research was funded by Zhejiang Provincial Natural Science Foundation of China under Grant No.LTGG23E080005.

Data Availability Statement

The data that has been used is confidential.

Conflicts of Interest

The authors declare no conflict of interest.

References

  1. Liu, S. Research on Measurement and Optimization of 15-Minute Urban Community Life Circle in Historic Areaes. Master’s Thesis, Southeast University, Nanjing, China, 2021. [Google Scholar]
  2. Moreno, C.; Allam, Z.; Chabaud, D.; Gall, C.; Pratlong, F. Introducing the ‘15-Minute City’: Sustainability, Resilience and Place Identity in Future Post-Pandemic Cities. Smart Cities 2021, 4, 93–111. [Google Scholar] [CrossRef]
  3. Wei, W.; Hong, M.; Xie, B. Demand-supply Matching Oriented 15-minute Community Life Circle Demarcation and Spatial Optimization. Planners 2019, 35, 11–17. [Google Scholar]
  4. He, X.; He, S.Y. Using open data and deep learning to explore walkability in Shenzhen, China. Transp. Res. Part D Transp. Environ. 2023, 118, 103696. [Google Scholar] [CrossRef]
  5. Ha, J.; Ki, D.; Lee, S.; Ko, J. Mode choice and the first-/last-mile burden: The moderating effect of street-level walkability. Transp. Res. Part D Transp. Environ. 2023, 116, 103646. [Google Scholar] [CrossRef]
  6. Xiao, X.; Aultman-Hall, L.; Manning, R.; Voigt, B. The impact of spatial accessibility and perceived barriers on visitation to the US national park system. J. Transp. Geogr. 2018, 68, 205–214. [Google Scholar] [CrossRef]
  7. Wu, J.; Shen, N. Walk score method-based evaluation of social service function of urban park green lands in Futian district Shenzhen, China. Acta Ecol. Sin. 2017, 37, 7483–7492. [Google Scholar]
  8. Zhou, Y.; Li, G. Evaluation and District Comparison of Life Convenience Index in 15-Minute Walking Circle: A Case Study of Chengdu Central City. Shanghai Urban Plan. Rev. 2018, 27, 78–82. [Google Scholar]
  9. Farrington, J.; Farrington, C. Rural accessibility, social inclusion and social justice: Towards conceptualisation. J. Transp. Geogr. 2005, 13, 1–12. [Google Scholar] [CrossRef]
  10. Church, A.; Frost, M.; Sullivan, K. Transport and social exclusion in London. Transp. Policy 2000, 7, 195–205. [Google Scholar] [CrossRef]
  11. Ettema, D.; Gärling, T.; Olsson, L.E.; Friman, M. Out-of-home activities, daily travel, and subjective well-being. Transp. Res. Part A Policy Pract. 2010, 44, 723–732. [Google Scholar] [CrossRef]
  12. Hansen, W.G. How accessibility shapes land use. J. Am. Inst. Plan. 1959, 25, 73–76. [Google Scholar] [CrossRef]
  13. Curl, A.; Nelson, J.D.; Anable, J. Does Accessibility Planning address what matters? A review of current practice and practitioner perspectives. Res. Transp. Bus. Manag. 2011, 2, 3–11. [Google Scholar] [CrossRef]
  14. Lättman, K.; Olsson, L.E.; Friman, M. Development and test of the Perceived Accessibility Scale (PAC) in public transport. J. Transp. Geogr. 2016, 54, 257–263. [Google Scholar] [CrossRef]
  15. Angela, C. The importance of understanding perceptions of accessibility when addressing transport equity: A case study in Greater Nottingham, UK. J. Transp. Land Use 2018, 11, 1147–1162. [Google Scholar] [CrossRef]
  16. Giles-Corti, B.; Donovan, R.J. Socioeconomic Status Differences in Recreational Physical Activity Levels and Real and Perceived Access to a Supportive Physical Environment. Prev. Med. 2002, 35, 601–611. [Google Scholar] [CrossRef] [PubMed]
  17. Saelens, B.E.; Sallis, J.F.; Black, J.B.; Chen, D. Neighborhood-based differences in physical activity: An environment scale evaluation. Am. J. Public Health 2003, 93, 1552–1558. [Google Scholar] [CrossRef]
  18. Humpel, N.; Owen, N.; Leslie, E. Environmental factors associated with adults’ participation in physical activity: A review. Am. J. Prev. Med. 2002, 22, 188–199. [Google Scholar] [CrossRef]
  19. Kelly, C.E.; Tight, M.R.; Hodgson, F.C.; Page, M.W. A comparison of three methods for assessing the walkability of the pedestrian environment. J. Transp. Geogr. 2011, 19, 1500–1508. [Google Scholar] [CrossRef]
  20. Carnegie, M.A.; Bauman, A.; Marshall, A.L.; Mohsin, M.; Westley-Wise, V.; Booth, M.L. Perceptions of the Physical Environment, Stage of Change for Physical Activity, and Walking Among Australian Adults. Aahperd American Alliance For Health Physical. United States. 2002, pp. 146–155. Available online: https://search.ebscohost.com/login.aspx?direct=true&db=edsbl&AN=RN115053802&lang=zh-cn&site=eds-live (accessed on 12 October 2023).
  21. Friman, M.; Lättman, K.; Olsson, L.E.P. Public Transport Quality, Safety, and Perceived Accessibility. Sustainability 2020, 12, 3563. [Google Scholar] [CrossRef]
  22. Hagen, M.V. Wensen van reizigers: Piramide van Maslov. In Een Gouden Markt–Waarom Marketing van Openbaar Vervoer Moet & Loont; KPVV: Rotterdam, The Netherlands, 2006. [Google Scholar]
  23. Hiroshi, T.; Kuang-Yih, Y.E.H.; Shinji, S.; Upali, V. Comparison of Attitudes toward walking in japanese cities. J. East. Asia Soc. Transp. Stud. 2007, 7, 1794. [Google Scholar] [CrossRef]
  24. Gallin, N. Quantifying pedestrian friendliness-guidelines for assessing pedestrian level of service. ARRB Transp. Res. 2001, 10, 47–55. [Google Scholar]
  25. Owen, N.; Humpel, N.; Leslie, E.; Bauman, A.; Sallis, J.F. Understanding environmental influences on walking: Review and research agenda. Am. J. Prev. Med. 2004, 27, 67–76. [Google Scholar] [CrossRef] [PubMed]
  26. Brownson, R.C.; Hoehner, C.M.; Day, K.; Forsyth, A.; Sallis, J.F. Measuring the Built Environment for Physical Activity: State of the Science. Am. J. Prev. Med. 2009, 36, S99–S123.e112. [Google Scholar] [CrossRef] [PubMed]
  27. Leslie, E.; Saelens, B.; Frank, L.; Owen, N.; Bauman, A.; Coffee, N.; Hugo, G. Residents’ perceptions of walkability attributes in objectively different neighbourhoods: A pilot study. Health Place 2005, 11, 227–236. [Google Scholar] [CrossRef] [PubMed]
  28. Badland, H.; Schofield, G. Transport, urban design, and physical activity: An evidence-based update. Transp. Res. Part D Transp. Environ. 2005, 10, 177–196. [Google Scholar] [CrossRef]
  29. Jaskiewicz, F. Pedestrian Level of Service Based on Trip Quality. 2000. Available online: https://onlinepubs.trb.org/onlinepubs/circulars/ec019/Ec019_g1.pdf (accessed on 12 October 2023).
  30. Ha, E.; Joo, Y.; Jun, C. Green Score: An Evaluation Scheme for Pedestrian Environment. In Proceedings of the Geospatial World Forum, Seoul, Republic of Korea, 18–21 September 2011. [Google Scholar]
  31. Pratiwi, A.R.; Zhao, S.; Mi, X. Quantifying the relationship between visitor satisfaction and perceived accessibility to pedestrian spaces on festival days. Front. Archit. Res. 2015, 4, 285–295. [Google Scholar] [CrossRef]
  32. Yiwen, X. Research on Location of Public Service Facilities in Urban Communities. Ph.D. Thesis, China University of Mining and Technology, Beijing, China, 2021. [Google Scholar]
  33. Jehle, U.; Coetzee, C.; Büttner, B.; Pajares, E.; Wulfhorst, G. Connecting people and places: Analysis of perceived pedestrian accessibility to railway stations by Bavarian case studies. J. Urban Mobil. 2022, 2, 100025. [Google Scholar] [CrossRef]
  34. Calafiore, A.; Dunning, R.; Nurse, A.; Singleton, A. The 20-minute city: An equity analysis of Liverpool City Region. Transp. Res. Part D 2022, 102, 103111. [Google Scholar] [CrossRef]
  35. Insu, H.; Changsok, Y. Analyzing Spatial Variance of Airbnb Pricing Determinants Using Multiscale GWR Approach. Sustainability 2020, 12, 103111. [Google Scholar]
  36. Wang, C.-H.; Chen, N. A geographically weighted regression approach to investigating the spatially varied built-environment effects on community opportunity. J. Transp. Geogr. 2017, 62, 136–147. [Google Scholar] [CrossRef]
  37. Steven, J.M.; Steven, L.G.; John, W.; Jared, A.; Dustin, T.D. Validation of Walk Score® for Estimating Neighborhood Walkability: An Analysis of Four US Metropolitan Areas. Int. J. Environ. Res. Public Health 2011, 8, 4160–4179. [Google Scholar] [CrossRef]
  38. Hall, C.M.; Ram, Y. Walk score® and its potential contribution to the study of active transport and walkability: A critical and systematic review. Transp. Res. Part D Transp. Environ. 2018, 61, 310–324. [Google Scholar] [CrossRef]
  39. Wang, C.-H.; Akar, G.; Guldmann, J.-M. Do your neighbors affect your bicycling choice? A spatial probit model for bicycling to The Ohio State University. J. Transp. Geogr. 2015, 42, 122–130. [Google Scholar] [CrossRef]
  40. Bereitschaft, B. Equity in neighbourhood walkability? A comparative analysis of three large U.S. cities. Local Environ. 2017, 22, 859–879. [Google Scholar] [CrossRef]
  41. Xu, M.; Xin, J.; Su, S.; Weng, M.; Cai, Z. Social inequalities of park accessibility in Shenzhen, China: The role of park quality, transport modes, and hierarchical socioeconomic characteristics. J. Transp. Geogr. 2017, 62, 38–50. [Google Scholar] [CrossRef]
  42. Imran, M.; Sumra, K.; Abbas, N.; Majeed, I. Spatial distribution and opportunity mapping: Applicability of evidence-based policy implications in Punjab using remote sensing and global products. Sustain. Cities Soc. 2019, 50, 101652. [Google Scholar] [CrossRef]
  43. Bollen, K.A. Structural Equations with Latent Variables; Wiley Series in Probability and Mathematical Statistics: Applied Probability and Statistics; Wiley: Hoboken, NJ, USA, 1989. [Google Scholar]
  44. Papaioannou, D.; Martinez, L.M. The Role of Accessibility and Connectivity in Mode Choice. A Structural Equation Modeling Approach. Transp. Res. Procedia 2015, 10, 831–839. [Google Scholar] [CrossRef]
  45. Brunsdon, C.; Fotheringham, S.; Charlton, M. Geographically weighted regression--modelling spatial non-stationarity. J. R. Stat. Soc. Ser. D Stat. 1998, 47, 431. [Google Scholar] [CrossRef]
  46. Chang Chien, Y.-M.; Carver, S.; Comber, A. Using geographically weighted models to explore how crowdsourced landscape perceptions relate to landscape physical characteristics. Landsc. Urban Plan. 2020, 203, 103904. [Google Scholar] [CrossRef]
  47. Oshan, T.M.; Li, Z.; Stewart Fotheringham, A.; Kang, W.; Wolf, L.J. MGWR: A python implementation of multiscale geographically weighted regression for investigating process spatial heterogeneity and scale. ISPRS Int. J. Geo-Inf. 2019, 8, 269. [Google Scholar] [CrossRef]
  48. Propaganda Department of CPC Nanning Municipal Committee. In Administrative Subdivisio; 2023. Available online: https://www.nanning.gov.cn/zjnn/lcjj/t681816.html (accessed on 12 October 2023).
  49. Xinwei, M.; Yanjie, J.; Yuchuan, J.; Xue, J. Geographically and temporally weighted regression for modeling spatio-temporal variation in dockless bikeshare usage demand. J. Jilin Univ. Eng. Technol. Ed. 2020, 50, 1344–1354. [Google Scholar] [CrossRef]
  50. Cirianni, F.; Comi, A.; Luongo, A. A sustainable approach for planning of urban pedestrian routes and footpaths in a pandemic scenario. TeMA 2022, 15, 125–140. [Google Scholar]
  51. Cirianni, F.M.; Leonardi, G.; Luongo, A.S. Strategies and Measures for a Sustainable Accessibility and Effective Transport Services in Inner and Marginal Areas: The Italian Experience. In Proceedings of the INTERNATIONAL SYMPOSIUM: New Metropolitan Perspectives, Reggio Calabria, Italy, 24–26 May 2022; Springer: Berlin/Heidelberg, Germany, 2022; pp. 363–376. [Google Scholar]
Figure 1. Method flowchart.
Information 14 00595 g001
Figure 2. Geographical location map of Nanning.
Information 14 00595 g002
Figure 3. Qingxiu District map. (a) Qingxiu District. (b) Urban area and living circle in Qingxiu District.
Information 14 00595 g003
Figure 4. Sample statistical chart.
Information 14 00595 g004
Figure 5. Average discretionary time on weekdays and holidays.
Information 14 00595 g005
Figure 6. Statistical results for the residents’ daily trips.
Information 14 00595 g006
Figure 7. Structural equation fitting results. Notes: *** p < 0.001, ** p < 0.01, * p < 0.05.
Information 14 00595 g007
Figure 8. The distribution chart of single-point walk score.
Information 14 00595 g008
Figure 9. The spatial variation in the coefficients: (a) catering, (b) shopping, (c) finance, (d) hotel services, (e) residential community, (f) education, (g) medical care, (h) entertainment, (i) transportation facilities, (j) firms, (k) government institutions, (l) population density, (m) land use mix, (n) street greenery, (o) sidewalk width.
Information 14 00595 g009aInformation 14 00595 g009bInformation 14 00595 g009c
Table 1. Literature review: factors influencing perceived walkability.
No.AuthorsMethodsInfluencing Factors
1Hagen [22]SurveyHealth, mobility, safety, reliability, convenience, comfort, and aesthetics.
2Humpel [18]ReviewAccessibility of facilities, opportunities for activity, weather, safety, and aesthetic attributes.
3Tsukaguchi [23]SurveyThe number and level of services provided by pedestrian infrastructure
4Gallin [24]The pedestrian level of service approachWalking conditions on a route, path, or facility, which is linked directly to factors that affect mobility, comfort, and safety.
5Kelly [19]Stated preference surveys; on-the-street survey; on-the-move surveyThe risk of accidents, bad weather, theft, and other factors cause people to avoid walking long distances. People tend to walk farther and more frequently if high quality sidewalk facilities are provided.
6Owen, Neville [25]ReviewThe aesthetic nature of the local environment, the convenience of facilities for walking, accessibility of places to walk to, level of traffic on roads, and composites of environmental attributes.
7Brownson, Ross C [26]ReviewCommunity environments, parks, and trails, population density, land use mix, access to recreational facilities, and street pattern.
8Leslie, Eva [27]Neighborhood environment attribute ratingsAttributes of residential density, land use mix (access and diversity) and street connectivity, traffic safety, and safety from crime attributes.
9Badland, Hannah [28]ReviewPopulation density, subdivision age, street connectivity, and mixed land use
10Carnegie [20]Population surveyThe aesthetics of the environment (such as attractive scenery) and convenience.
11Giles-Corti [16]Cross-sectional surveyAttractive neighborhood with sidewalks and shops.
12Jaskiewicz [29]SurveyDividing fence, road red line width.
13Ha Eunji [30]Green Score evaluation systemUrban landscape: Incorporating natural elements in the urban landscape promotes interaction and enhances the overall walking experience. Public seating areas can also encourage casual walking.
14Pratiwi [31]Hierarchical analysis, SEMSafety, mobility, and convenience: Ensuring safety, mobility, and convenience are crucial aspects of creating pedestrian-friendly environments. This includes measures such as crime prevention, adequate separation of traffic modes, clear traffic signs, and well-maintained roads. Additionally, amenities such as green spaces, appealing views, and easy access to facilities contribute to a positive walking experience.
15Xu Yiwen [32]Location evaluation system of urban community public service facilitiesSpatial environment perception and behavioral perception. The perception of the spatial environment can be understood through visual perception, traffic perception, and psychological perception. Behavioral perception encompasses recommendation behavior and participation behavior, which are influenced by the overall perception of the environment.
16Jehle [33]Review, surveyDirectness, simplicity, traffic safety, security, comfort, and built environment.
Table 2. The questions of the perceived walkability survey.
NumberQuestions
Q1Traffic conditions of walking, motorized and non-motorized vehicles in residential community life circle
Q2Traffic flow of motor vehicles on the roads in residential community life circle
Q3Speed of motor vehicles on the roads in residential community life circle
Q4Security situation in residential community life circle
Q5The placement of cameras on the roads in residential community life circle
Q6Number and layout of night lighting facilities in residential community life circle
Q7The situation of motor vehicles yielding to pedestrians in residential community life circle
Q8The operation of traffic signals in residential community life circle
Q9The width of sidewalks in residential community life circle
Q10Respondents’ tendency to walk compared to driving
Q11Occupancy of sidewalks by non-motorized vehicles in residential community life circle
Q12Walking comfort of sidewalks in residential community life circle
Q13Travel time cost of travel service facilities in residential community life circle
Q14Installation of guidance signs in residential community life circle
Q15Congestion level of daily service facilities in residential community life circle
Q16Installation of convenience facilities (benches, vending machines, garbage bins, etc.) in residential community life circle
Q17Greening condition of roads in residential community life circle
Q18Landscape of roads in residential community life circle
Q19Continuity of sidewalks in residential community life circle
Q20Layout and quantity of barrier-free facilities in residential community life circle
Q21Sanitation and cleanliness of the streets in residential community life circle
Q22Separation of sidewalks and non-motorized paths in residential community life circle
Q23The impact of travel on interpersonal relationships in residential community life circle
Q24The extent to which travel is more convenient in residential community life circle compared to other community living circles
Q25Overall satisfaction with various types of services (dining, living, medical, education, transportation, shopping, recreation, etc.) in residential community life circle
Table 3. Composite reliability and convergent validity of the measures.
ConstructsVariablesCronbach’s αLoadingAVEC.R.
Traveling experience (CE)Q210.7880.6420.5710.792
Q150.7880.685
Q140.7880.752
Q130.7880.711
Facilities (FA)Q180.7880.7510.5260.816
Q170.7880.720
Q160.7880.669
Q100.7880.758
Traffic condition (TC)Q190.7750.6990.5060.804
Q120.7750.726
Q110.7750.704
Q10.7750.717
Safety perception (SP)Q40.7940.7170.5320.773
Q30.7940.702
Q20.7940.767
Perceived accessibility (PA)Q240.7680.7830.5780.733
Q250.7680.737
Table 4. Explanatory variable table.
CategoryExplanatory VariableMeanMinimumMaximumStandard DeviationUnit
Built environmentCatering61.320.000186.00066.309/km2
Shopping146.480.000403.00092.832/km2
Living64.240.000109.000217.324/km2
Financial banks17.040.00044.00036.572/km2
Hotels11.080.00039.0005.293/km2
Education11.000.00030.00076.644/km2
Medical38.400.00083.00042.936/km2
Entertainment27.800.00070.0008.96/km2
Residential community34.360.00061.00014.468/km2
Government agencies40.120.00098.00030.78/km2
Corporate enterprises19.880.00060.00039.404/km2
Transportation facilitiesTransportation facilities7.440.00014.00051.732/km2
Socioeconomic attributesPopulation density5205.8600.00046,851.0009446.215p/km2
House price10,885.5703487.00035,173.0004296.903RMB
Land use propertyLand use mix0.9880.1681.5590.257Scores
Questionnaire acquisition variablesStreet greenery4.3163.5004.8000.477Scores (1–5)
Sidewalk continuity4.1353.5004.6000.472Scores (1–5)
Sidewalk width4.2813.5004.7300.413Scores (1–5)
Table 5. Test results of multicollinearity and spatial autocorrelation.
Explanatory VariablesVIFMoran’s Iz-Valuep-Value
Catering4.9420.56319.0230.000
Shopping2.4960.46715.8670.000
Living17.8450.64321.3870.000
Hotel services1.9150.39913.5900.000
Education1.4190.44615.0670.000
Residential community4.1910.71823.9610.000
Medical2.8500.49416.5170.000
Transportation facilities1.4970.42014.0560.000
Entertainment2.7640.56919.1010.000
Firms2.5200.58719.8330.000
Financial services2.5870.48116.1800.000
Government institutions2.6300.60120.1790.000
Population density2.4000.86528.8360.000
House price11.1460.71623.6130.000
Land use mix1.5980.60220.1820.000
Street greenery7.6710.62920.6020.000
Sidewalk continuity12.2380.62520.4760.000
Sidewalk width3.2790.45115.1830.000
Table 6. Comparison of model fitting results.
Model R 2 A I C c R S S
OLS0.354727.739186.053
GWR0.532721.821134.910
MGWR0.679651.74392.548
Table 7. Descriptive statistics of regression coefficients of GWR and MGWR models.
Explanatory VariablesGWRMGWR
MeanSTDMin.Med.Max.MeanSTDMin.Med.Max.
Intercept 0.1440.516−0.7210.0581.9570.0330.0030.0260.0330.036
Catering−0.0630.192−0.8520.0020.110−0.2120.367−1.047−0.1020.943
Shopping0.2380.0960.1340.1870.4730.2260.0100.2140.2220.253
Hotel services−0.0340.137−0.483−0.0080.0910.0250.0060.0160.0220.039
Education0.1610.1000.0490.1190.4580.1550.0820.0610.1380.340
Residential community0.1930.1470.0190.1610.5650.1160.0350.0790.1070.178
Medical0.1430.085−0.0090.1060.3640.1740.0400.1180.1820.229
Transportation facilities0.0040.058−0.089−0.0100.3360.0240.194−0.305−0.0121.436
Entertainment0.0580.325−0.108−0.0581.3560.1690.637−0.499−0.0462.283
Firms−0.1470.116−0.433−0.1020.029−0.0700.003−0.081−0.069−0.068
Financial services−0.0570.173−0.5000.0390.0920.0790.0030.0760.0780.087
Government institutions0.0620.138−0.1360.0020.5820.0220.0190.0090.0130.081
Population density−0.0311.041−2.030−0.0673.720−0.1540.136−0.333−0.1730.049
Land use mix0.2770.0760.0800.2660.5050.2170.0140.1760.2230.229
Street greenery−0.2280.206−0.774−0.2200.086−0.2420.009−0.256−0.244−0.224
Sidewalk width0.4520.331−0.3540.4131.2880.5050.263−0.1160.4771.697
Disclaimer/Publisher’s Note: The statements, opinions and data contained in all publications are solely those of the individual author(s) and contributor(s) and not of MDPI and/or the editor(s). MDPI and/or the editor(s) disclaim responsibility for any injury to people or property resulting from any ideas, methods, instructions or products referred to in the content.

