Abstract
Community detection has been (and remains) a very important topic in several fields. From marketing and social networking to biological studies, community detection plays a key role in advancing research in many different fields. Research on this topic originally looked at classifying nodes into discrete communities (non-overlapping communities) but eventually moved forward to placing nodes in multiple communities (overlapping communities). Unfortunately, community detection has always been a time-inefficient process, and datasets are too large to realistically process them using traditional methods. Because of this, recent methods have turned to parallelism and graph stream models, where the edge list is accessed one edge at a time. However, all these methods, while offering a significant decrease in processing time, still have several shortcomings. We propose a new parallel algorithm called community detection with seed sets (CoDiS), which solves the overlapping community detection problem in graph streams. Initially, some nodes (seed sets) have known community structures, and the aim is to expand these communities by processing one edge at a time. The innovation of our approach is that it splits communities among the parallel computation workers so that each worker is only updating a subset of all the communities. By doing so, we decrease the edge processing throughput and decrease the amount of time each worker spends on each edge. Crucially, we remove the need for every worker to have access to every community. Experimental results show that we are able to gain a significant improvement in running time with no loss of accuracy.
1. Introduction
Community detection [1,2,3] is a crucial technique for many different areas of interest, including biology, social network analysis, and criminal justice. Any time it is useful to find groups of individuals from a seemingly arbitrarily connected network, community detection algorithms are employed. Research on community detection has been ongoing for several decades, with new methods being explored to increase the accuracy, speed, and robustness of community detection algorithms. We study the problem of detecting overlapping communities given a seed set, and a stream of edges. Figure 1 shows an example of two overlapping communities and sharing the same node 10. For this problem, we can assume that nodes 5 and 7 form the seed set, and that we are receiving the edges one at a time.
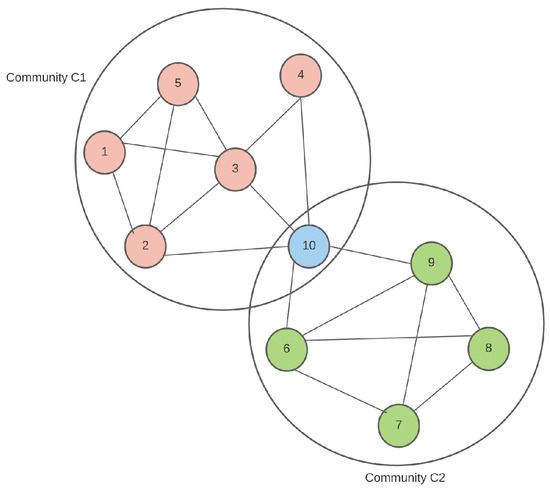
Figure 1.
An example of two overlapping communities. Node 10 belongs to both communities.
Unfortunately, as the internet has expanded, and our ability to collect data has improved, the size and complexity of the networks we wish to analyze have become prohibitively large. Social networking sites like Facebook or Twitter have millions of daily users who ‘friend’ each other or mention each other in tweets and posts several million times a day, creating massive, complex networks that are great for social network analysis, with applications in advertising and marketing. Amazon offers several hundred million products, and understanding which customers tend to buy similar items is crucial for effectively marketing those groups. Because of the big data availability, it has become difficult to process these networks in a realistic time frame; moreover, storing and accessing them in a timely manner has become a challenge.
Therefore, much of the recent research on community detection has not focused on increasing the accuracy of community detection algorithms, but on increasing the speed and amount of data that can be processed. Along the same lines, community detection algorithms that take advantage of new multi-threaded central processing units (CPUs) and distributed computing are increasingly becoming the subjects of numerous research papers [4,5,6].
Liakos et al. [7] focused on community detection via seed set expansion (CoEuS), a novel approach to the overlapping community detection problem, in the sense that it does not attempt to partition the entire graph into communities, but instead looks at only a selected number of communities of interest. This works by providing a small set of known nodes from a community of interest and then attempting to build the rest of the community from that seed set of nodes. This allows us to look at the graph edge-by-edge instead of attempting to load the entire graph at once, meaning that much larger networks can be processed. In addition to this, they expanded their approach by proposing distributed streaming community detection (DiCeS) [8] using Apache Storm https://storm.apache.org/, accessed on 27 October 2023, and Redis https://redis.io/, accessed on 27 October 2023, to accelerate the algorithm proposed in [7] by means of distributed computing.
While DiCeS [8] is great for quickly analyzing large networks, it is not without issues. The authors of [8] distribute the work by having each worker node process edges in parallel and write those edges to a shared list of communities, which is stored in a Redis cluster so that all worker nodes have access to all the communities that are considered. Because of this, there is added overhead to the worker nodes in accessing community data from the Redis cluster. Concurrently, protective measures increase the overhead associated with reading and writing data to the cluster.
To resolve these issues, we propose a new parallel method called the community detection with seed sets (CoDiS) algorithm. While DiCeS splits the edges among all the worker nodes, which then look at all the communities to determine if the nodes in that edge belong to any of those communities, our proposed method instead splits the communities among the worker nodes, so that each worker node only looks at a subset of all the communities considered. By doing so, although we decrease the edge processing throughput, we also decrease the amount of time each worker node spends on each edge. Crucially, we also remove the need for every worker node to have access to every community in consideration, meaning we can remove Redis from the equation, regaining the time that was lost for concurrency protection and data distribution.
Let us consider the toy example in Figure 2. The initial seed set nodes are 0 and 1, belonging to two different communities. Initially, each community has only one member, respectively, nodes 0 and 1; they are assigned to different worker nodes. As we process the new edge , we expand the community structure and add node 2 to the community of node 1 of the first worker node.
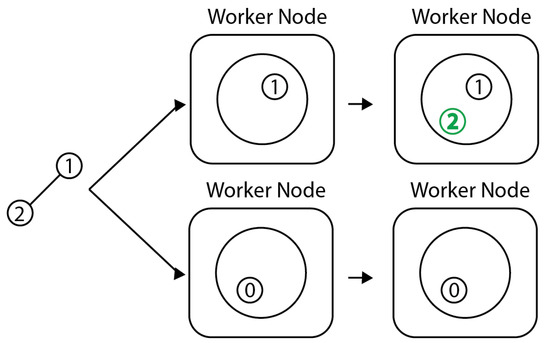
Figure 2.
Toy example illustrating the initialization of communities (represented as circles) within workers (depicted as boxes), and the subsequent update after considering the edge .
Figure 3 shows a more complicated example of each worker node (a total of three worker nodes) containing three communities, before and after seeing a new edge and incorporating that edge into the communities.
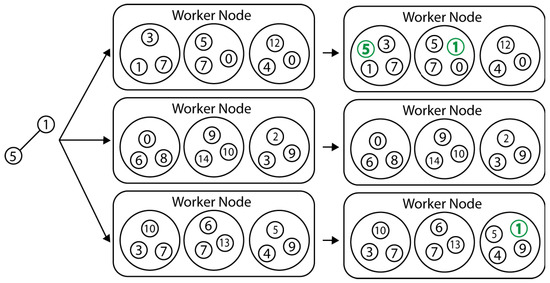
Figure 3.
Context of how CoDiS distributes the communities to several worker nodes and updates them when a new edge is given. (Communities are cycles containing nodes and each worker node is depicted as a box.)
The rest of this paper is structured as follows: Following the introduction, Section 2 lists all terms that are useful to know when reading this paper. Section 3 explores several current community detection approaches, from well-known and often-cited approaches to recent papers focusing on parallel community detection approaches. Section 4 and Section 5 delve into the changes we propose and the results of the experiments related to those changes. Finally, Section 6 concludes the discussion and highlights some improvements that we would like to consider in future work.
2. Terminology
In this section, we present the basic definitions and notations. A graph is a set of nodes and edges, , where V is the set of all nodes in the graph and E is the set of all edges. Graphs are very versatile and can be used to represent any number of complex ideas in an easy-to-parse data structure, from geographical layouts to complex interactions in social media networks. A subgraph is a graph made of a subset of the nodes and edges of another graph. Given a graph and a subgraph of G, then both and are true. A community is a subset of nodes from a graph that are densely connected to each other and weakly connected to the rest of the graph. Community detection is the process of attempting to group nodes of a graph into communities; see Figure 4 for an example. Initially, no communities are found, as shown on the left side of Figure 4. The right side of Figure 4 captures the situation after discovering the three communities, which are grouped together in ovals with different colors, and are , , and .
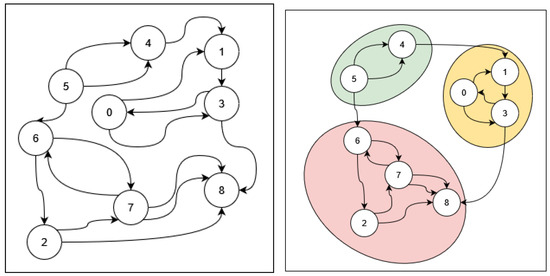
Figure 4.
Left: a graph before being split into communities, right: a graph with the discovered communities highlighted.
Edge betweenness measures the frequency with which an edge is traversed when determining the shortest path from every vertex in a graph to every other vertex. The edge betweenness of an edge e is calculated by the ratio of the number of shortest paths that include the edge e over the total number of shortest paths. A metric of the quality of the discovered communities is the modularity score when no ground truth is given. The higher the modularity score, the closer the graph is to being separated perfectly into communities, and vice versa. The community participation score [7] measures how strongly connected a node is to the nodes of a community. The community participation of node u in the community C is denoted by
where denotes the degree of node v in G, and is the community degree of node v by considering only the intra-edges (the edges between community members) of the community C.
Nodes with higher values of community participation are well connected to the community while nodes with lower values are less connected to the community. Figure 5 shows a node with a high/low participation score in the given community.
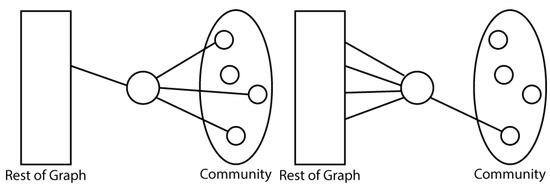
Figure 5.
Left: a node with a high participation score for the community, right: a node with a low participation score for the community.
Distributing communities in worker nodes in our community detection with seed sets (CoDiS) algorithm can be defined as follows:
- C: is the set of communities to be detected.
- T: is the set of worker nodes available for parallel processing.
- : is the set of communities assigned to the i-th worker node.
- k: is the maximum number of communities in the worker nodes, e.g., .
To distribute the communities in a balanced manner among worker nodes, one can formulate the number of communities each worker node is assigned to with the following relation:
where the term represents the average number of communities per worker node, ensuring an approximate load-balancing split. We can consider the acting as an adjustment term that allows for slight variations for balancing the load. This term may depend on various factors, such as the computational power of each worker node (case of heterogeneous worker nodes). For our approach, we assume that all worker nodes are homogeneous, i.e., have the same computational power and hardware; thus, the term is set to zero for all workers . In this case, the maximum number of communities processed by each worker is at most .
We use the Apache Storm Java framework for distributed processing using streams maintained by Twitter and the Apache Foundation. Storm abstracts the distribution and passing of messages between compute nodes. The basic data type of the Storm distribution is a Tuple, and there are two types of processing nodes: Spouts and Bolts. A Tuple contains any number of supported data types. Tuples natively support all primitive data types, as well as Strings and byte arrays. Tuples can also support custom data types if those data types implement a serializer and register that serializer with Storm. A Topology is a construct that contains all the information about the particular setup for a given Storm program. The Topology is what is submitted to an Apache Storm cluster and contains the code that computation nodes execute, as well as how the messages are distributed between nodes and which nodes listen to each other. A Topology will run indefinitely until the user stops it or submits a new Topology to the Storm cluster. One of the two main components of an Apache Storm Topology is a Spout. A Spout is responsible for creating a stream of Tuples that are then emitted to the rest of the Topology. The Topology itself takes care of how those Tuples are distributed. Spouts cannot receive Tuples from any other processing nodes, only create and emit them. The other main component of an Apache Storm Topology is a Bolt. Bolts are typically the nodes that conduct the actual processing of the Topology. Bolts receive the Tuples emitted from Spouts or even other Bolts, and conduct some kind of processing on them. Bolts can emit their own Tuples for consumption by other Bolts. Apache Storm’s Local Mode simulates distributed computing using multi-threading, allowing an Apache Storm cluster to run without the need for multiple systems. An example of an Apache Storm Topology (in which there is one spout, three bolts that listen to the output of that spout, and two additional bolts that listen to the output of the three previous bolts) is shown in Figure 6.
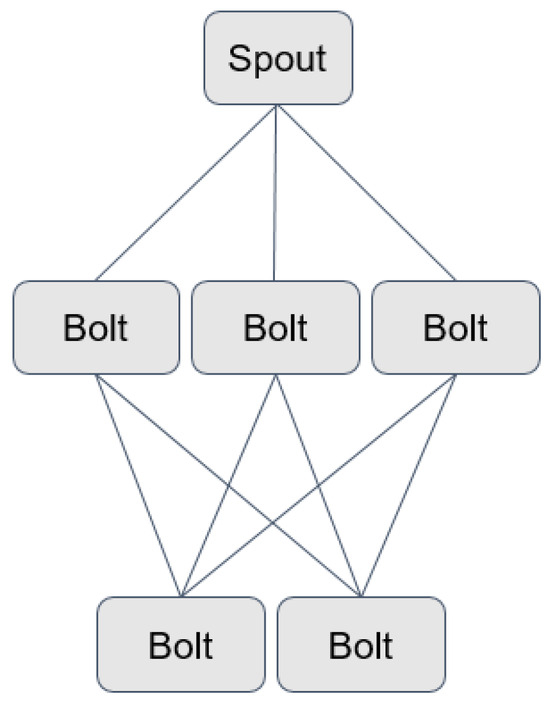
Figure 6.
Example of an Apache Storm Topology.
3. Existing Methods
3.1. Early Methods
Many of the early community detection algorithms were very simple and restrictive, but many of the concepts are still being used in modern approaches. Before these methods, simple max-flow/min-cut approaches were the norms [9], but these papers introduced concepts that revolutionized the way community detection was approached
The Girvan–Newman [1] algorithm is one of the community detection algorithms that has gained popularity. The paper introduces two major concepts that are still used in many modern approaches: edge betweenness and the modularity score. Edge betweenness is used to determine how strongly or weakly an edge is tied to the rest of the graph. Using the observation that an edge with high edge betweenness likely serves as a connection between communities, the algorithm calculates the edge betweenness of every edge in the graph and then removes the edge with the greatest edge betweenness. This process continues until it is determined that the graph has been properly partitioned into communities, and in the case of [1], the modularity score of the graph is calculated every time an edge is removed, and once the modularity score stops increasing, the algorithm finishes.
The Louvain method [10] takes the modularity score from Girvan–Newman and makes it the focus of the algorithm. The algorithm in [10] begins with every node of the graph belonging to its own community. Then, for every node and every possible community that the node could be a part of, the change in the modularity score that would occur from moving that node to that community is calculated. The change that would bring the greatest increase in the modularity score is then applied, and this continues until there are no changes that would increase the modularity score.
3.2. Later Approaches
While the earlier methods of community detection are incredibly important, they were also slow and restrictive. For example, in both [1,10], nodes could only belong to a single community, which is unrealistic for real-world applications. The following approaches attempt to solve one or more of these issues.
CONGA [11] and GONGO [12] are both variants of the Girvan–Newman algorithm, allowing nodes to participate in more than one community. Instead of calculating which edge has the greatest edge betweenness, and removing it, these algorithms calculate which node has the greatest node betweenness and splits that node. The edges of the original node are distributed to the copy nodes, and when the algorithm concludes, the communities that a node belongs to correspond to those of its copies.
CoEuS [7] attempts to solve the speed problem by only looking at a part of the graph. This method works by starting with a seed set of communities, then streams in pairs of nodes that are connected by an edge. These nodes are placed in communities based on what communities those nodes are already in; if neither node has been identified previously, a new community is created consisting solely of those two nodes.
COPRA [13] works by updating each node’s label by looking at all the labels of its neighbors, then taking the label that is the most prevalent and adding it to its list of labels.
In the SLPA (speaker–listener label propagation) algorithm [14], instead of each node looking at its neighbors’ labels, nodes choose a random label from their list of labels and broadcast it to all of their neighbors. Although randomly selected, the choice is weighted, so labels that have been seen are often more likely to be broadcast than those rarely seen.
Other very recent approaches dealing with the problem of detecting communities are reviewed in [15,16,17]. One relevant research topic involves the detection of disseminators. Reference [18] presents the dissemination of information among communities by creating backbones among them. The authors propose a new centrality measure called disseminator centrality. This measure is adept at identifying disseminator bridges, which refer to users in a social network who belong to multiple communities. These users aim to disseminate information about their interests from one community to another by supporting each other.
3.3. Current Parallel Methods
With the advent and proliferation of multi-core CPUs and the increased access to distributed computing, parallelization has become a new focus in the community detection space as a way to further increase the speed and data capacity of community detection algorithms.
Many parallel implementations work by taking a non-parallel algorithm and having it run on subsections of the graph. These subsections are then recombined in various ways to obtain the full community graph structure. The way these approaches split the graph into subgraphs, and how the subgraphs are recombined, has a large effect on the outcome.
For example, refs. [19,20,21] all use a min-cut method to split the graph, but the way in which they recombine the graphs is different. When splitting the graph, reference [19] creates copies of nodes that have edges connected to nodes in other subgraphs, and those nodes are simply combined together when the algorithm is finished. While [20] also has a combining step at the end, it does not create duplicate nodes and instead has to reconcile all the subgraphs based on their connections before separating the graph. Finally, algorithm in [21] does not have a dedicated combination step, like [19] or [20], but instead has a mini combining step at the end of every iteration of the algorithm. While our approach CoDiS does not use subgraphs directly, it is the concept of subgraphs that inspired the alternate method of distribution we employ.
Lastly, DiCeS [8] is a distributed version of [7], using Apache Storm. It involves several worker processes that can take in streamed nodes and then decide where to put them in the community graph. The created community graph is accessible to each worker process. In this approach, each edge is distributed to individual worker nodes or loads balanced to the available worker nodes. All workers access the shared data of the communities.
Improving this method is the main focus of our new approach. While DiCeS achieves speedups by parallelizing the edge processing using distributed computing, we are interested in attempting to speed up the processing time by splitting the search space between the different compute nodes. Section 4 will go into this topic in more detail.
4. CoDiS Method
Here, we describe CoDiS (originally donated as SubDiCeS). Our code, https://github.com/dude1144/SubDiCeS, accessed on 27 October 2023, is a new method that functions similarly to DiCeS [8]; it runs the CoEuS [7] algorithm in a distributed manner to achieve parallelism but modifies it so that each individual worker node only operates on a subset of the communities of interest. The implementation of this method is conducted in Java using Apache Storm to manage the distributed processing. Overlapping community detection methods require a seed set of nodes for each community of interest, and community detection then expands this set based on a participation score used as the metric.
4.1. Splitting the Communities
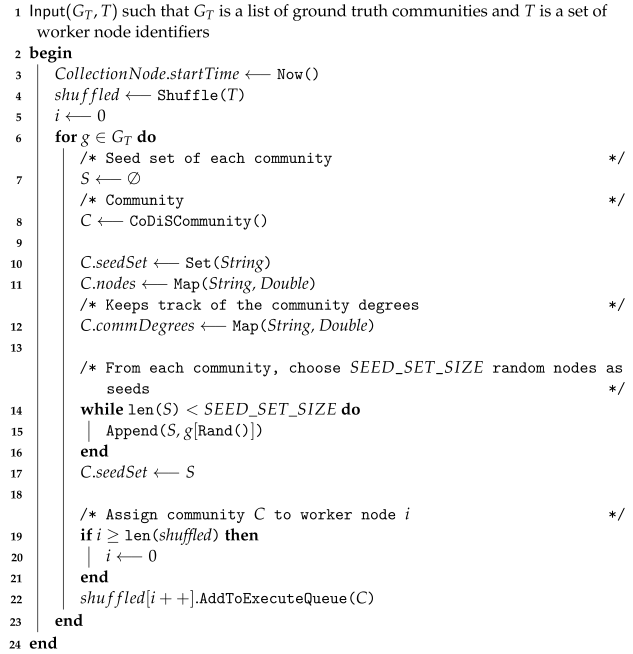
The first step of CoDiS is to initialize the communities of interest and distribute them among the worker nodes. This is done by either explicitly providing a list of seed sets or by providing ground truth communities to the graph being processed and choosing a set of random nodes to be used as the seed set. Algorithm 1 shows the pseudocode for this process.
The process begins by recording the start time and receiving a list of ground truth communities (or seed sets, if the algorithm is run on a dataset without available ground truth communities), as well as a list of identifiers to access specific worker nodes. Then, a copy of the list of worker nodes is created but with the order of those nodes randomized. The next step is to initialize the communities and distribute them to worker nodes. This is done by creating a counter i that is initialized to zero and iterating through all the ground truth communities. For each community, we initialize a CoDiScommunity object. We then select several random nodes from the ground truth communities to be used as a seed set and add those to the CoDiSCommunity seed set list. Finally, we assign this community to the worker node at index i of our shuffled list, then increment i or reset it to 0 if it becomes greater than the length of the shuffled list. Additionally, for each community C, we create a map that will keep track of the community degree of each node for the specific community in order to use it as the numerator of Equation (1). The time complexity of Algorithm 1 is ), where is the number of worker nodes, is the number of ground truth communities, and is the number of nodes in each ground truth community.
| Algorithm 1: Community initialization and distribution |
 |
4.2. Edge Ingestion and Distribution
The next step of the process is to start reading edges and distributing them to the worker nodes, as shown in Algorithm 2. The edges could be read from several sources, such as crawling the web to find links between pages or accessing a social media API to find connections between people, but for the purposes of our experiments, we find edges by reading from a text file.
| Algorithm 2: Edge ingestion and distribution |
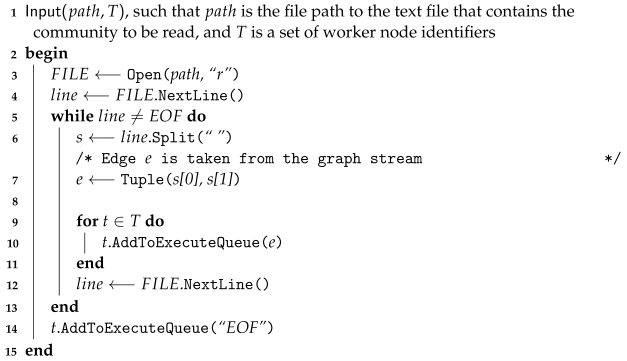 |
The process initiates by accepting (as input) a path to the file from which edges are read, as well as a list of identifiers for all the worker nodes. The file at the is opened for reading, and the process begins by reading the file line-by-line. For every line, as long as the line is not an indicator, the process splits the line into the two node identifiers of the edge that the line describes, and creates a Tuple object containing the two node identifiers. The process then adds the edge to the processing queue of all the worker threads, reads the next line from the file, and repeats the process. Once the indicator is encountered, the process adds this to the processing queue of the worker nodes and finishes executing. The time complexity of Algorithm 2 is , where is the number of edges of the graph, unfolding in parallel steps with being the number of worker nodes.
4.3. Edge Processing and Community Pruning
Algorithm 3 is where the bulk of the community detection process is done. This algorithm is run in parallel by all the worker nodes. Each worker node maintains a queue of inputs received by the edge distribution node (Algorithm 2), and runs a loop of popping the next input from the queue and running Algorithm 3 with the input from the queue as the input to the algorithm.
The first thing Algorithm 3 does is check the data type of the input that is received. If the input is a String, then we know that the indicator has been reached, and we can calculate the average F1 score of all the communities and pass that on to the collection node; see Algorithm 5. Before calculating the F1 score, we prune the community to its final size using Algorithm 4, which can be conducted either by pruning it to the size of the ground truth community it is based on or by using the drop tail technique of [7].
If the input is a CoDiScommunity, then that community is appended to the list of communities that the worker node has under inspection. If the input is a Tuple, then it is an edge that we need to process.
We begin by obtaining and from the Tuple and incrementing the total degrees for both nodes, as well as the counter that keeps track of how many edges have been processed in total by this worker node. Next, we find all the communities of this worker node that either node belongs to and start iterating over all those communities. If the community contains , then we update the estimated community degrees of using the community participation score of to incorporate the edge quality and Equation (1), and then we add to the list of nodes that are part of this community. The same is then done for , updating and adding to the community, if applicable. The time complexity of Algorithm 3 is , where is the time complexity of Algorithm 4, is the number of edges, and k is the maximum number of communities each worker node processes (a total of workers in parallel working in their assigned communities).
| Algorithm 3: Edge processing |
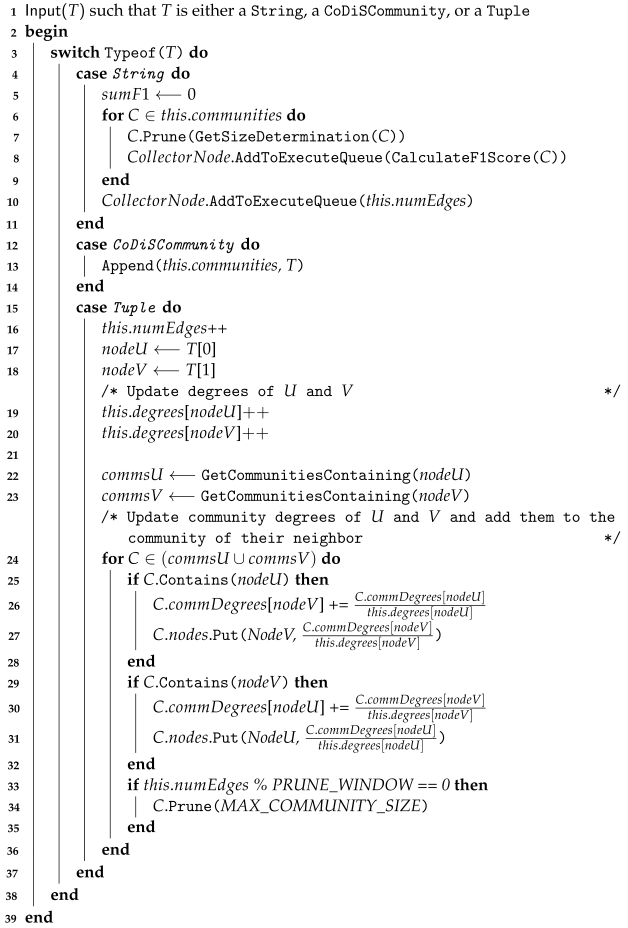 |
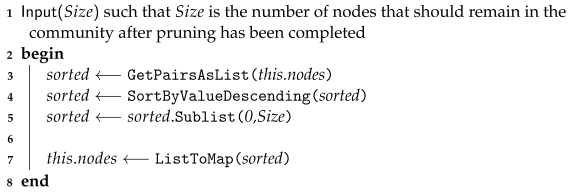
Once the processing of the edge is done, we check if the number of processed edges is a multiple of the chosen pruning window, set to 10,000 edges, as per [8]. If it is a multiple, we use Algorithm 4 to prune the community to a given size. This starts by obtaining a list of key–value pairs of the nodes the community contains and sorting that list in descending order by the value of the community participation score. We then obtain a subset of this list with only the top nodes and transform the sub-list back into a map, replacing the old community node map. Before we call Algorithm 4, each community has a size that is upper-bounded by . The most expensive step of Algorithm 4 is sorting values. By using mergeSort, the run time is for each community, and since each worker processes k communities, the total running time is for each worker. We can use maximum heaps and spend time, assuming .
| Algorithm 4: Prune (Community Pruning) |
 |
4.4. F1 Score Collection and Termination
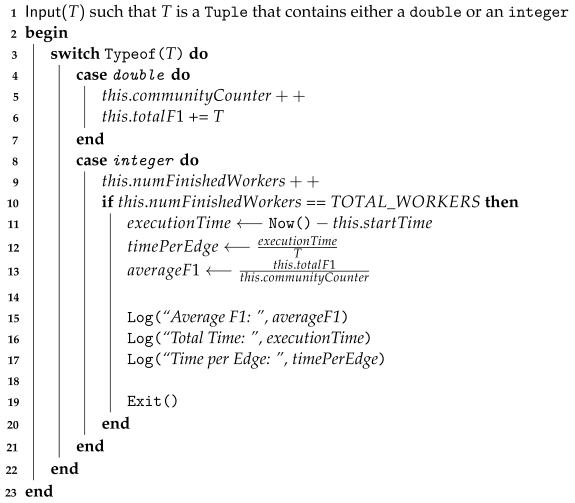
Algorithm 5 is the process that receives the output from all the worker nodes, reports the results, and terminates the program. The process receives (as input) a Tuple from the worker nodes, containing either a double or an integer.
If the received Tuple is a double, then we know the process has received an F1 score for a single community from a worker node. We then add this F1 score to the total sum of F1 scores and increment the community counter.
If the received Tuple is an integer, it indicates that the worker node sending it has completed calculating and transmitting the average F1 score for all the communities it is evaluating. The integer sent is the total number of edges the worker node processed. Further, we increment the finished workers counter, and once this counter matches the number of worker nodes, we can calculate and log the analysis data. We subtract the start time from the current time to obtain the total execution time and then divide that by the number of edges to obtain the average time per edge. Finally, we divide the summed F1 scores by the total number of communities to obtain the average F1 score, and write all these values to a log for analysis.
The time complexity of Algorithm 5 is , where k is the maximum number of communities that each worker node processes, and is the number of total node workers.
| Algorithm 5: Collection and termination |
 |
4.5. Apache Storm
Apache Storm is used to implement the distributed computing components of CoDiS. Apache Storm takes care of passing the messages between different execution nodes. In addition to handling communication between execution nodes, the Apache Storm implementation also contains a Topology, which handles how messages should be distributed between nodes and which nodes receive messages from other nodes. For example, we do not explicitly distribute messages as in lines 4 and 19–23 of Algorithm 1. Instead, once the Topology is set up, we simply call emit(Tuple), and the Topology takes care of evenly distributing the emitted Tuples to the worker nodes that are listening to the node emitting the Tuples.
Algorithms 1 and 2 are handled by CoDiSSpout, which extends Spout. Algorithms 3 and 4 are handled by CoDiSBolt, which extends Bolt. Algorithm 5 is handled by CoDiSBolt, which also extends Bolt.
CoDiSSpout starts the process, and, therefore, there is only one instance of it, which does not listen to the output of any other nodes. CoDiSBolt implements the worker nodes, so there are as many instances of CoDiSBolt as the desired execution threads, and all the CoDiSBolts listen to the output of the single CoDiSSpout instance. Finally, there is only a single CoDiSCollectionBolt, which listens to the outputs of all the CoDiSBolts.
5. Experimental Results
The experiments for the new method proposed in Section 4 were run on four of the six datasets, see Table 1, compared to those on which DiCeS [8] was run on. The system used for experimentation is a Linux box running Ubuntu 22.04.1, with a core i7-12700K CPU and 64 GB of RAM. All tests were run using 2, 3, and 4 bolts in local mode on the same system and under the same conditions. They were all run 10 times using Maven and OpenTap to automate running the tests and collecting the results. The input graph text file was shuffled before each test and the seed set for each ground truth community was chosen randomly. The tests were run using the top 5000 ground truth communities with greater than 20 participating nodes, just as in [8].

Table 1.
The counts of nodes and edges for each dataset used, as well as the average F1 score for both DiCeS [8] and CoDiS when run on our test machine.
The reason only four of the six datasets were used is that both DiCeS [8] and CoDiS eventually ran out of memory on our test system when running the Orkut and Friendster datasets. These datasets, as well as the top 5000 ground truth communities, are publicly available https://snap.stanford.edu/data/#communities, accessed on 27 October 2023. No changes to the source code were made, the sole exception being the hard-coded file names and number of edges for the reproducible tests.
5.1. F1 Score Evaluation
The average F1 score results of CoDiS are of the results from running the provided code for [8] for all datasets as shown in Table 1. On average, the average F1 score of CoDiS was lower than that of [8], with the greatest discrepancy being the results from the Amazon dataset, with a difference of 0.017914. This is not a rule, however, as the average F1 score of the DBLP dataset when run in CoDiS was actually higher than the average F1 score when run on [8].
One observation we made during testing is that there was significantly more variation in the average F1 score for [8] than for CoDiS. When run with a non-random seed set and with the same input graph file, there was no observed variation in the average F1 score for CoDiS on any dataset. This is not true of [8], however, and we continued to observe variations in the F1 score, even after locking the seed sets. We believe that this is due to the fact that the pruning step of [8] is conducted in parallel to the worker node execution. Thus, due to different OS scheduling, it is possible for certain edges to be processed during or after the pruning step, therefore changing the results run-by-run. This is not an issue in CoDiS, as it is guaranteed that the same edges will be processed before pruning on every execution.
5.2. Execution Time Evaluation
The main goal of our approach was not to improve the accuracy of [8] but to improve the running time. The main metric that we look at to validate this is the average time it takes to process a single edge. This metric was calculated by measuring the entire runtime of the program (in microseconds) after community initialization and then dividing that by the number of edges processed. This gives a good average time without the overhead required to time each individual edge and average them at the end.
Figure 7 shows the average time per edge for CoDiS and DiCeS [8] at different worker node counts. Across the board, there was a significant decrease in time when running CoDiS as opposed to DiCeS [8]. The average decrease in processing time is 3.34 times faster than DiCeS [8]. At 2 bolts, the speedup is 3.26 times greater, at 3, it is 3.17 times greater, and at 4, it is 3.58 times greater.
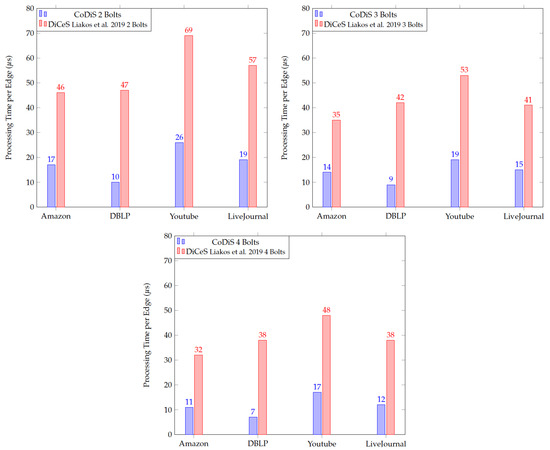
Figure 7.
Comparison between the average time per edge for CoDiS and DiCeS [8] when run on our test machine with 2, 3, and 4 processing nodes, averaged over 10 runs.
5.3. Space Usage Evaluation
While the goal of our approach is to improve the runtime, there is unfortunately a negative effect on the space used because of our changes. In addition to keeping track of the community degree of every node for every community, both CoDiS and DiCeS [8] need to keep track of the total degrees as well. Because the data are no longer stored in a centralized location, each individual worker node has to maintain the total degree count itself. This means that the space required to store the node degrees scales with the number of worker nodes being deployed.
Figure 8 shows the difference in memory usage between CoDiS and DiCeS [8] when run on the same dataset and differing numbers of Bolts. These data were collected using VisualVM to monitor the heap size and actual heap utilization of the JVM as the program ran. The average memory usage of DiCeS [8] remains relatively constant even when the number of bolts changes, whereas the memory usage of CoDiS scales almost linearly with the number of bolts.
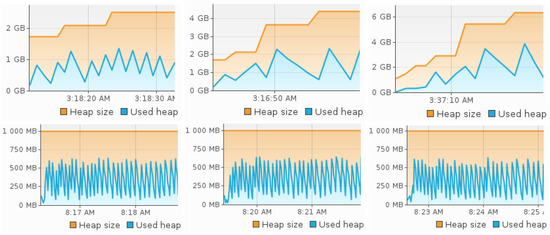
Figure 8.
Top: The memory usage of CoDiS at (left to right) 2, 3, and 4 Bolts. Bottom: The memory usage of DiCeS [8] at (left to right) 2, 3, and 4 Bolts.
However, we believe that these results are not actually indicative of a real-world application. While this increase in space usage is obvious when running on a single system in local mode, we believe that this discrepancy in space usage would be significantly reduced in an actual distributed-computing setup. Because of the nature of a distributed-computing deployment, the data will not be duplicated on any single machine and are instead shared among all the machines. In addition, in an actual deployment, the data of the Redis cluster are shared between all the machines, meaning the data access time would be even longer than when run on a single machine, as in testing.
5.4. Issues with Non-Shuffled Input Graphs
During our testing, we found that there was a large discrepancy between the results reported in [8] and the results we saw when we ran on our test system. The shortest time to process an edge, as reported in [8], is when working with the Amazon dataset, at 210 s per edge. DBLP and LiveJournal both took around 300 s per edge, approximately 1.42 times longer per edge than when running on the Amazon dataset. YouTube took the longest at around 365 s per edge, approximately 1.74 times longer than Amazon.
When running the source code for [8] on our test system, which uses a much faster CPU, we found that it only took 38 s on average to process an edge for the Amazon dataset. If the times followed the same scaling as in [8], we would expect the time per edge of the DBLP dataset to be s, which is almost exactly what we saw when actually running it on our machine.
Unfortunately, this is where the similarities stop, as both the YouTube and LiveJournal datasets had significantly higher processing times per edge than we expected, with LiveJournal taking 4 times longer than expected and YouTube taking a whopping 31 times longer. Figure 9 shows the expected running time per edge of DiCeS [8] on our machine, extrapolated from the running time of the Amazon dataset, and the results from [8]. This increase in time per edge was immediately apparent; the processing time did not increase as the program ran but instead was longer from the very first edge.
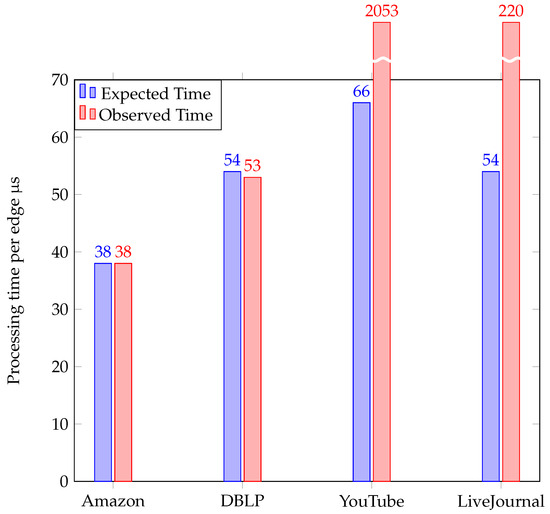
Figure 9.
Comparison between the expected DiCeS time per edge [8] and the actual time per edge on the YouTube dataset with 4 bolts.
In order to confirm that it was not an issue with our test machine, we ran the tests on two other machines (both running Windows 10): a desktop system with an i7-7700k CPU and 32 GB of RAM, and a laptop with a Ryzen 9 4900 HS and 16 GB of RAM. While the time per edge of these systems varied due to the different specifications, we saw a large jump when being run on the YouTube and LiveJournal datasets.
Thankfully, with the help of Dr. Liakos, one of the authors of [8] and the individual who maintains the GitHub repository for the paper, we were able to determine the cause of the problem. Dr. Liakos informed us that not only were the seed sets randomized between each test but the input graph file was shuffled as well. Figure 10 shows that after performing this shuffling, the runtime of DiCeS [8] was more in line with what we expected to see.
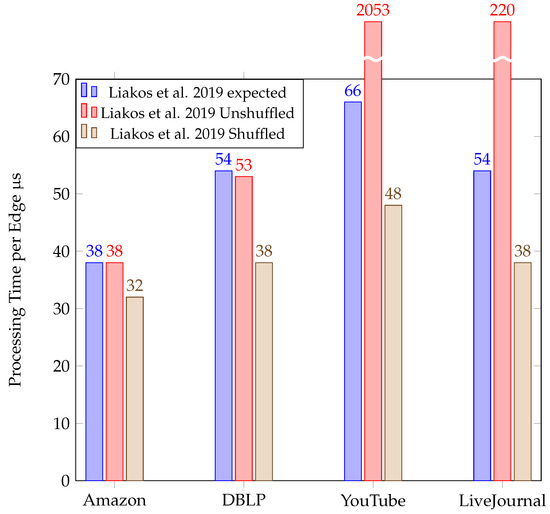
Figure 10.
Comparison between DiCeS [8] running times observed after shuffling the input graph and the expected and observed times from the non-shuffled input graph.
The reason this happens is that in a dense graph, like YouTube, a single node can have hundreds of edges. Because of this, any communities with that node in the seed set will quickly grow very large before pruning can occur, causing the processing for those communities to become exceptionally long. Additionally, because all the edges are going to many of the same communities, many worker nodes all attempt to access the same resources at once, leading to a large bottleneck. We believe that this is why we did not see the same exponential increase in time with an unshuffled graph in CoDiS; even if a worker node receives several edges that go to the same community in a row, it can quickly throw them out if those edges do not belong to any of its communities. Even if they do, the worker node does not have to wait for other workers to access any resources, and can immediately process the node.
This scenario can naturally occur. Consider a web crawler that emits edges representing links between web pages. If this crawler comes across a page with a large number of links to other pages and emits all those links before crawling to any of them, it would be the same scenario as reading an unshuffled graph, as we would receive several edges in a row that all share at least one node in common.
6. Results and Conclusions
In this paper, we propose a novel method called the community detection with seed sets (CoDiS) algorithm, which solves the overlapping community detection problem in graph streams. This new algorithm is inspired by a subgraph approach and takes advantage of the unique way DiCeS [7] approaches community detection to process the communities themselves in parallel instead of individual edges. By doing this, we hope to gain significant time savings by removing the need for data distribution among systems and concurrency protection, while having little to no impact on the accuracy of the communities found.
In addition, we discovered a previously unknown downside in [8]: a significant loss in processing speed when the input comprises a long run of edges sharing the same node. This situation is not unlikely to be encountered in a real-world deployment, so the fact that our implementation is not vulnerable to this event is another improvement over the original approach.
Section 5 shows that we successfully achieved this goal. Our proposed implementation had little to no change in the F1 score, with the difference in the average F1 score being smaller than the largest variation seen in the F1 score across DiCeS runs [8]. Based on these results, we believe that our implementation is a significant improvement to DiCeS [8], and can even be improved further.
6.1. Discussions
We parallelize the problem by splitting the communities among the worker nodes, such that no concurrency issues arise. Every time we consider a new edge to expand the existing communities, each worker node handles this within its assigned subset of communities. The speedup that we achieved was an average of times greater with 2, 3, and 4 bolts.
In our approach, we assume that all worker nodes are homogeneous and the adjustment term is 0 in Equation (2). Having the same worker nodes simplifies our model, making it easy to simulate. Additionally, it is easy to scale the algorithm by adding or removing worker nodes as needed. However, in real parallel computing systems, worker nodes exhibit different computational power and capabilities. These differences can be due to various factors; taking into account these differences offers advantages and challenges at the same time.
Detecting overlapping communities in parallel can result in energy savings by optimizing the utilization of computational resources. By distributing the workload across multiple worker nodes or cloud clusters, we can achieve faster execution and reduce energy consumption.
6.2. Future Work
While the work we have conducted to implement our novel method has already shown significant improvement, there is still more we would like to do in order to further optimize the method. In the following subsections, we discuss some ideas.
6.2.1. Custom SortedMap
In [8], all data are stored in a Redis cluster. The community nodes specifically are stored in what Redis calls a SortedSet, which is essentially a String to a Double map that is sorted on the value of the Double. This allows Redis to quickly remove the last X values from the SortedSet. As removing Redis was one of the major goals of our implementation, we were unable to use this dataset, and instead used a Java HashMap. Because of this, whenever we wanted to prune a community, we needed to obtain the map pairs as a list, sort that list, obtain only the first X values that we wanted to keep, create a new HashMap from those pairs, and then replace the current HashMap with the new one. This introduced additional space complexity to our approach. In the future, we would like to create a custom data type that can be kept sorted, allowing for easy and quick pruning while not losing the fast access time of a HashMap.
6.2.2. Parallelize Pruning
One of the advantages of making community data available to all processing nodes is that it is possible to move the pruning of the communities to its own processing node. By removing Redis from our implementation, we now have to conduct the pruning sequentially with the edge processing, meaning we have to pause edge processing any time we want to prune. In the future, we would like to look into ways to possibly move the pruning process back to being done in parallel to the edge processing. However, this might become unnecessary if the pruning process could be accelerated using a custom data type.
6.2.3. Heterogeneous Worker Nodes
Considering heterogeneous worker nodes (i.e., with varying computational power) is something that we did not consider in this paper. In this scenario, different load-balancing algorithms for assigning communities to worker nodes may be exploited by considering the computational power of the worker node. In Equation (2), the adjustment term may be different for every i-th worker. As an example, the adjustment term can be set based on the power consumption or computational capability of worker node i.
Author Contributions
Conceptualization, A.A. and K.P.; methodology, A.A.; software, A.A.; validation, P.P.; formal analysis, A.A. and K.P.; investigation, A.A.; resources, A.A.; data curation, A.A.; writing—original draft preparation, A.A., P.P. and K.P.; visualization, A.A.; supervision, K.P.; project administration, K.P. All authors have read and agreed to the published version of the manuscript.
Funding
The research presented in this publication was supported by the Division of Research and Innovation at San José State University under Award Number 22-RSG-08-034 to Katerina Potika. The content is solely the responsibility of the authors and does not necessarily represent the official views of San José State University.
Data Availability Statement
Not applicable.
Conflicts of Interest
The authors declare no conflict of interest.
Abbreviations
The following abbreviations are used in this manuscript:
| CoDiS | community detection with seed sets |
| DiCeS | distributed streaming community detection |
| CoEuS | community detection via seed set expansion |
| CPU | central processing unit |
| RAM | random access memory |
References
- Girvan, M.; Newman, M.E.J. Community structure in social and biological networks. Proc. Natl. Acad. Sci. USA 2002, 99, 7821–7826. [Google Scholar] [CrossRef] [PubMed]
- Fortunato, S. Community detection in graphs. Phys. Rep. 2010, 486, 75–174. [Google Scholar] [CrossRef]
- Kulkarni, K.; Pagourtzis, A.; Potika, K.; Potikas, P.; Souliou, D. Community Detection via Neighborhood Overlap and Spanning Tree Computations. In Algorithmic Aspects of Cloud Computing: 4th International Symposium, ALGOCLOUD 2018, Helsinki, Finland, 20–21 August 2018; Lecture Notes in Computer Science; Springer: Berlin/Heidelberg, Germany, 2018; Volume 11409, pp. 13–24. [Google Scholar]
- Potikas, P.; Souliou, D.; Pagourtzis, A.; Potika, K. A parallel community detection algorithm based on spanning trees. In Proceedings of the Eighth IEEE International Conference on Big Data Computing Service and Applications, BigDataService 2022, Newark, CA, USA, 15–18 August 2022; IEEE: Piscataway, NJ, USA, 2022; pp. 61–65. [Google Scholar]
- Wang, W.; Tang, C.Y. Distributed computation of node and edge betweenness on tree graphs. In Proceedings of the 52nd IEEE Conference on Decision and Control, Firenze, Italy, 10–13 December 2013; pp. 43–48. [Google Scholar]
- Riedy, J.; Bader, D.A.; Meyerhenke, H. Scalable Multi-threaded Community Detection in Social Networks. In Proceedings of the 2012 IEEE 26th International Parallel and Distributed Processing Symposium Workshops and PhD Forum, Shanghai, China, 21–25 May 2012; pp. 1619–1628. [Google Scholar] [CrossRef]
- Liakos, P.; Ntoulas, A.; Delis, A. COEUS: Community detection via seed-set expansion on graph streams. In Proceedings of the 2017 IEEE International Conference on Big Data (Big Data), Boston, MA, USA, 11–14 December 2017; IEEE: Piscataway, NJ, USA, 2017. [Google Scholar]
- Liakos, P.; Papakonstantinopoulou, K.; Ntoulas, A.; Delis, A. DiCeS: Detecting communities in network streams over the cloud. In Proceedings of the 2019 IEEE 12th International Conference on Cloud Computing (CLOUD), Milan, Italy, 8–13 July 2019; IEEE: Piscataway, NJ, USA, 2019. [Google Scholar]
- Newman, M.E.J.; Girvan, M. Finding and evaluating community structure in networks. Phys. Rev. E Stat. Nonlin. Soft Matter Phys. 2004, 69 Pt 2, 026113. [Google Scholar] [CrossRef] [PubMed]
- Blondel, V.D.; Guillaume, J.-L.; Lambiotte, R.; Lefebvre, E. Fast unfolding of communities in large networks. J. Stat. Mech. 2008, P10008. [Google Scholar] [CrossRef]
- Gregory, S. An algorithm to find overlapping community structure in networks. In Knowledge Discovery in Databases: PKDD 2007; Springer: Berlin/Heidelberg, Germany, 2007; pp. 91–102. [Google Scholar]
- Gregory, S. A fast algorithm to find overlapping communities in networks. In Machine Learning and Knowledge Discovery in Databases; Springer: Berlin/Heidelberg, Germany, 2008; pp. 408–423. [Google Scholar]
- Gregory, S. Finding overlapping communities in networks by label propagation. New J. Phys. 2010, 12, 103018. [Google Scholar] [CrossRef]
- Xie, J.; Szymanski, B.K.; Liu, X. SLPA: Uncovering overlapping communities in social networks via a speaker-listener interaction dynamic process. In Proceedings of the 2011 IEEE 11th International Conference on Data Mining Workshops, Vancouver, BC, Canada, 11 December 2011; IEEE: Piscataway, NJ, USA, 2011. [Google Scholar]
- Bonifazi, G.; Cecchini, S.; Corradini, E.; Giuliani, L.; Ursino, D.; Virgili, L. Investigating community evolutions in TikTok dangerous and non-dangerous challenges. J. Inf. Sci. 2022, 01655515221116519. [Google Scholar] [CrossRef]
- Saltz, M.; Prat-Pérez, A.; Dominguez-Sal, D. Distributed community detection with the wcc metric. In Proceedings of the 24th International Conference on World Wide Web, Florence, Italy, 18–22 May 2015. [Google Scholar]
- Garrels, T.; Khodabakhsh, A.; Renard, B.Y.; Baum, K. LazyFox: Fast and parallelized overlapping community detection in large graphs. PeerJ Comput. Sci. 2023, 9, e1291. [Google Scholar] [CrossRef]
- Bonifazi, G.; Cauteruccio, F.; Corradini, E.; Marchetti, M.; Pierini, A.; Terracina, G.; Ursino, D.; Virgili, L. An approach to detect backbones of information diffusers among different communities of a social platform. Data Knowl. Eng. 2022, 140, 102048. [Google Scholar] [CrossRef]
- Kuzmin, K.; Shah, S.Y.; Szymanski, B.K. Parallel overlapping community detection with SLPA. In Proceedings of the 2013 International Conference on Social Computing, Washington, DC, USA, 8–14 September 2013; IEEE: Piscataway, NJ, USA, 2013. [Google Scholar]
- Zhang, Y.; Yin, D.; Wu, B.; Long, F.; Cui, Y.; Bian, X. PLinkSHRINK: A parallel overlapping community detection algorithm with Link-Graph for large networks. Soc. Netw. Anal. Min. 2019, 9, 66. [Google Scholar] [CrossRef]
- Sun, H.; Jie, W.; Loo, J.; Wang, L.; Ma, S.; Han, G.; Wang, Z.; Xing, W. A parallel self-organizing overlapping community detection algorithm based on swarm intelligence for large scale complex networks. Future Gener. Comput. Syst. 2018, 89, 265–285. [Google Scholar] [CrossRef]
Disclaimer/Publisher’s Note: The statements, opinions and data contained in all publications are solely those of the individual author(s) and contributor(s) and not of MDPI and/or the editor(s). MDPI and/or the editor(s) disclaim responsibility for any injury to people or property resulting from any ideas, methods, instructions or products referred to in the content. |
© 2023 by the authors. Licensee MDPI, Basel, Switzerland. This article is an open access article distributed under the terms and conditions of the Creative Commons Attribution (CC BY) license (https://creativecommons.org/licenses/by/4.0/).