Abstract
Automatic Weather Stations (AWS) are extensively used for gathering meteorological and climatic data. The World Meteorological Organization (WMO) provides publications with guidelines for the implementation, installation, and usages of these stations. Nowadays, in the new era of the Internet of Things, there is an ever-increasing necessity for the implementation of automatic observing systems that will provide scientists with the real-time data needed to design and apply proper environmental policy. In this paper, an extended review is performed regarding the technologies currently used for the implementation of Automatic Weather Stations. Furthermore, we also present the usage of new emerging technologies such as the Internet of Things, Edge Computing, Deep Learning, LPWAN, etc. in the implementation of future AWS-based observation systems. Finally, we present a case study and results from a testbed AWS (project AgroComp) developed by our research team. The results include test measurements from low-cost sensors installed on the unit and predictions provided by Deep Learning algorithms running locally.
1. Introduction
The study of weather phenomena as a method for predicting weather changes started from ancient Greece. Aristotle, in his work Meteorologica attempted to explain atmospheric phenomena in a philosophical and speculative manner. However, the first weather instruments were invented at the end of the sixteenth century: the thermometer in late 1600, the barometer in 1643, and the hygrometer (for measuring humidity) in the late 1700s [1]. As more instruments were developed, weather measurement became more precise and reliable. The invention of the telegraph in 1843 allowed the transmission of weather observations. Another major leap forward was made in 1950 with the usage of computers for solving complex mathematical equations describing the atmospheric behavior and the usage of Doppler Radars, which provided the ability to peer into severe thunderstorms and unveil the phenomena taking place inside [1].
In a series of International Meteorological Conferences (starting in 1873), instructions were issued regarding meteorological data acquisition, which included measurements as well as the exchange of data between Meteorological Services. Additional guidelines were issued for the analysis, forecasting, and map creation of these data. The International Meteorological Organization was founded in 1878, with main goal the improvement of the organization between national meteorological services. It was renamed the World Meteorological Organization in 1950 [2].
The usage of the measured data as well as the guidelines for collecting them is the responsibility of the World Meteorological Organization (WMO), and during the years, various methods and observing systems (Aeronautical, Marine, Aircraft-based, and Terrestrial) became available to the research community and agencies. WMO is also interested in systems capable of retrieving meteorological data as well as environmental observations automatically by Automatic Weather Stations (AWS) and collecting data from a network through various communications channels. The implementation, installation and operation of AWS is a task that is analytically described in the World Meteorological Organization’s publications and guidelines [3,4].
An AWS is defined by WMO as a meteorological station at which observations are made and transmitted automatically. An AWS is used in order to increase the number and reliability of surface observations [4]. According to WMO, there are four (4) categories of AWS:
- Light AWS for measurement of few variables (precipitation and/or air temperature).
- Basic AWS for the measurement of basic meteorological measurements (air temperature, relative humidity, wind speed and direction, precipitation, and atmospheric pressure).
- Extended AWS that measure additionally solar radiation, sunshine duration, soil temperature, and evaporation.
- AWS with automation of visual observations (cloud base height and present weather).
All the categories provide the capability of logging data using a proprietary data logger as well as the ability of transmitting data using a variety of methods. Additionally, to the aforementioned categories of AWS, WMO recognizes another type of weather station briefly entitled as Automatic Weather Station—Low Cost (AWS-LC). This type of station is characterized by their low cost of usage and purchase as well as the low power consumption, the capability of data transmission in real time (with or without logging), and finally their size, which is small and compact. However, due to their consumer market orientation and the usage of electronics and sensors produced by vendors without extensive experience in meteorological measurements, the gathered data quality quickly becomes unknown, and AWS-LC stations are not standardized at this moment [4].
Generally, three (3) types of AWS-LC are recognized by WMO: Compact, All in One, and Stand-Alone. Compact and All in One are basic types that are mainly aimed toward hobbyist users who want to gather information regarding the weather locally. These two types sometimes provide the capability to transmit limited volumes of data locally but generally lack the capability of logging data. The third type (Stand-Alone instruments) uses a network of individual intelligent instruments, transmitting information using low-power and low bandwidth interfaces via Wi-Fi and Bluetooth to centralized processing servers [4]. This type of weather stations is optimized for siting and individual measuring instruments selection. The most common layout used to deploy the various instruments is star topology. In this case, every host (in the case of AWS-LC, every measuring device) is connected to a central hub. This hub acts as a conduit to store and transmit the messages [5].
There are numerous advantages using AWS and AWS-LC systems instead of the more traditional manned stations; these advantages include the ability to monitor data in sparse and rural areas, cost reduction, reduction of random errors, increased reliability, measurement accuracy, etc. [3,4]. However, there are also some disadvantages that must be considered prior to the installation of these types of meteorological stations. These disadvantages mainly include the difficulty of installation, the occasional disagreement of professional meteorological observers regarding the automatic interpretation of the measured data (especially in the case of precipitation, cloud cover, and cloud base), transmission costs, etc. [3,4,5,6].
This paper firstly aims at reviewing the methodologies and technologies used for the implementation of AWS observing systems. Secondly, we make an extensive presentation of new and innovative usages of current computer science trends such as Edge computing, Internet of Things, and Low-Power Wide-Area Networks on the implementation and operation of an AWS-based observation system. Additionally, a case study is presented regarding a patented low-cost AWS and future improvements. All things considered, we discuss AWS in the Internet of Things and future work.
2. Automatic Weather Station Systems and Related Work
2.1. WMO Automatic Weather Stations Observing Systems
A typical Automated Weather Observing Station (AWOS) is a combination of sensing instruments, interfaces, processing devices, and transmission units. Based on WMO [4], an AWOS, as illustrated in Figure 1, is usually part of an integrated system that consists of three (3) main elements:
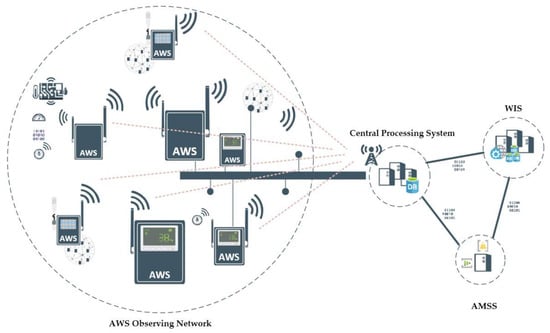
Figure 1.
An integrated observing system based on World Meteorological Organization (WMO) system architecture.
- The AWS units and the sensing instruments attached to or connected to it.
- The local modem or interface used to connect AWS to a telecom or computer network.
- A Central Processing System fed by data transmitted by all the AWS making up the Observing Network. This system usually connects:
- To the WMO Information System (WIS), or
- To an Automatic Message Switching System (AMSS) linked to the WIS.
2.2. Automatic Weather Stations Topologies
The term topology is usually used to describe the arrangement with which computer systems or network devices are connected to each other. Topologies may define both the physical and logical aspects of a network. The same logic is used regarding the deployment of AWS or AWS sensors and the communication between the AWS and the central unit as well as the communication of AWS sensors [7].
The topologies available for the creation of AWS networks and the communication of these networks with a repository/storage and processing of the collected measurements are:
- Point to Point. The AWS and the central unit are directly connected regardless of the connection means (wired or wireless). The same methodology can be considered in the case of sensors. Each sensor is directly connected to the AWS using a dedicated mean of data transfer (usually a cable). This topology is the most basic and easiest to implement, as it requires a direct connection of the sensor to the AWS or the AWS to the data network. For this reason, it is the easiest topology to implement. However, this type of connection is prone to failure mainly due to the fact that if the connection medium (or modem) fails, the AWS loses its connection to the network.
- Bus. The AWS share a single communication line or cable. Directly in line with the aforementioned methodology, the sensors can be connected to the AWS using a single line or cable. This methodology is used for the connection of sensors using the Serial Peripheral Protocol (SPI). This topology is used to connect AWSs (or sensors) that are located in series (for example, in case of capturing measurements across a riverbed). It is easy to implement but it has an inherent disadvantage due to the fact that if the line is damaged, then all the stations (or sensors) are completely disconnected, even if the ones before and after the break are functioning properly.
- Star. All AWSs are connected to the central unit, using a point-to-point connection. Each unit uses a wired or wireless interface to connect to the central unit. The same methodology can be used for the connection of the sensors to the AWS where each sensor is directly used to the AWS using a wired or wireless interface for data transfer. The star topology is considered a safe choice regarding the sensor connection to the AWS. This is due to the fact that even if a sensor connection fails, the others can still function properly. In the case of an AWS network, star topology is also considered a safe choice because if a station’s connection is severed, the rest of the network can still function independently. The only disadvantage of this topology is the installation complexity.
- Mesh Topology. This methodology can be used only for connecting the AWS to the central unit, which acts as a repository and process device. In this case, each AWS is connected to one or multiple hosts. This topology has AWS that are connected to one or multiple AWS. Thus, the topology can be characterized as Full Mesh, where each AWS has a point-to-point connection with each AWS in the network, and Partially Mesh, where not all AWS have point-to-point connection to every other AWS. The Mesh topology is the most complex to use and the most resilient to failure. The installation complexity derives from the fact that (in case we use wired connections) all sensors and all AWS must be connected with each other, thus increasing the implementation difficulty. However, this topology allows the network to continue to perform measurements, even if some sensors or AWS fail due to the fact that most of the times, there is always a connection route to transfer data.
2.3. Automatic Weather Stations Data Acquisition
2.3.1. Offline Data Acquisition
Offline AWSs are described by WMO as stations recording data on site without any automatic transmission. This type of AWS is used less nowadays mainly because data are not available in real time. Additionally, they do not allow fast detection of possible failures in the equipment. Therefore, and due to the wide offer of telecommunication means, the usage of online AWS is recommended even for climatological data [4].
An example of AWS of this type are the stations used for the creation of the network installed on Reunion island for an agroclimatology and irrigation research program. A total of eight (8) AWS were installed on the remote island on various locations. Six (6) of the stations were covering the cane growing areas, whereas the other two (2) were installed at higher altitudes. Each of the stations has six sensors (solar radiation, temperature, humidity, wind rainfall, and lead wetness). The data were stored in an Erasable Programmable Read Only Memory (EPROM), and each station required a visit every month to download the measured data. The EPROM memory capacity is capable of storing data only for one (1) month, and if the personnel for some reason failed to visit the installation site, some of the stored data were lost [8]. A similar methodology was followed in an AWS installed on the summit of Cairn Gorm (1246 m above mean sea level). This station was monitoring the area using a conventional cup anemometer, a wind vane, thermometers, a typing bucket rain gauge, and some other sensors. The data were recorded using a Microdata M200 Compact Cassette logger on standard 60-min cassettes [9].
2.3.2. Online Data Acquisition
There are two (2) main considerations that must be taken into account during the design of an observation network. The first is the determination of the available telecommunication means on the installation sites composing the observation network. Many technologies can be considered: Public Switched Telephone Networks (PSTN), Integrated Services Digital Network (ISDN), leased lines, optical fibers, cellular networks, satellite networks, Wi-Fi, Bluetooth, Low-Power Wide-Area Network (LPWAN), and other wireless communications technologies can be used to create and access the AWS either through private networks or through the Internet.
The second consideration is the life cycle of the envisaged telecommunication medium, as rapid changes are possible in terms of coverage, price, but also in terms of sustainability. Therefore, the AWS should be designed having in mind the ease of change of the telecommunication interface both in terms of physical hardware and software [4].
Wired Communications
A PSTN wired communication is often available in all countries in populated areas and can be easily used for two-way data transmission using analog modems. An alternative to the PSTN is ISDN, which uses a digital network to transmit data. In general, there are two methodologies used for connection to the central system [4]. The first methodology uses a point-to-point connection. In this implementation, the central system uses a dial-up modem or a pool of modems, while the AWSs use another modem to establish the connection and transfer the collected data. The second methodology uses the Internet as a mean to transfer the data. In more detail, the AWS uses a modem to access the internet and consequently to access the central system. The second methodology eliminates the need for modem pools and subsequently is more reliable. An improvement of the second methodology in terms of data transfer speed is the usage of Digital Subscriber Lines (DSL) for the connection [4].
Finally, in case the central system is relatively close to the AWS, a direct line (leased or serial cable) can be used. This methodology was used in the design and operation of an AWS for high-quality meteorological measurements installed in the city of Agrinio (Aitoloakarnania Prefecture, Western Greece), where the close proximity of the AWS to the central processing unit allowed the researchers to establish a direct connection to the computer [3]. A low-cost robust and affordable AWS using among others a cable connection to transfer the collected data to a repository was installed in Uganda, Tanzania and South Sudan. The purpose of this research was the design of an AWS that could be used by developing countries with limited funding. The proposed AWS was evaluated for a period of five (5) months for its reliability and data accuracy [10].
Wireless Communications
Wireless communications are not—as the name suggests—based on the usage of physical means (cables, fiber optics, etc.) to establish the connection of remote devices. Wireless communications are based on the usage of the Electro Magnetic (EM) spectrum to achieve communication. The usage of different EM wavelengths defines the different Wireless Communication Technologies and proprietary Radio Frequency (RF) technologies and solutions are in use the last decades, but new multi-radio wireless networks are under development for the internet of things architecture (GSM/LTE/5G, Wi-Fi, LPWAN, Wireless Personal Area Network (WPAN), etc.).
In Italy, an AWS was installed on La Mare glacier in the Italian Alps. The AWS was installed by researchers of the Department of Land, Environment, Agriculture, and Forestry in the framework of a research project concerning the effects of climate change on the hydrology and cryosphere of high-altitude catchments. The station was equipped with a programmable data logger (CR1000), which was controlled by a basic operating system and capable of running applications in CRBASIC. The measurement equipment included an Anemometer, Nivometer, Albedometer, Igrometer, and a Thermistor. Due to its remote location, access to the station was limited to the summer period. Therefore, the need arose to upgrade the unit with a communication means that could allow researchers to easily access the station’s measurements remotely. A variety of communications methods was tested, but the remote location of the station did not allow the implementation of GSM, Wi-Fi, or microwave access to the AWS. Therefore, satellite communications were selected to establish direct communication with the unit. A Commercial of The Self (COTS) modem (MiChroSat 2403) and an omnidirectional antenna were added to the station, which allowed the usage of the Iridium cluster of satellites orbiting the earth at 780 km. The AWS is currently transmitting data every third day. This allows scientists to study glacial dynamics with a higher temporal resolution, to monitor energy and weather variables continuously, to act timely, in case of regular and irregular maintenance interventions, and to plan visits to the AWS with a more accurate knowledge of site weather conditions [11].
In Faro Portugal, a Raspberry Pi (Raspberry Pi or RPi is a Single Board Computer—SBC) was used for the creation of an intelligent weather station that was measuring three variables (global solar radiation, air temperature, and relative humidity). The station was installed at the roof of a university building and powered using solar panels. The measurements were carried out at a user specified time interval. The measured values were stored locally in an SQLite database and then transmitted to the central server using an IEEE 802.15.4 standard interface (Low-Rate Wireless Personal Area Networks, LR-WPAN).
This solution was used because the selected protocol required less energy than the Wi-Fi module of the RPi and could achieve longer communication distances (although at significantly lower bandwidths). However, RPi is not factory capable of communicating using this protocol; therefore, an extension board was created containing all the necessary integrated circuits. The board is connected to the RPi using the General-Purpose Input/Output interface. Additionally, the station could predict the evolution of each variable in a prediction horizon up to 48 steps ahead. The obtained measurements showed great accuracy when compared with other AWS solutions located in the same area. In addition, the prediction proved to be accurate with low Root-Mean-Square Error (RMSE) and Mean Absolute Percentage Error (MAPE) errors [12].
Another similar effort incorporating an Arduino platform used the Sensor Observation Service (SOS) standard of the Open Geospatial Consortium (OGC) for the creation of a weather station. The most important characteristics of the envisioned AWS were long lifetime, precise synchronization, low data rate, relatively static topology, and moderate data delay admission. The station incorporated the following sensors: air temperature, air pressure and humidity, rain gauge, air speed and direction, soil moisture, and a light sensor. The collected data were initially stored in an SD card and continuously were transmitted using a GSM modem [13].
A monitoring network composed of eight AWSs was established in Laja River Valley, Chile to study downslope winds. The stations were distributed along the river from the highest to the lowest altitude. Each AWS included the following sensors: air temperature, relative humidity, atmospheric pressure, precipitation, wind speed, and wind direction. All sensors were implemented using a weather multi-sensor (Vaisala WXT520). All stations were communicating with the base station located at the University of Concepcion using the GSM network. In more detail, every hour each AWS was sending one text message (SMS) containing all the gathered data. Each SMS (basically a text file) contained a header section with the identification number of the AWS, a date stamp, system variables (battery levels etc.) followed by the actual measurements marked. Each message was appropriately encoded in such way that it contained as much data is possible, based on the limitation of the SMS protocol, which allows the transmission of 160 characters per message. The received data were stored to the based station in a PostgreSQL database for further analysis [14].
In 2016, LoRa (Long Range), an LPWAN protocol, was developed by a group of companies called LoRa Alliance. The protocol is owned by Semtech Corporation [15]. It is based on spread spectrum modulation techniques derived from Chirp Spread Spectrum (CSS) technology patented by Lee et al. [16]. LoRa has long range (kilometers) and requires low power for the devices to communicate; thus, it is used in the deployment of AWS networks. Long-Range Wide-Area Network (LoRaWAN) is a network relying on LoRa technology to communicate. LoRa uses gateways for receiving data from LoRa end devices (called nodes) and directs them to LoRa servers. Although LoRa presents some bandwidth limitations, it can attain long-range communications.
The technology uses the unlicensed bands of 433 MHz, 868 MHz (Europe), 915 MHz (Australia and North America), 865 MHz to 867 MHz (India), and 923 MHz (Asia). The implementation based on the usage of unlicensed bands does not require any form of official permission but is vulnerable to interference. Due to its long-range capability, LoRa can support installations on remote areas (typically the range is between 5 and 10 Km, but it can be further increased using directional antennas) and allow the communication of thousands of nodes with a lifetime of 10–20 years depending on power consumption, data demands, and emission power [17]. LoRa-based networks are currently used for a variety of cases (Asset tracking, Smart Agriculture, Airport Management, Smart Home Applications, etc.) based on the research of Sinha et al [18].
In meteorological applications, some efforts were made in using LoRa-based networks. A Micro Weather Station based on the usage of an extended AWS solution using LoRa and Automatic Packet Reporting System (APRS) was developed. The idea is to provide to the crowd-sourced Citizen Weather Observer Program (CWOP) an additional radio with LoRa protocol and to implement a hardware solution to support an APRS data scheme and integration in an APRS Internet System (APRS-IS). Researchers presented hardware solutions for the AWS and a prototype Terminal Node Controller (TNC), a firmware, and an additional software implementation. The proposed topology is comprised of the weather station as an End node, while TNC plays a double role as a LoRa concentrator and as an internet gateway. At this implementation, the server side was an APRS-IS Server and the application side was an APRS client/website [19].
Researchers also proposed the extension of the wireless communication range of AWS using LoRaWAN. In this case, the authors presented three versions of a low-cost LPWAN “transponder” for receiving the radio signal of various proprietary/commercial weather stations/sensors working on 433 MHz and transmitting captured data using LoRaWAN architecture in 868 MHz. The transponder design and implementation followed three criteria: low cost, low power, and open source. This hybrid solution was implemented for two low-cost commercial weather stations using open technologies powered by 8-bit and 32-bit microprocessors. The research was concluded with the presentation of detailed power consumption measurements, without however providing more information regarding the gateway/transponder topology and distances [20].
An AWS solution based on LoRaWAN as a replacement for existing AWSs with Very-Small-Aperture Terminal (VSAT) was proposed. In this approach, the automatic weather stations were acting as End Nodes at the edge of the network, and they communicated via a Gateway to the LoRaWAN Server (ThinkSpeak Cloud). As a case study, they used data from the MetMalaysia, which has installed at least fourteen AWSs using VSAT satellite communication for internet connectivity. In this work, the authors presented data for measured Received Signal Strength Indicator (RSSI) values and calculated Free Space Path Loss (FSPL) for LoRa spectrum performance and link budget. Finally, they presented two alternative topologies using LoRaWAN as communication technology in place of VSAT [21].
A LoRa mesh network was proposed as a substitute to typical star topology. In this approach, the authors proposed a proprietary LoRa mesh network in the place of a LoRaWAN star topology. As a result, they achieved a better Packet Delivery Ratio (PDR, 88.49%) compared to a typical LoRaWAN topology (58.7%) under the same settings. The mesh approach is interesting in AWSs deployments because individual IoT instruments could communicate with each other directly in unpopulated spots, increasing data packet delivery while avoiding obstacles, and difficult terrains. However, the authors noted some problems in the proposed LoRa mesh network, such as the small number of served nodes and some drawbacks related to packet collision in the mesh approach with a larger Spreading Factor (SF) and smaller bandwidth if multiple nodes transmitted data simultaneously. Nevertheless, the core idea could be applicable in AWS topologies where the station acts as a gateway and collects measurements from a range of scattered weather instruments and sensors (mesh nodes) [22].
A LoRa mesh network was also used for gathering data from tropical climates. In this work, they implement two (2) LoRa topologies, one with a linear mesh and one with a star topology. They measured the effect of different atmospheric attenuations on PDR and in four different test cases (Line of Sight—LoS), non-LoS, during rain and without rain, and distance/PDR). The most interesting finding was that LoRa mesh networking show better performance (measured PDR) compared to star topology; however, the proposed topology does not follow LoRaWAN specifications [23].
Another research investigated the effect of weather change in LoRaWAN deployment. For this reason, a topology was implemented using four (4) Gateways and eight (8) End Nodes installed in northern Sweden. They provided real measurements for a period of eight (8) months for four (4) scenarios. In more detail, they observed how the weather changes during the year affect the LoRaWAN deployment in terms of Signal-to-Noise Ratio (SNR), RSSI, and SFs when an Adaptive Data Rate (ADR) was enabled. Additionally, the researchers also used CloudRFTM software, a radio planning commercial tool, to evaluate two propagation models (Okumura-Hata and Irregular Terrain Model—ITM) in comparison with real experimental data. Their observations about weather impact showed that cold conditions improve the SNR, whereas in a warmer environment, End Nodes tend to use lower SFs to minimize time-on-air and energy consumption [24]. Similar research was conducted using a dataset comprised of half-hour measurements for ten months from Ridgefield in Western Australia. This network consisted of LoRa underground End Nodes measuring soil moisture. The dataset included both LoRa wireless communication channel metrics and weather observations captured by a weather station and a flux tower in above zero temperatures with rare but intensive rain events [25].
Finally, a LoRa node for weather warning networks was developed in China to study extreme weather events and create an early warning system. The node measured atmospheric pressure and lightning using an IP hardware configurable Cypress Programmable System on Chip (PSoCTM) design and low-cost commercial sensors. The proposed node offered high reliability, wireless connectivity, and low-cost. In surface observations could be used as a part of a distributed AWS network and could provide alarm services for convective weather phenomena [26].
According to our research and personal experience, the global trend nowadays regarding the communication medium used for the implementation of AWS is the usage of wireless technologies with the following characteristics: low energy demand, real-time communication, and great spatial coverage. This trend is due to the fact that there is a constant need for data gathering as the phenomena occur (real time) in order to provide real-time guidance to the populations affected by them. Climate change has increased the rate of occurrence of extreme phenomena. Floods, forest fires, etc. are more common now than they were 50 years ago [27]. Therefore, there is an increasing need for real-time awareness, which can be fulfilled only by real-time access to the data. The aforementioned are also supported by the fact that the European Union is channeling large funds to member states in order to create awareness networks for populations and research on methods to mitigate climate change [28].
The usage of satellite networks could (at first) seem to be the most viable solution; however, that is not the case. Up until now, the main disadvantage of this type of communications is the lack of real-time access. Additionally, satellite networks are expensive; their access requires large installations and increased energy. The usage of LoRa technology can be considered as a viable solution to the problem of real-time access, mainly because it requires minimum installation investments, it provides great coverage, it is easily upgradeable, support’s Edge and Cloud computing solutions, is not heavily affected by extreme weather conditions, and the AWS solutions using it cause minimal interference to the natural landscape.
2.4. Internet of Things, Artificial Intelligence, and Automatic Weather Stations Systems
The last two decades’ advances in computer science, hardware design, communications, and battery technologies has created the Internet of Things (IoT), which is a new technological ecosystem of interconnected devices. This new technology will allow the activation of billions of intelligent devices at all the layers of a computer network and especially at the edge, making them appear online with enhanced capabilities (hardware and software). In addition, in the same period, Cloud Computing has a tremendous development and is changing the way of data production and consumption in everyday life. In a typical Cloud Computing paradigm, on one side, we have the Data Producer (which creates data and offers them to the cloud), in the middle, the Cloud System (powerful computational systems with intelligence) and on the other side, the Data Consumer (in interaction with a Cloud system for data consumption) [29].
This typical cloud system is functional in many applications, but in an IoT environment, critical issues are coming up related to network efficiency (bandwidth load, connectivity, and latency), scalability of the system, and privacy of data in the intermediate layers.
Based on these facts, computing technologies closer to the network edge have attracted great interest and will be key technologies to provide real IoT applications for the users. In this area, Edge and Fog computing systems are under research and development. These technologies are important because in an IoT system, these intermediate computing systems will be transformed to an online data producer and, concurrently, a consumer of the data, which is produced from IoT End Nodes and at the same time is available from the cloud services [29].
The difference between Edge and Fog computing is that in Edge computing, more focus is on the “Things” side, whereas in Fog computing, most of the focus in on the infrastructure side [29]. The key is that both computing technologies are being developed at the same layer. In our case, AWS-based observing systems will face challenges related to system design and information analysis [30] and especially as a part of an Edged IoT system. It is true that this area is still a little bit “foggy” and there is no clear distinction between Edge and Fog computing. From our perspective, Edge computing is all the available set of technologies that allows computation at the edge serving both the IoT services (upstream) and the cloud services (downstream).
Based on the literature [31] and our perspective, an Edged IoT system architecture has three (3) main layers, as illustrated in Figure 2, which are as follows:
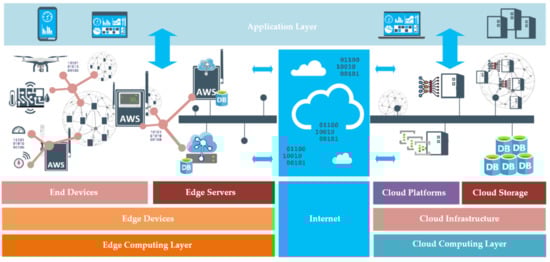
Figure 2.
Automatic Weather Stations in an Edged Internet of Things (IoT) system architecture.
- Edge Computing layer: This layer consists of:
- ○
- Edge Devices:
- ▪
- End Devices (IoT Perception layer): Connected End devices at the edge of a network with embedded processing power, primitive intelligence, network connectivity, and sensing capabilities.
- ▪
- Edge Servers (Edge Computing layer): In this layer operates all the intelligent computational systems that collect, pre-process, and communicate both with End Devices and the upper systems.
- Cloud Computing layer: In this layer, powerful cloud computing systems and servers collect, store, and process data using intelligent software.
- Application Layer (IoT applications and services): In this horizontal layer, end users/machines consume data using available Edged IoT applications/services from all the layers (Edge and Cloud).
In an IoT meteorological system, AWS-based observing systems will play a crucial role at the Edge layer. Seferagic et al. in their review paper [32] refer to the International Society of Automation (ISA) industrial systems classification, which has six (6) classes of industrial systems based on data urgency and operational requirements. In our case, AWS systems are non-critical Industrial IoT systems of 4–6 classes. Based on ISA, such kinds of systems are open loop control systems, alerting systems and information gathering systems. In the future, due to Edge computing, AWSs will have more capabilities and will serve also in more crucial applications that must provide ultra-high reliability, redundancy, and low network latency. An IoT system has a huge number of connected devices and IoT systems that offer complex services, produce enormous amounts of data, and face new tech challenges [33]. In this system, it is important for data processing to be closer to the sources than to cloud infrastructures, and this could happen in the Edge layer. A solution to this challenge is to offload a part of the workload to the edge in an IoT system.
Another emerging technology is Machine Learning (ML), which is a discipline of Artificial Intelligence (AI) that uses algorithms to train a system to detect patterns and make decisions as a human would. ML algorithms use structured data and produce outputs without human intervention. A subset of ML is Deep Learning (DL). In this subset, the learning system imitates the human brain using a network of algorithms that are called Artificial Neural Networks (ANNs) and especially in DL are Deep Neural Networks (DNNs). The DNNs have a complex mathematical basis, and their structure involves numerous layers of these algorithms. Deep Learning uses big data to study complex data and has the feature that intermediate data extracted from inner neural network layers is reduced compared to input data size. The main difference of those two disciplines is that the ML needs structured/labeled data, and DL works by imitating the human brain and extracts features during the processing through the DNN layers. ML is well known in the industry, and in the last two decades, many applications and services were developed, but traditionally, they have been solely performed on servers and high-performance infrastructures. In an IoT environment, where applications and services produce enormous data, DL has better performance and scaling with big data than classic ML. Introducing DL into IoT will be a challenging research issue in the coming years. In the IoT intermediate layer, DL [34] will play a key role enabling a technology for data processing closer to the data sources and advanced techniques for computational offloading to the edge [35]. In addition, DL extracted data reduces network traffic to cloud servers and has different semantics that ensures privacy preservation. So, implementing Deep Learning techniques to the IoT intermediate layer is important in IoT systems.
In Edge computing, it is extremely important to evaluate existing ML algorithms in edge nodes that have certain computational resources and storage capacity. In the literature, articles give testbench results of several algorithms targeting different IoT End Nodes. Due to limited computational sources, some research results are focused on Structural as well as Time Series-based weather forecasting algorithms such as Linear Regression, Multiple Linear regression (MLR), Support Vector Regression (SVR), and Auto Regressive Integrated Moving Average (ARIMA) [36]. In another article, researchers stressed IoT End Nodes, applying more complex ML algorithms such as Random Forest, Support Vector Machine (SVM), and Multi-Layer Perceptron using datasets on a Raspberry Pi to profile their performance in terms of speed, accuracy, and power consumption [37].
Interesting research work is being conducted also on the usage of Edge computing and ML algorithms for smart farming. Modern IoT systems will have capabilities to capture and process at the edge heterogeneous information such as raw data (temperatures, wind speed, etc.) and multimedia information (sky cloud cover and cloud base). In work [38], the authors presented an IoT-based system for forecasting crop frost. In the proposed system, the authors used data captured from a LoRa-based data acquisition network (upstream) and data from Open Weather web services (downstream). All these data were combined and processed using a data processing system closer to the farm and at the edge of the network, implementing different regression algorithms for forecasting. In addition, in work [39], the authors presented an IoT system architecture and implementation for smart agriculture using Edge and Fog computing. They proposed a five (5) layer system consisting of a sensor node, an Edge gateway, wireless communication LoRa repeaters, a Fog gateway, cloud servers, and an end-user application. At the Edge layer, they propose an image compression method, based on a Convolutional Neural Network (CNN), to send in a single message information about End Nodes within LoRa gateway’s range. In this approach, the authors used an advanced compression technique that reduces the size of data up to 67% with a decompression error below 5%.
3. Case Study
3.1. The AgroComp Project
Based on the literature review, the efforts that have been taken toward the design and implementation of AWSs are evident and characterized from the diversity of the solutions used. Another effort in creating a measuring station is the AgroComp project, which is a research activity funded by the Stavros Niarchos foundation aiming at the creation of a low-cost measurement station with the additional characteristic of evolvement. Thus, the station is upgradeable (in terms of sensors and other characteristics) to fulfill the changing needs in terms of measurements. Additionally, the units are expandable with new technologies that could emerge during their usage period. This is caused mainly because the researchers used COTS hardware and not proprietary solutions for the implementation of the units. The units are completely energy independent based on a combination of Solar Energy Panels and batteries to support their operation. Finally, the software needed for their operation is either Open Source or developed by the researchers under the GNU/General Public License. The AgroComp unit is presented in Figure 3.
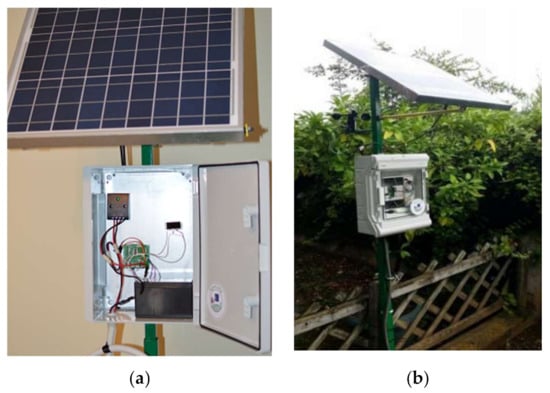
Figure 3.
AgroComp Units: (a) Testbed Unit, (b) Production Unit.
The unit consists of an installation mast 2.20 m high, on top of which a 50 W photovoltaic panel is installed. The meteorological box is located at a height of 1.20 m above the ground and is specifically designed to allow air flow inside. Inside, the data logger is installed, as well as various sensors that do not require direct contact with the environment. The case also contains the energy storage battery as well as the voltage converters, one from 18 to 12 V for battery energy storage and one from 12 to 5 V for the operation of the device.
For data logging purposes, the researchers used the Raspberry Pi Zero (RPi-0) system board. RPi-0 is a complete low-cost computing unit equipped with a powerful ARM processor (ARM1176JZ—1 GHz single core processor) with 512 MB of RAM coupled with a 16 GB SD card for storage purposes. Additionally, the board is equipped with Wi-Fi wireless connectivity and is using Linux as an Operating System (Raspbian OS). Each Raspberry includes a General-Purpose Input Output (GPIO) bus. GPIO is a common characteristic of this type of board and allows the communication with external devices. The generic pin on an integrated circuit or computer board behavior is controllable by the user at run time including whether it is an input or output pin. The number of pins in an RPi-0 is forty (40) and can supply power (3.3 Volts and 5 Volts) to connected external devices.
On top of the data logger, a specifically designed expansion board was installed (a Hat in Raspberry terminology, more details in Figure 4), which was specifically designed for the interconnection of the sensors. The board included special sockets with JST connectors (Japan Solderless Terminal—electrical connectors manufactured to the design standards originally developed by J.S.T. Mfg. Co., Osaka, Japan) to which the sensors are interconnected. The incorporation of these connectors allows the end user to add and remove sensors easily, and at the same time, it reduces the errors caused by reverse polarity connections.
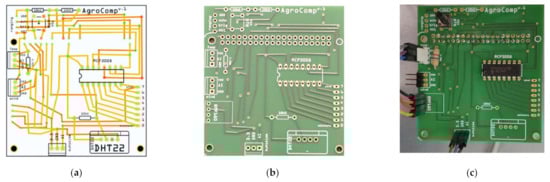
Figure 4.
The expansion board (Hat) developed for the RPi: (a) PCB schematic on the left, (b) Drilled PCB in the center, and (c) final Hat prototype.
Additionally, on the hat, an analog-to-digital signal (ADC) converter was installed (MCP3008). The ADC allows eight different inputs from different analog sensors at a sampling rate of 10 bit. It is possible to change the ADC with another providing more communication ports or higher sampling rates, thus increasing the number of sensors or the accuracy of measuring a phenomenon. The reason for using the ADC is because RPi-0 does not support analog input from any GPIO pin. The analog measurements are transformed to digital using the ADC converter assuming a proportional variation in incoming signal voltage between the minimum and maximum values.
The measuring sensors used by the platform are located either inside the box, on the ground, or on the perimeter. These sensors were:
- Soil Humidity (Adafruit STEMMA Soil Sensor—I2C)
- Soil Temperature (DS18b20)
- Air Temperature (SHT-10/DHT22/BMP180)
- Air Humidity (SHT-10 or DHT22)
- Atmospheric Pressure (BMP180)
- Wind Vane (Analog)
- Wind Direction (Analog)
- Rain Gauge (Analog)
3.2. Area Measurement Using Wireless Nodes
AcroComp is also capable of receiving additional measurements from the surrounding area. The RPi-0 built in Wi-Fi module acts as an Access Point to allow the connection of the unit to other sensors located in the area. For this reason, the ESP32 and ESP8266 modules were used (Figure 5). These two modules include a System on a Chip (SoC) solution with Wi-Fi capabilities (Bluetooth and BLE are also included in the ESP32 module), and a full TCP/IP stack. The boards have 32-bit architecture, storage memory of 1 MB (4 MΒ in the case of ESP32 module), and the capability to enter deep sleep in order to save energy. In the case of the AgroComp project, the ESP32 module was used connected with the DHT12 air temperature/humidity sensor and a set of two 18650 Li-On battery inside weatherproof cases.
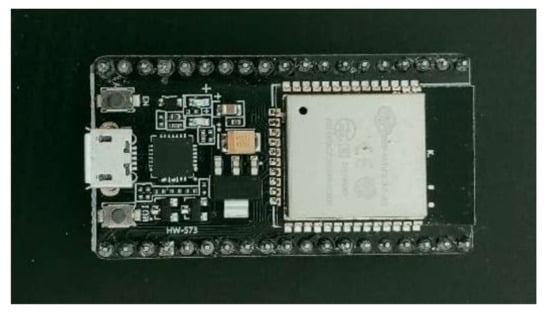
Figure 5.
The ESP32S development board used.
The module was programmed to wake up, take four measurements, and connect to the Access Point every hour. Afterwards, the system will enter deep sleep. During this time, the system minimized its power consumption to approximately 0.1 mA. During the power on and measurement cycle, power consumption reaches 3 mA for 2 min. The average autonomy provided from the battery is approximately 1.5 months.
The station’s data logger raw processing power allowed the researchers to implement on site a Web Server using a MySQL server and perform simultaneously various file tasks. Each sensor’s collected data were prior to storage filtered for any abnormal values caused by errors in measurements. These values are rejected, and the remaining values are stored locally in text files as well as in a MySQL database. In the database, each sensor is represented with different tables, which are relationally interconnected using either the timestamp of the measurement or other key fields. A variety of calculations were performed to the unit based on the collected data. Among these calculations are the Fire Risk Index, Rainfall predictions using Artificial Neural Networks, and Draught Index calculations.
The collected data are available to the end user through the local network (either Ethernet or Wi-Fi depending on the installation) or remotely through the Internet using the Web Server installed on the station. The unit is connected to the internet using either a Wi-Fi connection (when not acting as an Access Point), the Ethernet Port, or a pre-installed GSM modem. This implementation provides the users many advantages: real-time access to data, the ability to make calculations on site and thus reduce the workload on the central computer, the ability to change sampling rates, etc. [40].
3.3. Results, Measurement Accuracy of Low-Cost Sensors
An important factor affecting the selection procedure among AWS is the provided measurement accuracy. In the case of the AgroComp project, in order to test the measurement accuracy of the sensors, we collected temperature data from three different sensors and compared the measurements with a typical mercury thermometer as well as with data supplied from the Hellenic National Meteorological Service—H.N.M.S [41], as illustrated in Figure 6.
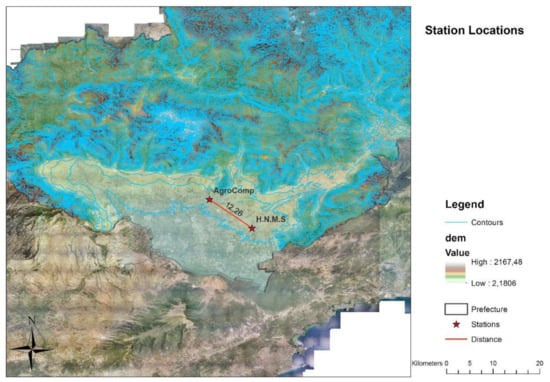
Figure 6.
Location of the two weather stations (Basemap from Greek National Cadastre).
For this reason, we used three (3) different sensors capable of measuring temperature. These sensors were the MCP9808 from Microchip Technology Inc, Chandler USA, BMP180 from Bosch (currently replaced by BMP280) and DHT 22 from Adafruit industries. These three sensors have different measuring limit capabilities, and they offer different measurement accuracy. However, it is widely accepted that in case of agricultural usage, a difference of 1 degree dose now constitutes a problem [41].
In the applied experiment, the three sensors were installed simultaneously on an RPi platform, and the unit was receiving hourly measurements for 17 days. At the same time, measurements have also been taken from a mercury thermometer, installed at the same location, using the RPi installation and a web camera and from the network of H.N.M.S.
In an effort to determine the most efficient sensor (i.e., the sensor with the most accurate measurements), we divided the sensors in pairs as follows: MCP9808 and BMP180, MCP9808 and DHT22, and BMP180 and DHT22, and we calculated the correlation between their measured values and the regression between measurement values (Figure 7, Table 1). Additionally, we also performed a two-sided t-tests in order to check whether there is a difference between the two population means. Finally, we investigated the behavior of the sensors toward the maximum and minimum values as well as the mean measurement per day.
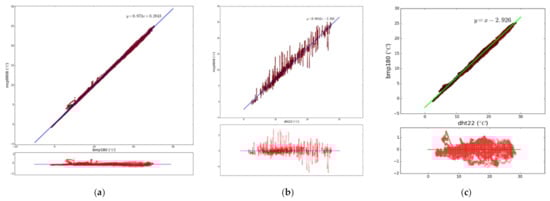
Figure 7.
Regression line and residuals for temperature values of MCP9808 and BMP180 sensors (a), MCP9808 and DHT22 (b), and BMP180 and DHT22 sensors (c).

Table 1.
Mean and standard deviation of differences of paired values between mercury thermometer and each sensor.
Regarding the comparisons between the sensor measured values and the typical mercury thermometer, in order to investigate whether the measurements received from the BMP180, MCP9808, and DHT22 are statistically identical to the distribution of actual values, we examined whether the sensor values follow a normal distribution (Oneway ANOVA); otherwise, a Kruskal–Wallis H-test was carried out when the sensor values were not normally distributed. Furthermore, regression analysis for each sensor was also conducted to determine the correlation with the mercury thermometer (Figure 8).
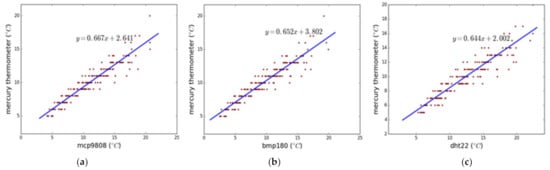
Figure 8.
Regression lines for each sensor values MCP9808 (a), BMP180 (b), DHT22 (c), and a mercury thermometer.
Finally, the standard error of estimation for the paired values (sensor measurement values and values measured by H.N.M.S.) was calculated (Table 2). From the extensive statistical analysis, it was found that regarding the comparison with the measurements from the mercury thermometer, the BMP180 sensor measures values whose distribution more closely approximates the distribution of the actual values compared with the values returned by the MCP9808 sensor. Moreover, the distribution of the DHT22 sensor values less closely approximates the distribution of a typical mercury thermometer compared with sensors BMP180 and MCP9808. When compared with values from H.N.M.S. in more detail, the BMP180 sensor provides a standard error of estimation of 1.3 degrees Celsius. Thus, the array can be used for any application that requires a temperature accuracy of 1.3 degrees or smaller. At this point, it must be also pointed out that the closest H.N.M.S. station was located approximately 12 km away at an altitude of 86.91 m. Thus, the measurement of H.N.M.S might vary from the actual in the location of the RPi installation. Finally, the results have also shown us that the accuracy of measurements is not affected by the unit used (in our case the RPi-0) for logging them. This is due to the fact that the logging unit is used for data synchronization and storage during collection. The variations from the H.N.M.S unit can be further reduced if we use other sensors (better quality).
Table 2.
Regression lines and standard errors of estimation between H.N.M.S data and each sensor.
3.4. Future Improvements Using AI
As mentioned earlier, in the short-term, AWS units will support Edge computing tasks because of the IoT environment and the increased number of end devices. In our testbed, we tested on hardware the deployment and inferencing behavior of a DL weather forecasting algorithm and the possibility of it being applied in devices at the edge.
A Deep Neural Network was implemented because it works efficiently with time-series data. A 10-year weather dataset (15 MB size) was used from Kaggle [42,43,44]. During the training, eight (8) input signals were used (temperature, pressure, etc.) to train the neural network (model). The model predicts an hourly forecast of the next day including three (3) output signals: temperature, pressure, and wind speed.
In more detail, Long Short-Term Memory (LSTM) is a Recurrent Neural Network (RNN) [38,39] feedback architecture designed to approach and model time sequences and their broader dependencies more accurately than other RNN types. LSTM is highly effective for predicting and classifying length sequences. The architecture of our model is an LSTM with 40 units and a Dense Layer with three (3) units, which are the output signals, as presented in Table 3.
Table 3.
Deep Learning model architecture, parameters, and training and test results.
The LSTM model was trained with the Keras and Tensorflow. For the training of our model, the RMSprop algorithm used for optimization, and the loss value was evaluated via RMSE. As the activation function, the sigmoid was used instead of the tanh. The test accuracy of our model reaches 88% in accuracy, and the test loss is 0.009 (Table 3). The model was trained with several numbers of units, but the highest accuracy was captured with 40 units. As presented in Table 4, the implemented model was trained using Google Colab in the Cloud, and the training time was 195 s using the available GPU infrastructure. The inferencing time in Colab was 2 s. In addition, we applied the trained model at the edge devices, and the Raspberry hardware executes the task in 6 s.
Table 4.
Training and inferencing results in three different computing platforms.
4. Discussion
In this new emerging environment, two scenarios are viable for future AWS systems: (a) the Edged IoT AWS and (b) the Cloud-based virtual AWS. In the first scenario, it is a truth that the Internet of Things technology and the intelligent End devices will change the characteristics of the modern surface observing systems, and new capabilities at the edge will transform AWS into a crucial and important component of a modern terrestrial observing system, especially in a transition period from a classical AWOS to a new one. It will be a reality that intelligent sensors (approved by WMO) will be producers of massive data, and Edged IoT AWS devices will act as Edge Processing Systems playing a significant role to collect, process, store, and offer the data to end users or upper computing layers. A concept view of a Low-Cost Automatic Weather Stations in the era of the Internet of Things is illustrated in Figure 9 [20,21].
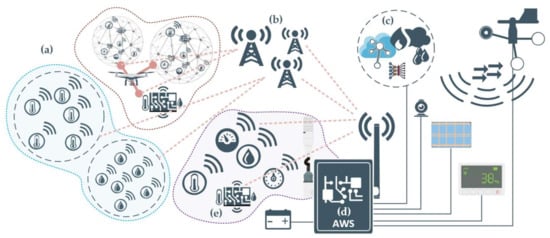
Figure 9.
Low-Cost Automatic Weather Stations in the Internet of Things: (a) Mesh collections of sensors, (b) Wireless networks (Low-Power Wide-Area Network (LPWAN), 4G, 5G, etc.), (c) Advanced computing capabilities and algorithms, (d) Advanced hardware features, and (e) Intelligent sensors and measurement devices.
According to us, the next generation of AWS will have complex capabilities and will be programmable to act either as an End device or Edge server. The advanced computing capabilities and new telecommunication technologies will offer new services to the end users and national agencies. We are certain that advances in hardware will offer processing units with low-cost, low-power, and computing capabilities at the edge. Modern technologies in CPU design offer new processors in single board computers, and at the microcontroller level multicore processors (ESP32, RP2040) and embedded wireless connectivity. These new advancements will enable the market to offer new products that will affect the AWS system design and implementation. The increased edge computing power will enable AI inference engines (such as ARMNN, Tensorflow), which will execute various equations (Fire Risk Index, Flood Risk Index, etc.) and more advanced AI algorithms (or parts/layers of the algorithm) to perform computations in real time at the edge.
On the other hand, based on the WMO report in the near future, the disruptive technologies in telecom and computing may eliminate the need for exclusive AWS systems [4]. In this case, if we adopt the second scenario, the deployment of observing networks in wide areas with hundreds or even thousands of nodes with measurement equipment based on new LPWAN technologies, such as LoRa or Narrow Band-IoT, will provide to the end users the ability to create “virtual AWS” based on their specific needs or research interests. In the implementation of this scenario, all of an End node device’s locations in an area are depicted using a map service. The map also contains information regarding the status of the End device as well as the number and type of sensors connected to the node and the measurement frequency of each sensor [2,3,4].
The researcher/user will select a subset of the available nodes based on his needs, the area of interest, as well as the data requirements, thus creating a virtual AWS. Unlike standard AWS that require the installation of special equipment in an area for their operation, a virtual AWS is simply a collection of nodes that are selected based on the aforementioned characteristics and do not require any type of prior installation [38]. This new type of AWS provides a series of advantages:
- Fast and Low-Cost setup: The user selects the preinstalled nodes based on the research demands.
- Multiuser services: The same nodes can also provide data to other researchers as they can simultaneously be active parts of several virtual AWS.
- Measurement Accuracy and redundancy: The existence of several nodes measuring the same variable (temperature, humidity, etc.) ensures the quality of the measurements. Any sensor malfunction can be easily detected, and the node can be removed from the virtual AWS.
Additionally, the existence of Cloud services allows the implementation of various equations and AI algorithms (Fire Risk Index, Flood Risk Index, etc.), which can be calculated using the enormous Cloud computing power. These calculations are based on numerous nodes, thus allowing the uninterrupted supply of measurements even during catastrophic events that can put a part of the network out of operation [26,27,28,38,39]. The main reason for the resilience to catastrophic events is the ability of the sensors that constitute the network to directly communicate with the Internet, wirelessly exploiting the IoT infrastructure. In contrast with other implementations (classic topologies such as Bus or Star) and the centralization on which they rely (and which is prone to failure if the central node is destroyed), a virtual AWS will be implemented using a full mesh topology. It is not required for the users of the virtual AWS to know which routes the data follow to receive them (IoT can be implemented using a variety of wireless protocols, Wi-Fi, LoRa, Bluetooth, etc.). Therefore, these networks are by their topology designed to be able to continue to work even when some of their infrastructure is completely off line, because the data can be routed to the remaining portion of the network.
A subsequent advantage based on LPWAN characteristics is the ability of the deployed networks to monitor remote and rural areas. This advantage is mainly because the network’s devices require limited resources in terms of energy and data bandwidth, allowing limited post-installation resources. Thus, the strategic placement of antennas/gateways in remote areas can easily provide extensive coverage for intelligent nodes equipped with multiple sensors. The installation location can be easily determined using a combination of Digital Elevation Maps, ESRI ArcMap 3DAnalyst Visibility tools, and Multicriteria Decision Analysis. Furthermore, the incorporation of Edge computing solutions in these remote networks can further reduce data transferred throughout the network [38,39].
In each scenario, it is important to mention that AWS systems will play a key role for meteorological measurements in the era of Internet of Things. Most WMO reports and conference proceedings [45] admit that in each country, the national agencies implement various AWS systems using combinations of all the available technological solutions. In the near future, complex AWS systems will operate worldwide, implementing new technologies and providing advanced surface observing systems. These systems will have a positive impact on the achievement of the common goal to monitor existing climate change.
5. Conclusions
It is well known that the constant need for measurements is nowadays a requirement for many sciences. The application of precision agriculture, forest management, ecophysiology, and other disciplines can provide far better results when real-time measurements are used. Furthermore, climate change has increased the need to calculate risk indexes in order to alert the population as well as local authorities for extreme phenomena.
Automatic Weather Stations, as their name implies, are devices capable of performing measurements without the need of human intervention, providing data regardless of time and without the possibility of human errors during capture. Therefore, they can be used by many researchers for data collection speed, accuracy, and efficiency. Our research has shown that a variety of AWS implementations has been developed throughout the years. The main difference between these implementations is the method used to transmit data. At the beginning, the most common method was the usage of wired means. During the next years, the usage of leased lines (using modems and PSTN/ISDN networks) proved to be an efficient mean of data transmission with the major disadvantage of high cost in cases where there were no prior installations and therefore there could be no exploitation of existing infrastructure.
However, nowadays, the emergence of a variety of wireless communications protocols (Wi-Fi, High-Speed GSM networks in the form of 4G and 5G, LoRa, Bluetooth, and even the upcoming StarLink network) has allowed the development of a series of AWS and End Nodes capable of communicating from remote and secluded areas.
In this work, apart from the current trends and technologies in AWS, we present a case study based on a patented work, the AgroComp units.
These units are far more evolved than a typical AWS. We have incorporated the wireless technologies and other COTS hardware (ARM SoCs, sensors etc.) to create a versatile multipurpose device with raw processing power, which can provide accurate measurements. Unlike typical AWS, which are designed to serve as single purpose machines, these units can be re-programmed and re-equipped in order to follow the user’s needs. The usage of ARM SoC technology allows the transfer of data processing to the field. Furthermore, we have also demonstrated that the measurement accuracy is not affected by the usage of RPi-0. Similarly, the usage of other platforms such as Arduino for the implementation of similar projects will also have no effect on data quality.
So, someone may ask, are these units capable of solving all problems? The answer is no, but they can help solve a lot. According to our research and knowledge, units such as this demonstrate the way things will evolve. The era of dedicated one-task proprietary units has passed. Scientists and end users in general need to gather data in real time with techniques that are fast, accurate, and from many locations. Furthermore, they need to be able to reinstall the same unit and reprogram it in order to fulfill new requirements. In essence, they need to have personal AWS capable of performing everywhere. According to us, this period might be similar to the period the computer industry faced in the early 1980s, when the industry moved from the mainframe model of computing to that of personal and versatile computing with the introduction of the IBM Personal Computer.
In the future, the units can be further enhanced with the design of new expansion boards capable of including both LoRa network capability and sensor interconnection as well as the incorporation of data received from altitude. This can be achieved by using either drones equipped with sensor arrays or using weather balloons. Furthermore, the units can be enhanced using cameras and Infra-Red sensors to monitor cloud formation and detect extreme temperatures, which can be caused by wildfires. The incorporation of the sensors to a dedicated software platform also containing tools for the determination of the whereabouts of civil protection units as well as fire trucks can help in the creation of an overall solution for the protection of citizens from extreme weather phenomena. Finally, the implementation of Edge and Cloud computing technologies will allow everybody to access and consume all the available data.
6. Patents
A part of the reported work resulted to a patent entitled: “Computational and Measuring Unit for Forest, Agricultural and Geotechnical Applications”, Hellenic Industrial Property Organization Patent Number: 20180100109.
Author Contributions
Conceptualization, K.I. and D.K.; methodology, K.I. and D.K.; software, K.I., P.A. and. V.A.; validation, K.I. and D.K.; data curation, K.I., D.K., P.A. and I.K.; writing—original draft preparation, I.K.; writing—review and editing, D.K., P.A. and K.I.; visualization, D.K. and K.I. All authors have read and agreed to the published version of the manuscript.
Funding
This research was partially funded by Stavros Niarchos Foundation and Technological Educational Institute of Eastern Macedonia and Thrace, Project “Fellowships”, grant number 2708/12-11/2015”.
Institutional Review Board Statement
Not applicable.
Informed Consent Statement
Not applicable.
Data Availability Statement
Data sharing not applicable
Conflicts of Interest
The authors declare no conflict of interest.
References
- Ahrens, C.D. Meterorology Today, 9th ed.; Brooks, Cole, Cengage Learning: Belmont, CA, USA, 2009; ISBN 0-495-55573-8. [Google Scholar]
- Flokas, A. Lessons in Meteorology and Climatology; Ziti Publications: Thessaloniki, Greece, 1992. [Google Scholar]
- Bagiorgas, H.S.; Assimakopoulos, M.N.; Patentalaki, A.; Konofaos, N.; Matthopoulos, D.P.; Mihalakakou, G. The Design, Installation and Operation of a Fully Computerized, Automatic Weather Station for High Quality Meteorological Measurements. Fresenius Environ. Bull. 2007, 16, 948–962. [Google Scholar]
- Guide to Instruments and Methods of Observation; Volume III—Observing Systems; World Meteorological Organization: Geneva, Switzerland, 2018; Available online: https://community.wmo.int/activity-areas/imop/wmo-no_8 (accessed on 29 March 2021).
- Roberts, L.G.; Wessler, B.D. Computer Network Development to Achieve Resource Sharing. In Proceedings of the May 5–7, 1970, Spring Joint Computer Conference; Association for Computing Machinery: New York, NY, USA, 1970; pp. 543–549. [Google Scholar]
- Nitu, R.; Wong, K. Measurement of Solid Precipitation at Automatic Weather Stations, Challenges and Opportunities. Meteorol. Serv. Can. 2010, 4905, 1–10. [Google Scholar]
- Groth, D.; Skandier, T. Network+ Study Guide, 4th ed.; Sybex: Sedona, AZ, USA, 2005; ISBN 978-0-7821-4406-2. [Google Scholar]
- Genere, B. Tropicalisation of Automatic Weather Stations and Initial Results for Improved Irrigation Water Management in Reunion Island. Agric. Water Manag. 1990, 17, 141–149. [Google Scholar] [CrossRef]
- Strangeways, I.C. A Cold Regions Automatic Weather Station. J. Hydrol. 1985, 79, 323–332. [Google Scholar] [CrossRef]
- Nsabagwa, M.; Byamukama, M.; Kondela, E.; Otim, J.S. Towards a Robust and Affordable Automatic Weather Station. Dev. Eng. 2019, 4, 100040. [Google Scholar] [CrossRef]
- Abbate, S.; Avvenuti, M.; Carturan, L.; Cesarini, D. Deploying a Communicating Automatic Weather Station on an Alpine Glacier. In Proceedings of the Procedia Computer Science, Barcelona, Spain, 5–7 June 2013. [Google Scholar]
- Mestre, G.; Ruano, A.; Duarte, H.; Silva, S.; Khosravani, H.; Pesteh, S.; Ferreira, P.M.; Horta, R. An Intelligent Weather Station. Sensors 2015, 15, 31005–31022. [Google Scholar] [CrossRef]
- Strigaro, D.; Cannata, M.; Antonovic, M. Boosting a Weather Monitoring System in Low Income Economies Using Open and Non-Conventional Systems: Data Quality Analysis. Sensors 2019, 19, 1185. [Google Scholar] [CrossRef] [PubMed]
- Villagrán, V.; Montecinos, A.; Franco, C.; Muñoz, R.C. Environmental Monitoring Network along a Mountain Valley Using Embedded Controllers. Meas. J. Int. Meas. Confed. 2017. [Google Scholar] [CrossRef]
- Alliance, L. LoRaWANTM 1.1 Specification; LoRa Alliance: Fremont, CA, USA, 2017. [Google Scholar]
- Lee, C.-J.; Ki-Seon, R.; Beum-Joon, K. Periodic Ranging in a Wireless Access System for Mobile Station in Sleep Mode. U.S. Patent 8,514,757, 20 August 2013. [Google Scholar]
- Kochhar, A.; Kumar, N. Wireless Sensor Networks for Greenhouses: An End-to-End Review. Comput. Electron. Agric. 2019, 163, 104877. [Google Scholar] [CrossRef]
- Sinha, R.S.; Wei, Y.; Hwang, S.-H. A Survey on LPWA Technology: LoRa and NB-IoT. ICT Express 2017, 3, 14–21. [Google Scholar] [CrossRef]
- Adityawarman, Y.; Matondang, J. Development of Micro Weather Station Based on Long Range Radio Using Automatic Packet Reporting System Protocol. In Proceedings of the 2018 International Conference on Information Technology Systems and Innovation (ICITSI), Bandung, Indonesia, 22–26 October 2018; pp. 221–224. [Google Scholar]
- Pietrosemoli, E.; Rainone, M.; Zennaro, M. On Extending the Wireless Communications Range of Weather Stations Using LoRaWAN. In Proceedings of the 5th EAI International Conference on Smart Objects and Technologies for Social Good, Valencia, Spain, 25–27 September 2019; Association for Computing Machinery: New York, NY, USA, 2019; pp. 78–83. [Google Scholar]
- Rahman, N.H.A.; Yamada, Y.; Husni, M.H.; Aziz, N.H.A. Analysis of Propagation Link for Remote Weather Monitoring System through LoRa Gateway. In Proceedings of the 2018 2nd International Conference on Telematics and Future Generation Networks (TAFGEN), Kuching, Malaysia, 24–26 July 2018; pp. 55–60. [Google Scholar]
- Lee, H.; Ke, K. Monitoring of Large-Area IoT Sensors Using a LoRa Wireless Mesh Network System: Design and Evaluation. IEEE Trans. Instrum. Meas. 2018, 67, 2177–2187. [Google Scholar] [CrossRef]
- Hossinuzzaman, M.D.; Dahnil, D.P. Enhancement of Packet Delivery Ratio during Rain Attenuation for Long Range Technology. Int. J. Adv. Comput. Sci. Appl. 2019, 10. [Google Scholar] [CrossRef]
- Bezerra, N.S.; Ahlund, C.; Saguna, S.; de Sousa, V.A. Temperature Impact in LoraWAN—A Case Study in Northern Sweden. Sensors 2019, 19, 4414. [Google Scholar] [CrossRef]
- Cardell-Oliver, R.; Hübner, C.; Leopold, M.; Beringer, J. Dataset: LoRa Underground Farm Sensor Network. In Proceedings of the DATA 2019, 2nd ACM Workshop on Data Acquisition To Analysis, Part of SenSys 2019, New York, NY, USA, 10 November 2019. [Google Scholar]
- Xue-fen, W.; Yi, Y.; Jian, C. Wireless Sensor Node with Lightning and Atmospheric Pressure Detection for Severe Convective Weather Warning Networks. In Proceedings of the 2018 International Symposium in Sensing and Instrumentation in IoT Era (ISSI), Shanghai, China, 6–7 September 2018; pp. 1–6. [Google Scholar]
- Malhi, G.S.; Kaur, M.; Kaushik, P. Impact of Climate Change on Agriculture and Its Mitigation Strategies: A Review. Sustainability 2021, 13, 1318. [Google Scholar] [CrossRef]
- European Environment Agency. Progress of the European Union towards Its Renewable Energy Targets. 2017. Available online: https://www.eea.europa.eu/themes/climate/trends-and-projections-in-europe/trends-and-projections-in-europe-2016/4-progress-of-the-european (accessed on 29 March 2021).
- Shi, W.; Cao, J.; Zhang, Q.; Li, Y.; Xu, L. Edge Computing: Vision and Challenges. IEEE Internet Things J. 2016, 3, 637–646. [Google Scholar] [CrossRef]
- Tsai, C.W.; Lai, C.F.; Vasilakos, A.V. Future Internet of Things: Open Issues and Challenges. Wirel. Netw. 2014, 20, 2201–2217. [Google Scholar] [CrossRef]
- Chen, J.; Ran, X. Deep Learning With Edge Computing: A Review. Proc. IEEE 2019, 107, 1655–1674. [Google Scholar] [CrossRef]
- Seferagić, A.; Famaey, J.; De Poorter, E.; Hoebeke, J. Survey on Wireless Technology Trade-Offs for the Industrial Internet of Things. Sensors 2020, 20, 488. [Google Scholar] [CrossRef]
- Lagkas, T.; Argyriou, V.; Bibi, S.; Sarigiannidis, P. UAV IoT Framework Views and Challenges: Towards Protecting Drones as “Things”. Sensors 2018, 18, 4015. [Google Scholar] [CrossRef]
- Li, H.; Ota, K.; Dong, M. Learning IoT in Edge: Deep Learning for the Internet of Things with Edge Computing. IEEE Netw. 2018, 32, 96–101. [Google Scholar] [CrossRef]
- Galanopoulos, A.; Iosifidis, G.; Salonidis, T. Cooperative Analytics for the Internet of Things. In Proceedings of the Twentieth ACM International Symposium on Mobile Ad Hoc Networking and Computing, Catania, Italy, 2–5 July 2019; Association for Computing Machinery: New York, NY, USA, 2019; pp. 395–396. [Google Scholar]
- Chavan, G.; Momin, B. An Integrated Approach for Weather Forecasting over Internet of Things: A Brief Review. In Proceedings of the 2017 International Conference on I-SMAC (IoT in Social, Mobile, Analytics and Cloud) (I-SMAC), Palladam, India, 10–11 February 2017. [Google Scholar]
- Yazici, M.T.; Basurra, S.; Gaber, M.M. Edge Machine Learning: Enabling Smart Internet of Things Applications. Big Data Cogn. Comput. 2018, 2, 26. [Google Scholar] [CrossRef]
- Guillén-Navarro, M.Á.; Pereñíguez-García, F.; Martínez-España, R. IoT-Based System to Forecast Crop Frost. In Proceedings of the 2017 International Conference on Intelligent Environments (IE), Seoul, Korea, 21–25 August 2017; pp. 28–35. [Google Scholar]
- Nguyen Gia, T.; Qingqing, L.; Pena Queralta, J.; Zou, Z.; Tenhunen, H.; Westerlund, T. Edge AI in Smart Farming IoT: CNNs at the Edge and Fog Computing with LoRa. In Proceedings of the IEEE AFRICON Conference, Accra, Ghana, 25–27 September 2019. [Google Scholar]
- Ioannou, K.; Emmanouloudis, D.; Xenitidis, K. Low Cost Computer Platforms for Environmental Monitoring the Case of the AgroComp Project. In Proceedings of the 8th International Conference on Information and Communication Technologies in Agriculture, Food and Environment, Crete, Greece, 21–24 September 2017; CEUR: Chania, Greece, 2017. [Google Scholar]
- Ioannou, K.; Emmanouloudis, D.; Xenitidis, K. A Comparative Analysis among Three Commercial Temperature Sensors. In Proceedings of the 8th International Conference on Information and Communication Technologies in Agriculture, Food and Environment, Crete, Greece, 21–24 September 2017; CEUR: Chania, Greece, 2017. [Google Scholar]
- Muthukumar, J. Kaggle—Weather Dataset. Available online: https://www.kaggle.com/muthuj7/weather-dataset (accessed on 21 January 2021).
- Huang, Z.Q.; Chen, Y.C.; Wen, C.Y. Real-Time Weather Monitoring and Prediction Using City Buses and Machine Learning. Sensors 2020, 20, 5173. [Google Scholar] [CrossRef] [PubMed]
- Staudemeyer, R.C.; Morris, E.R. Understanding LSTM—A Tutorial into Long Short-Term Memory Recurrent Neural Networks. arXiv 2019, arXiv:1909.09586. [Google Scholar]
- WMO International Conference on Automatic Weather Stations. Automatic Weather Stations for Environmental Intelligence—The AWS in the 21st Century, ICAWS 2017 Proceedings; WMO Report No.127; WMO: Geneva, Switzerland, 2017. [Google Scholar]
Publisher’s Note: MDPI stays neutral with regard to jurisdictional claims in published maps and institutional affiliations. |
© 2021 by the authors. Licensee MDPI, Basel, Switzerland. This article is an open access article distributed under the terms and conditions of the Creative Commons Attribution (CC BY) license (https://creativecommons.org/licenses/by/4.0/).