
Effects of Clay Mineral Composition on the Dynamic Properties and Fabric of Artificial Marine Clay


Abstract
:1. Introduction
- Previous research on the effects of mineral composition on the dynamic properties of cohesive soils aimed to identify the influence of mineral composition in sand–clay cohesive soils on their dynamic properties. However, little data exist to quantify the effect of clay minerals in marine clay on the latter’s dynamic properties under large strain. According to Boulanger and Idriss [37,38], large strain and excess pore water pressure rapidly developed in sand–clay mixture with clay minerals, which was contrary to the gradual development of marine clay. This different development between sand–clay cohesive soil and marine clay was due to the failure of sand–clay mixture from excess pore water pressure, while the failure of marine clay arose from the development of strain and eventual fabric collapse. Therefore, we should re-study the dynamic properties of marine clay under large strain by focusing on mineral composition, especially clay minerals, and the fabric formed by clay minerals.
- Natural marine clay is generally composed of a variety of non-clay minerals (such as quartz and albite) and clay minerals (such as montmorillonite and kaolinite). Unlike other cohesive soils, the non-clay mineral particle size of marine clay is generally small and similar to that of clay mineral particles [39]. However, few studies [40,41] to date have investigated the dynamic properties of non-clay minerals with similar particle size to clay particles in marine clay. In addition, the difference in particle size between coarse quartz particles and fine clay particles in marine clay was found significantly to affect the mechanical properties of marine clay, (e.g., cyclic strength [42] and peak strength [43]). The mineral composition of natural marine clay is furthermore complex, and its content in various minerals cannot be controlled artificially. It is therefore difficult to investigate the influence of mineral content on dynamic properties. Studying the effects of mineral content on dynamic properties would require overcoming difficulties in achieving sample uniformity within laboratory dynamic testing. These challenging problems result from differences in the deposition rate from different minerals [44] and from the effect of consolidation time under high cementation conditions [45]. These research shortcomings and complexities of marine clays indicate that the mineral composition and particle size of natural marine clay in the relevant local area should imperatively be considered when studying the influence of mineral composition on the large strain dynamic properties of marine clay.
2. Materials and Methods
2.1. Mineral Composition of Natural and Artificial Marine Clay
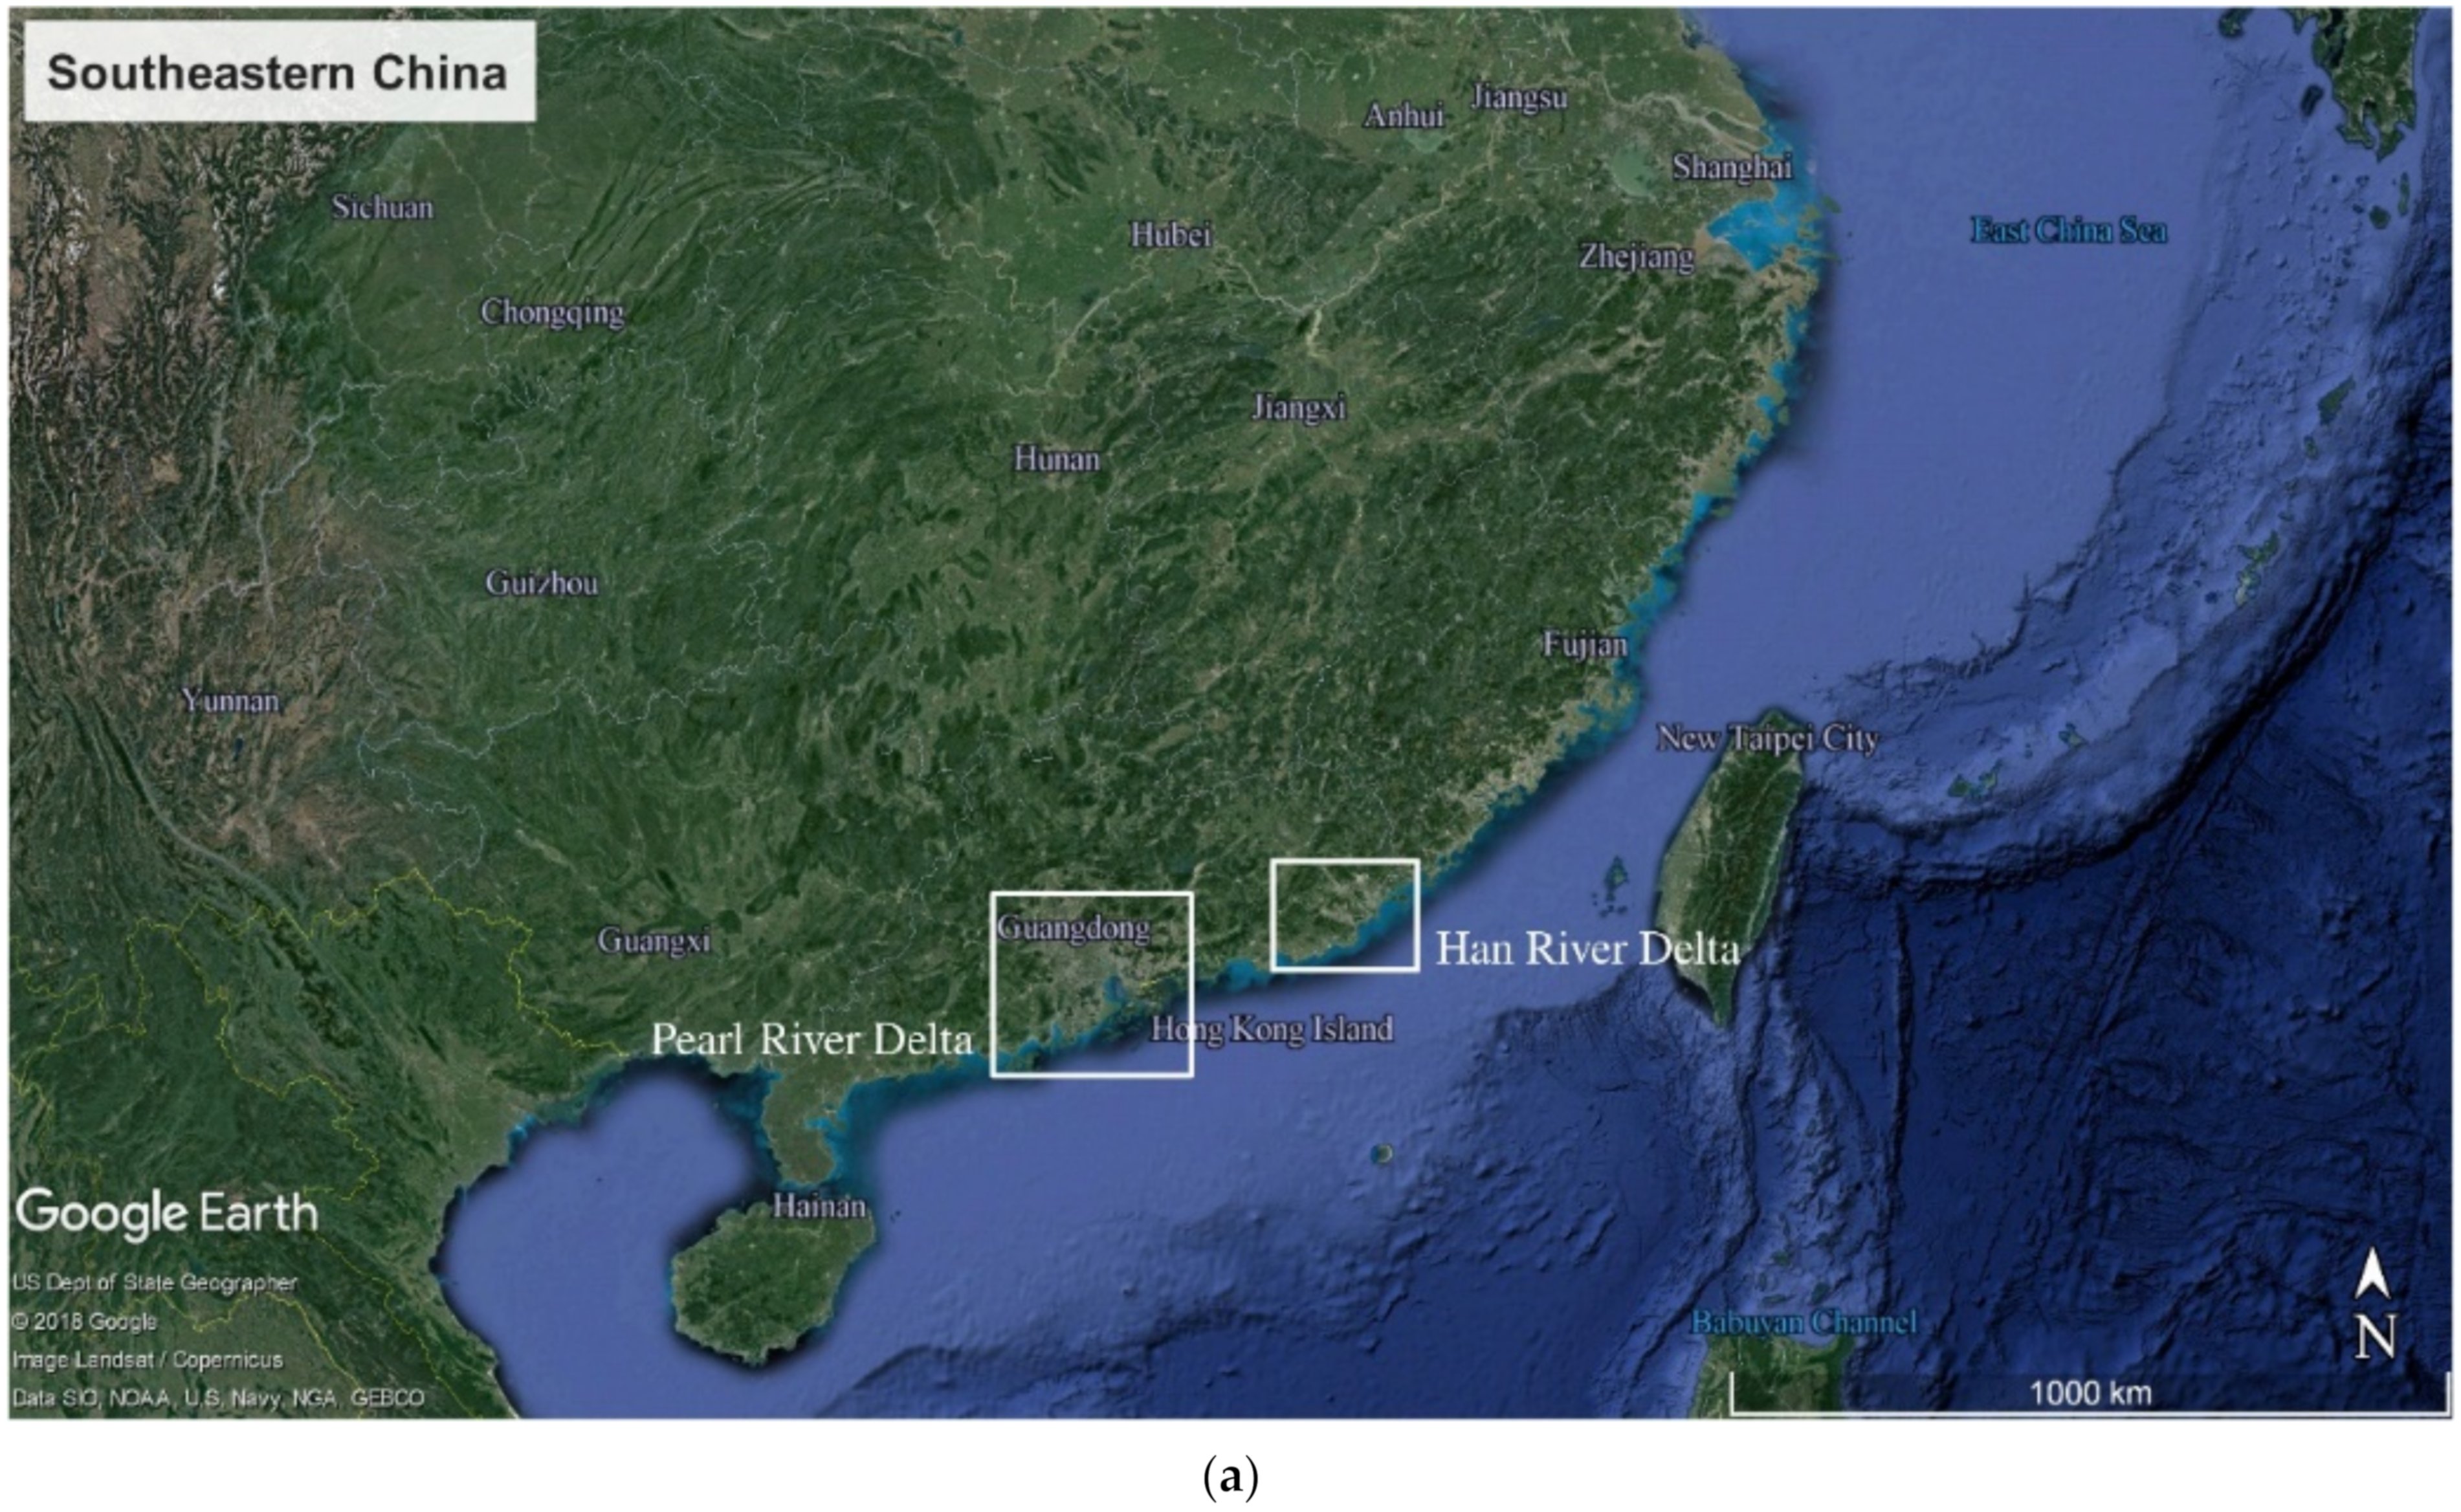
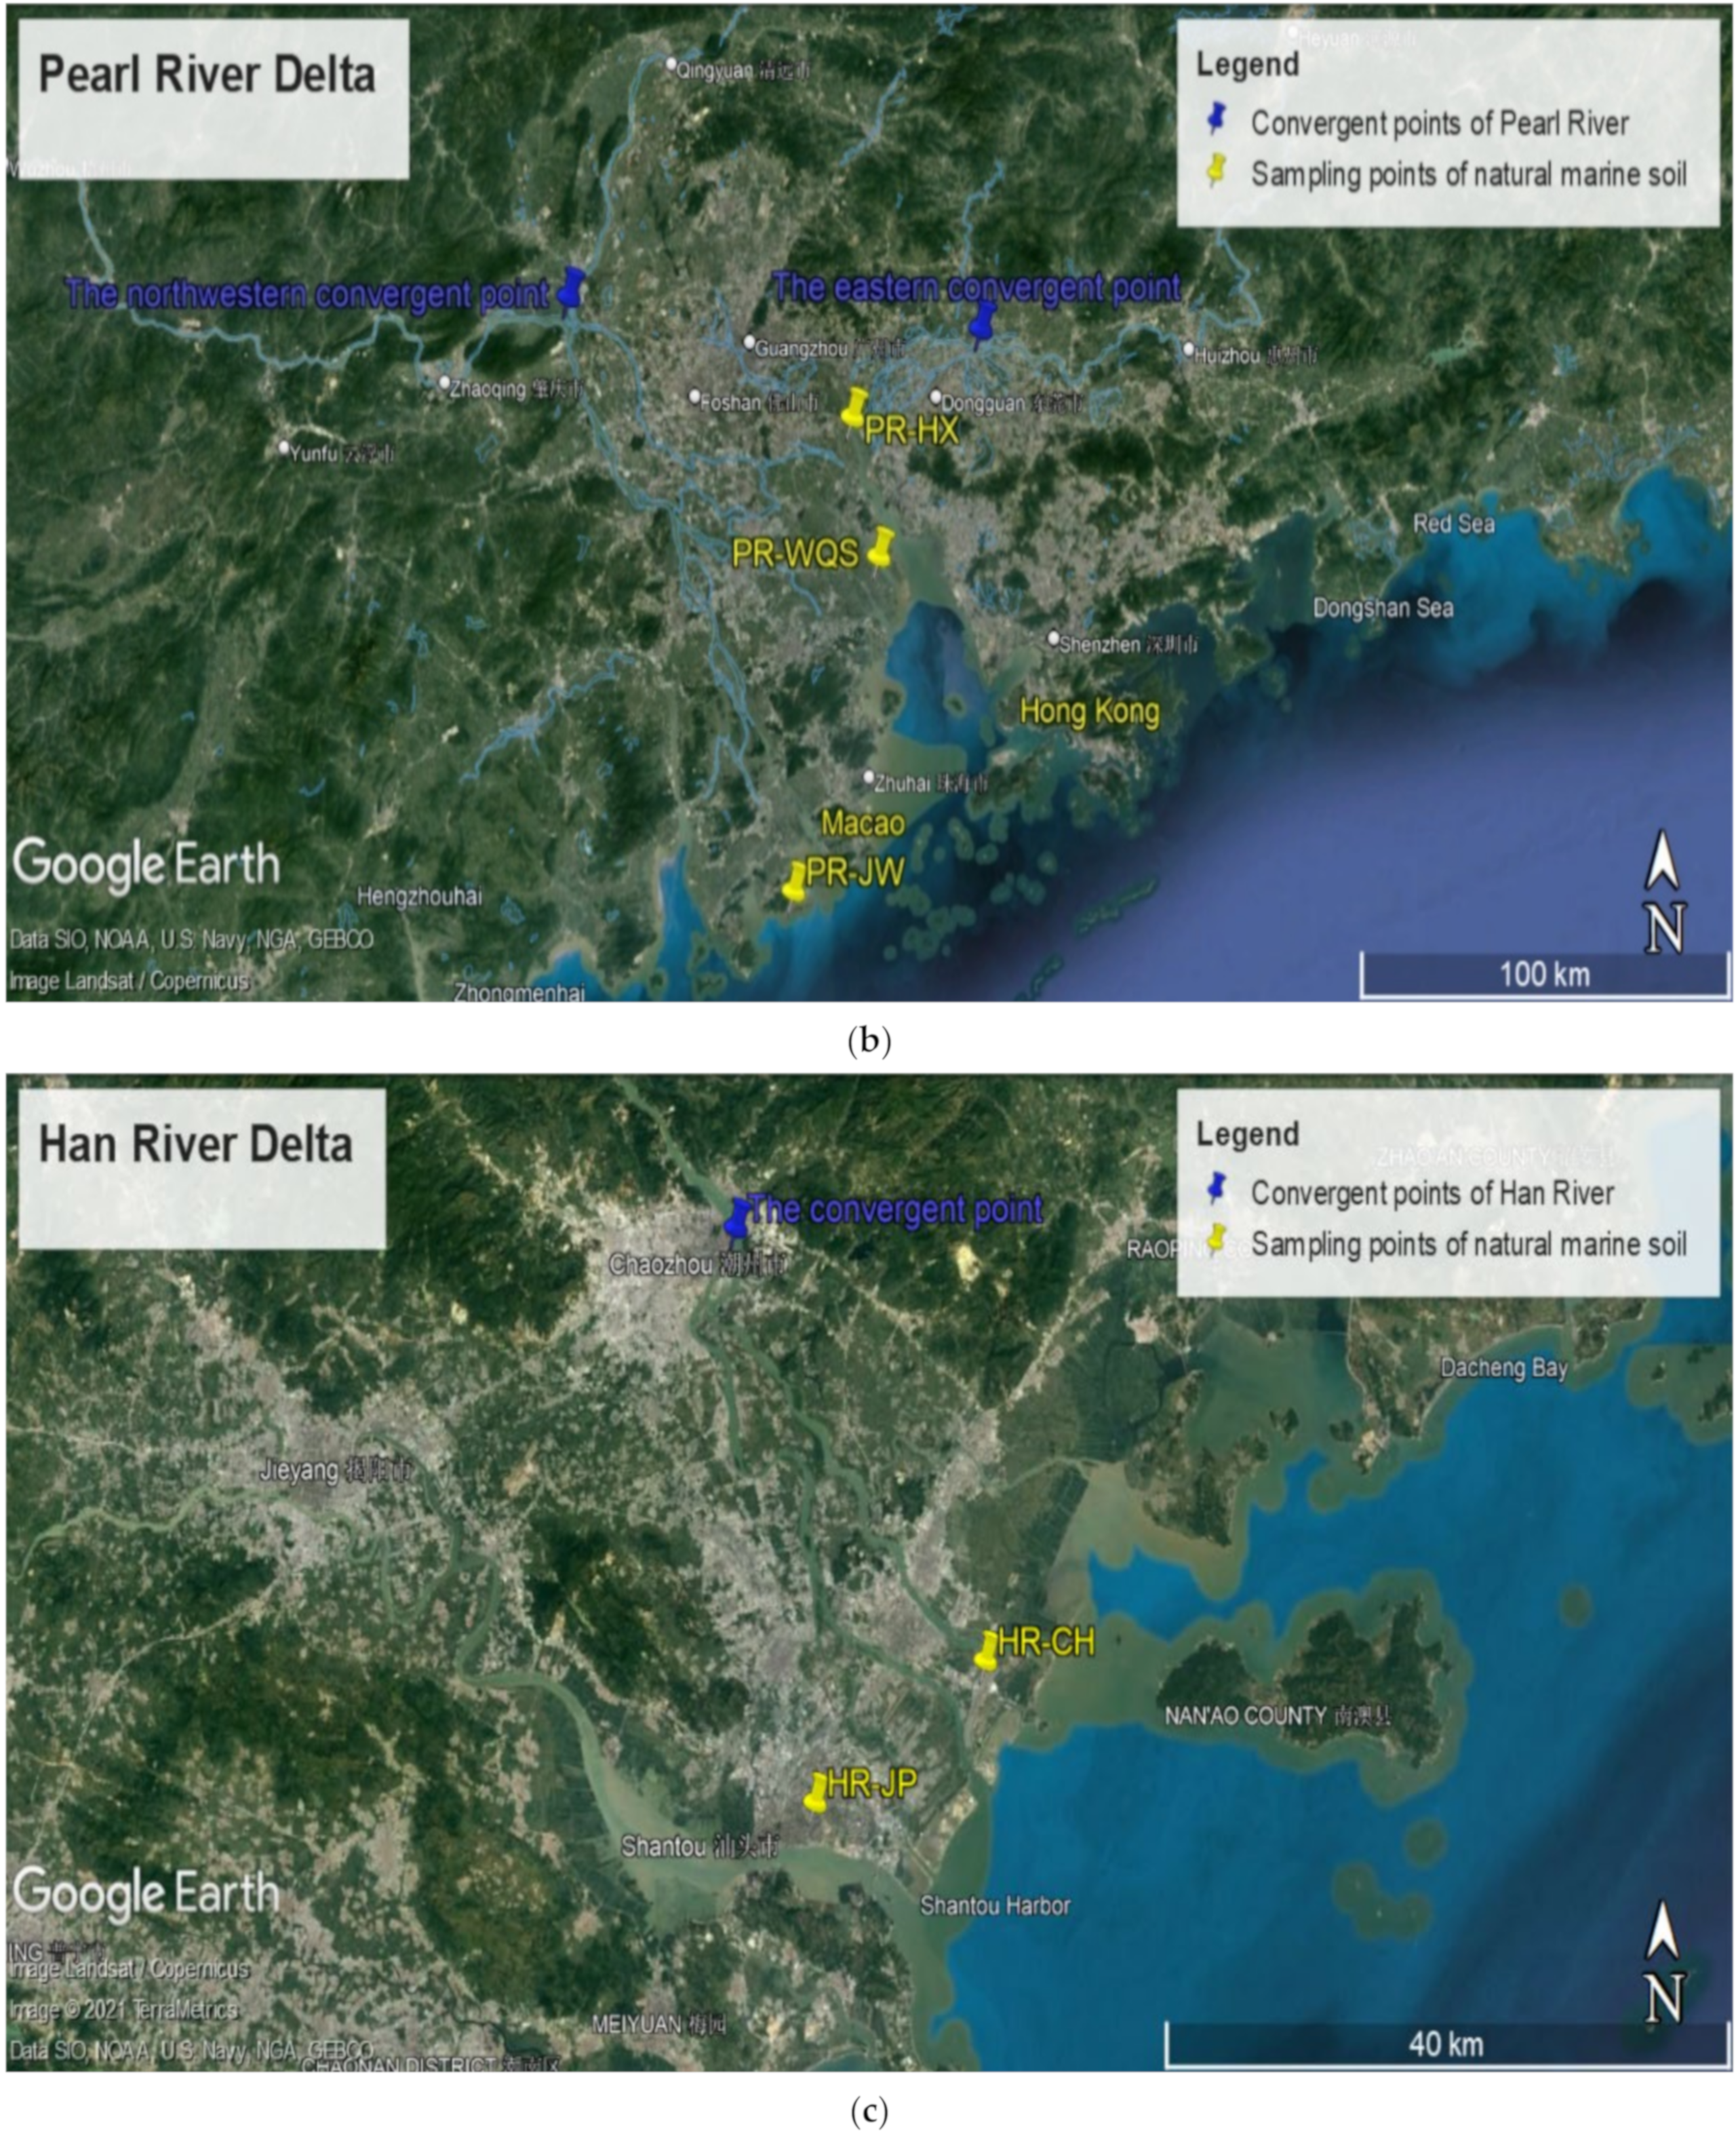
2.1.1. Geological Conditions and Mineral Composition of Natural Marine Clay
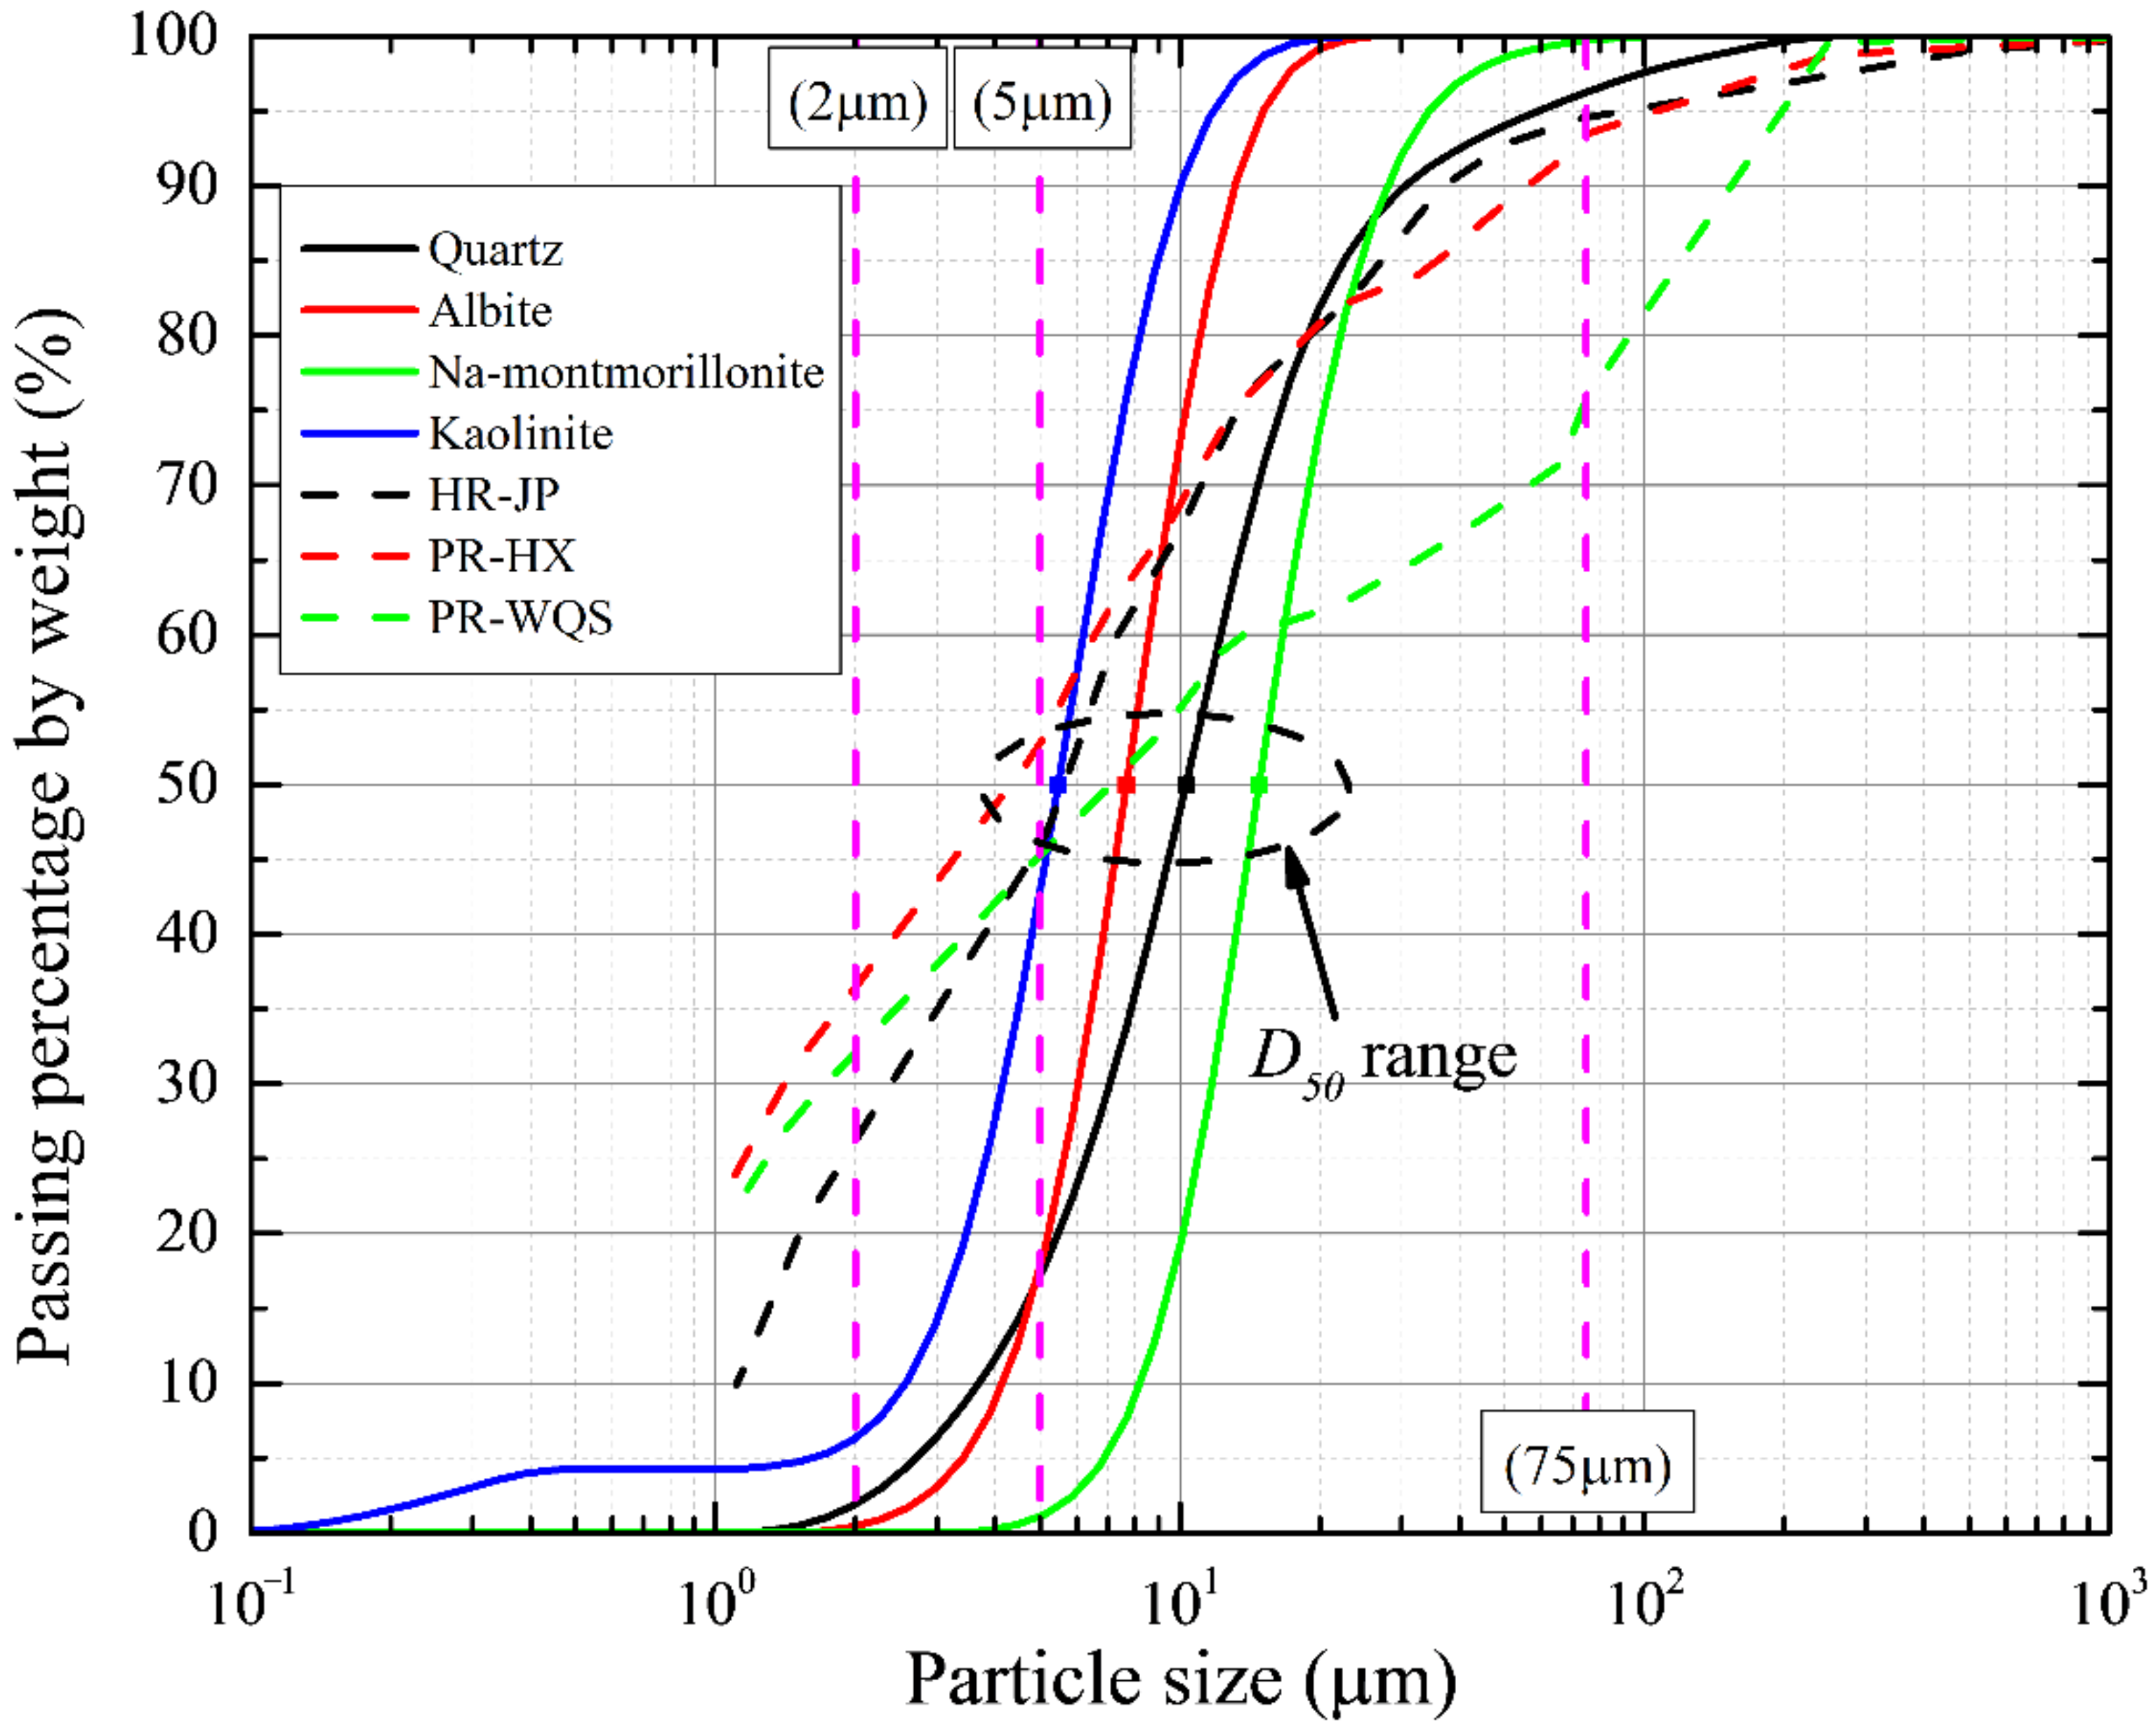
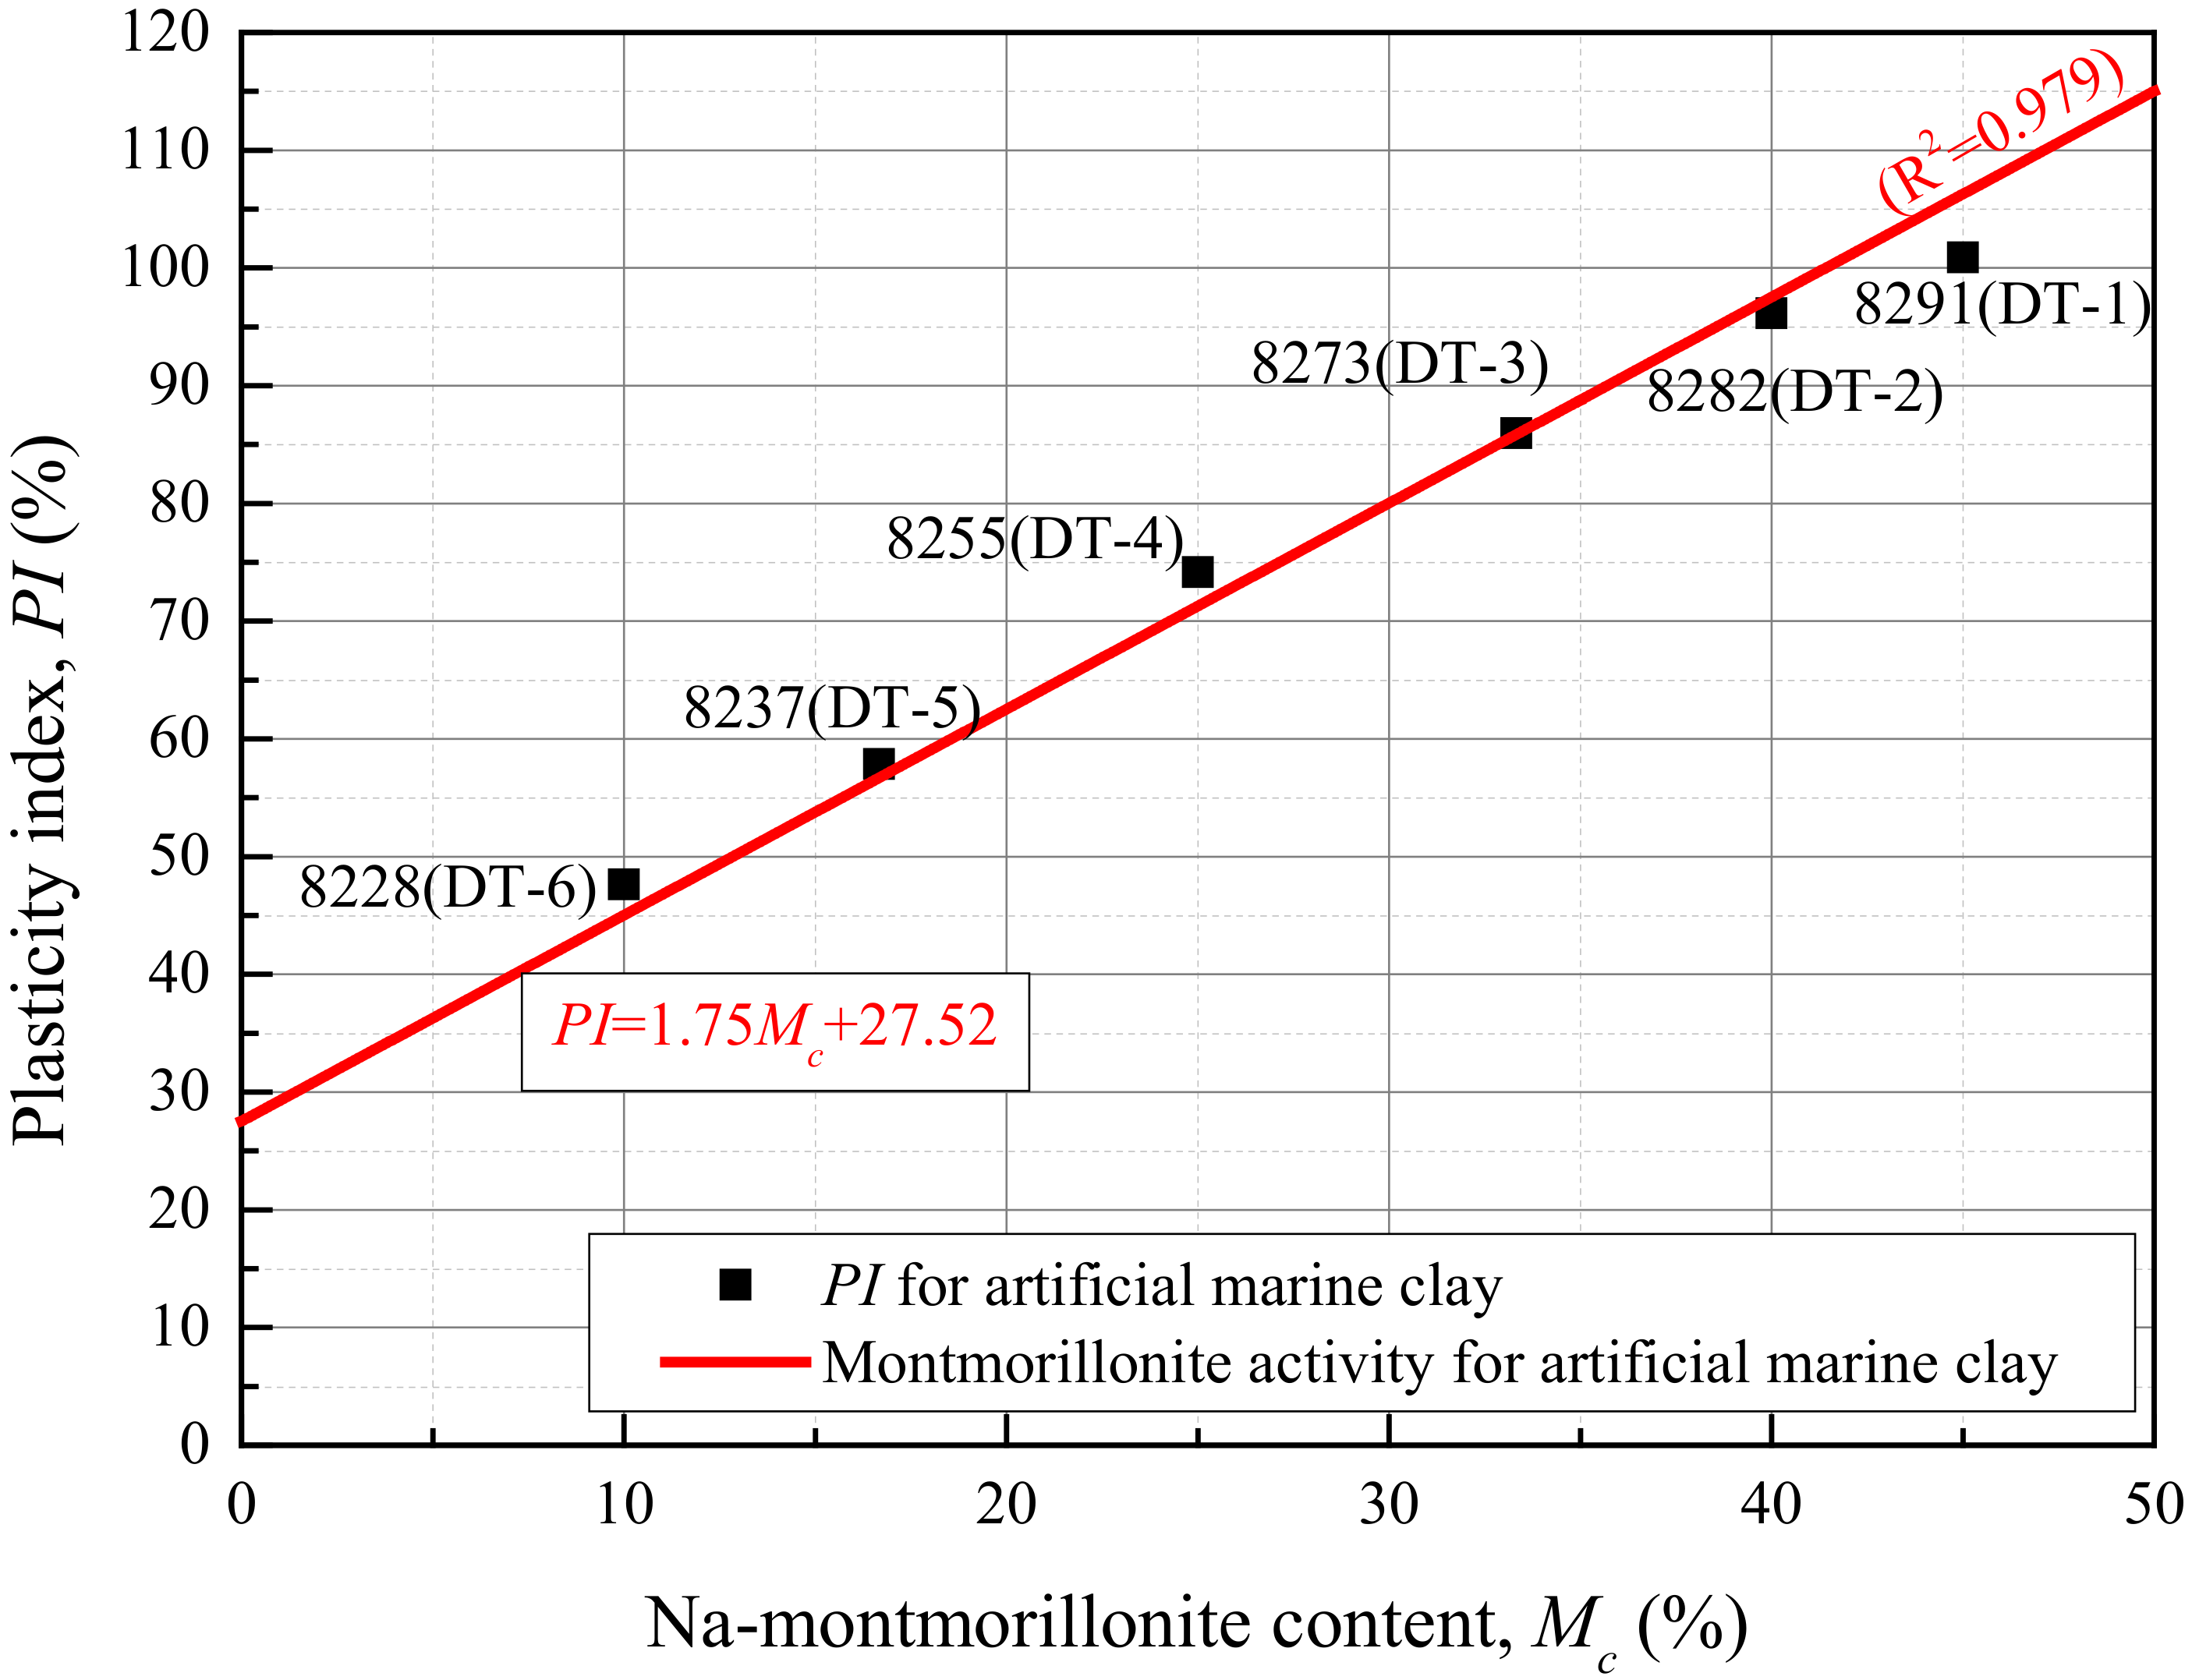
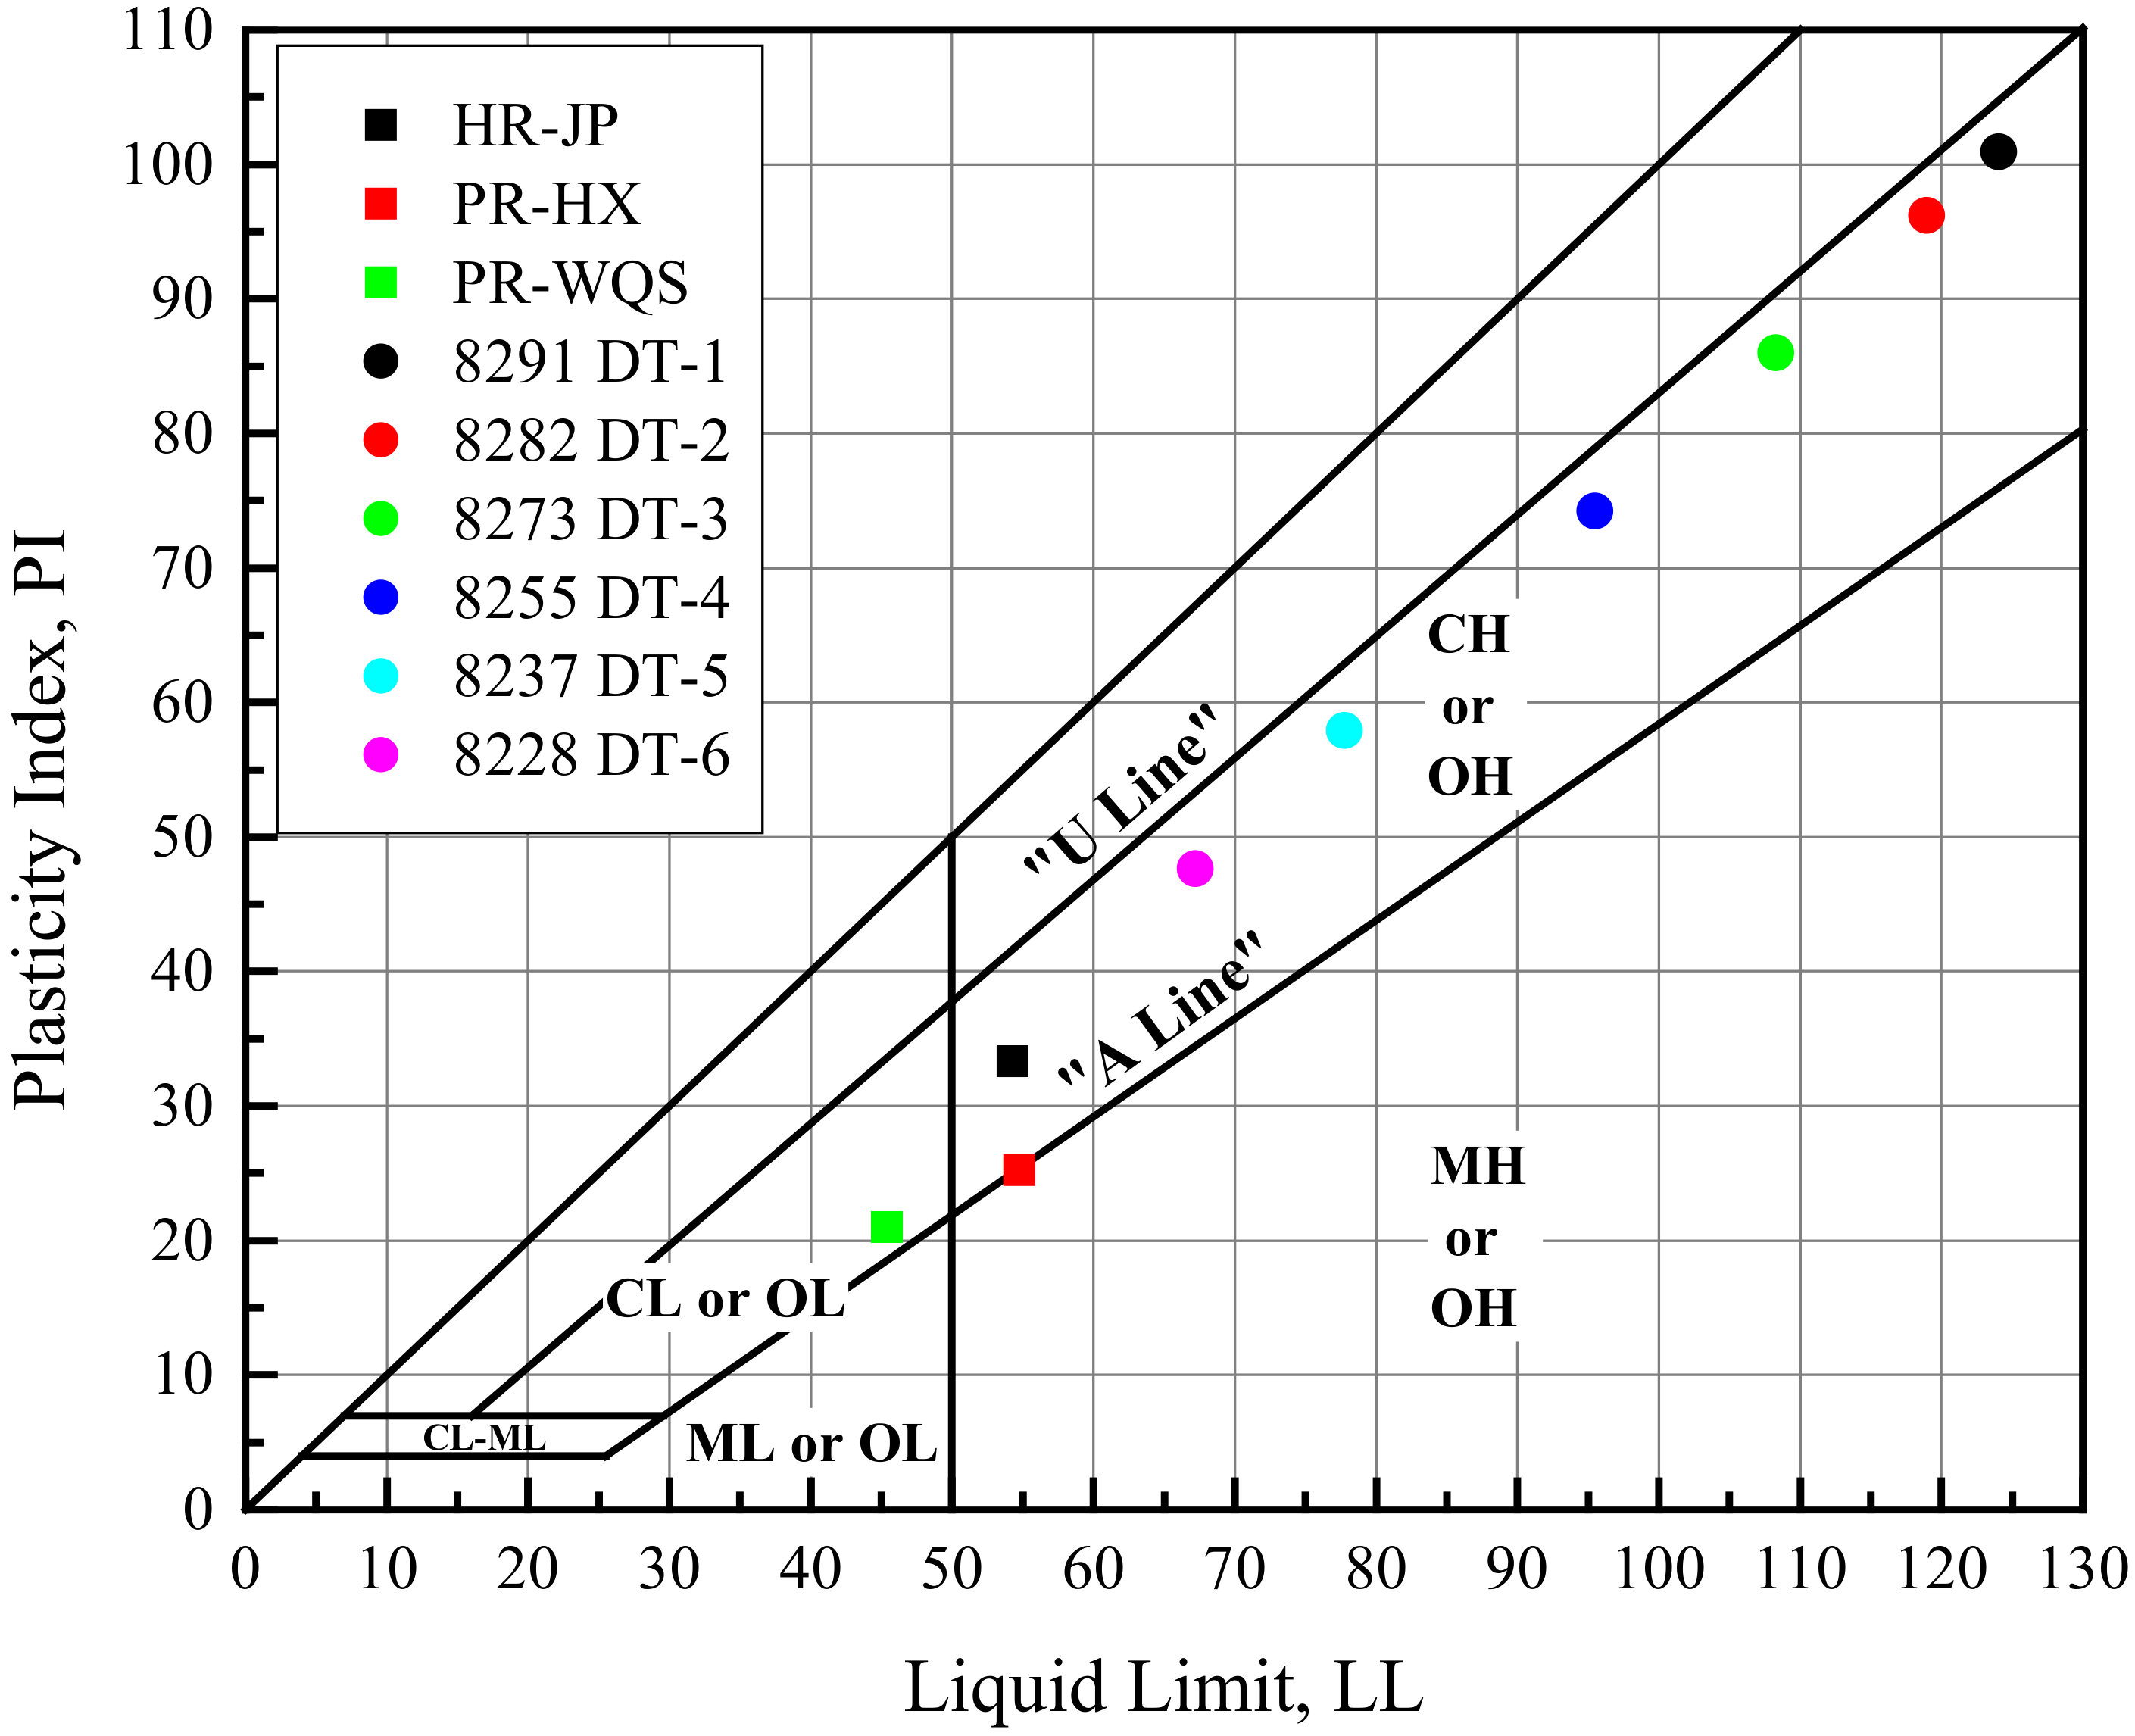
2.1.2. Mineral Composition of Artificial Marine Clay
2.2. Laboratory Dynamic Triaxial Test
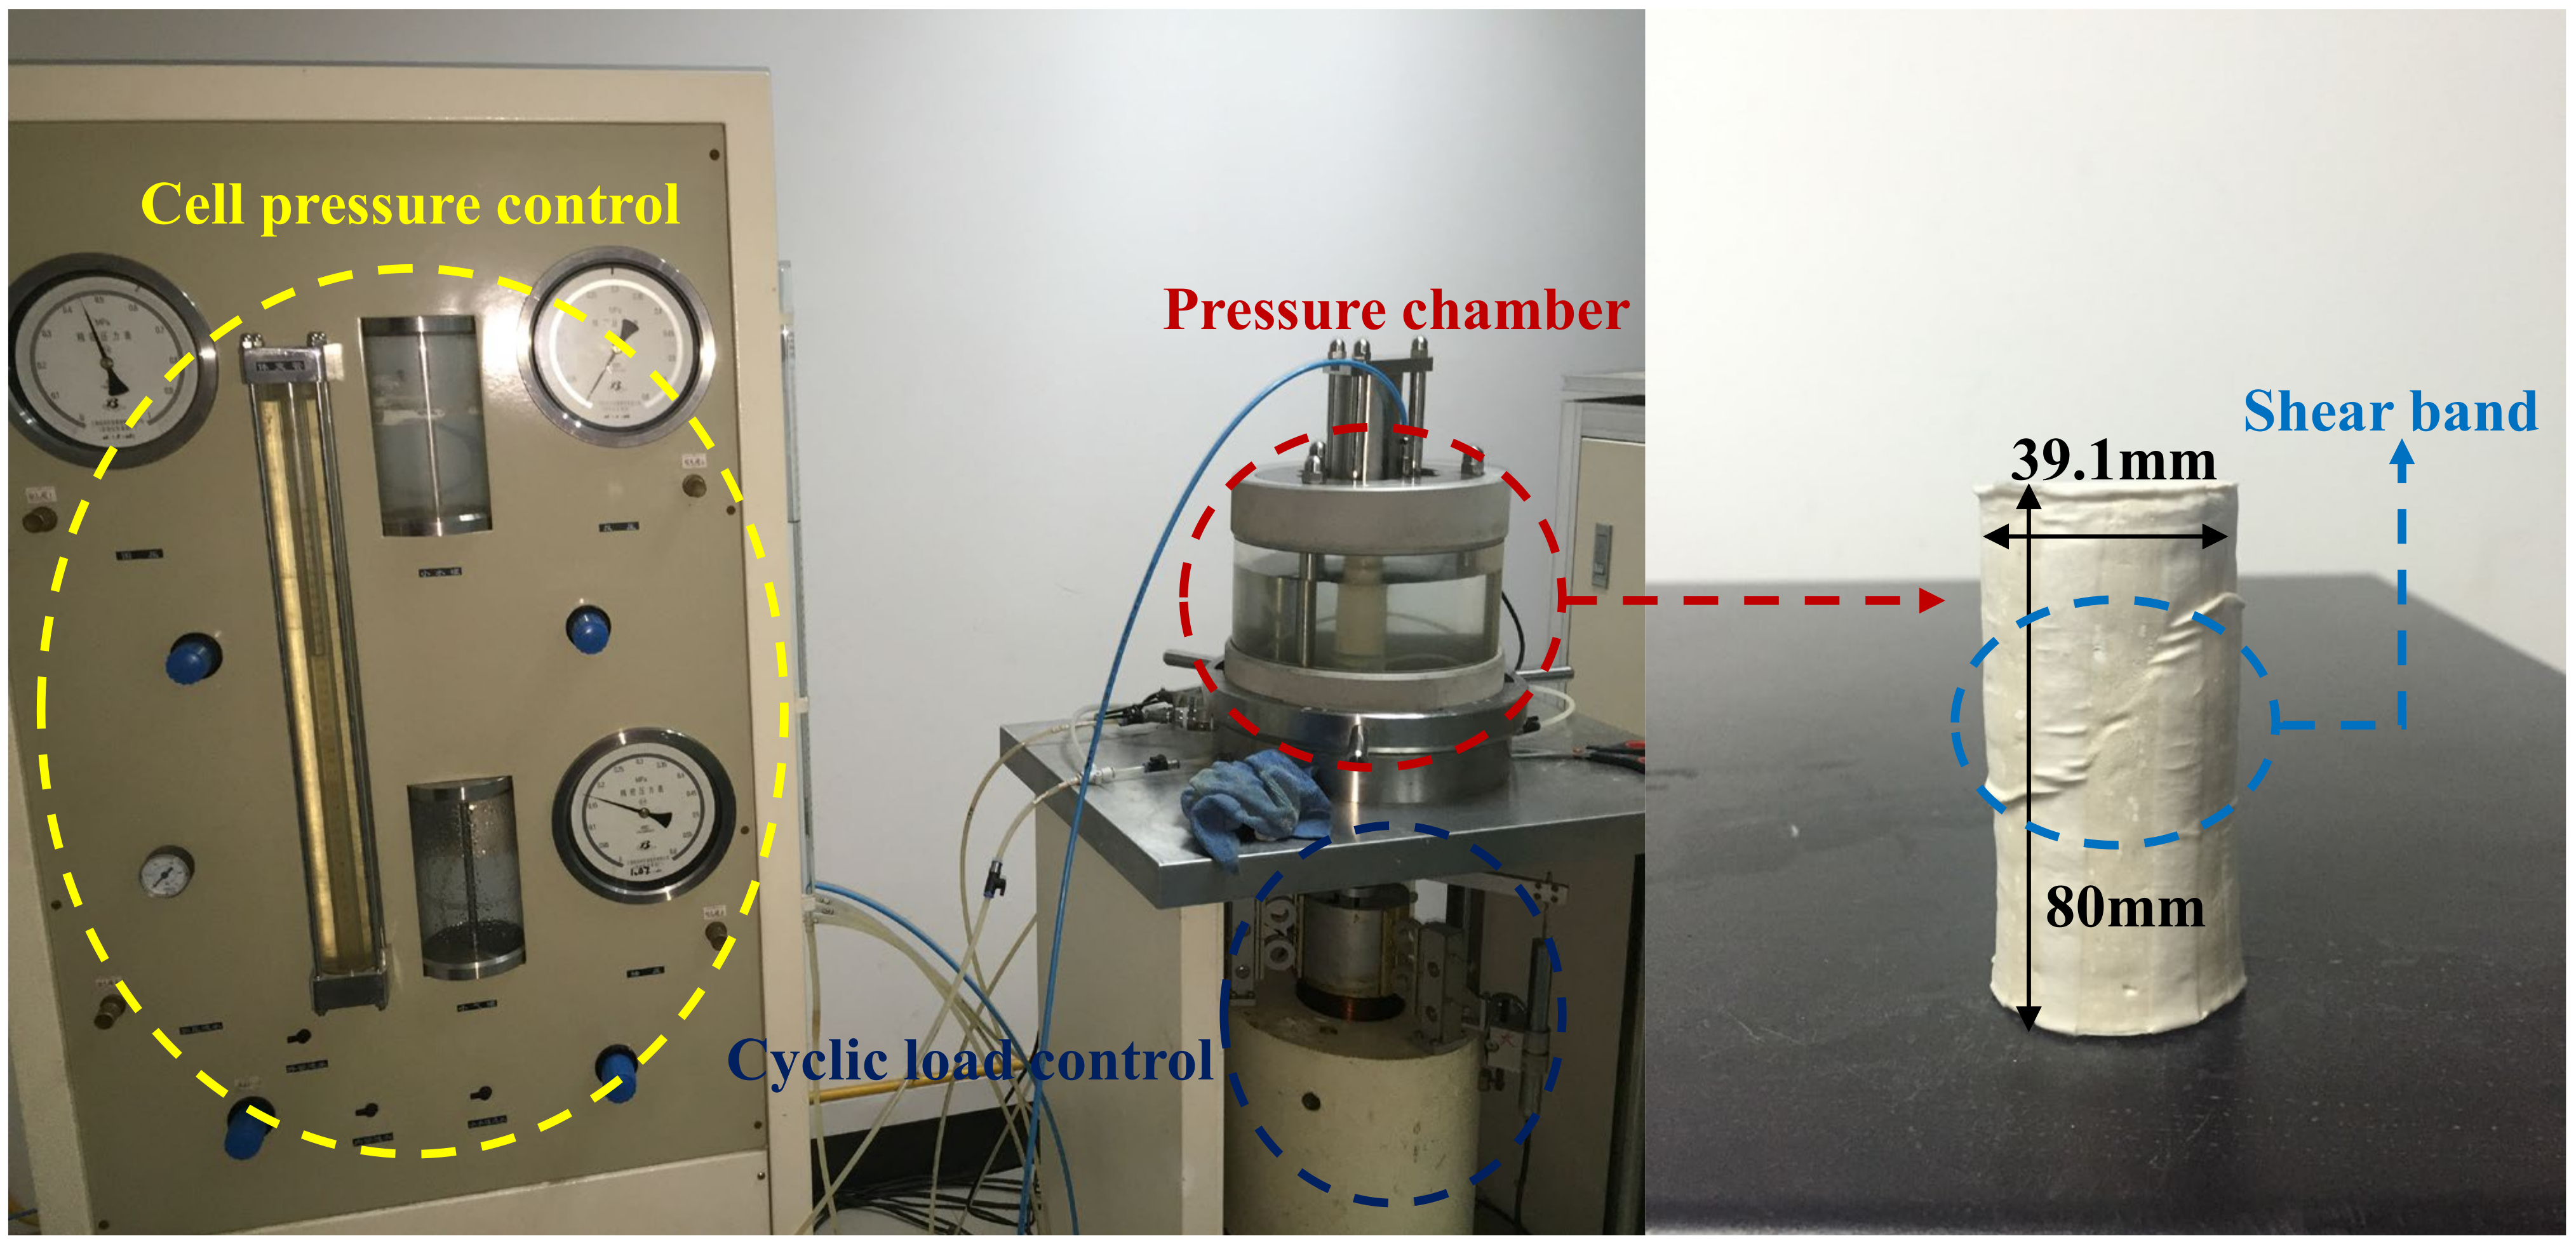
2.2.1. Specimen Preparation
2.2.2. Experimental Procedure
3. Results
3.1. Cyclic Triaxial Test Results
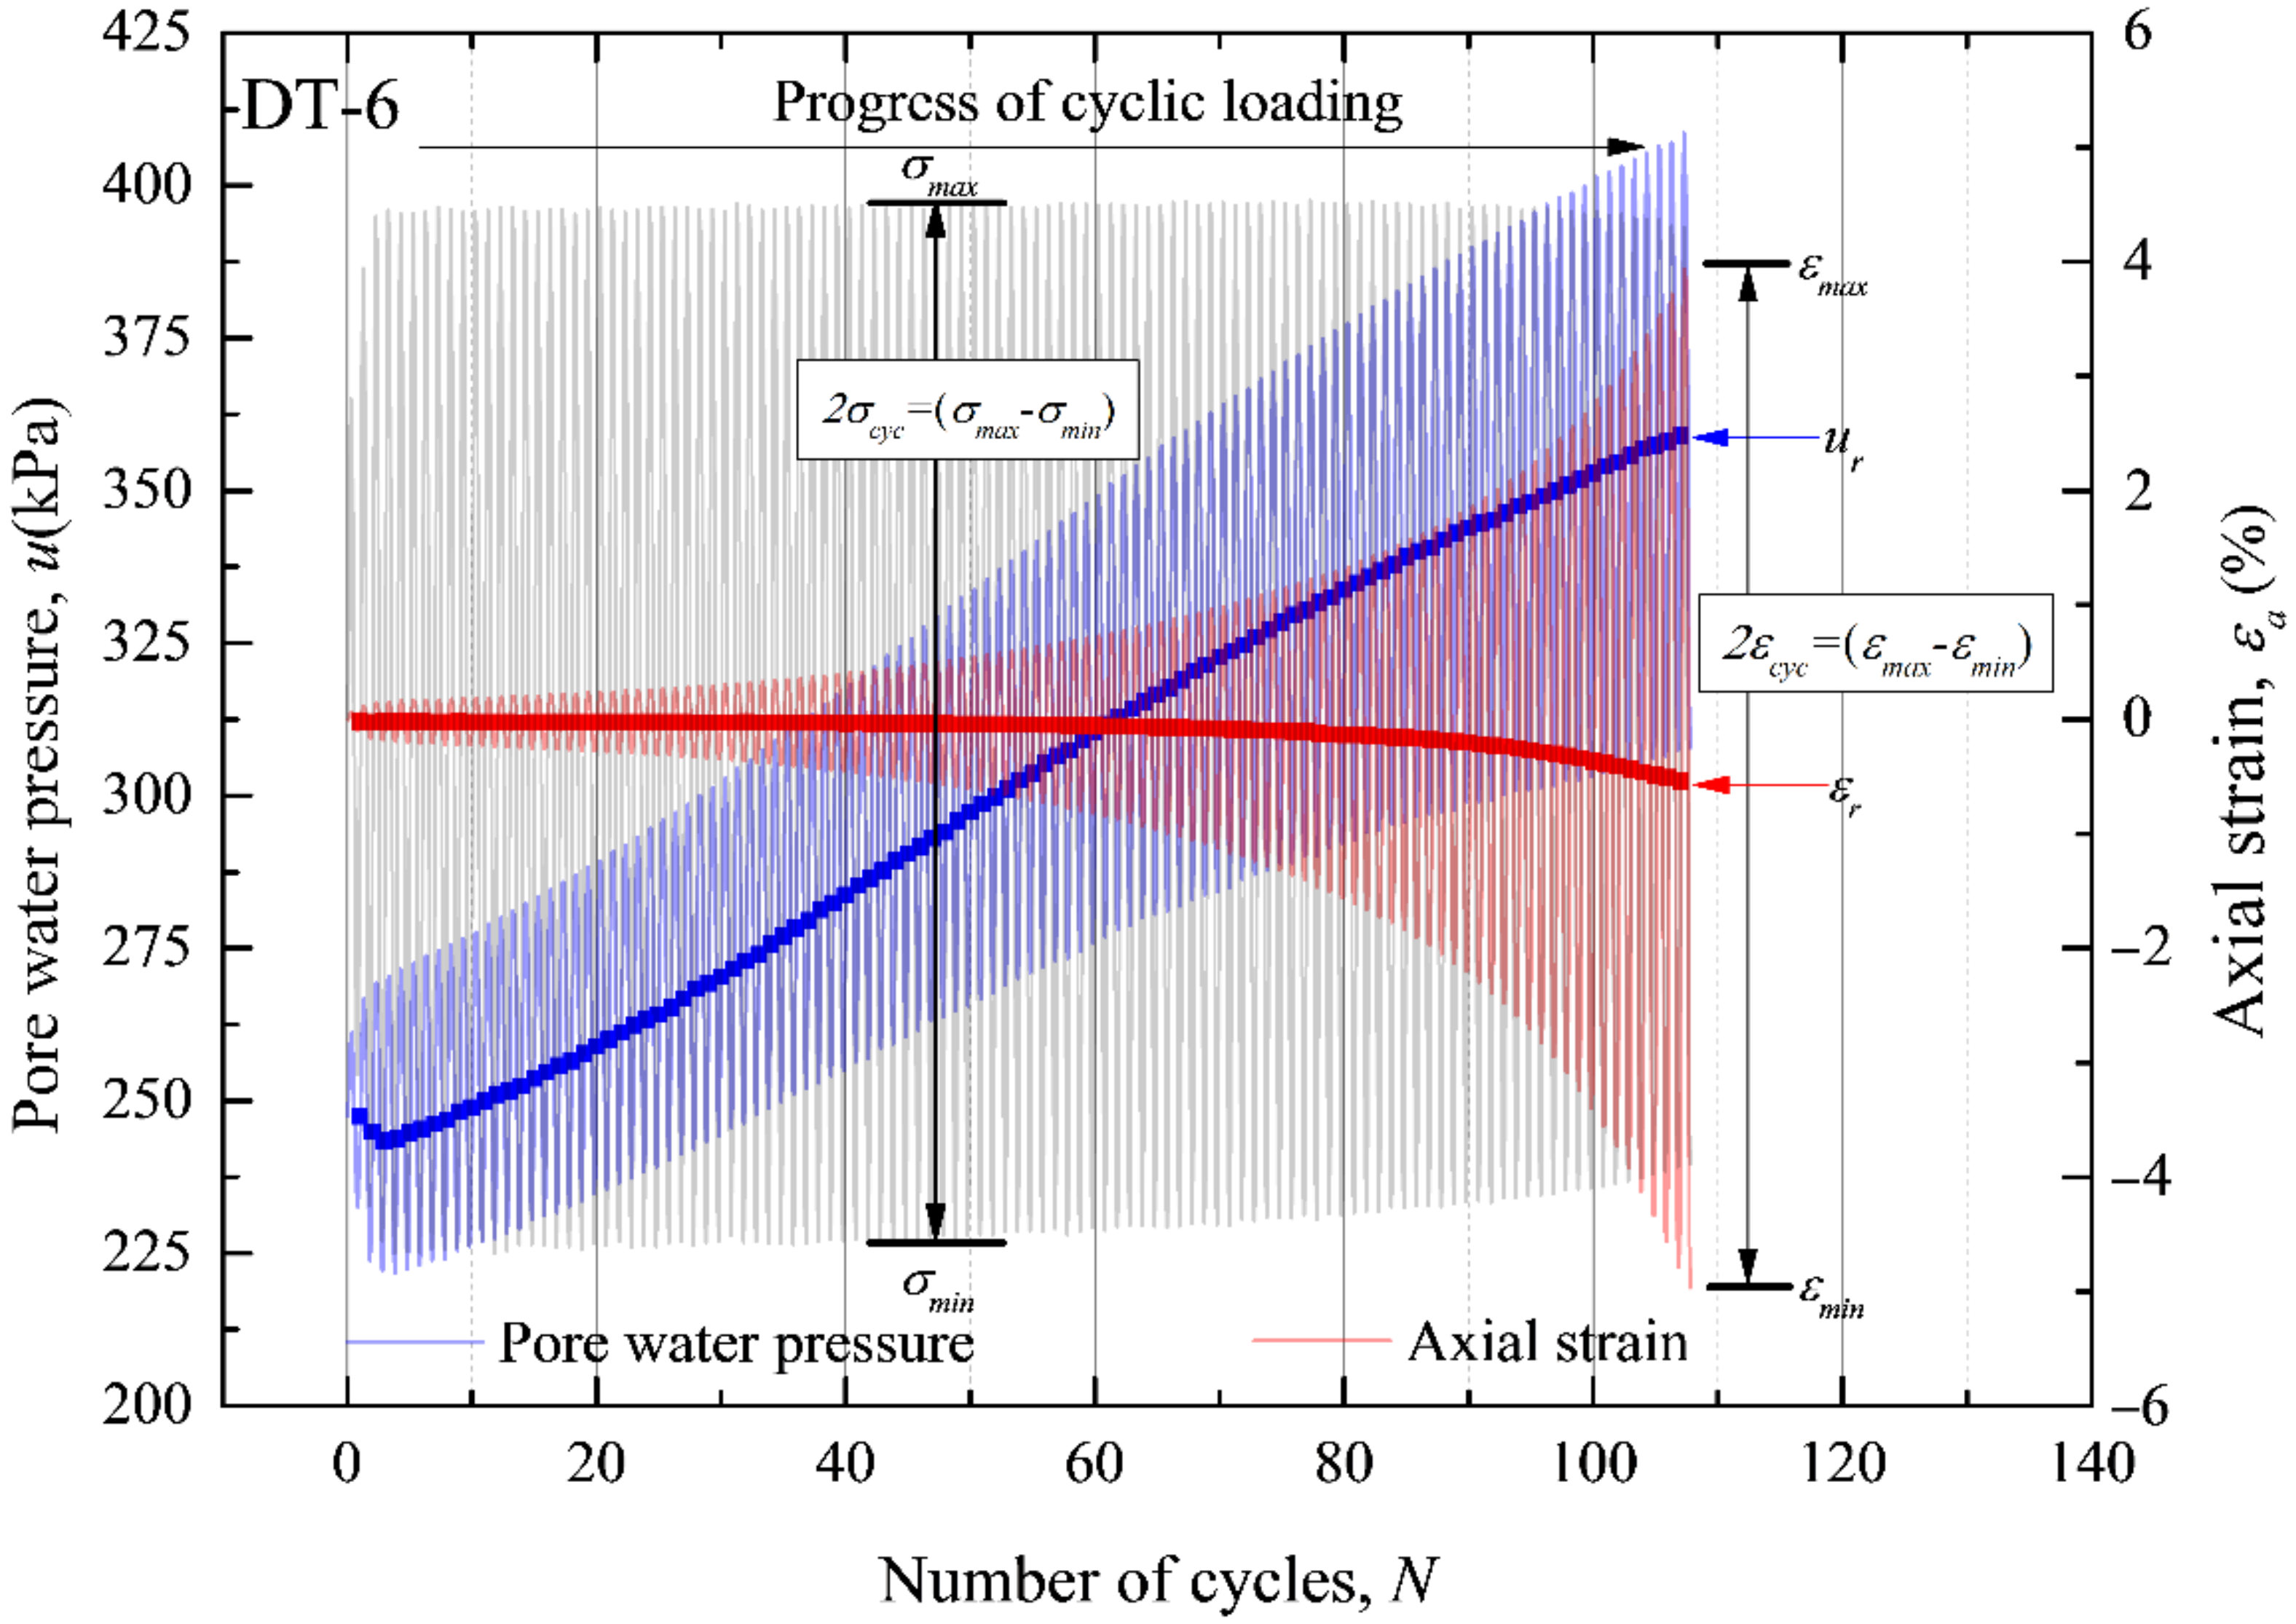
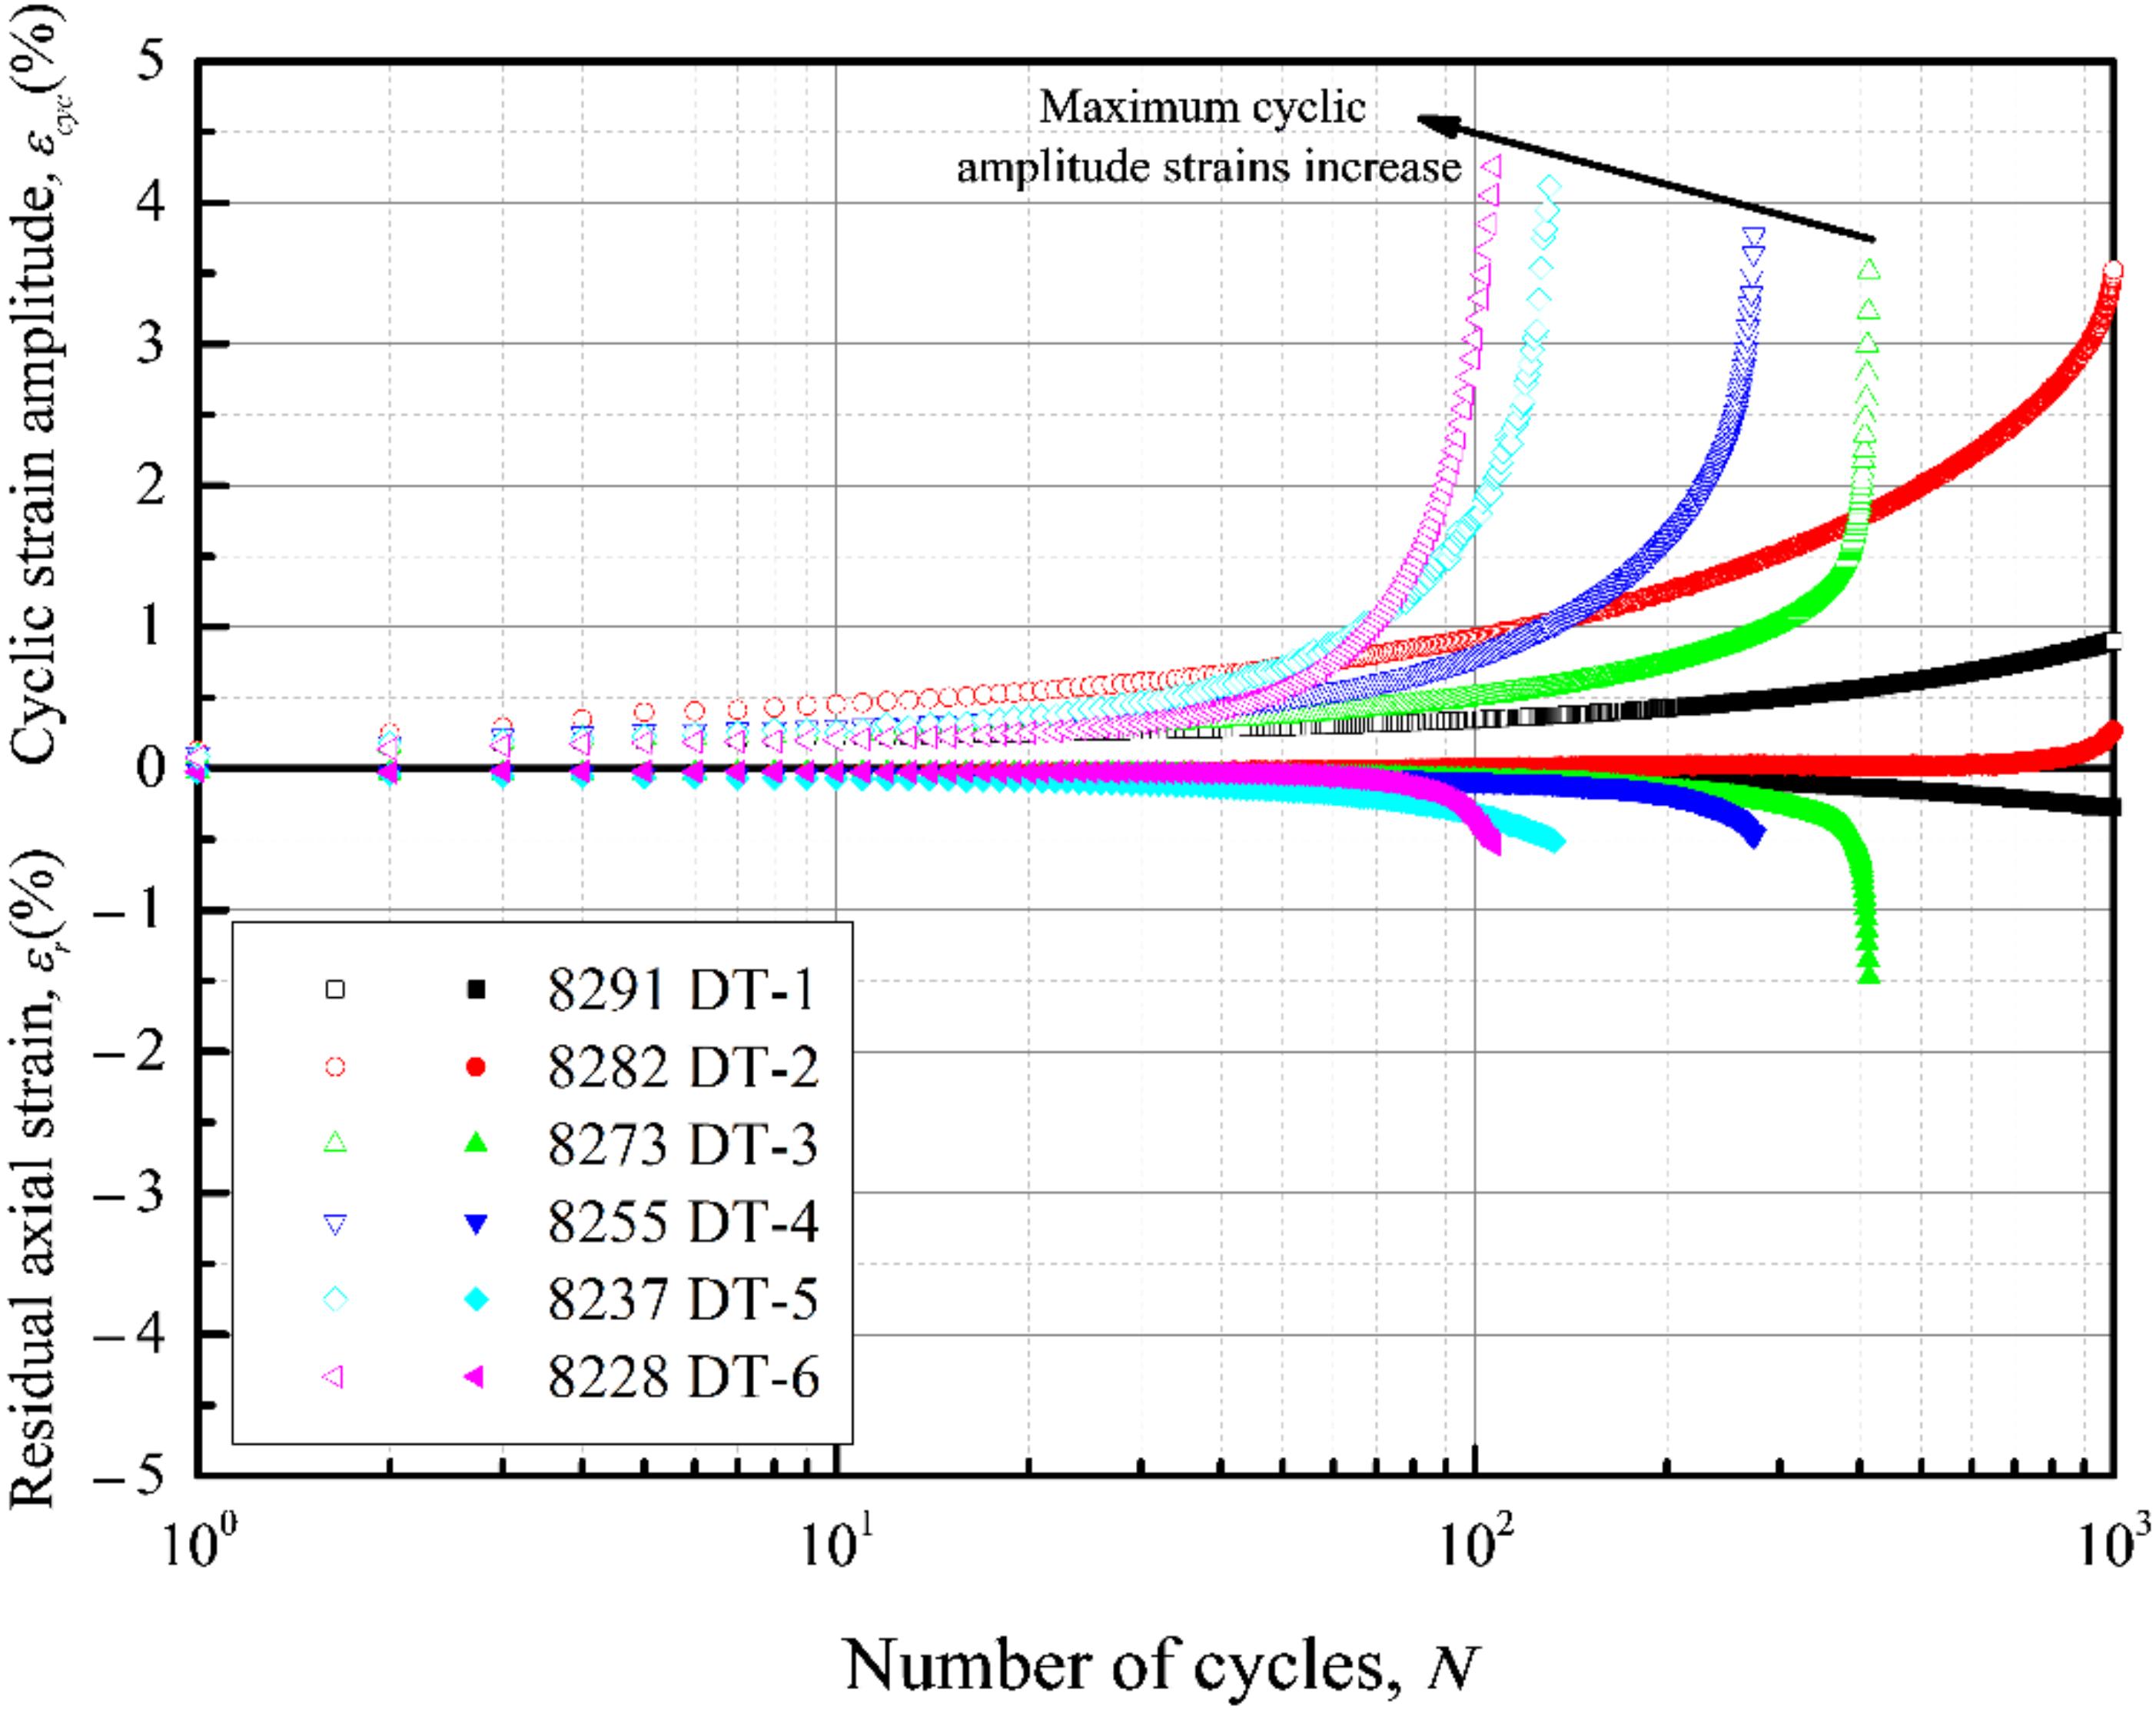
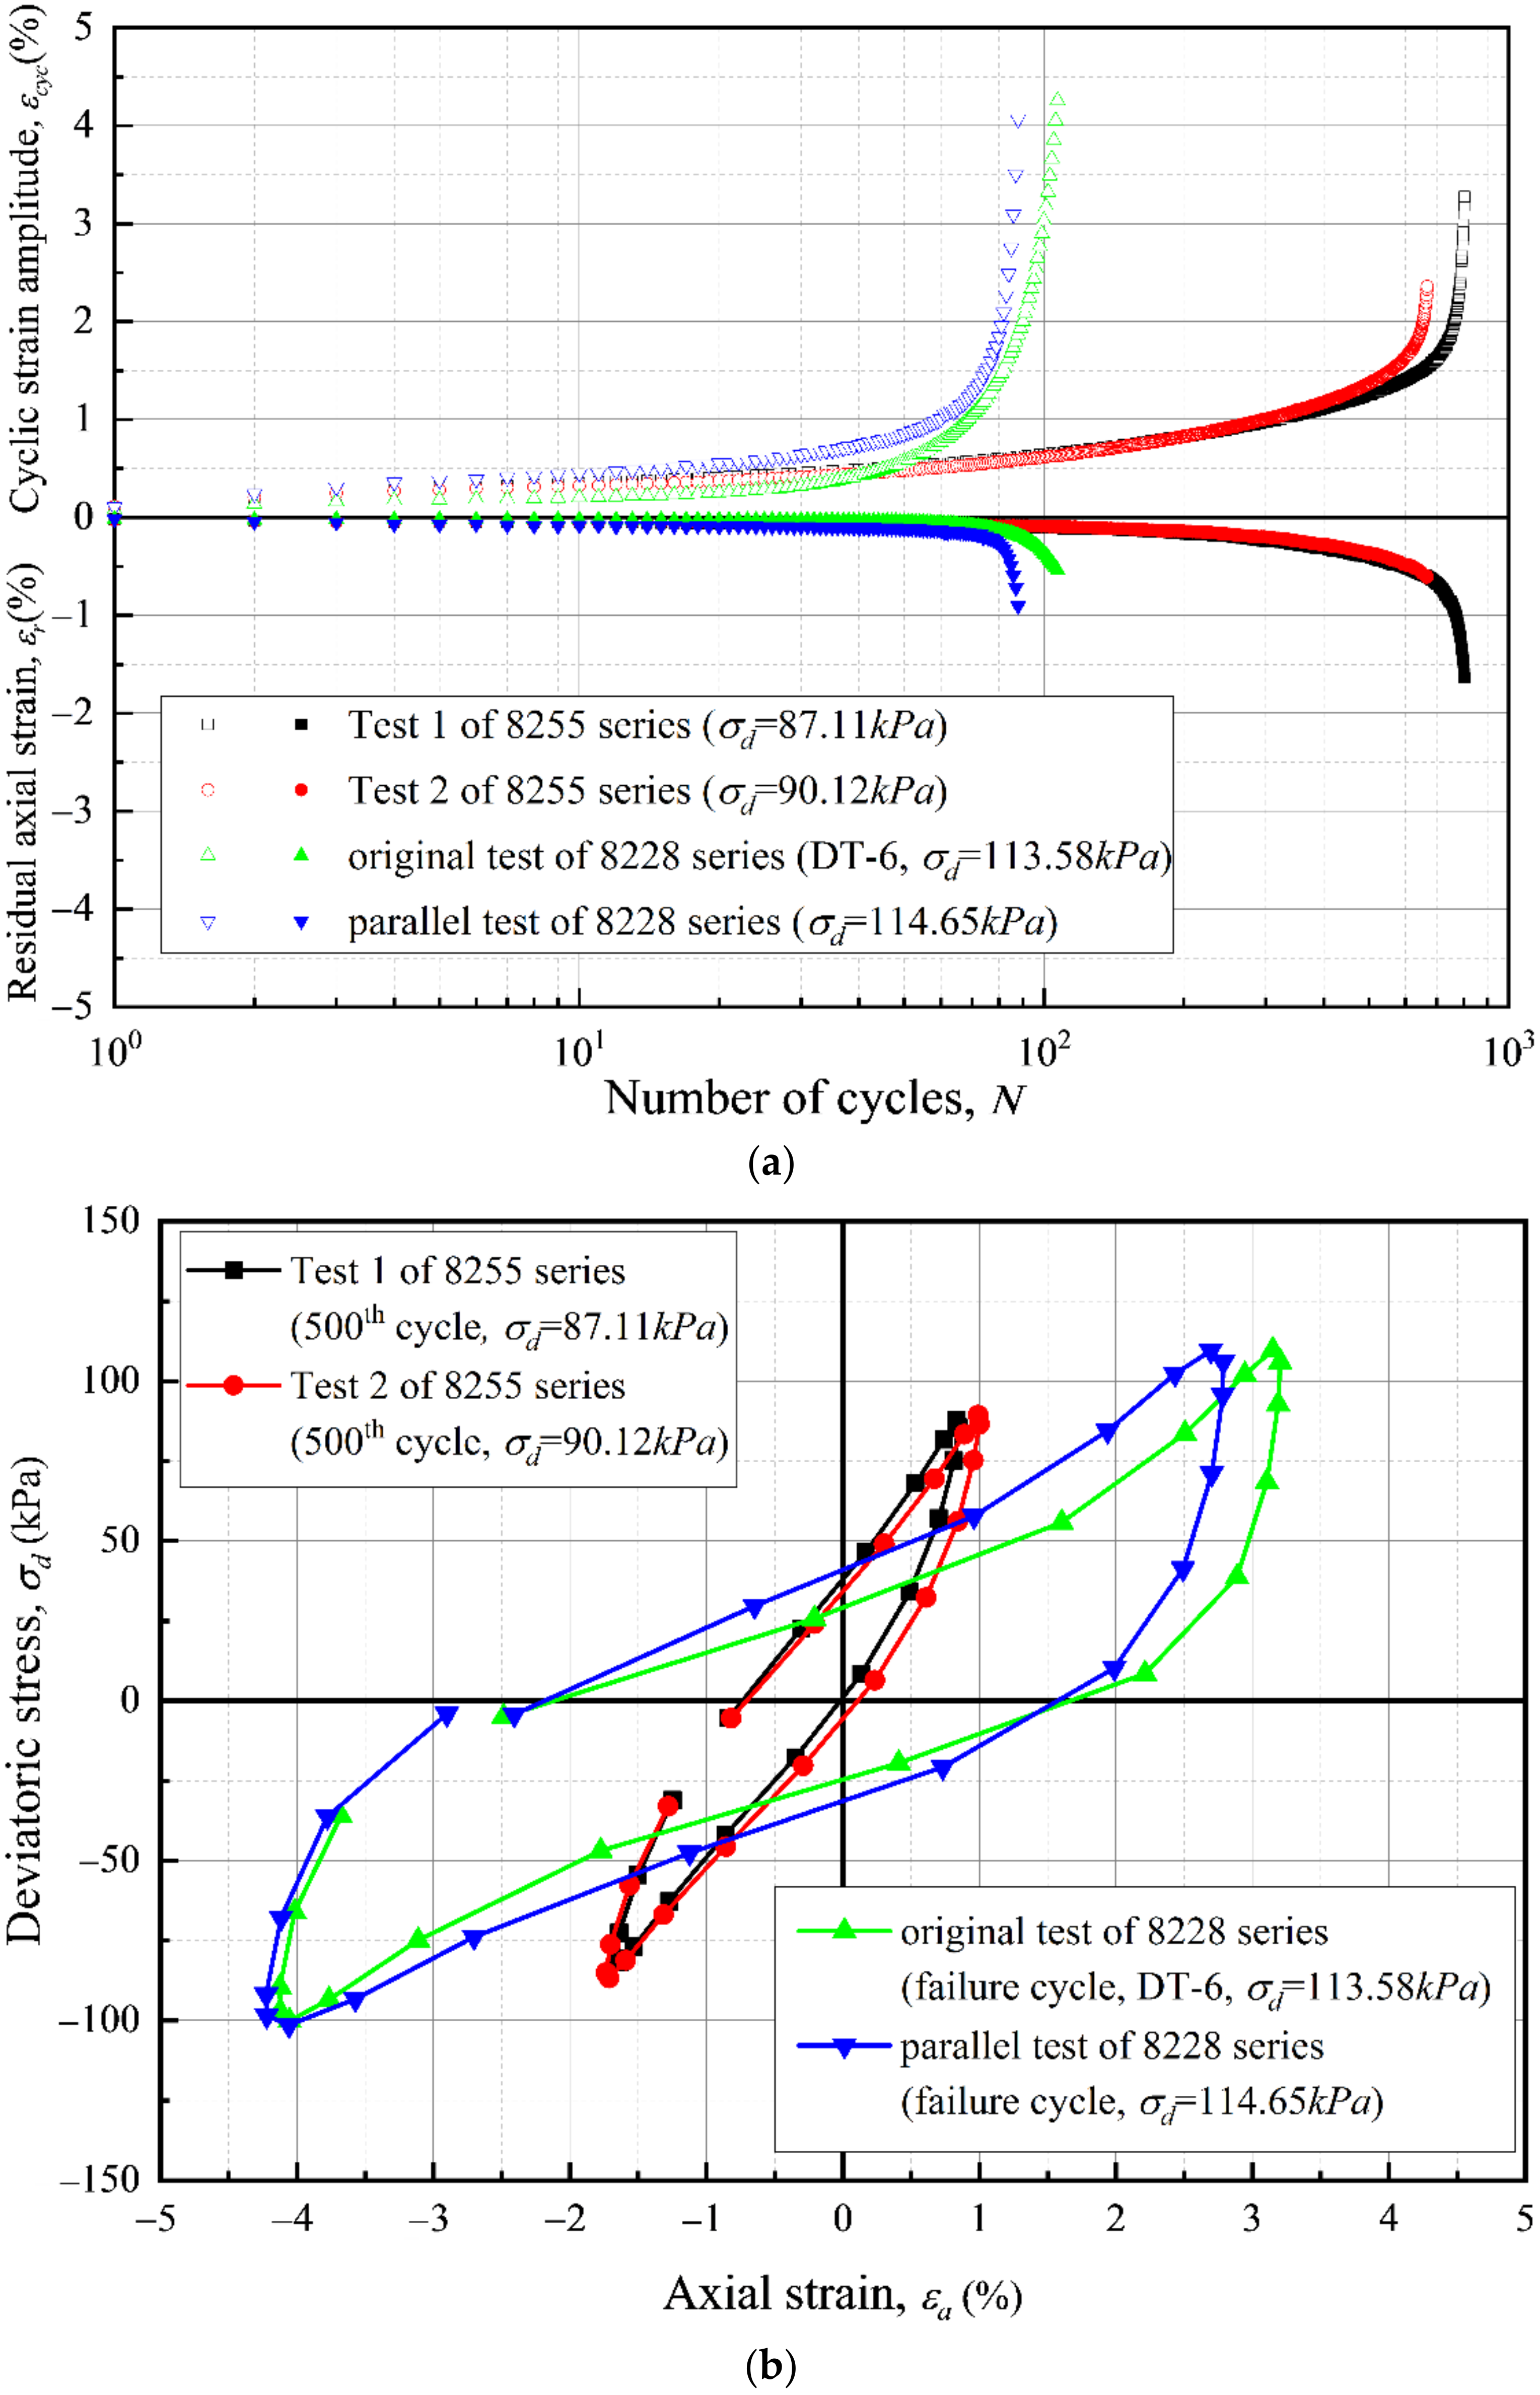
3.1.1. Strain
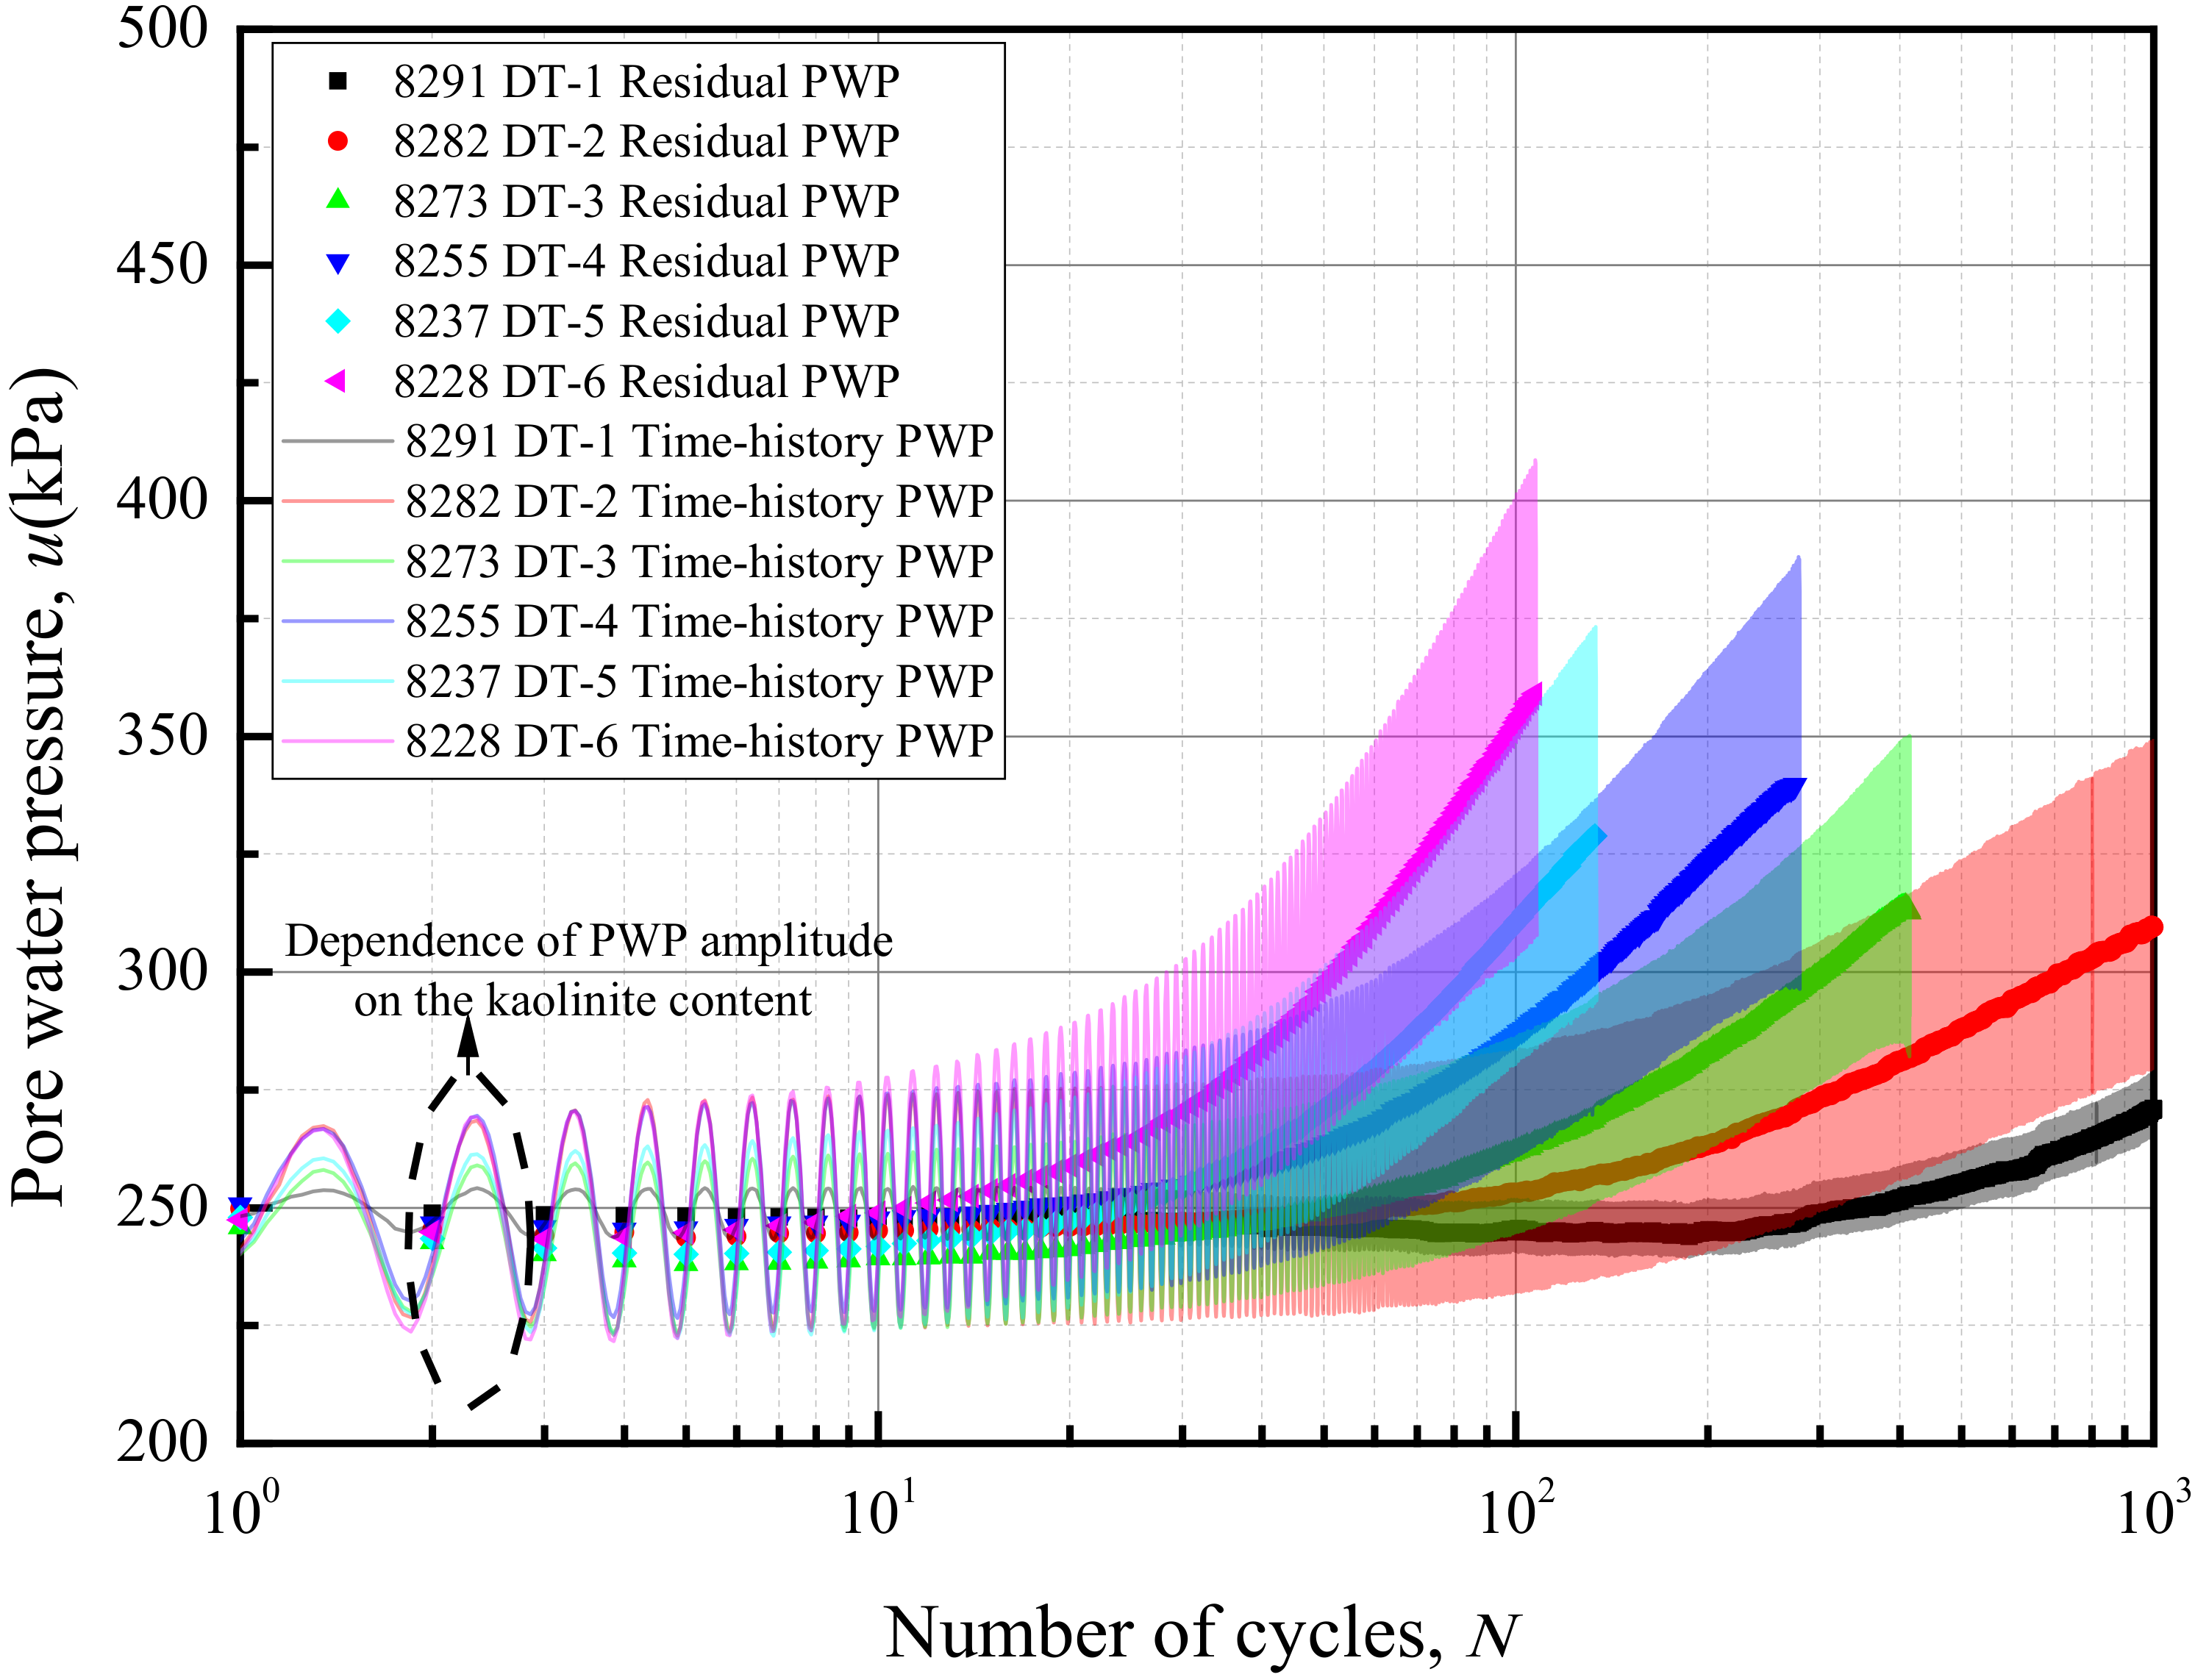
3.1.2. Pore Water Pressure
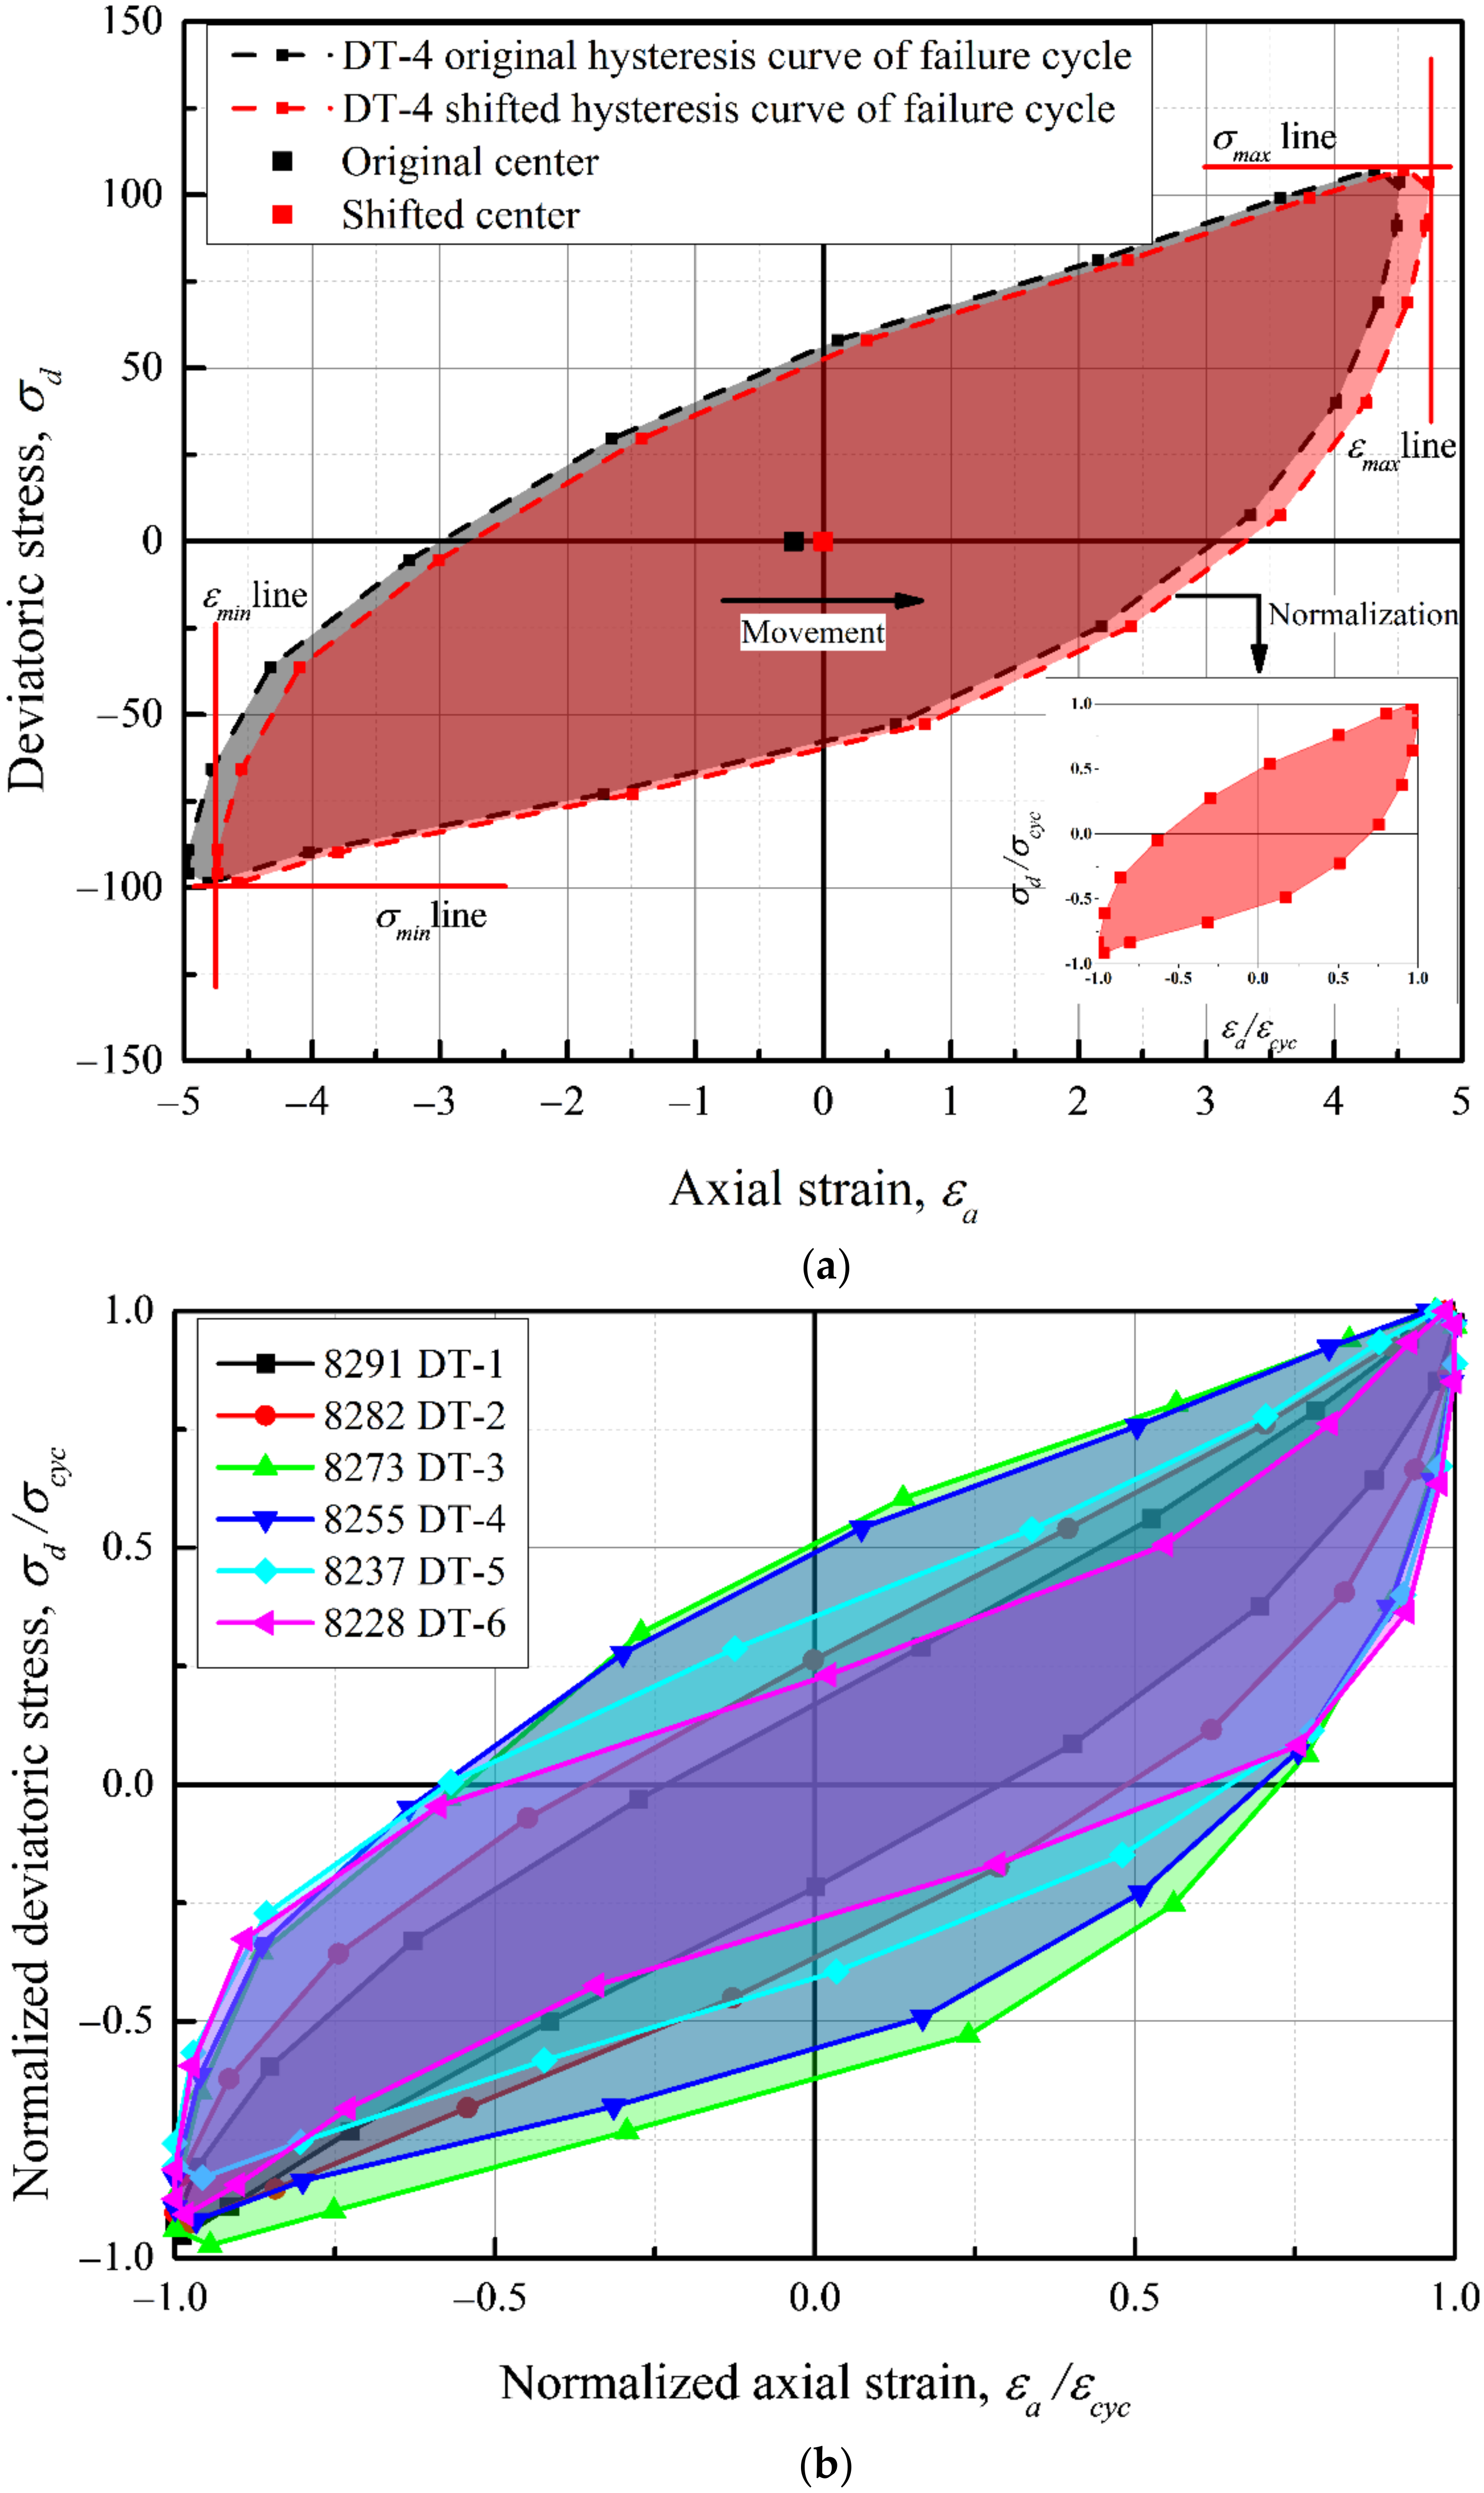
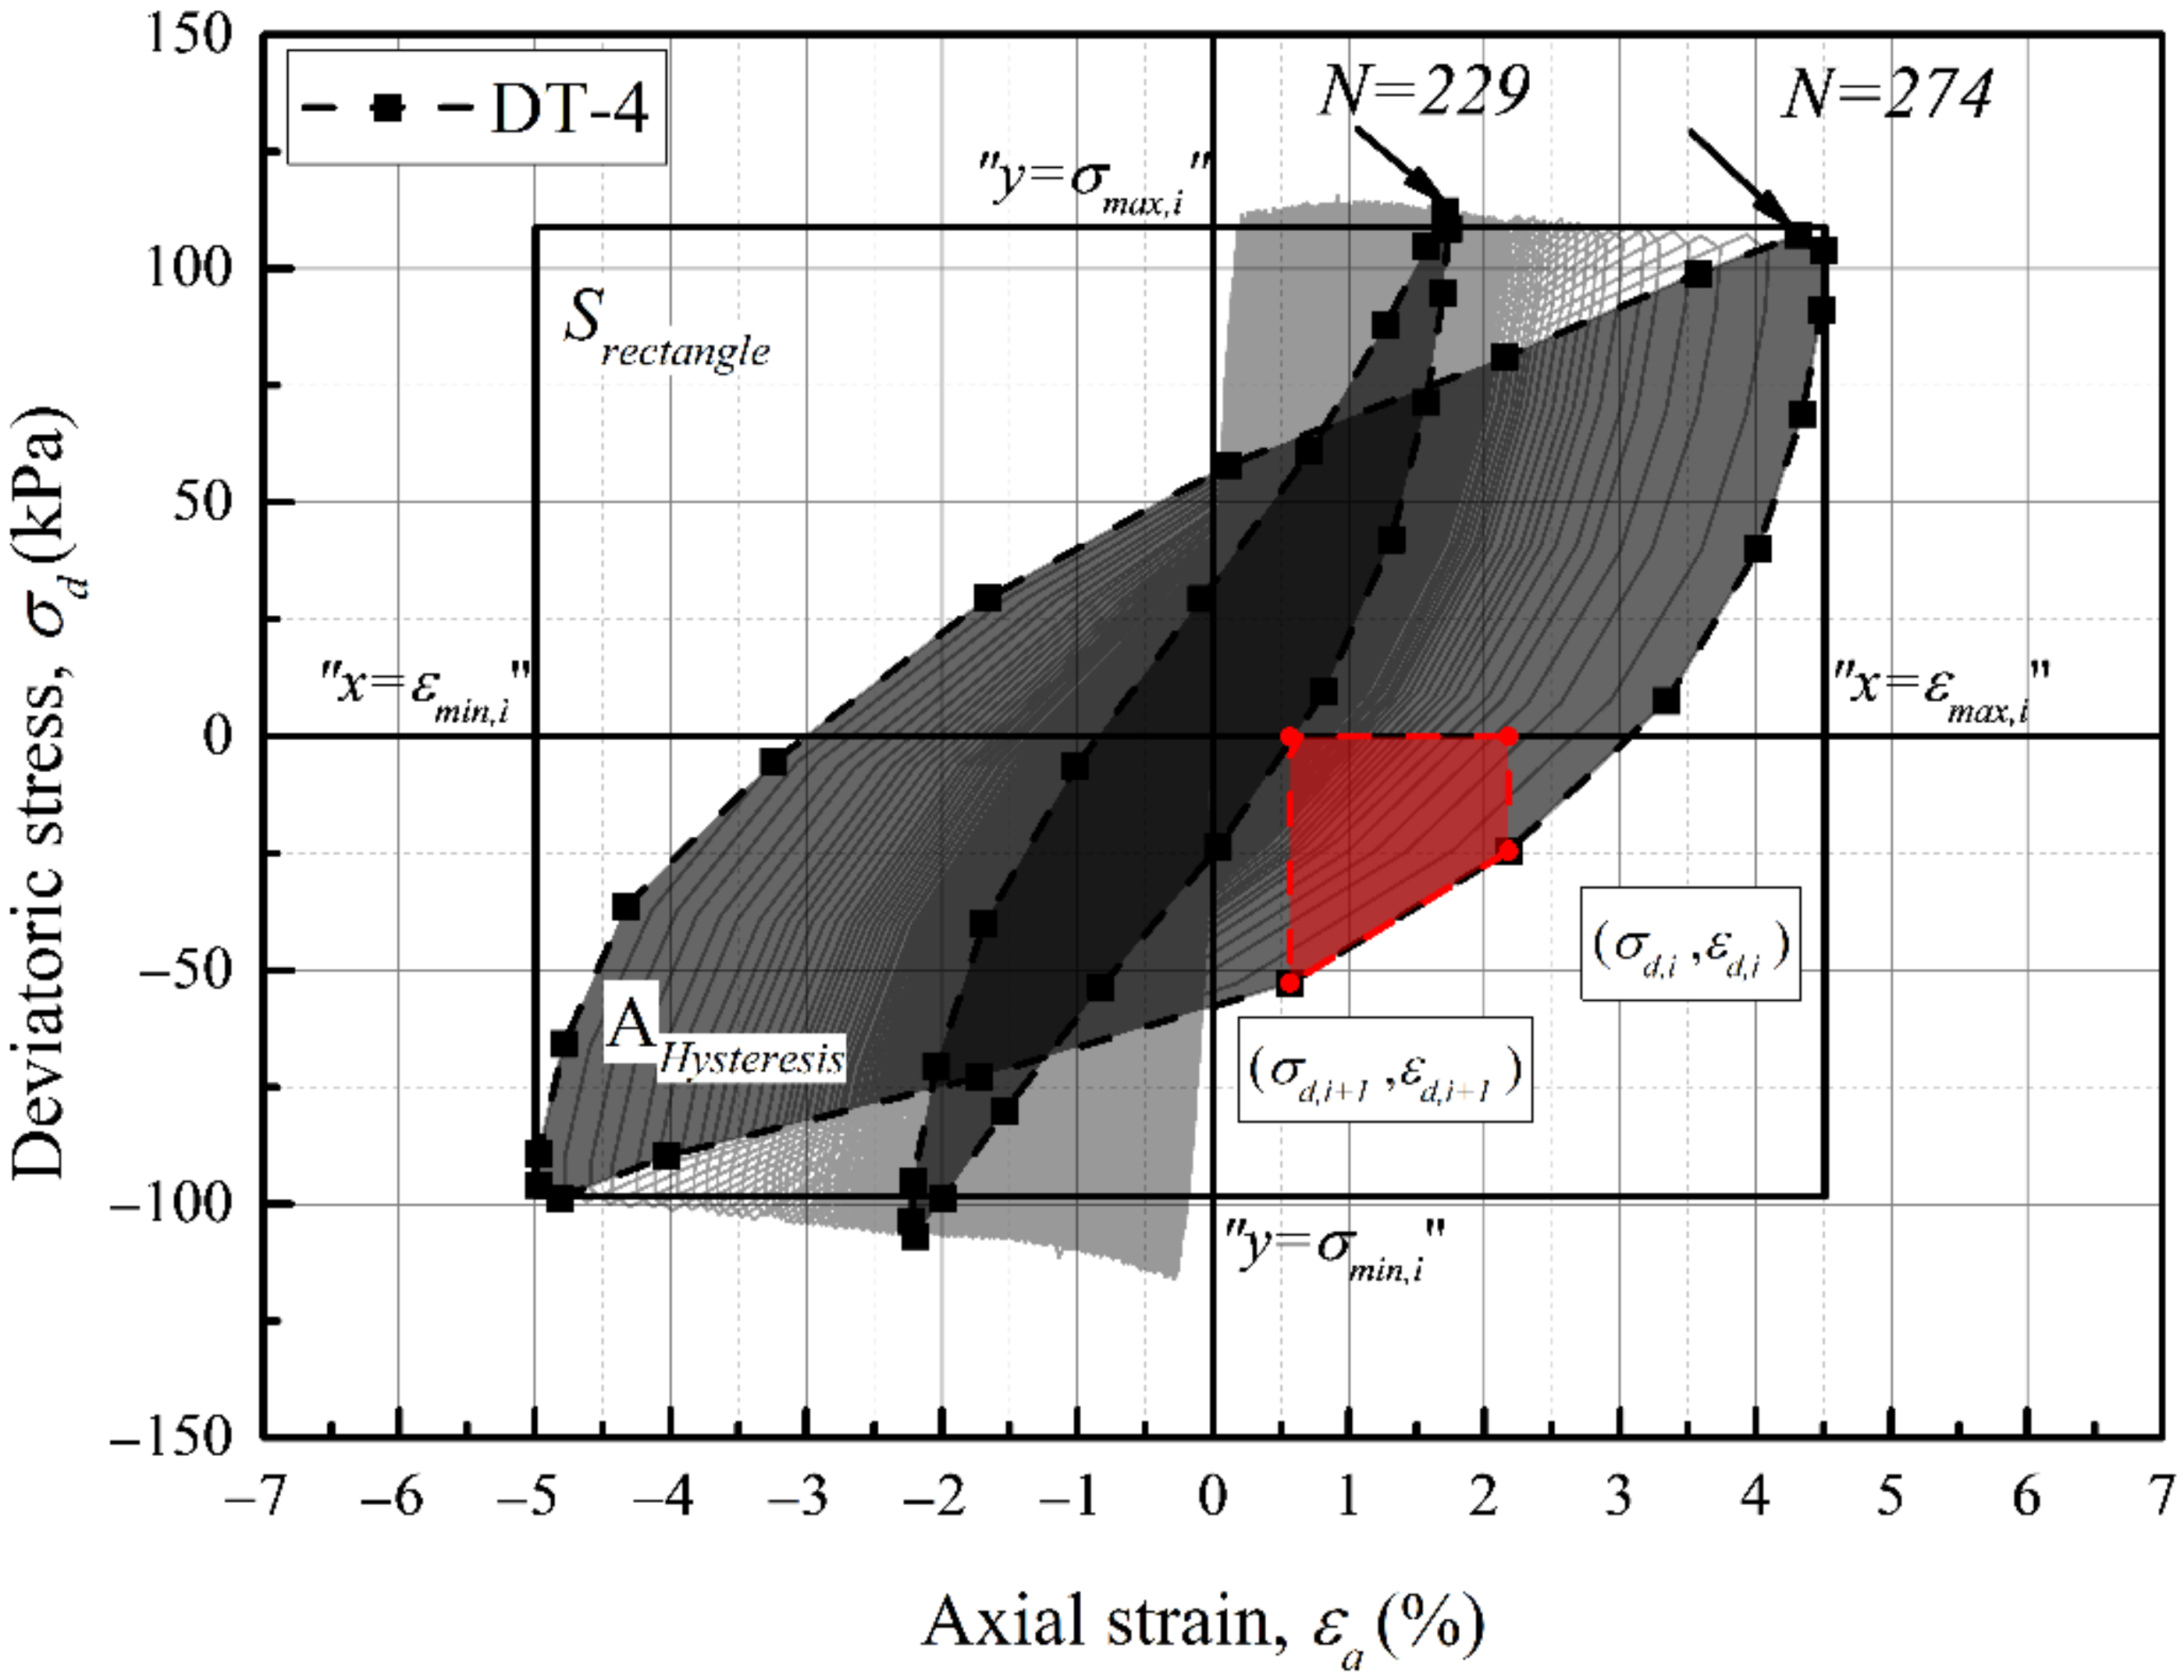
3.1.3. Hysteresis Curve Shape
3.2. Stiffness and Energy Dissipation
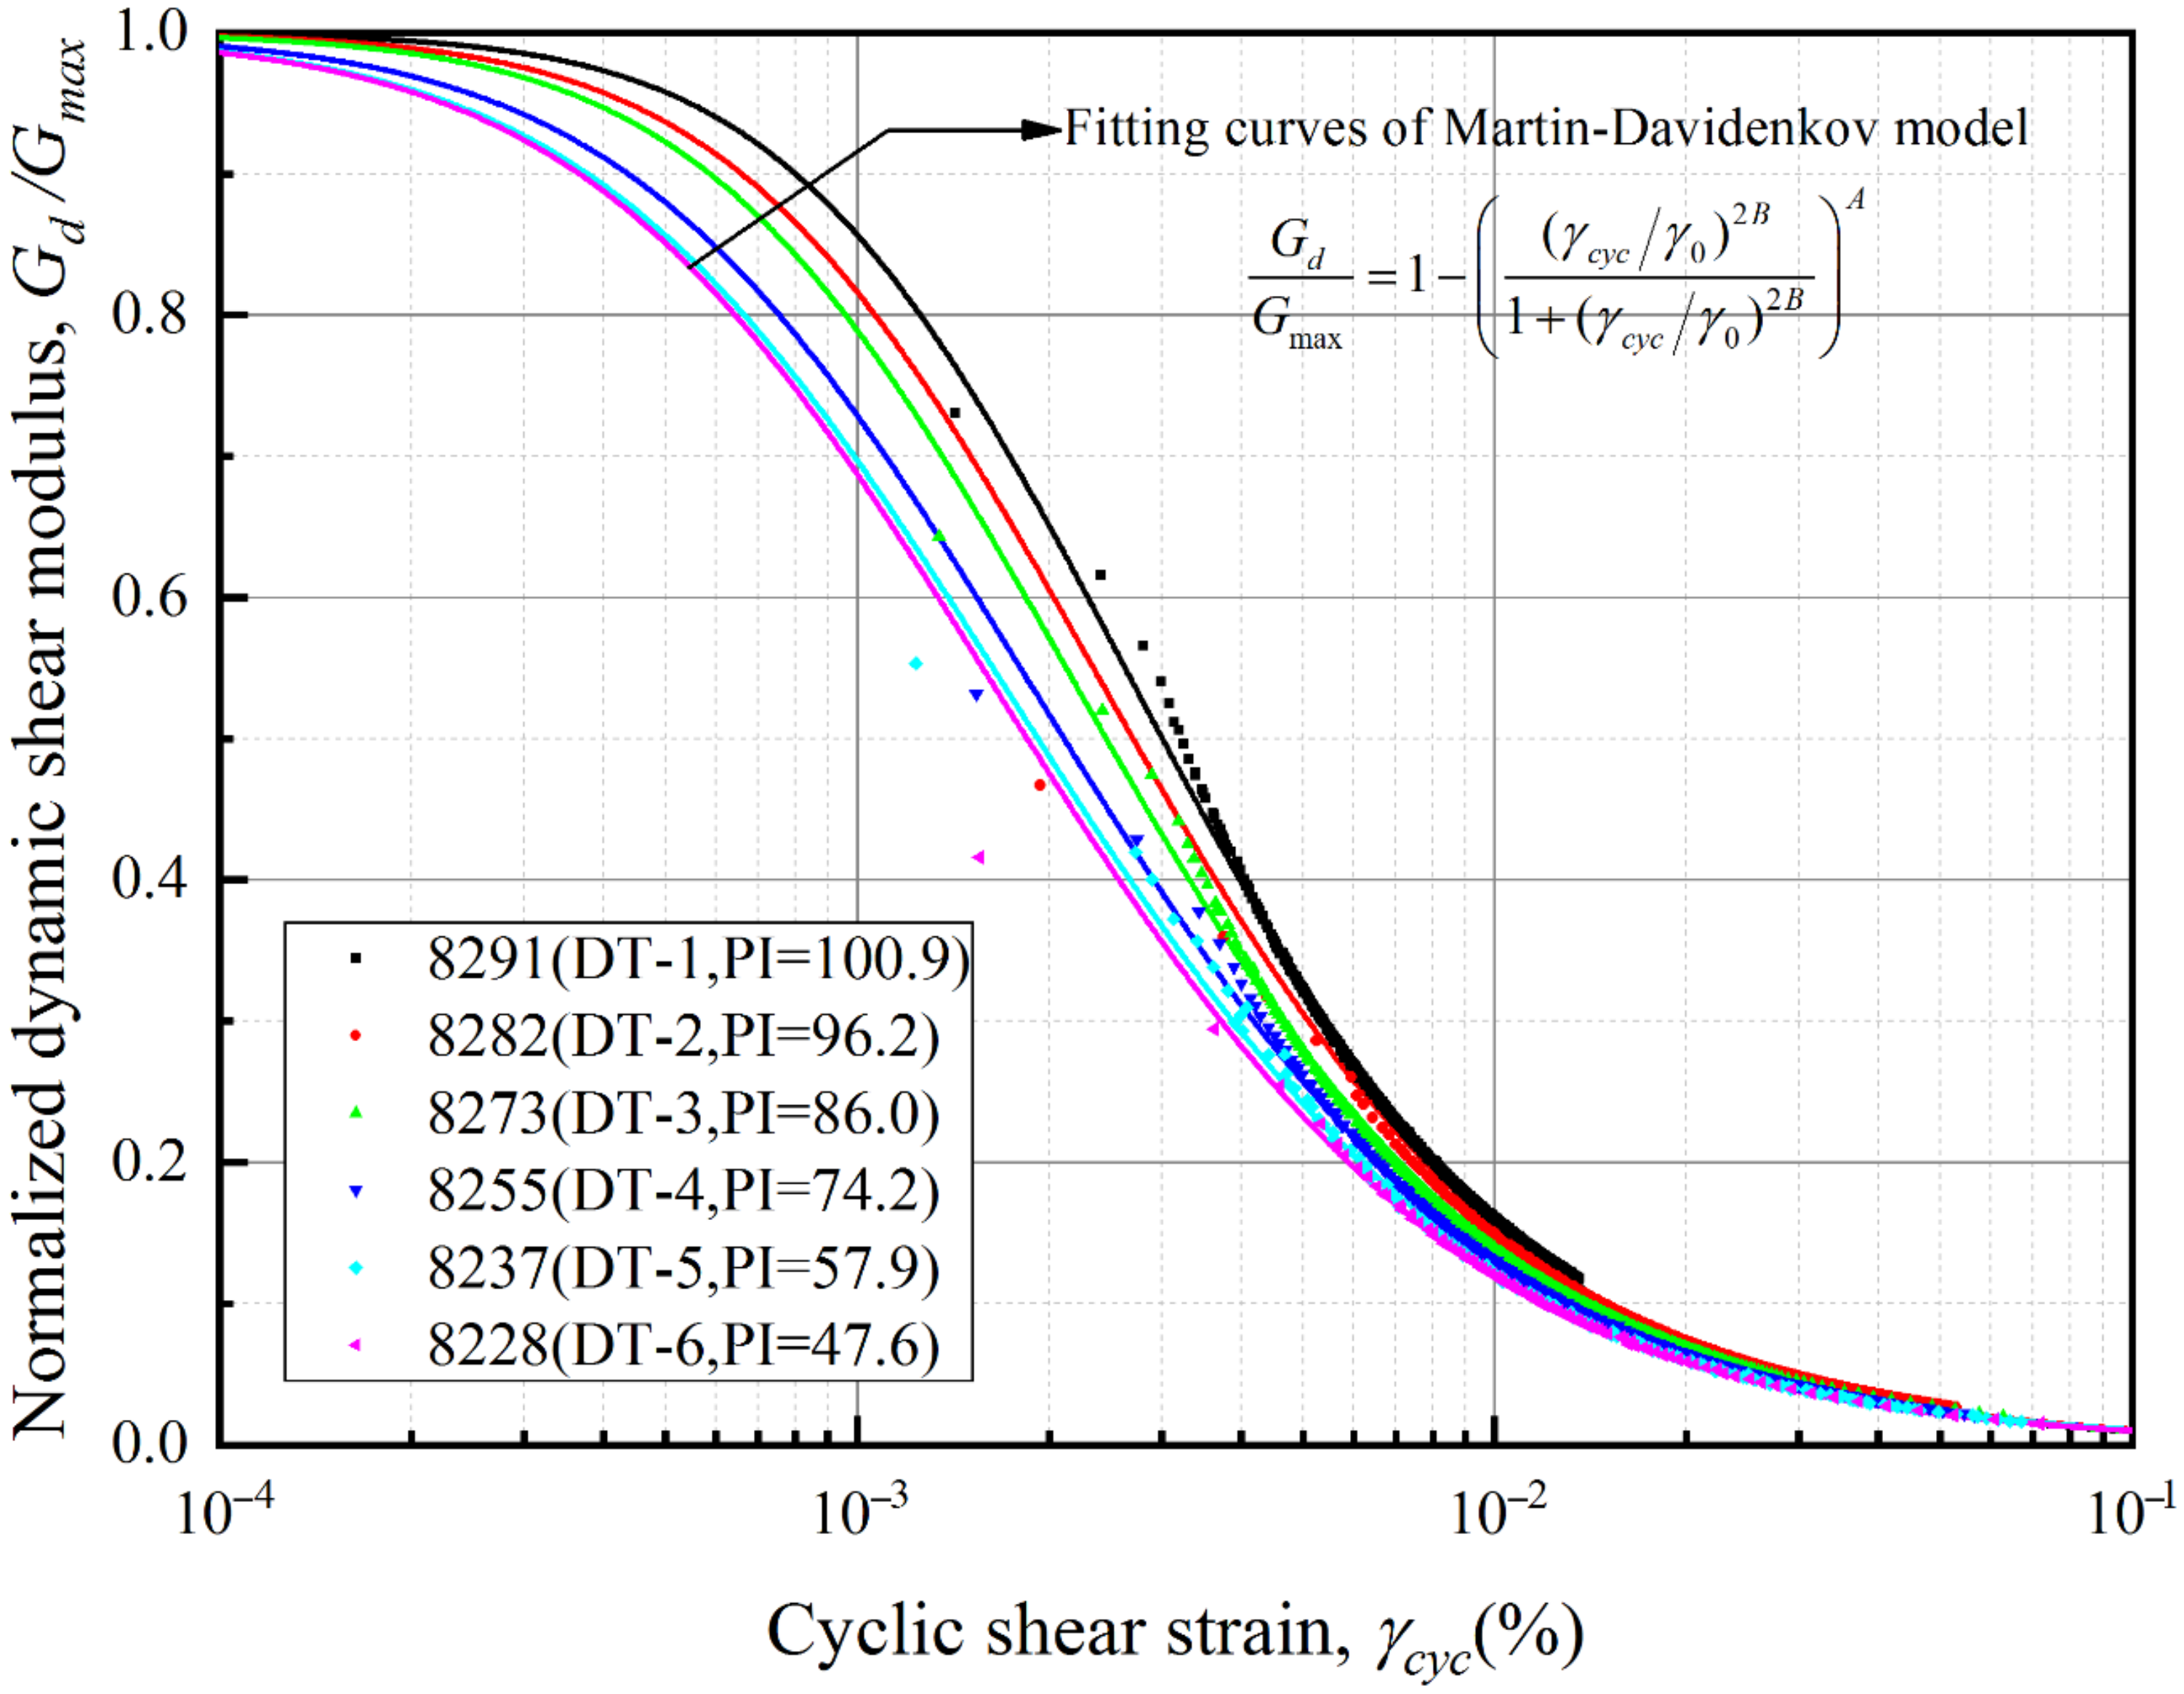
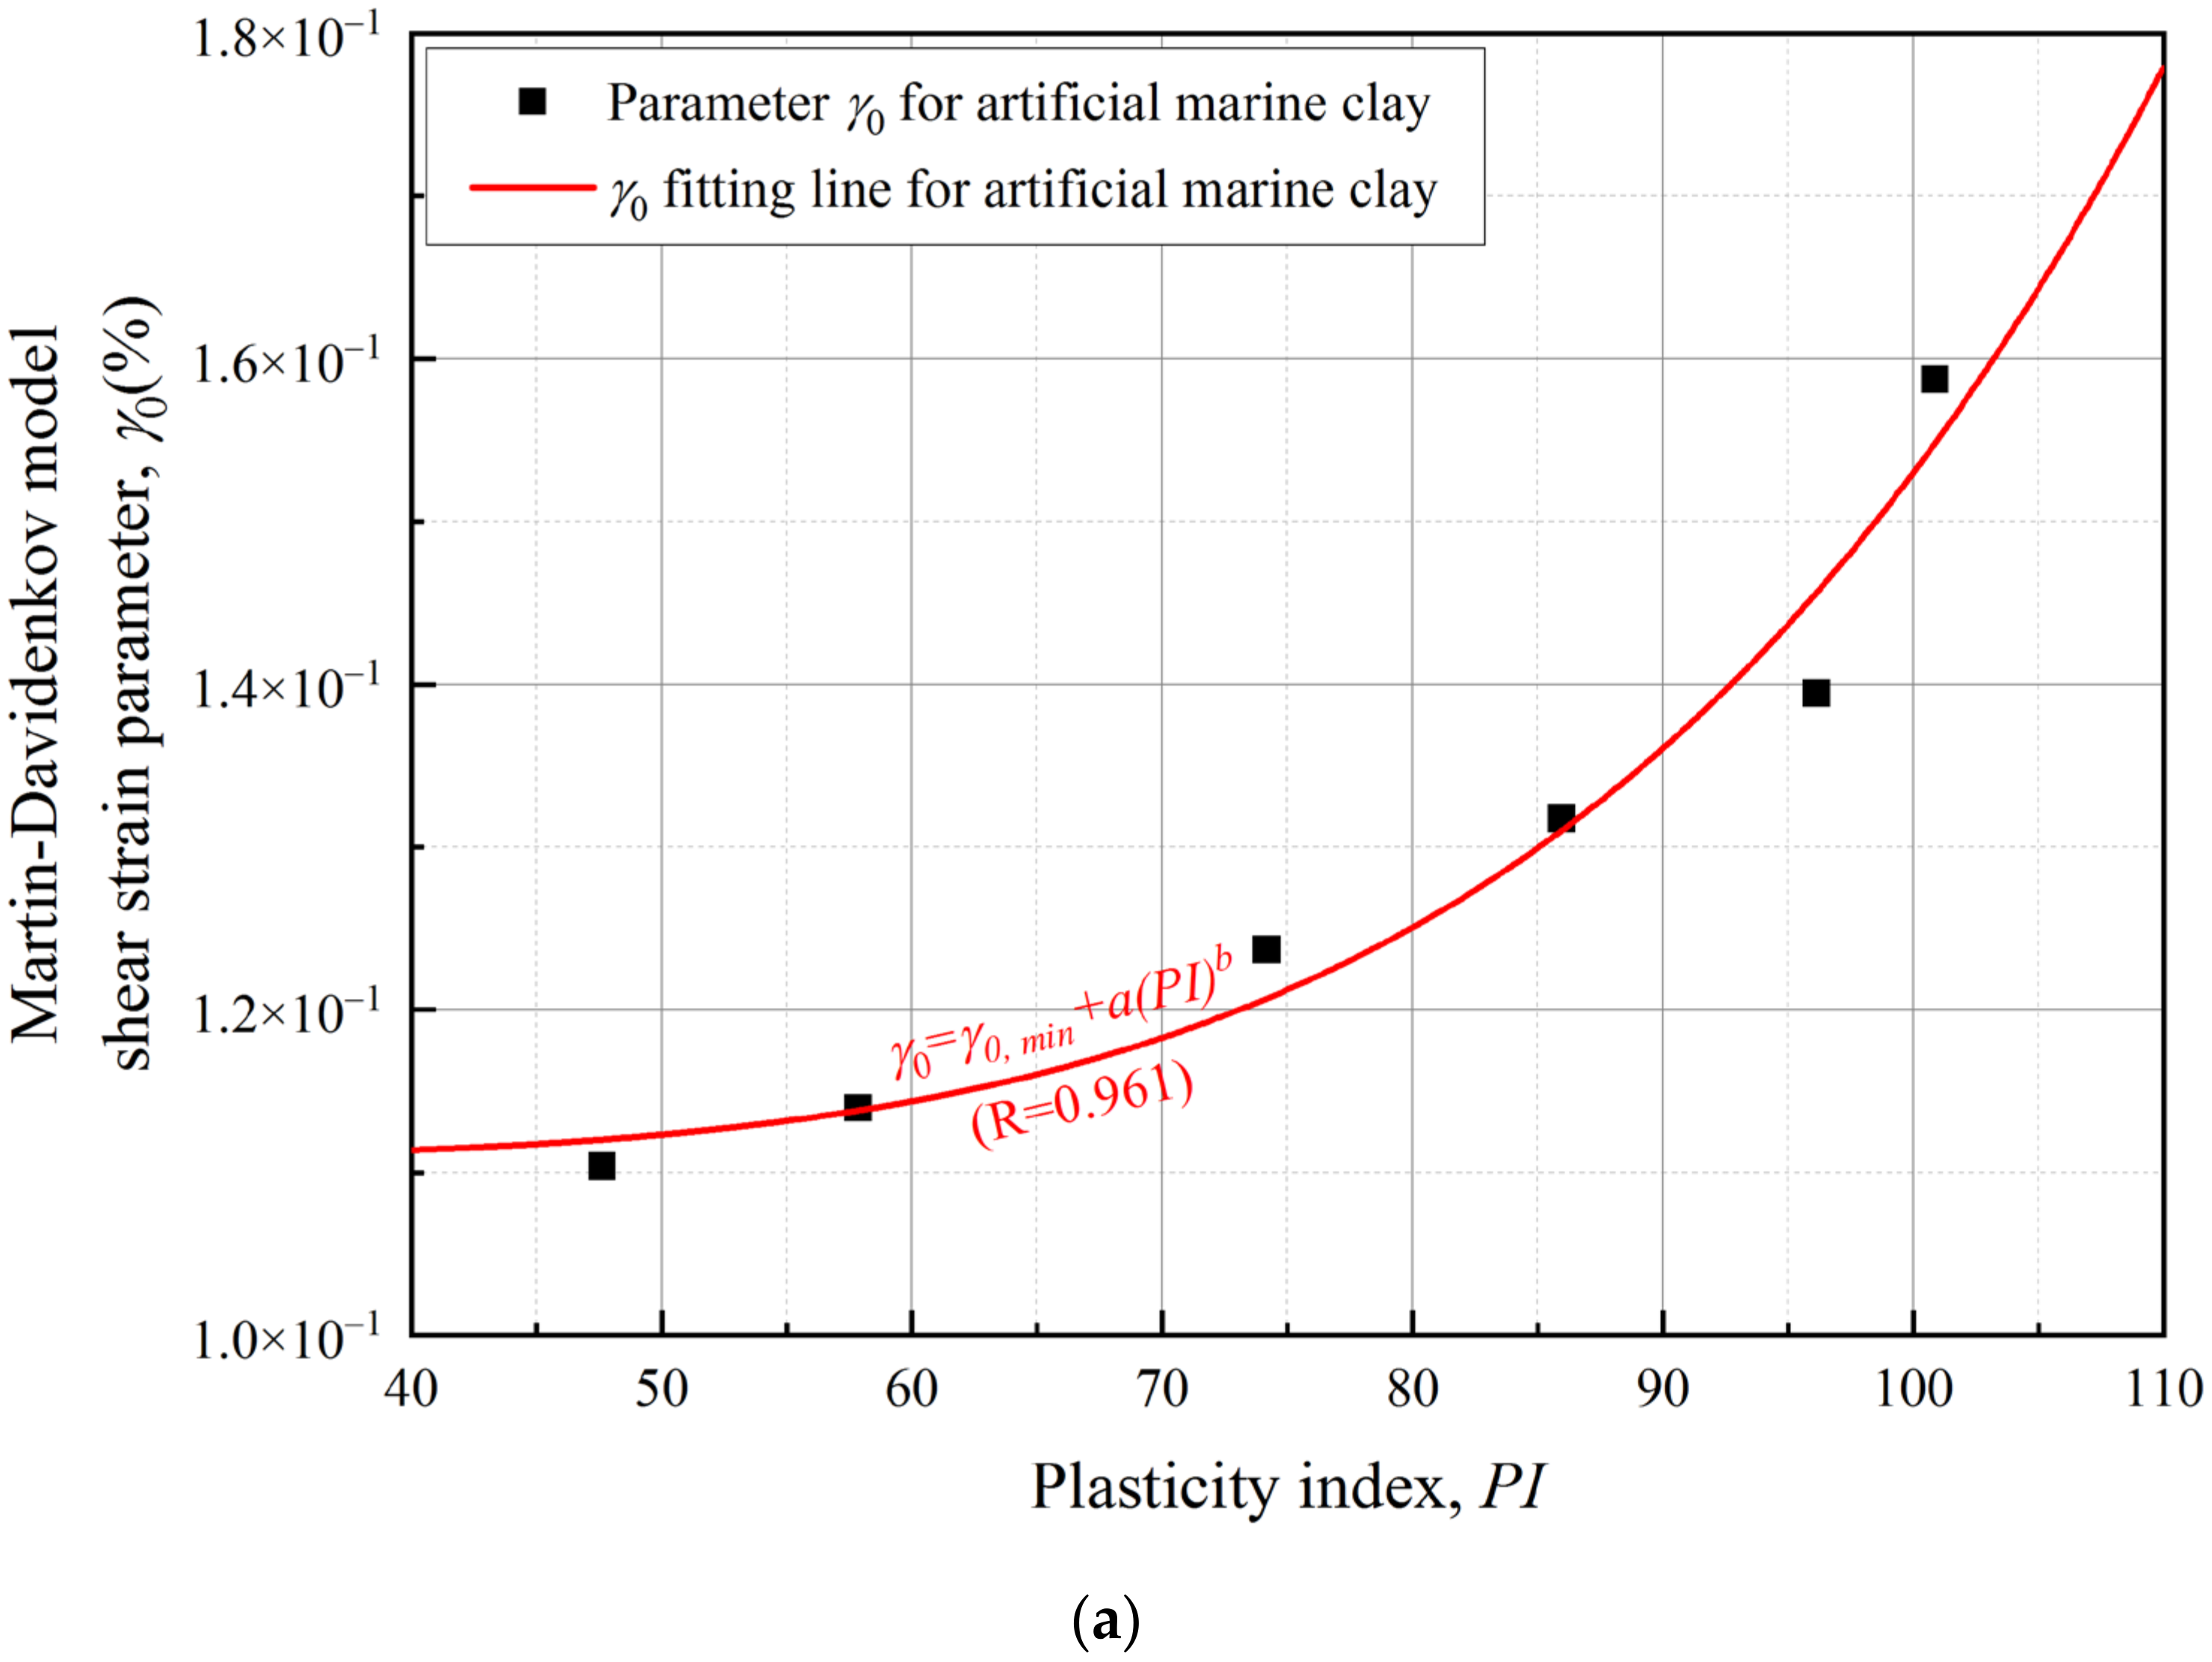
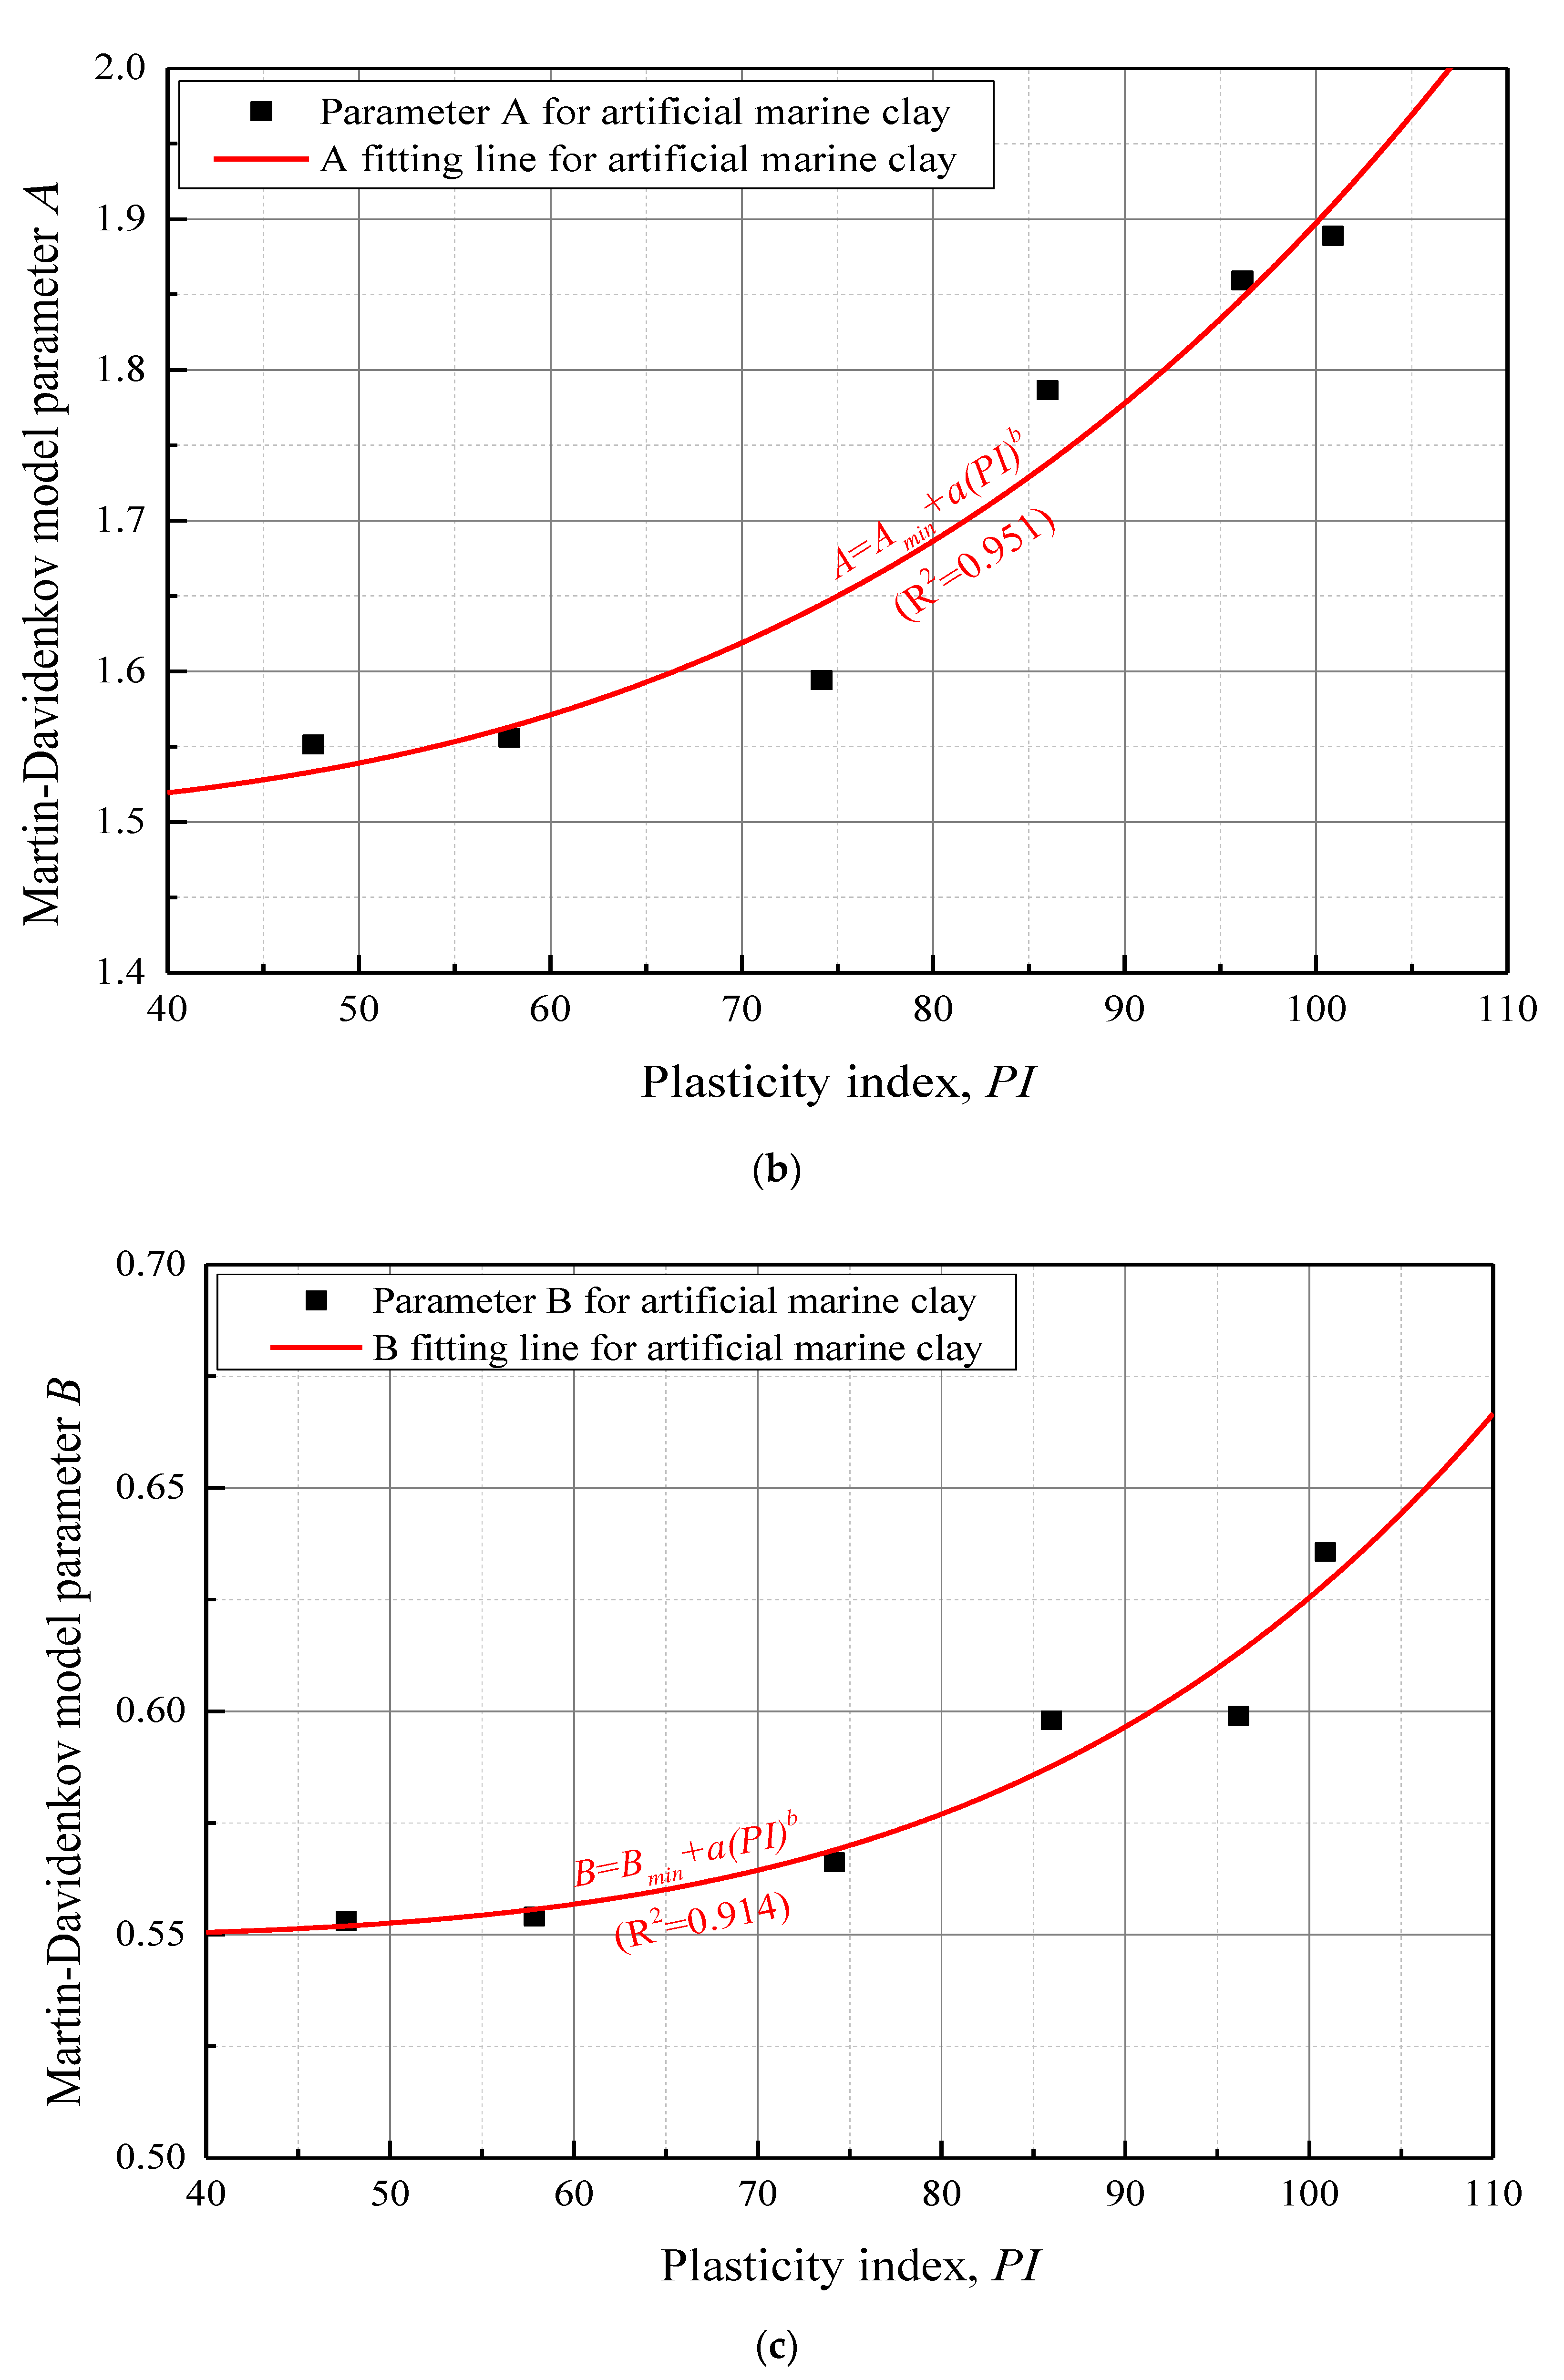
3.2.1. Stiffness Degradation
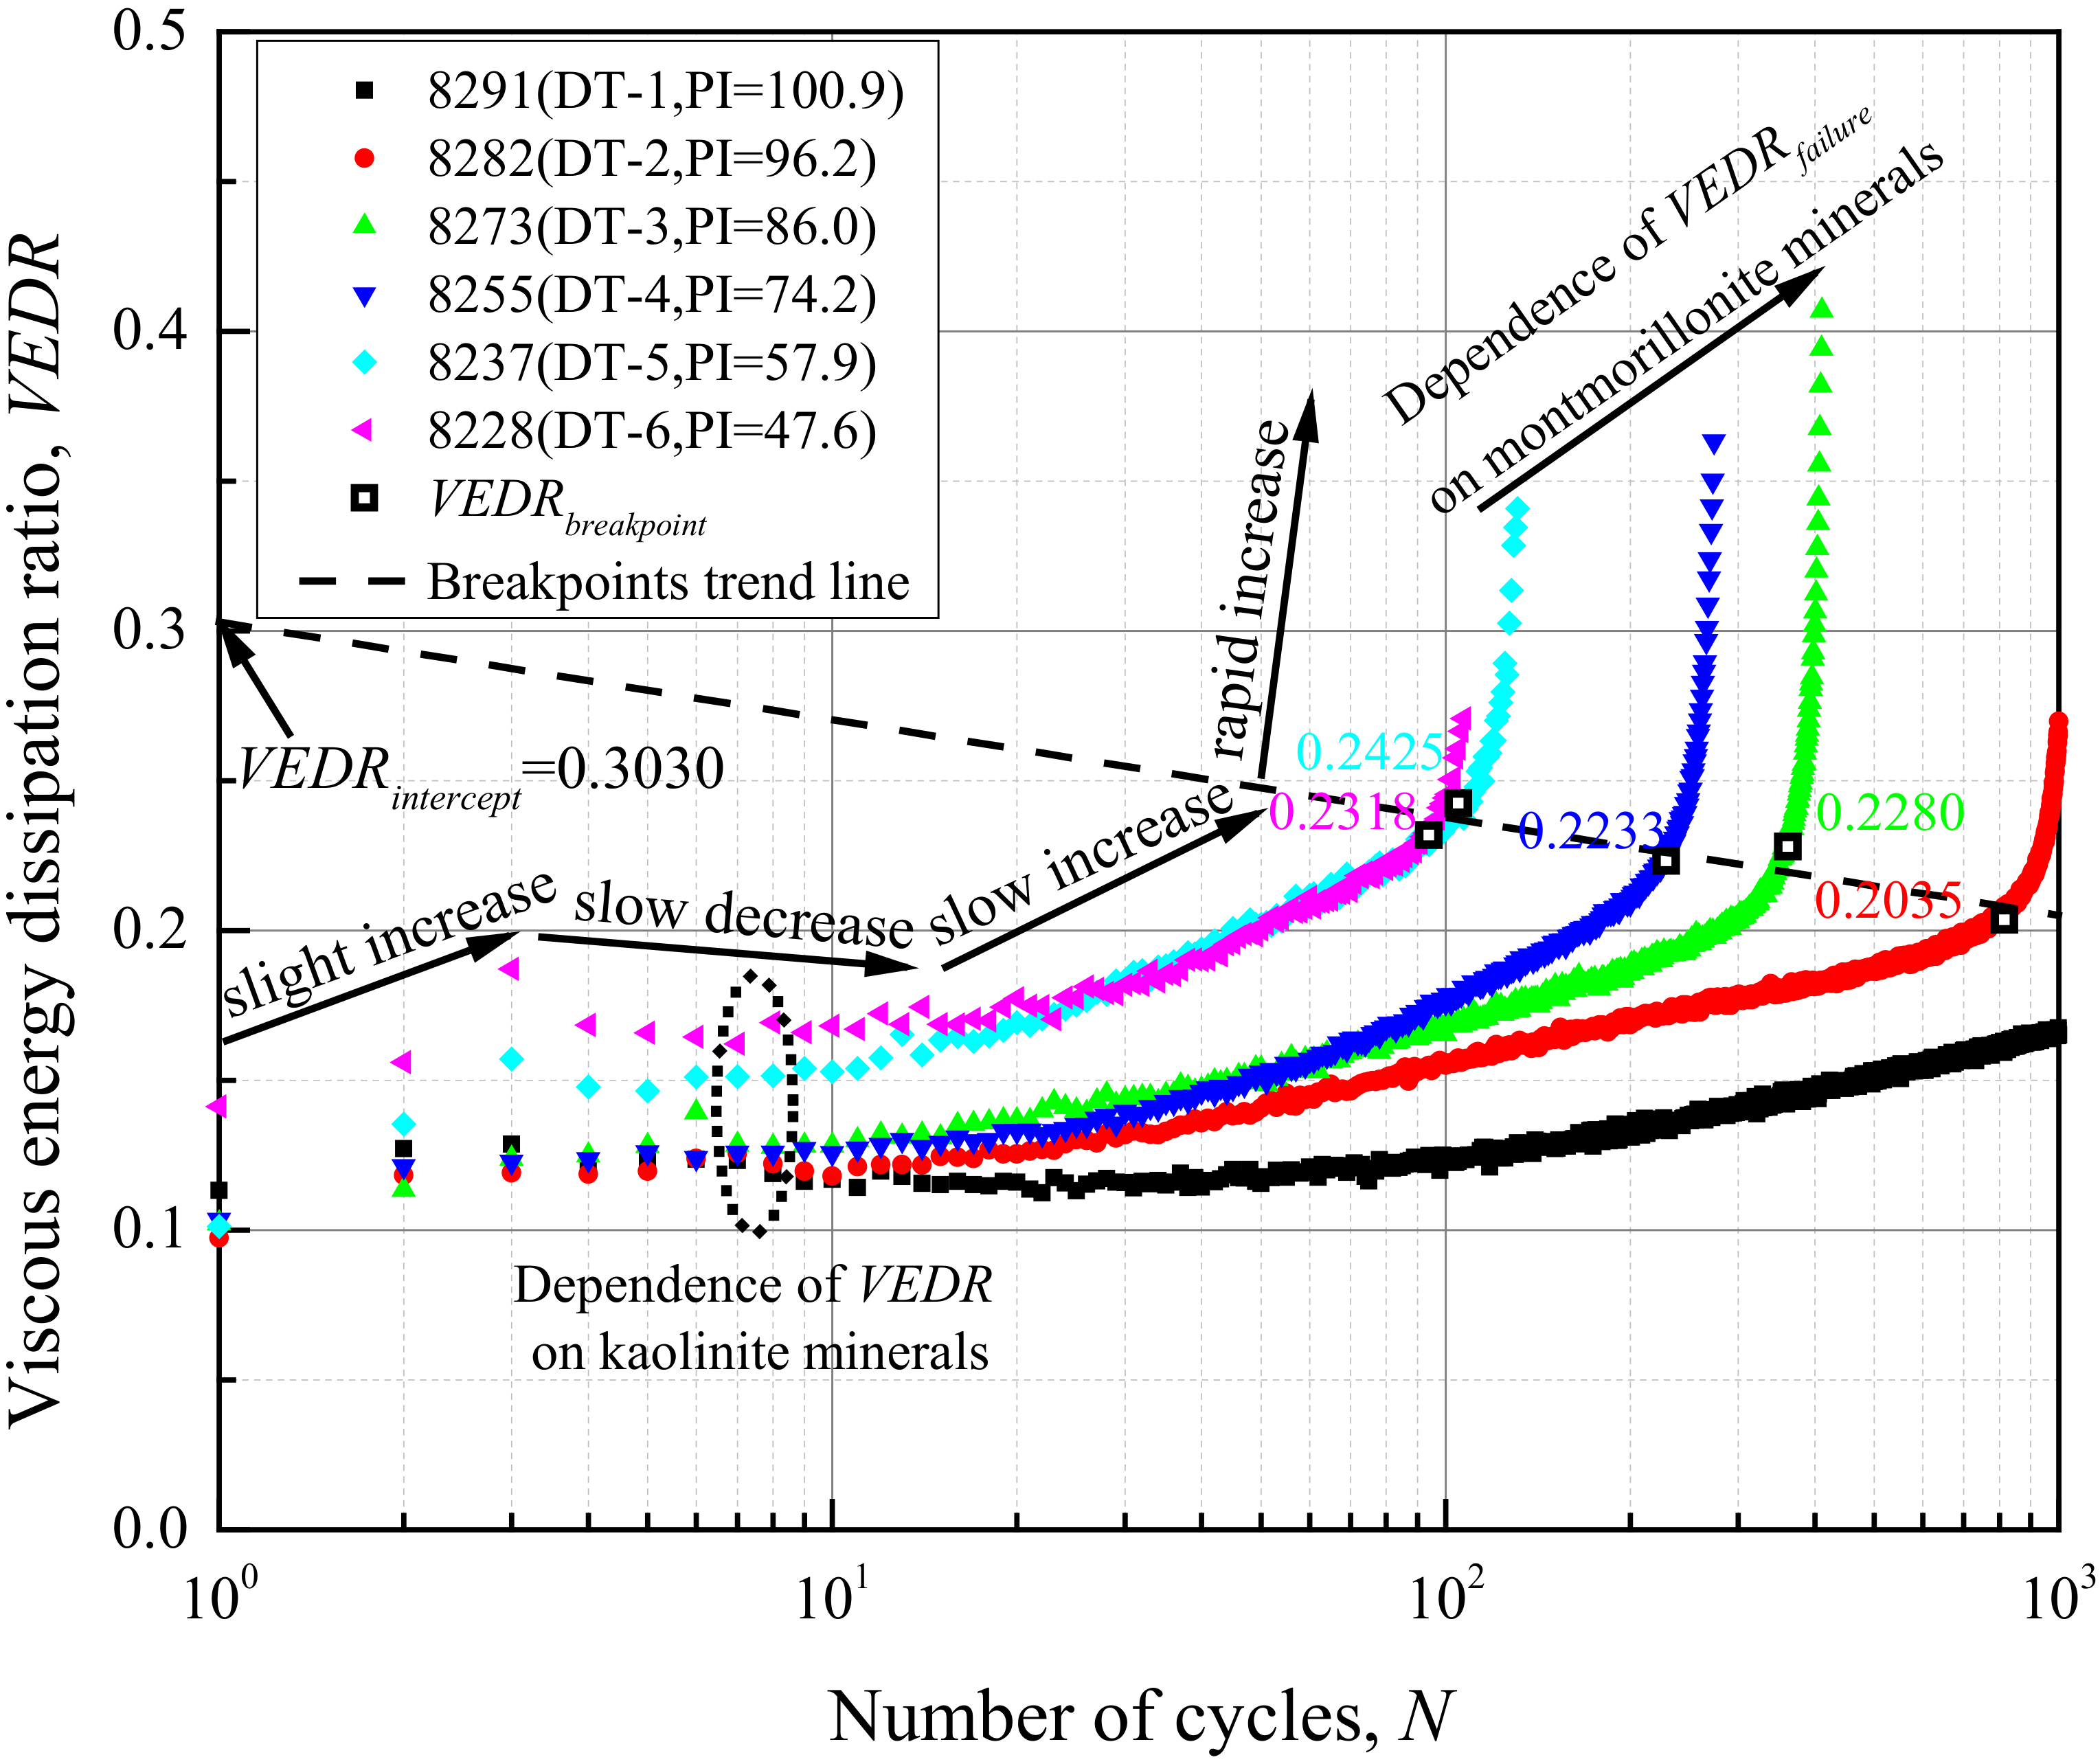
3.2.2. Viscous Energy Dissipation
4. Microstructure and Fabric
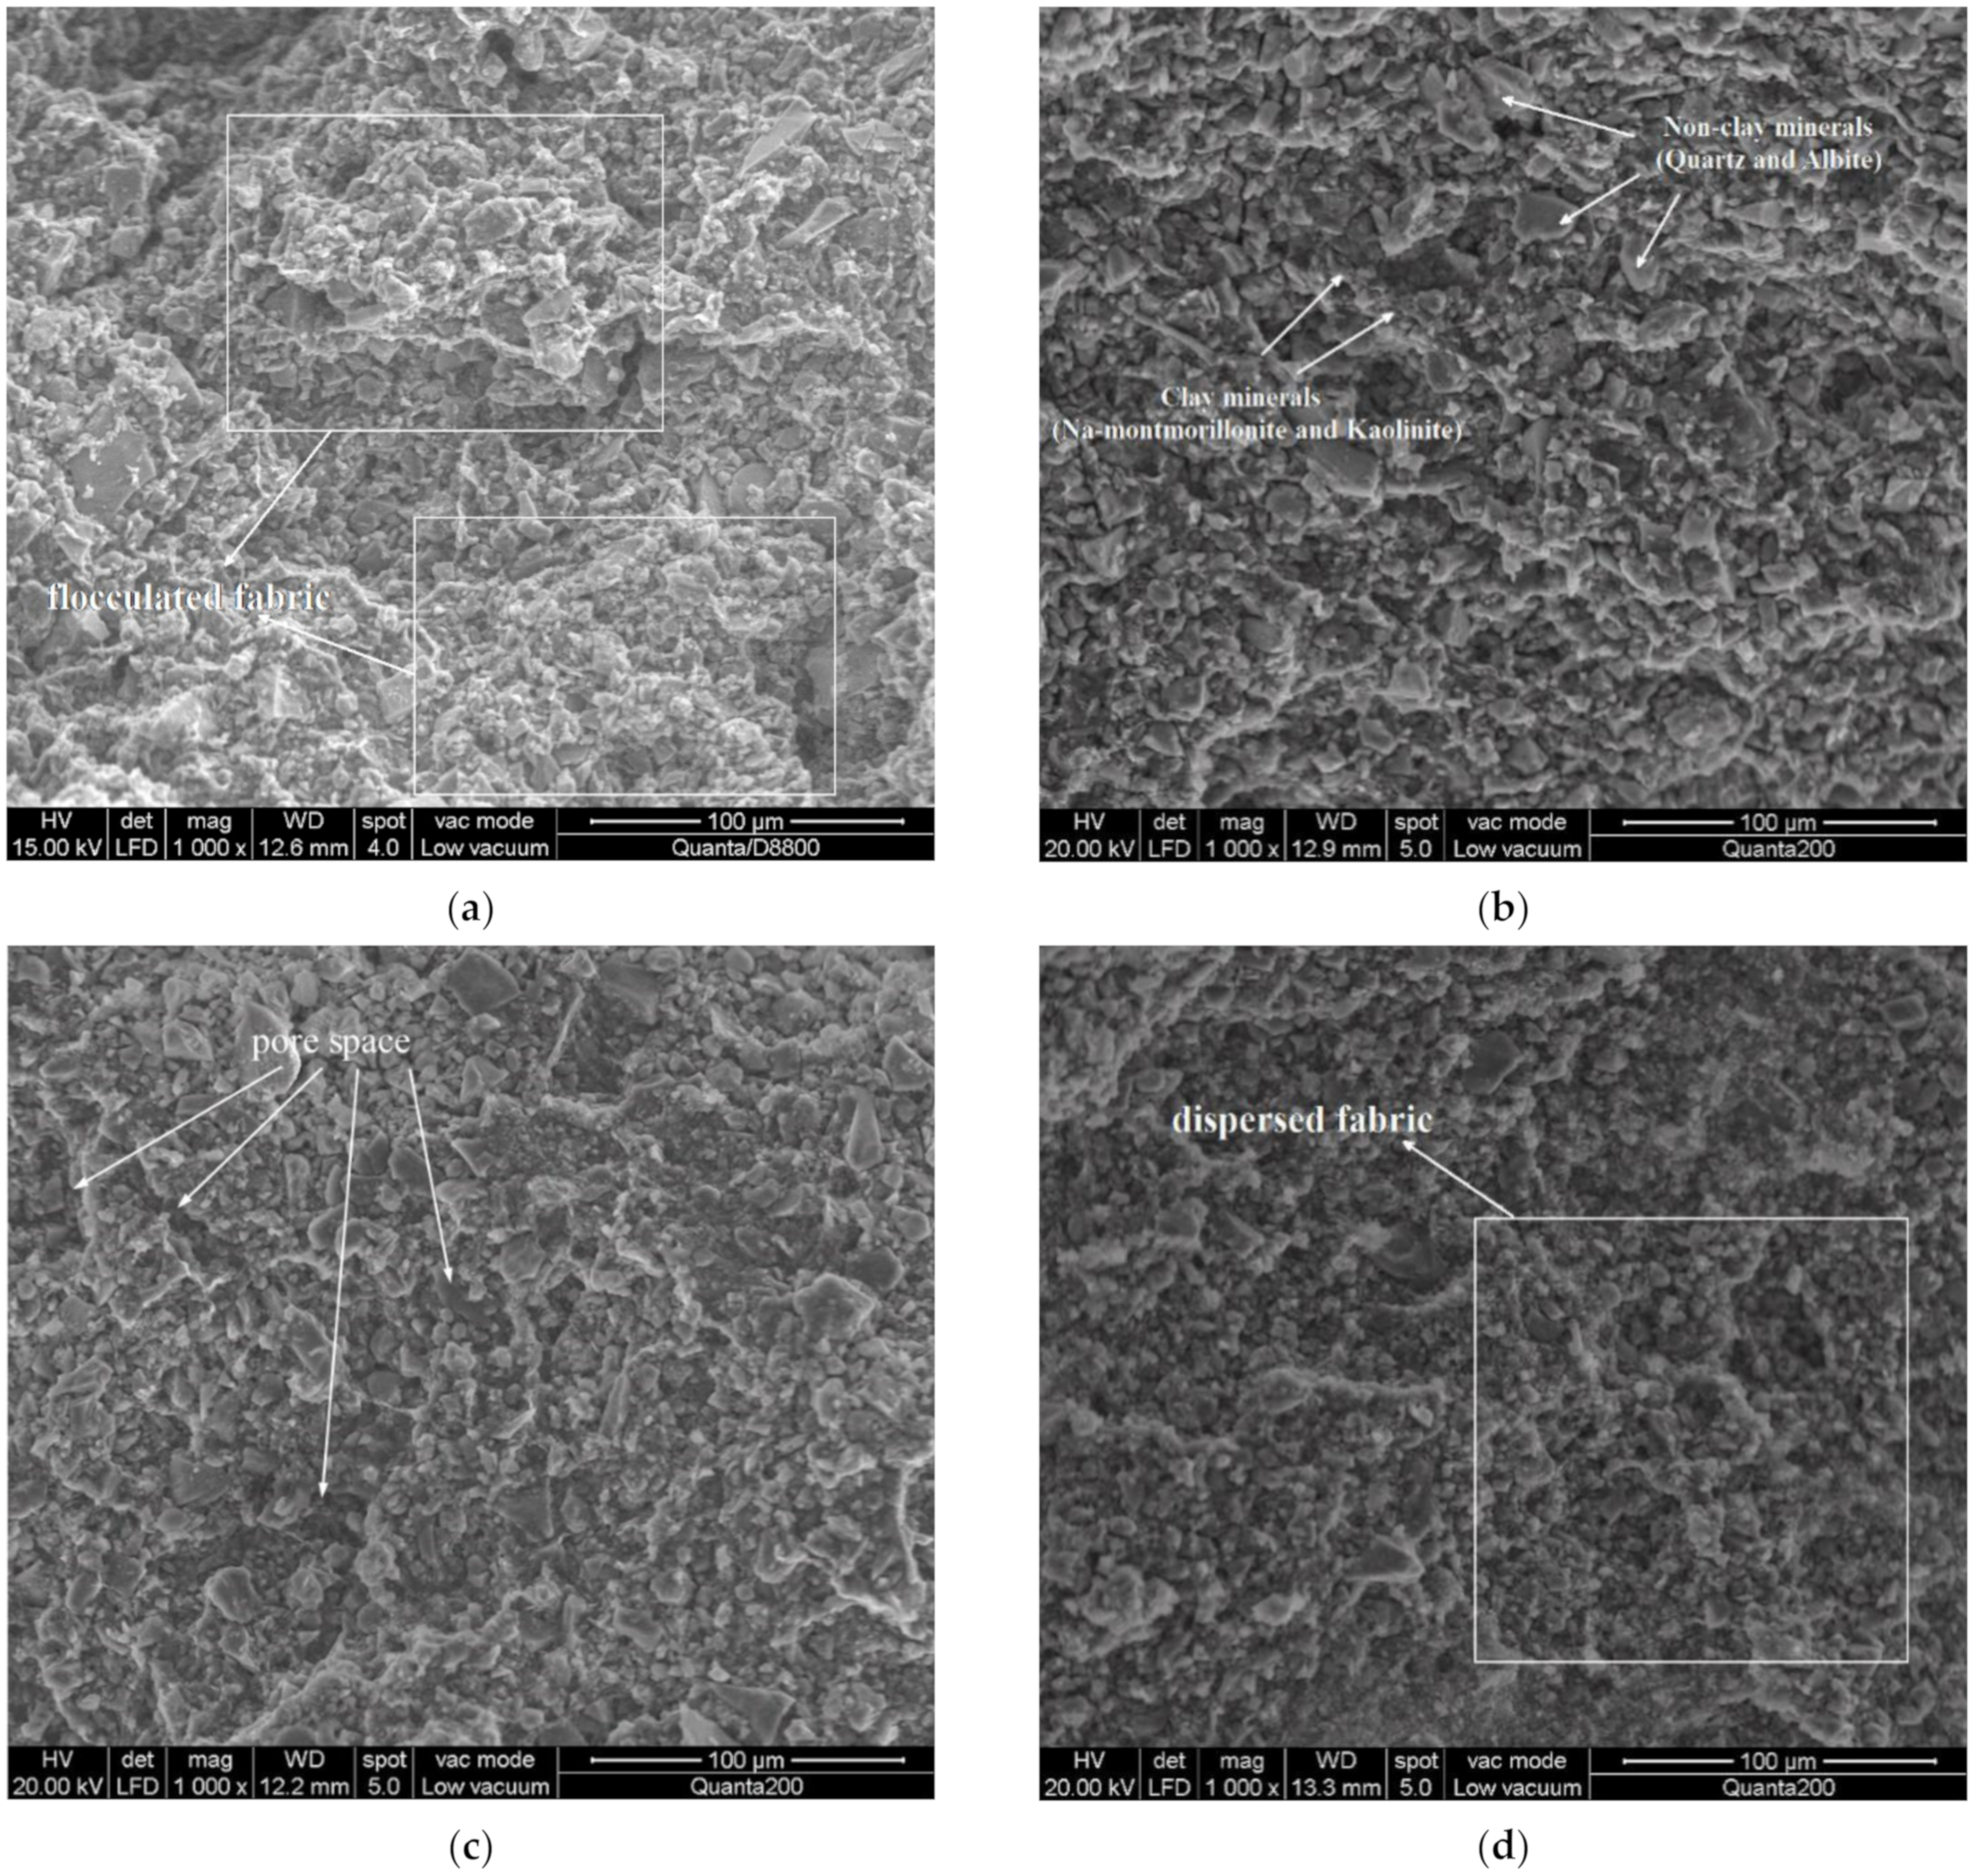
4.1. LVESEM Analysis
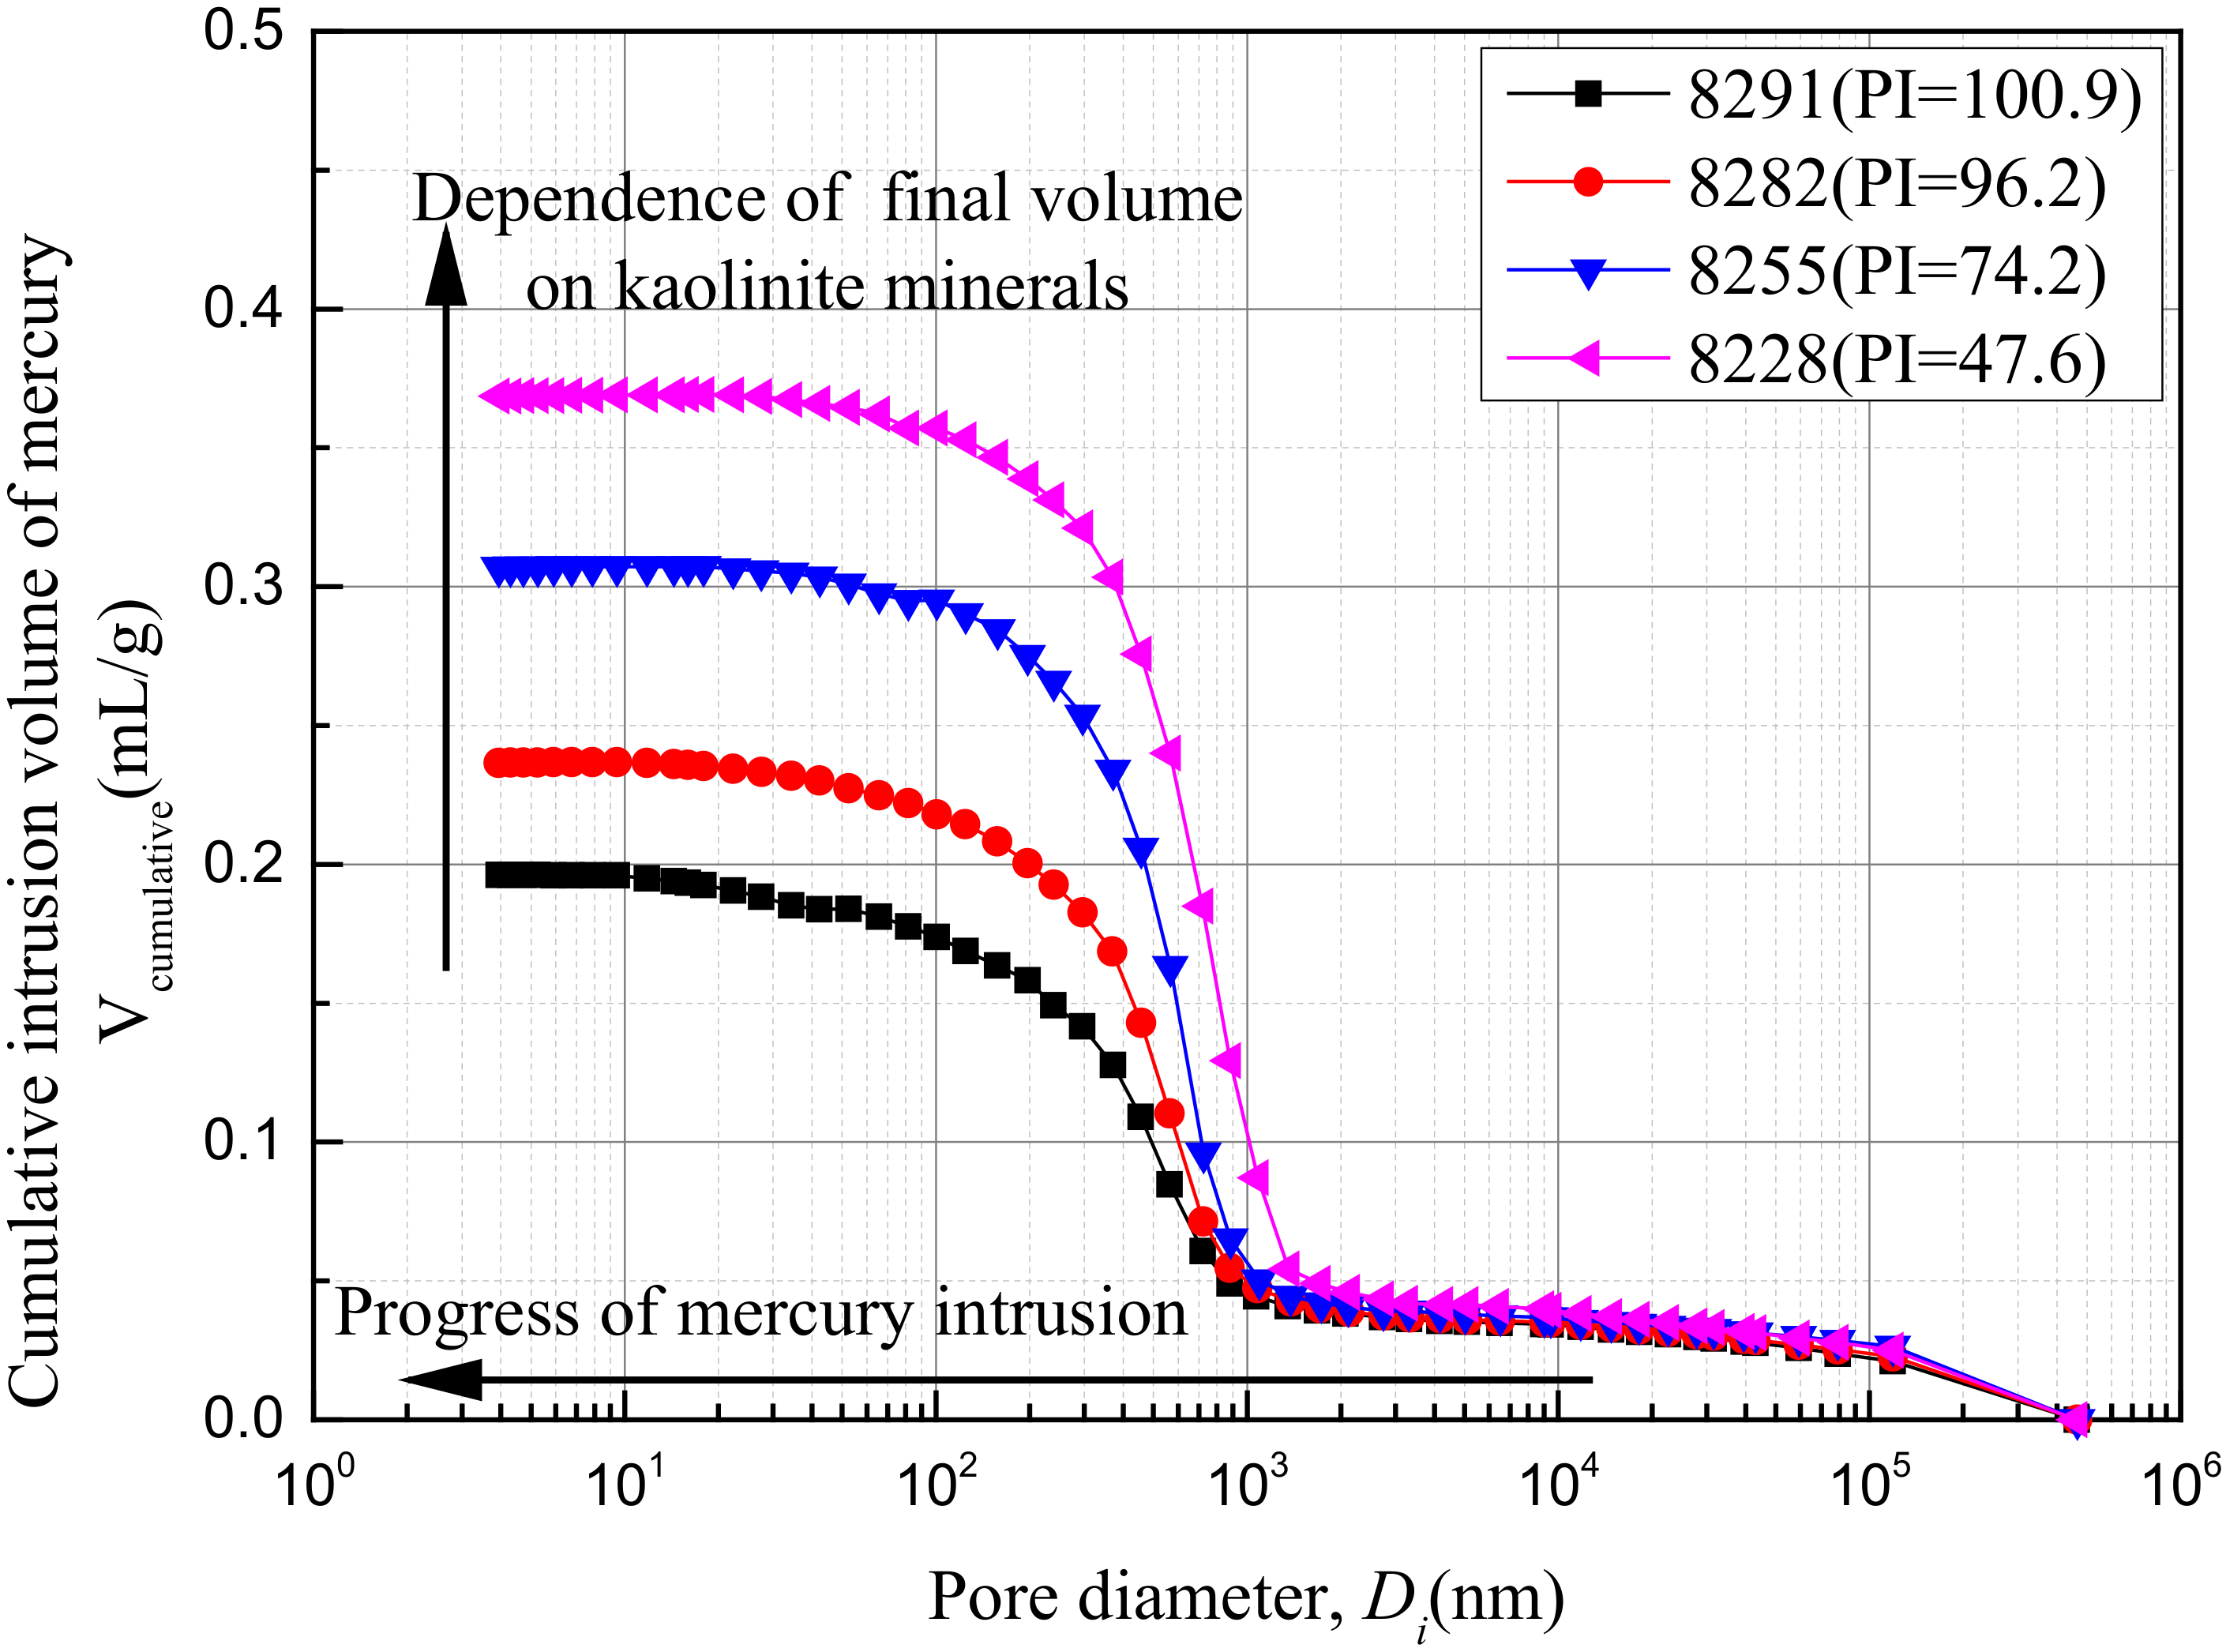
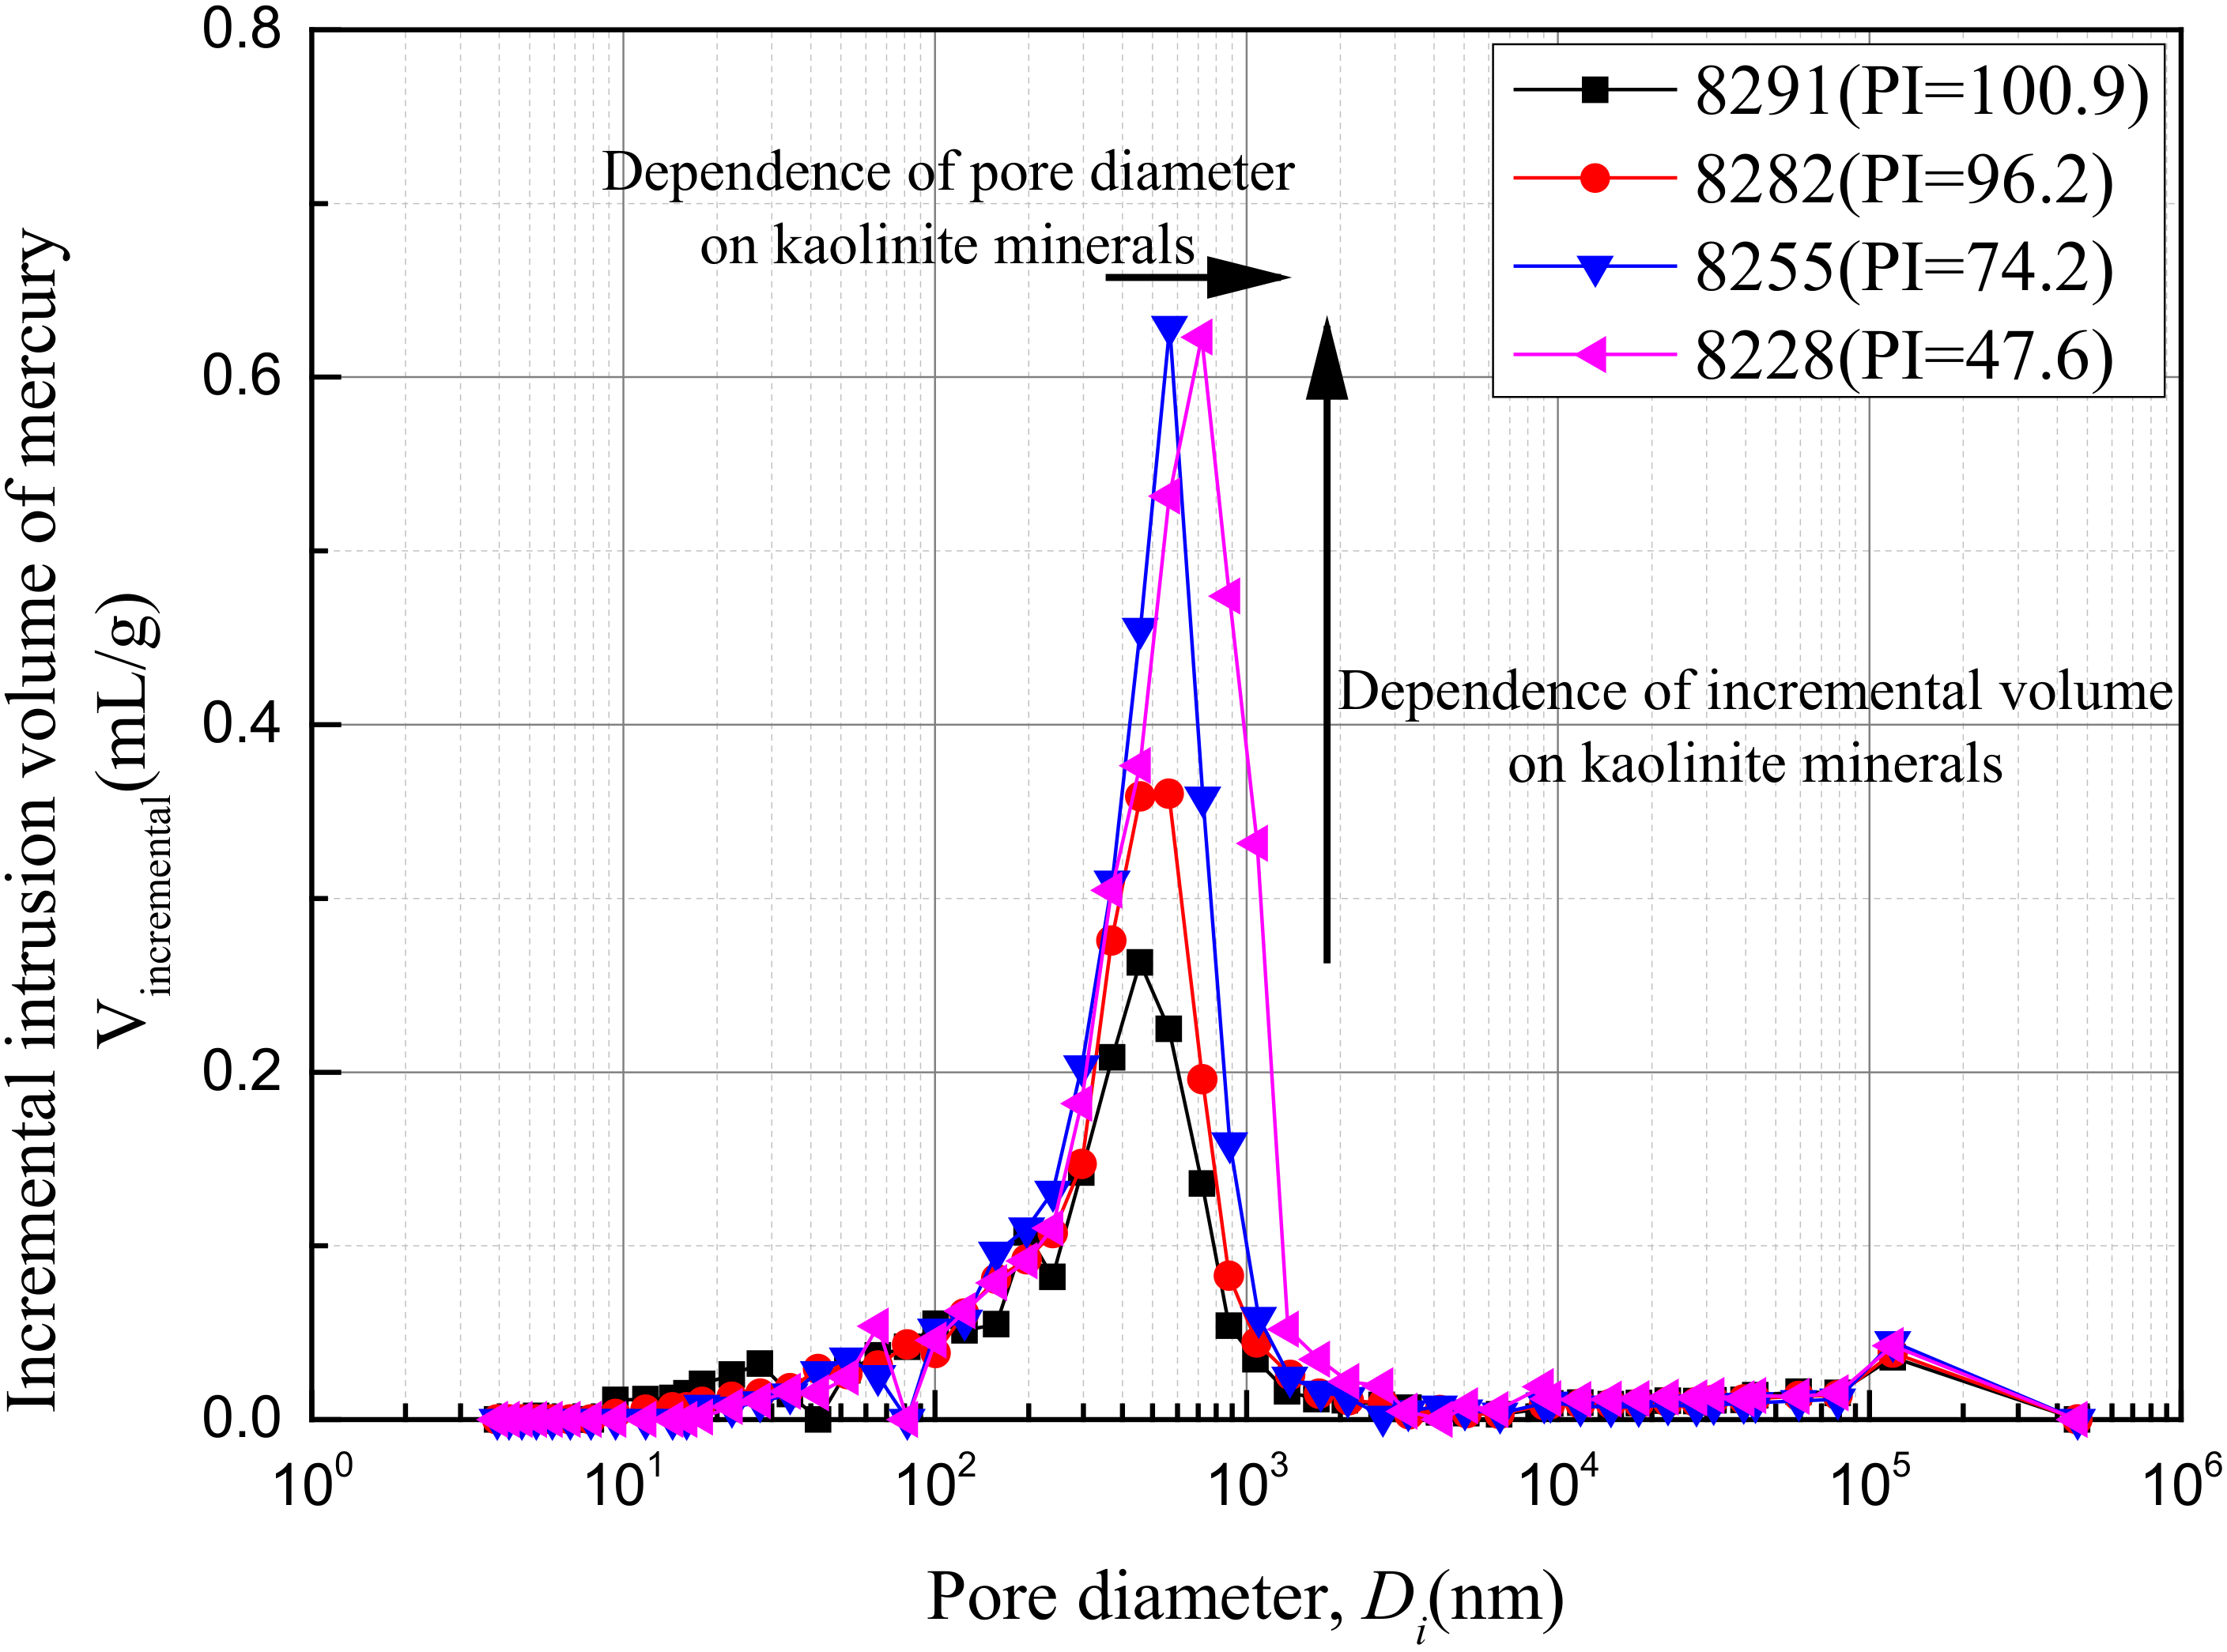
4.2. MIP Analysis
5. Conclusions
Author Contributions
Funding
Institutional Review Board Statement
Informed Consent Statement
Data Availability Statement
Acknowledgments
Conflicts of Interest
References
- Hanna, A.M.; Javed, K. Design of foundations on sensitive Champlain clay subjected to cyclic loading. J. Geotech. Geoenviron. 2008, 134, 929–937. [Google Scholar] [CrossRef]
- Mortezaie, A.R.; Vucetic, M. Effect of Frequency and Vertical Stress on Cyclic Degradation and Pore Water Pressure in Clay in the NGI Simple Shear Device. J. Geotech. Geoenviron. 2013, 139, 1727–1737. [Google Scholar] [CrossRef] [Green Version]
- Zapata-Medina, D.G.; Finno, R.J.; Vega-Posada, C.A. Stress history and sampling disturbance effects on monotonic and cyclic responses of overconsolidated Bootlegger Cove clays. Can. Geotech. J. 2014, 51, 599–609. [Google Scholar] [CrossRef]
- Mortezaie, A.R.; Vucetic, M. Threshold Shear Strains for Cyclic Degradation and Cyclic Pore Water Pressure Generation in Two Clays. J. Geotech. Geoenviron. 2016, 142, 04016007. [Google Scholar] [CrossRef] [Green Version]
- Hu, X.Q.; Zhang, Y.; Guo, L.; Wang, J.; Cai, Y.Q.; Fu, H.T.; Cai, Y. Cyclic behavior of saturated soft clay under stress path with bidirectional shear stresses. Soil Dyn. Earthq. Eng. 2018, 104, 319–328. [Google Scholar] [CrossRef]
- Tang, L.S.; Chen, H.K.; Sang, H.T.; Zhang, S.Y.; Zhang, J.Y. Determination of traffic-load-influenced depths in clayey subsoil based on the shakedown concept. Soil Dyn. Earthq. Eng. 2015, 77, 182–191. [Google Scholar] [CrossRef]
- Cai, Y.; Guo, L.; Jardine, R.J.; Yang, Z.; Wang, J. Stress–strain response of soft clay to traffic loading. Géotechnique. 2017, 67, 446–451. [Google Scholar] [CrossRef]
- Guo, L.; Cai, Y.Q.; Jardine, R.J.; Yang, Z.X.; Wang, J. Undrained behaviour of intact soft clay under cyclic paths that match vehicle loading conditions. Can. Geotech. J. 2018, 55, 90–106. [Google Scholar] [CrossRef] [Green Version]
- Li, L.L.; Dan, H.B.; Wang, L.Z. Undrained behavior of natural marine clay under cyclic loading. Ocean Eng. 2011, 38, 1792–1805. [Google Scholar] [CrossRef]
- Wang, Y.K.; Gao, Y.F.; Guo, L.; Cai, Y.Q.; Li, B.; Qiu, Y.; Mahfouz, A.H. Cyclic response of natural soft marine clay under principal stress rotation as induced by wave loads. Ocean Eng. 2017, 129, 191–202. [Google Scholar] [CrossRef]
- Ren, X.W.; Xu, Q.; Teng, J.D.; Zhao, N.; Lv, L. A novel model for the cumulative plastic strain of soft marine clay under long-term low cyclic loads. Ocean Eng. 2018, 149, 194–204. [Google Scholar] [CrossRef]
- Stark, T.D.; Contreras, I.A. Fourth Avenue landslide during 1964 Alaskan earthquake. J. Geotech. Geoenviron. 1998, 124, 99–109. [Google Scholar] [CrossRef]
- Mendoza, M.; Auvinet, G. The Mexico earthquake of September 19, 1985—behavior of building foundations in Mexico City. Earthq. Spectra 1988, 4, 835–853. [Google Scholar] [CrossRef]
- Ye, J.H.; Wang, G. Numerical simulation of the seismic liquefaction mechanism in an offshore loosely deposited seabed. Bull. Eng. Geol. Environ. 2016, 75, 1183–1197. [Google Scholar] [CrossRef]
- Tavanaei, F.; Hassanpour, J.; Memarian, H. The behavior and properties of Tehran alluvial soils under cyclic loading of urban vibrations—a case study: Arash-Esfandiar tunnel. Bull. Eng. Geol. Environ. 2020, 79, 4245–4263. [Google Scholar] [CrossRef]
- Bjørlykke, K.; Bue, B.; Elverhøt, A. Quaternary sediments in the northwestern part of the Barents Sea and their relation to the underlying Mesozoic bedrock. Sedimentology 1978, 25, 227–246. [Google Scholar] [CrossRef]
- Jeong, G.Y.; Yoon, H.I. The origin of clay minerals in soils of King George Island, South Shetland Islands, West Antarctica, and its implications for the clay-mineral compositions of marine sediments. J. Sediment. Res. 2001, 71, 833–842. [Google Scholar] [CrossRef]
- Jeong, G.Y.; Cheong, C.S. Recurrent events on a Quaternary fault recorded in the mineralogy and micromorphology of a weathering profile, Yangsan Fault System, Korea. Quat. Res. 2005, 64, 221–233. [Google Scholar] [CrossRef]
- Clayton, T.; Pearce, R.B.; Peterson, L.C. Indirect climatic control of the clay mineral composition of Quaternary sediments from the Cariaco basin, northern Venezuela (ODP Site 1002). Mar. Geol. 1999, 161, 191–206. [Google Scholar] [CrossRef]
- Pal, D.; Bhattacharyya, T.; Sinha, R.; Srivastava, P.; Dasgupta, A.; Chandran, P.; Ray, S.; Nimje, A. Clay minerals record from Late Quaternary drill cores of the Ganga Plains and their implications for provenance and climate change in the Himalayan Foreland. Palaeogeogr. Palaeocl. 2012, 356, 27–37. [Google Scholar] [CrossRef]
- Thiry, M. Palaeoclimatic interpretation of clay minerals in marine deposits: An outlook from the continental origin. Earth-Sci. Rev. 2000, 49, 201–221. [Google Scholar] [CrossRef]
- Jennings, A. The Quaternary history of Cumberland Sound, southeastern Baffin Island: The marine evidence. Géogr. Phys. Quat. 1993, 47, 21–42. [Google Scholar] [CrossRef] [Green Version]
- Sivan, D.; Gvirtzman, G.; Sass, E. Quaternary stratigraphy and paleogeography of the Galilee coastal plain, Israel. Quat. Res. 1999, 51, 280–294. [Google Scholar] [CrossRef]
- Sinsakul, S. Late quaternary geology of the Lower Central Plain, Thailand. J. Asian Earth Sci. 2000, 18, 415–426. [Google Scholar] [CrossRef]
- Hardin, B.O.; Drnevich, V.P. Shear modulus and damping in soils: Measurement and parameter effects. J. Geotech. Geoenviron. 1972, 98, 667–692. [Google Scholar]
- Dobry, R.; Vucetic, M. Dynamic properties and seismic response of soft clay deposits. In Proceedings of the International Symposium on Geotechnical Engineering of Soft Soils, Mexico City, Mexico, 13–14 August 1987; pp. 51–86. [Google Scholar]
- Geotechnical Investigation and Testing-Laboratory Testing of Soil–Part 12: Determination of Liquid and Plastic Limits; European Committee for Standardization: Brussels, Belgium, EN ISO 17892-12:2018; CEE-CENELEC Management Centre: Brussels, Belgium, 2018.
- Kokusho, T.; Yoshida, Y.; Esashi, Y. Dynamic properties of soft clay for wide strain range. Soils Found. 1982, 22, 1–18. [Google Scholar] [CrossRef] [Green Version]
- Marcuson, W.F.; Wahls, H.E. Time effects on dynamic shear modulus of clays. J. Soil Mech. Found. Div. 1972, 98, 1359–1373. [Google Scholar] [CrossRef]
- Fahoum, K.; Aggour, M.; Amini, F. Dynamic properties of cohesive soils treated with lime. J. Geotech. Geoenviron. 1996, 122, 382–389. [Google Scholar] [CrossRef]
- Park, S.S.; Kim, Y.S. Liquefaction Resistance of Sands Containing Plastic Fines with Different Plasticity. J. Geotech. Geoenviron. 2013, 139, 825–830. [Google Scholar] [CrossRef]
- Gratchev, I.B.; Sassa, K.; Osipov, V.I.; Sokolov, V.N. The liquefaction of clayey soils under cyclic loading. Eng. Geol. 2006, 86, 70–84. [Google Scholar] [CrossRef]
- Beroya, M.; Aydin, A.; Katzenbach, R. Insight into the effects of clay mineralogy on the cyclic behavior of silt–clay mixtures. Eng. Geol. 2009, 106, 154–162. [Google Scholar] [CrossRef]
- Wang, S.Y.; Luna, R.; Yang, J.S. Reexamination of effect of plasticity on liquefaction resistance of low-plasticity fine-grained soils and its potential application. Acta Geotech. 2016, 11, 1209–1216. [Google Scholar] [CrossRef]
- Ajmera, B.; Brandon, T.; Tiwari, B. Characterization of the Reduction in Undrained Shear Strength in Fine-Grained Soils due to Cyclic Loading. J. Geotech. Geoenviron. 2019, 145, 04019017. [Google Scholar] [CrossRef]
- Ajmera, B.; Brandon, T.; Tiwari, B. Influence of index properties on shape of cyclic strength curve for clay-silt mixtures. Soil Dyn. Earthq. Eng. 2017, 102, 46–55. [Google Scholar] [CrossRef]
- Boulanger, R.W.; Idriss, I.M. Liquefaction susceptibility criteria for silts and clays. J. Geotech. Geoenviron. 2006, 132, 1413–1426. [Google Scholar] [CrossRef]
- Boulanger, R.W.; Idriss, I.M. Evaluation of cyclic softening in silts and clays. J. Geotech. Geoenviron. 2007, 133, 641–652. [Google Scholar] [CrossRef]
- Mitchell, J.K.; Soga, K. Fundamentals of Soil Behavior; John Wiley & Sons: New York, NY, USA, 2005; Volume 3. [Google Scholar]
- Shan, Y. Mineral Composition Based Experimental Study of Dynamic Behaviors of Quaternary Marine Fine-Grained Soil in the Typical Estuary Deltas of Guangdong. Ph.D. Thesis, South China University of Technology, Guangzhou, China, 2018. [Google Scholar]
- Shan, Y.; Chen, J.; Ke, X.; Mo, H. Resonant Column Test Study of the Effect of Clay Minerals on Maximum Dynamic Shear Modulus in Marine Clay. In Proceedings of the 7th International Conference on Earthquake Geotechnical Engineering, Rome, Italy, 17–20 June 2019; pp. 17–20. [Google Scholar]
- Huang, Y.; Zhao, L.Y. The effects of small particles on soil seismic liquefaction resistance: Current findings and future challenges. Nat. Hazards 2018, 92, 567–579. [Google Scholar] [CrossRef]
- Feng, D.L.; Fang, Y.G. Theoretical Analysis and Experimental Research on Multiscale Mechanical Properties of Soil. Int. J. Geomech. 2016, 16, 04015094. [Google Scholar] [CrossRef]
- Gumaste, S.D.; Iyer, K.R.; Sharma, S.; Channabasavaraj, W.; Singh, D.N. Simulation of fabric in sedimented clays. Appl. Clay Sci. 2014, 91–92, 117–126. [Google Scholar] [CrossRef]
- Anderson, D.; Stokoe, K. Shear modulus: A time-dependent soil property. In Dynamic Geotechnical Testing; ASTM International: West Conshohocken, PA, USA, 1978. [Google Scholar] [CrossRef]
- Jiang, M.J.; Zhang, F.G.; Hu, H.J.; Cui, Y.J.; Peng, J.B. Structural characterization of natural loess and remolded loess under triaxial tests. Eng. Geol. 2014, 181, 249–260. [Google Scholar] [CrossRef]
- Chen, R.F.; Cai, G.; Congress, S.S.C.; Dong, X.; Duan, W. Dynamic properties and environmental impact of waste red mud-treated loess under adverse conditions. Bull. Eng. Geol. Environ. 2021, 80, 93–113. [Google Scholar] [CrossRef]
- Sun, H.; Hou, M.X.; Chen, C.; Ge, X.R. Microstructure investigation of soft clay subjected to triaxial loading. Eng. Geol. 2020, 274, 105735. [Google Scholar] [CrossRef]
- Cuisinier, O.; Deneele, D.; Masrouri, F. Shear strength behaviour of compacted clayey soils percolated with an alkaline solution. Eng. Geol. 2009, 108, 177–188. [Google Scholar] [CrossRef]
- Xiong, H.X.; Zong, Y.Q.; Qian, P.; Huang, G.Q.; Fu, S.Q. Holocene sea-level history of the northern coast of South China Sea. Quat. Sci. Rev. 2018, 194, 12–26. [Google Scholar] [CrossRef]
- Huang, Z.; Li, P.; Zhang, Z.; Li, K.; Peng, Q. Formation, Development and Evolution of the Pearl River Delta; The Guangzhou Branch of Popular Science Press: Guangzhou, China, 1982. [Google Scholar]
- Li, P.; Huang, Z.; Zong, Y. The Han River Delta; Chinese Ocean Press: Guangzhou, China, 1987. [Google Scholar]
- Wang, J. Macroscopic and Microscopic Experimental Study on Consolidation Properties of Zhuhai Soft Soil with Mechanism Analysis. Ph.D. Thesis, South China University of Technology, Guangzhou, China, 2013. [Google Scholar]
- Yu, S. Study of the Clay Mineral Effects on Small-Strain Dynamic Properties of Remolded Saturated Clay Soils. Master’s Thesis, Shantou University, Shantou, China, 2015. [Google Scholar]
- Grim, R.E. Clay Mineralogy; McGraw-Hill: New York, NY, USA, 1968. [Google Scholar]
- Liu, Z.F.; Colin, C.; Huang, W.; Chen, Z.; Trentesaux, A.; Chen, J.F. Clay minerals in surface sediments of the Pearl River drainage basin and their contribution to the South China Sea. Chin. Sci. Bull. 2007, 52, 1101–1111. [Google Scholar] [CrossRef]
- Carter, D.; Heilman, M.; Gonzales, C. Ethylene glycol monoethyl ether for determining surface area of silicate minerals. Soil Sci. 1965, 100, 356–360. [Google Scholar] [CrossRef] [Green Version]
- Chung, F.H. Quantitative interpretation of X-ray diffraction patterns of mixtures. II. Adiabatic principle of X-ray diffraction analysis of mixtures. J. Appl. Crystallogr. 1974, 7, 519–525. [Google Scholar] [CrossRef]
- Leonards, G.A. Engineering Properties of Soils, Foundation Engineering; McGraw-Hill Book Co.: New York, NY, USA, 1962; pp. 66–240. [Google Scholar]
- Seed, H.B.; Woodward, R.J., Jr.; Lundgren, R. Clay mineralogical aspects of the Atterberg limits. J. Soil Mech. Found. Div. 1964, 90, 107–131. [Google Scholar] [CrossRef]
- Shan, Y.; Meng, Q.L.; Yu, S.M.; Mo, H.H.; Li, Y.D. Energy based cyclic strength for the influence of mineral composition on artificial marine clay. Eng. Geol. 2020, 274, 105713. [Google Scholar] [CrossRef]
- ASTM Standard D2487-17e1. Standard Practice for Classification of Soils for Engineering Purposes (Unified Soil Clas-Sification System); ASTM International: West Conshohocken, PA, USA, 2017. [Google Scholar] [CrossRef]
- Zhou, J.; Gong, X.N. Strain degradation of saturated clay under cyclic loading. Can. Geotech. J. 2001, 38, 208–212. [Google Scholar] [CrossRef]
- Wichtmann, T.; Andersen, K.H.; Sjursen, M.A.; Berre, T. Cyclic tests on high-quality undisturbed block samples of soft marine Norwegian clay. Can. Geotech. J. 2013, 50, 400–412. [Google Scholar] [CrossRef]
- Yang, Q.; Ren, Y.B.; Niu, J.L.; Cheng, K.; Hu, Y.X.; Wang, Y. Characteristics of soft marine clay under cyclic loading: A review. Bull. Eng. Geol. Environ. 2018, 77, 1027–1046. [Google Scholar] [CrossRef]
- Vucetic, M.; Dobry, R. Effect of soil plasticity on cyclic response. J. Geotech. Eng. 1991, 117, 89–107. [Google Scholar] [CrossRef]
- Martin, P.P.; Seed, H.B. One-dimensional dynamic ground response analyses. J. Geotech. Eng. 1982, 108, 935–952. [Google Scholar] [CrossRef]
- Nemat-Nasser, S.; Shokooh, A. A unified approach to densification and liquefaction of cohesionless sand in cyclic shearing. Can. Geotech. J. 1979, 16, 659–678. [Google Scholar] [CrossRef]
- Green, R.; Mitchell, J.; Polito, C. An energy-based excess pore pressure generation model for cohesionless soils. In Proceedings of the John Booker Memorial Symposium, Sidney, NSW, Australia, 16–17 November 2000; AA Balkema Publishers: Rotterdam, The Netherlands, 2000. [Google Scholar]
- Javdanian, H. Evaluation of soil liquefaction potential using energy approach: Experimental and statistical investigation. Bull. Eng. Geol. Environ. 2019, 78, 1697–1708. [Google Scholar] [CrossRef]
- Ke, X.Q.; Chen, J.S.; Shan, Y. A new failure criterion for determining the cyclic resistance of low-plasticity fine-grained tailings. Eng. Geol. 2019, 261, 105273. [Google Scholar] [CrossRef]
- Ke, X.; Chen, J.; Pan, W.; Shan, Y. An energy-based process evaluation for low-plasticity fine-grained soil during cyclic loading. In Proceedings of the Geo-Congress 2020: Geotechnical Earthquake Engineering and Special Topics, Minneapolis, MN, USA, 25–28 February 2020; pp. 79–86. [Google Scholar]
- Shan, Y.; Ke, X.Q. Reexamination of collapse failure of fine-grained soils and characteristics of related soil indexes. Environ. Earth Sci. 2021, 80, 402. [Google Scholar] [CrossRef]
- Romero, E.; Gens, A.; Lloret, A. Water permeability, water retention and microstructure of unsaturated compacted Boom clay. Eng. Geol. 1999, 54, 117–127. [Google Scholar] [CrossRef]
- Welton, J.E. SEM Petrology Atlas; The American Association of Petroleum Geologists: Tulsa, OK, USA, 2003. [Google Scholar]
- Chen, H.; Jiang, Y.L.; Niu, C.C.; Leng, G.J.; Tian, G.L. Dynamic characteristics of saturated loess under different confining pressures: A microscopic analysis. Bull. Eng. Geol. Environ. 2019, 78, 931–944. [Google Scholar] [CrossRef]
- Liu, C.; Shi, B.; Zhou, J.; Tang, C.S. Quantification and characterization of microporosity by image processing, geometric measurement and statistical methods: Application on SEM images of clay materials. Appl. Clay Sci. 2011, 54, 97–106. [Google Scholar] [CrossRef]
- Pillai, R.J.; Robinson, R.G.; Boominathan, A. Effect of Microfabric on Undrained Static and Cyclic Behavior of Kaolin Clay. J. Geotech. Geoenviron. 2011, 137, 421–429. [Google Scholar] [CrossRef]
- Hardin, B.O.; Black, W.L.; Division, F. Vibration modulus of normally consolidated clay. J. Soil Mech. Found. Div. 1968, 94, 353–369. [Google Scholar] [CrossRef]
- Thevanayagam, S.; Kanagalingam, T.; Shenthan, T. Intergrain friction, contact density, and cyclic resistance of sands. In Proceedings of the Pacific Conference on Earthquake Engineering, Christchurch, New Zealand, 13–15 February 2003. [Google Scholar]
- Washburn, E.W. The dynamics of capillary flow. Phys. Rev. 1921, 17, 273. [Google Scholar] [CrossRef]
- Diamond, S.J.C. Pore size distributions in clays. Clays Clay Miner. 1970, 18, 7–23. [Google Scholar] [CrossRef]
- Garcia-Bengochea, I.; Altschaeffl, A.G.; Lovell, C.W. Pore distribution and permeability of silty clays. J. Soil Mech. Found. Div. 1979, 105, 839–856. [Google Scholar]
- Delage, P.; Lefebvre, G. Study of the structure of a sensitive Champlain clay and of its evolution during consolidation. Can. Geotech. J. 1984, 21, 21–35. [Google Scholar] [CrossRef]
- Kagawa, T. Moduli and damping factors of soft marine clays. J. Geotech. Eng. 1992, 118, 1360–1375. [Google Scholar] [CrossRef]


| Sample Name 1 | Specific Gravity | Natural Void Ratio | Plastic Limit PL (%) | Liquid Limit LL (%) | Plasticity Index PI (%) | Indexes of Unconsolidated Direct Shear | |
|---|---|---|---|---|---|---|---|
| c (kPa) | |||||||
| HR-JP | 2.67 | 1.771 | 21.0 | 54.3 | 33.3 | 11.1 | 5.3 |
| PR-HX | 2.73 | 1.584 | 29.6 | 54.8 | 25.2 | 12.4 | 2.3 |
| PR-WQS | 2.77 | 1.612 | 24.4 | 45.4 | 21.0 | 4.5 | 3.8 |
| Sample Name | Depth (m) | Quartz (%) | Albite (%) | Montmorillonite (%) | Kaolinite (%) | Illite (%) | Chlorite (%) | Calcite (%) | Pyrite (%) | Geological Age |
|---|---|---|---|---|---|---|---|---|---|---|
| HR-JP | 8.2~8.7 | 20.1 | 11.5 | - | 20.8 | 23.9 | 23.7 | - | - | Sub-Atlantic period () |
| PR-HX | 22.1~22.5 | 24.8 | - | - | 23.3 | 23.4 | 26.3 | - | 2.2 | Atlantic period () |
| PR-WQS | 7.8~8.3 | 34.1 | - | - | 19.3 | 17.5 | 24.1 | 5.0 | - | Sub-Atlantic period () |
| Sampling Location | Sample Name | Depth (m) | Quartz (%) | Albite (%) | Montmorillonite (%) | Kaolinite (%) | Illite (%) | Halite (%) | Calcite (%) | Pyrite (%) | Other Minerals (%) | Geological Age |
|---|---|---|---|---|---|---|---|---|---|---|---|---|
| Pearl River Delta | PR-JW (1-1) | 3.0 | 41.2 | 7.4 | 7.4 | 22.2 | 19.8 | - | - | - | 2.0 | Sub-Atlantic period () |
| PR-JW (1-8) | 19.0 | 41.8 | 5.9 | 8.5 | 18.8 | 17.6 | - | - | 2.6 | 4.8 | Atlantic period () | |
| PR-JW (2-1) | 4.5 | 33.6 | 6.6 | 14.0 | 18.9 | 18.8 | 2.5 | 3.3 | 1.4 | 0.9 | Sub-Atlantic period () | |
| PR-JW (2-8) | 18.5 | 40.4 | 5.1 | 11.8 | 16.0 | 17.7 | 2.4 | 4.2 | 2.3 | 0.1 | Atlantic period () | |
| Han River Delta | HR-CH (39-1) | 4.0 | 25.6 | 7.9 | 19.8 | 15.5 | 13.4 | 17.6 | - | - | 0.2 | Sub-Atlantic period () |
| HR-CH (39-4) | 19.5 | 29.5 | 9.8 | - | 20.6 | 24.1 | 15.9 | - | - | 0.1 | Atlantic period () |
| Raw Mineral | Specific Gravity | Plastic Limit PL (%) | Liquid limit LL (%) | Plasticity Index 1 PI (%) | Specific Surface Area 2 | Mineral Composition 3 (%) |
|---|---|---|---|---|---|---|
| Quartz | 2.656 | 9.1 | 15.7 | 6.6 | 2.66 | Quartz 97.0, Mica 3.0 |
| Albite | 2.659 | 6.8 | 12.6 | 5.8 | 5.47 | Albite 91.4, Anorthite 8.5 |
| Na-montmorillonite | 2.888 | 42.0 | 173.0 | 131.0 | 336.94 | Na-montmorillonite 90.0, Quartz 8.3, Calcite 1.7 |
| Kaolinite | 2.500 | 36.8 | 64.6 | 27.8 | 11.81 | Kaolinite 98.2, Plagioclase 1.8 |
| Test Specimen | Mass Ratio of Raw Minerals (Quartz: Albite: Na-Montmorillonite: Kaolinite) | Specific Gravity | Saturated Water Content (%) | Plastic Limit PL (%) | Liquid Limit LL (%) | Plasticity Index PI (%) | Liquidity Index 1 LI | Cyclic Stress Ratio CSR | Consolidation Pressure | Quality of Specimen | Terminated Cycle | Maximum Cyclic Strain Amplitude 2 (%) | VEDRbreakpoint Cycle 3 Nbreakpoint | |||
|---|---|---|---|---|---|---|---|---|---|---|---|---|---|---|---|---|
| Axial Pressure (kPa) | Radial Pressure (kPa) | Back Pressure (kPa) | Volume Change (ml) | Relative Void Ratio Change | ||||||||||||
| DT-1 | 8:2:9:1 (8291) 4 | 2.75 | 55.8 | 23.2 | 124.1 | 100.9 | 0.32 | 0.284 | 448.8 | 448.4 | 250.3 | 26.2 | 0.45 | 1000 | 0.91 | - |
| DT-2 | 8:2:8:2 (8282) | 2.73 | 56.2 | 22.8 | 119.0 | 96.2 | 0.35 | 0.282 | 449.2 | 449.0 | 249.6 | 19.2 | 0.33 | 1000 | 3.53 | 815 |
| DT-3 | 8:2:6.7:3.3 (8273) | 2.71 | 56.7 | 22.3 | 108.3 | 86.0 | 0.40 | 0.268 | 448.2 | 449.4 | 245.8 | 16.8 | 0.29 | 414 | 3.52 | 362 |
| DT-4 | 8:2:5:5 (8255) | 2.68 | 57.4 | 21.3 | 95.5 | 74.2 | 0.49 | 0.282 | 452.0 | 451.4 | 250.7 | 19.2 | 0.33 | 274 | 3.77 | 229 |
| DT-5 | 8:2:3.3:6.7(8237) | 2.64 | 58.1 | 19.9 | 77.8 | 57.9 | 0.66 | 0.269 | 452.3 | 451.6 | 245.0 | 17.7 | 0.30 | 133 | 4.12 | 105 |
| DT-6 | 8:2:2:8 (8228) | 2.62 | 58.7 | 19.6 | 67.1 | 47.6 | 0.82 | 0.281 | 448.9 | 449.6 | 247.4 | 20.5 | 0.35 | 107 | 4.26 | 94 |
| Test Specimen | Plasticity Index | Maximum Dynamic Shear Modulus 1 Gmax (MPa) | Martin–Davidenkov Model Parameters | Correlation Coefficient | ||
|---|---|---|---|---|---|---|
| DT-1 | 100.9 | 8.56 | 1.587 × 10⁻³ | 1.889 | 0.636 | 0.997 |
| DT-2 | 96.2 | 8.08 | 1.394 × 10⁻³ | 1.859 | 0.599 | 0.993 |
| DT-3 | 86.0 | 8.03 | 1.318 × 10⁻³ | 1.787 | 0.598 | 0.997 |
| DT-4 | 74.2 | 6.29 | 1.234 × 10⁻³ | 1.594 | 0.566 | 0.995 |
| DT-5 | 57.9 | 5.71 | 1.140 × 10⁻³ | 1.556 | 0.554 | 0.991 |
| DT-6 | 47.6 | 4.94 | 1.104 × 10⁻³ | 1.552 | 0.553 | 0.999 |
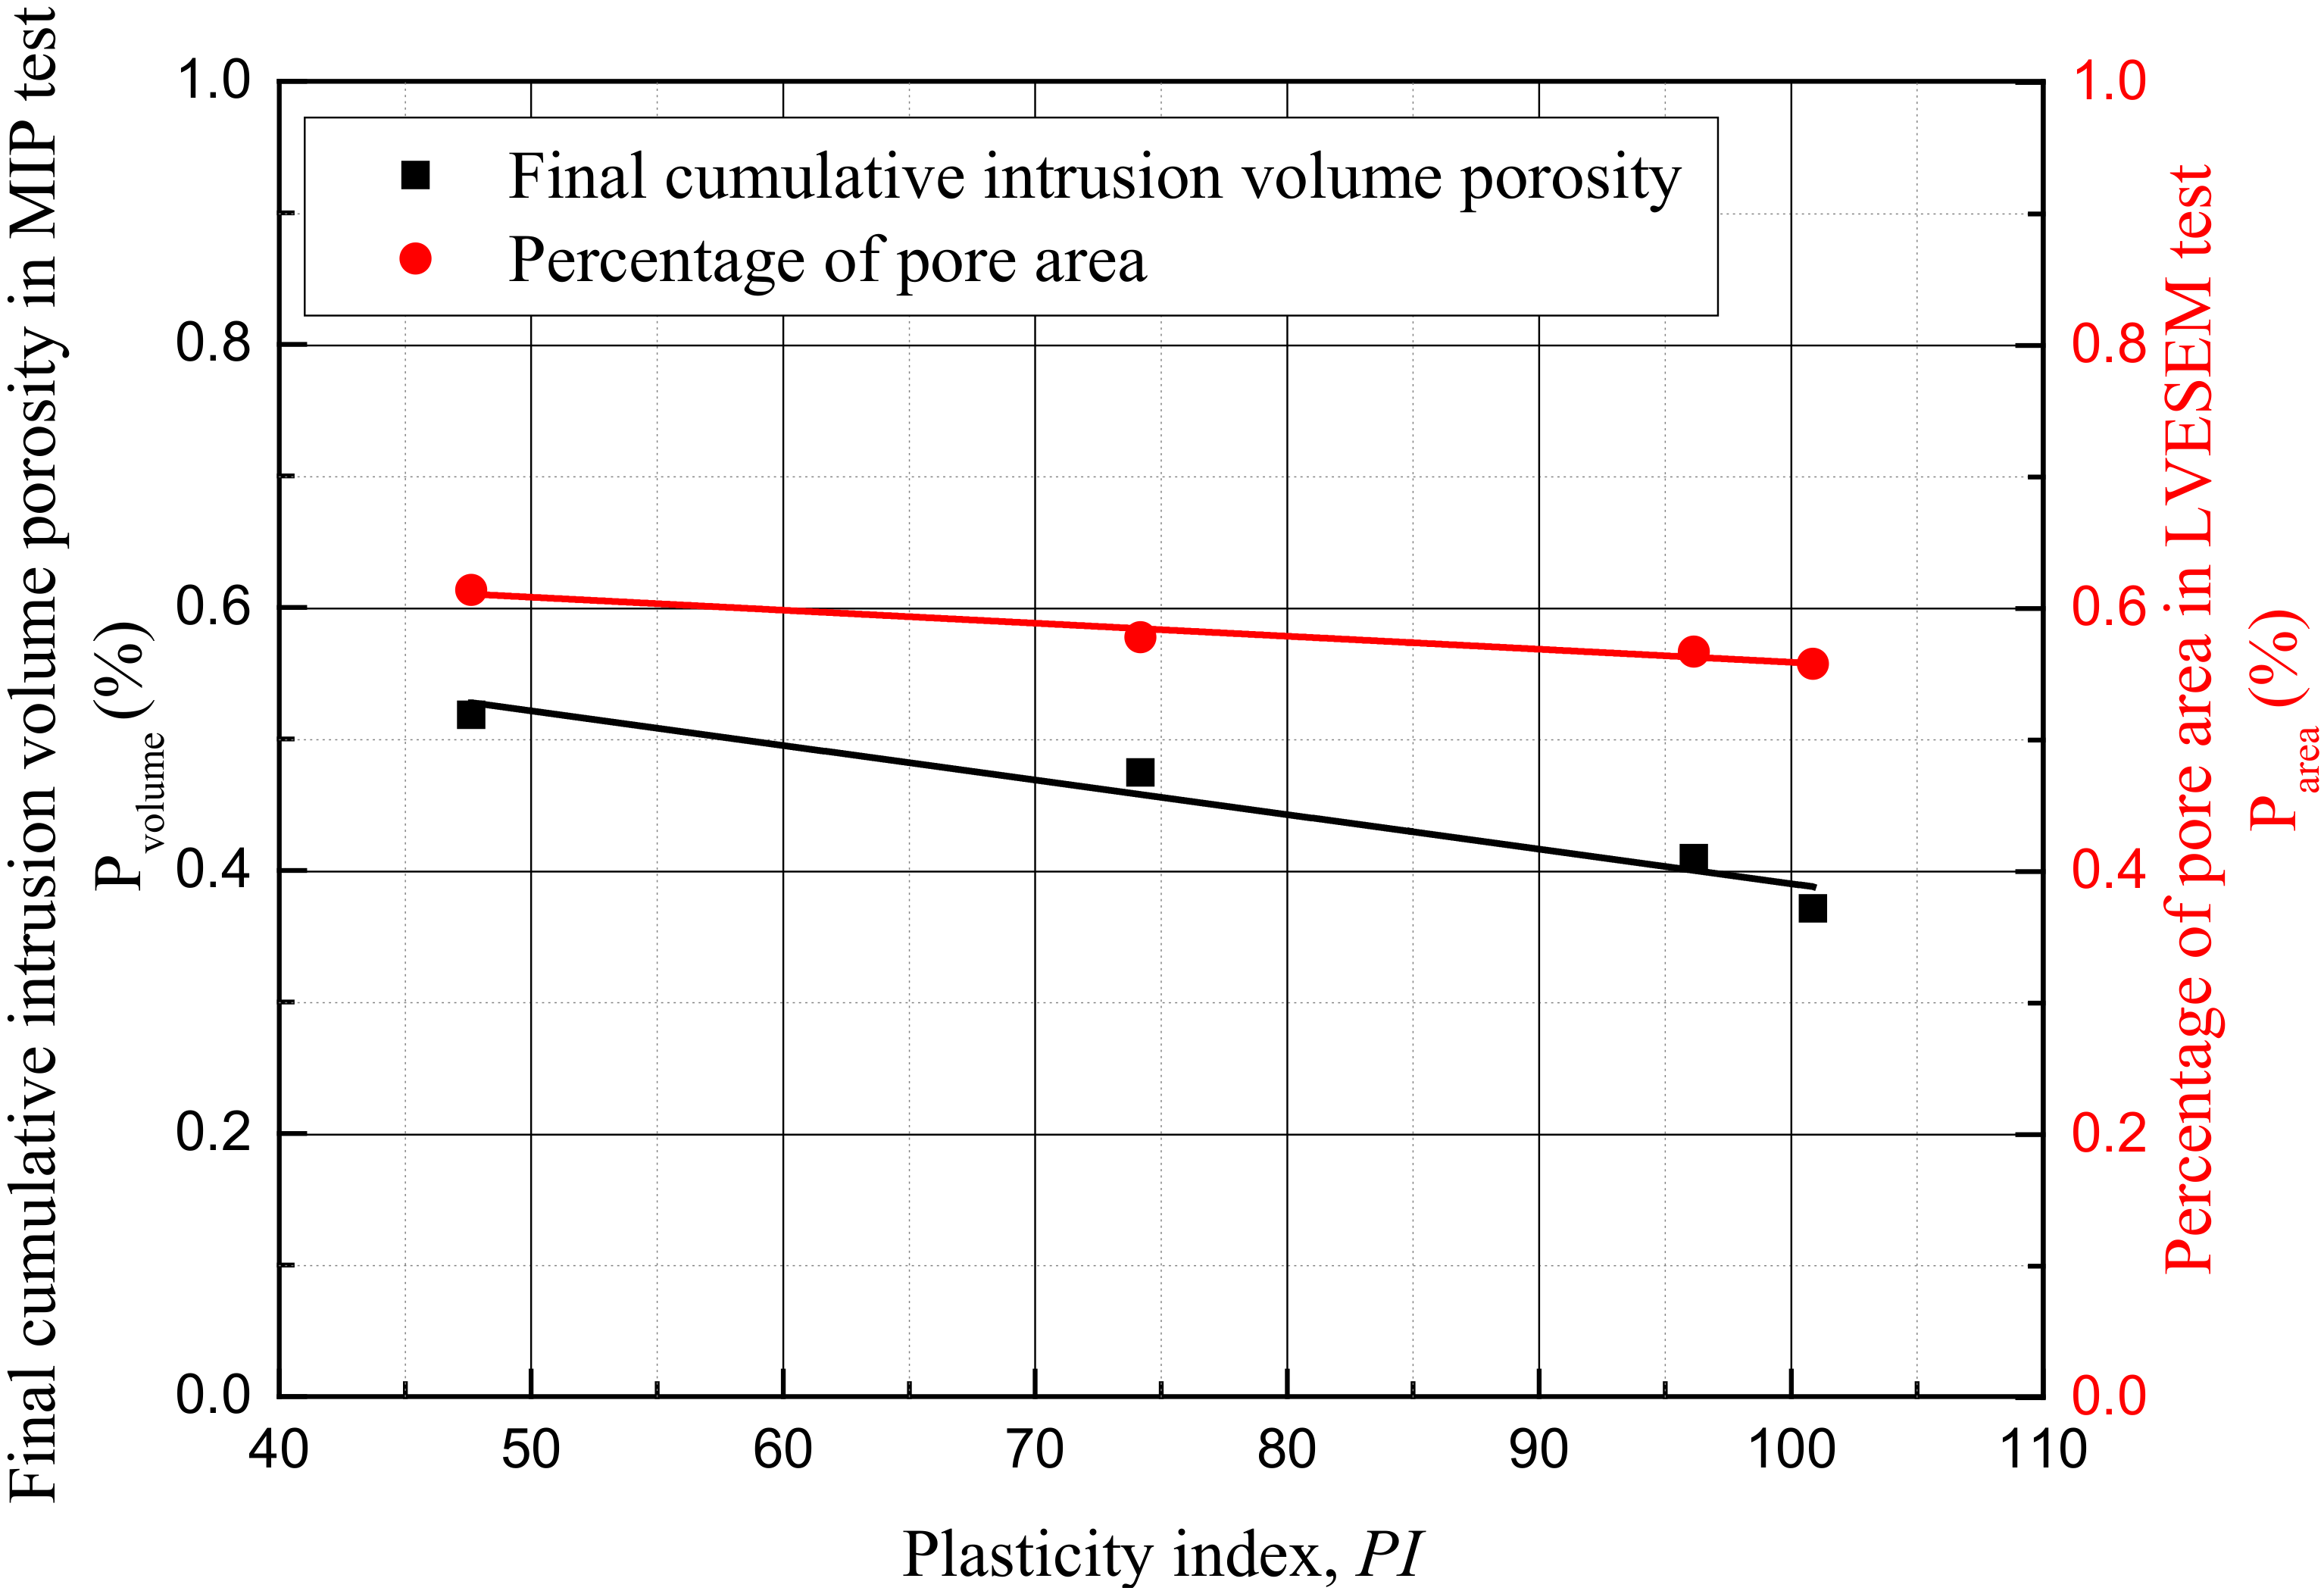
| Test Specimen | Plasticity Index | Percentage of Pore Area 1 Parea (%) | Final Cumulative Intrusion Volume of Mercury Vcumulative (mL/g) | Intra-Aggregate Pore Diameter Dintra-aggregate (nm) | Incremental Intrusion Volume of Mercury at Intra-Aggregate Pore Vincremental (mL/g) |
|---|---|---|---|---|---|
| 8291 | 100.9 | 55.8 | 0.196 | 456 | 0.263 |
| 8282 | 96.2 | 56.7 | 0.237 | 564 | 0.360 |
| 8255 | 57.9 | 57.8 | 0.307 | 566 | 0.629 |
| 8228 | 47.6 | 61.4 | 0.369 | 718 | 0.623 |
Publisher’s Note: MDPI stays neutral with regard to jurisdictional claims in published maps and institutional affiliations. |
© 2021 by the authors. Licensee MDPI, Basel, Switzerland. This article is an open access article distributed under the terms and conditions of the Creative Commons Attribution (CC BY) license (https://creativecommons.org/licenses/by/4.0/).
Share and Cite
Shan, Y.; Wang, X.; Cui, J.; Mo, H.; Li, Y. Effects of Clay Mineral Composition on the Dynamic Properties and Fabric of Artificial Marine Clay. J. Mar. Sci. Eng. 2021, 9, 1216. https://doi.org/10.3390/jmse9111216
Shan Y, Wang X, Cui J, Mo H, Li Y. Effects of Clay Mineral Composition on the Dynamic Properties and Fabric of Artificial Marine Clay. Journal of Marine Science and Engineering. 2021; 9(11):1216. https://doi.org/10.3390/jmse9111216
Chicago/Turabian StyleShan, Yi, Xing Wang, Jie Cui, Haihong Mo, and Yadong Li. 2021. "Effects of Clay Mineral Composition on the Dynamic Properties and Fabric of Artificial Marine Clay" Journal of Marine Science and Engineering 9, no. 11: 1216. https://doi.org/10.3390/jmse9111216
APA StyleShan, Y., Wang, X., Cui, J., Mo, H., & Li, Y. (2021). Effects of Clay Mineral Composition on the Dynamic Properties and Fabric of Artificial Marine Clay. Journal of Marine Science and Engineering, 9(11), 1216. https://doi.org/10.3390/jmse9111216