Article

Investigation on Thrust Characteristics of a Downstream Offshore Floating Wind Turbine under Yawed Inflow Conditions

School of Mechanical Engineering and Automation, Fuzhou University, Fuzhou 350116, China
*
Author to whom correspondence should be addressed.
J. Mar. Sci. Eng. 2021, 9(11), 1215; https://doi.org/10.3390/jmse9111215
Submission received: 11 October 2021 / Revised: 26 October 2021 / Accepted: 29 October 2021 / Published: 3 November 2021
(This article belongs to the Topic Sustainable Energy Technology)

Abstract

:
In the natural marine environment, offshore floating wind turbines (OFWTs) inevitably experience yawed inflow conditions, which will make their aerodynamics more complicated than those experiencing uniform inflow conditions and difficult to understand. In the present study, the thrust characteristics of a wake-influenced OFWT under dynamic, static, and coupled yawed inflow conditions are investigated thoroughly. Analytical characterizations of yawed inflow and upstream wake are integrated into the blade element momentum (BEM) method to achieve the investigation. Based on this method, simulations by the FAST code have been conducted, and the results are analyzed. It is shown that the three inflow conditions have considerable influences on the thrust coefficient of the wind rotor or the normal force at the blade section, especially in the wake case where the downstream OFWT is located at a specific offset from the central line of a single upstream wake. In order to validate the analyses of simulation results, experimental tests by a set of dedicated apparatus are conducted. The comparison results are good, proving the reliability of simulation results. This work can provide some theoretical contributions to the aerodynamic design and control of OFWTs.

1. Introduction

In recent years, with the rapid development of the offshore wind power industry, the offshore floating wind turbine (OFWT) has been widely studied and applied [1,2,3,4]. When operating in natural marine environmental conditions, an OFWT will inevitably experience yawed inflow [5,6]. Under the yawed inflow conditions, the aerodynamics of the OFWT become rather complicated and difficult to obtain, which will bring great challenges to its control in practical engineering [6,7]. As one of the most crucial aerodynamics, the thrust characteristic of the wind rotor is also significantly influenced because the normal force at each blade section used to calculate the thrust varies with the dynamic angle of attack at different azimuths in the yawed inflow conditions [8]. The thrust characteristic is important for two main reasons. On the one hand, the thrust characteristic of an OFWT is closely related to its wake’s expansion and wind velocity distribution [9,10,11,12]. As the wake is disturbed, not only the aerodynamics of the OFWT itself but also the aerodynamics of its downstream OFWTs can be deeply influenced [13]. On the other hand, the thrust characteristic of an OFWT is also related to its dynamic characteristics because the thrust is a critical external excitation of the wind turbine system [14,15]. Unfortunately, investigations on the thrust characteristic are still scarce, especially under complex conditions like the yawed inflow.
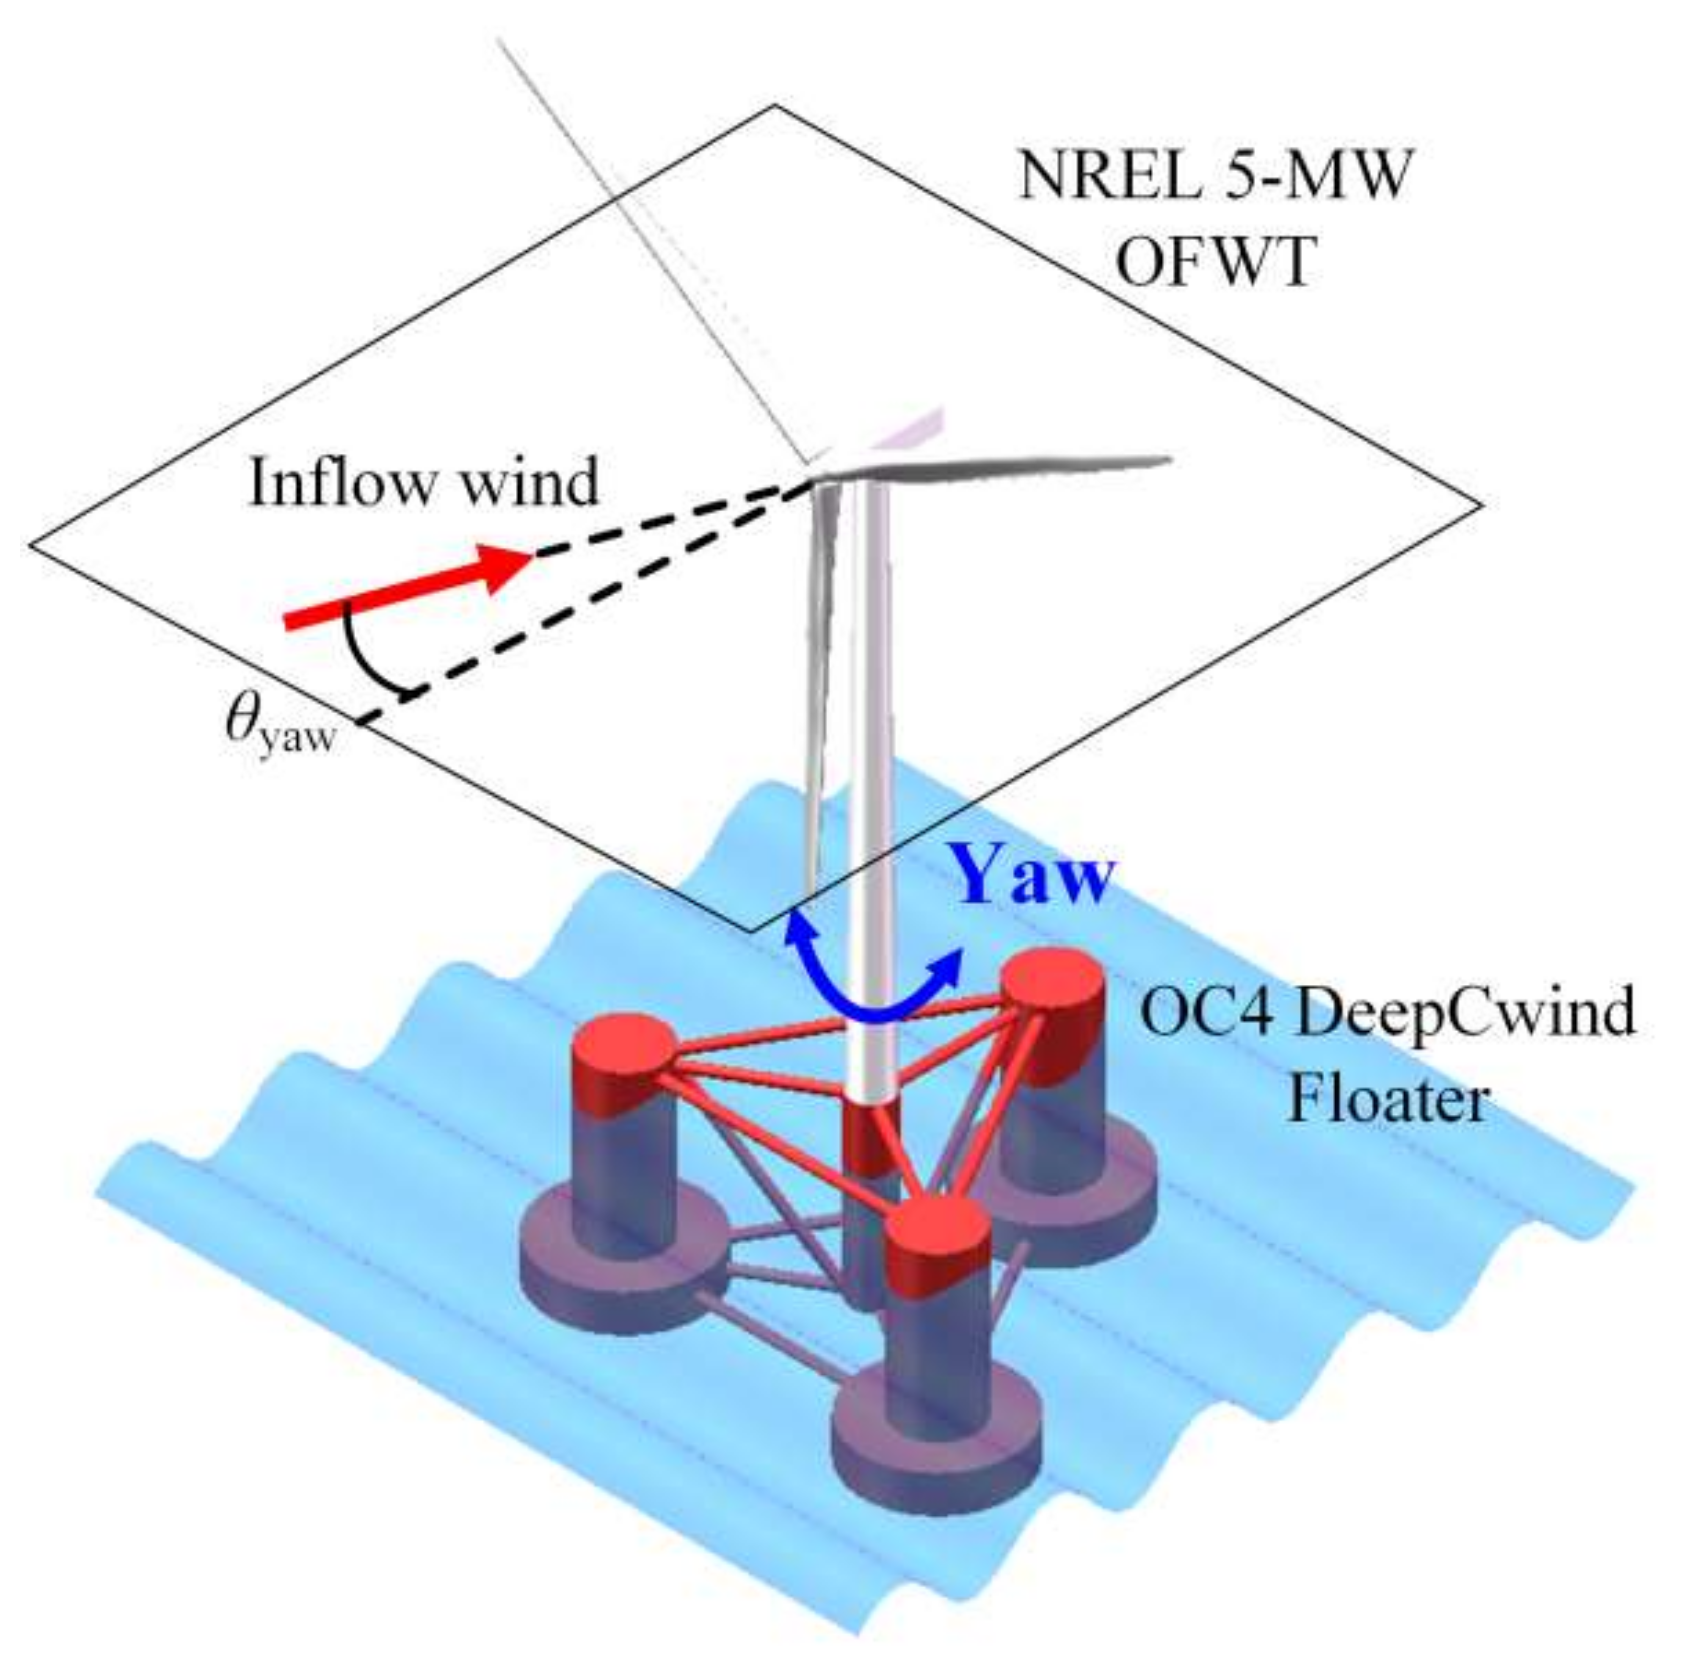
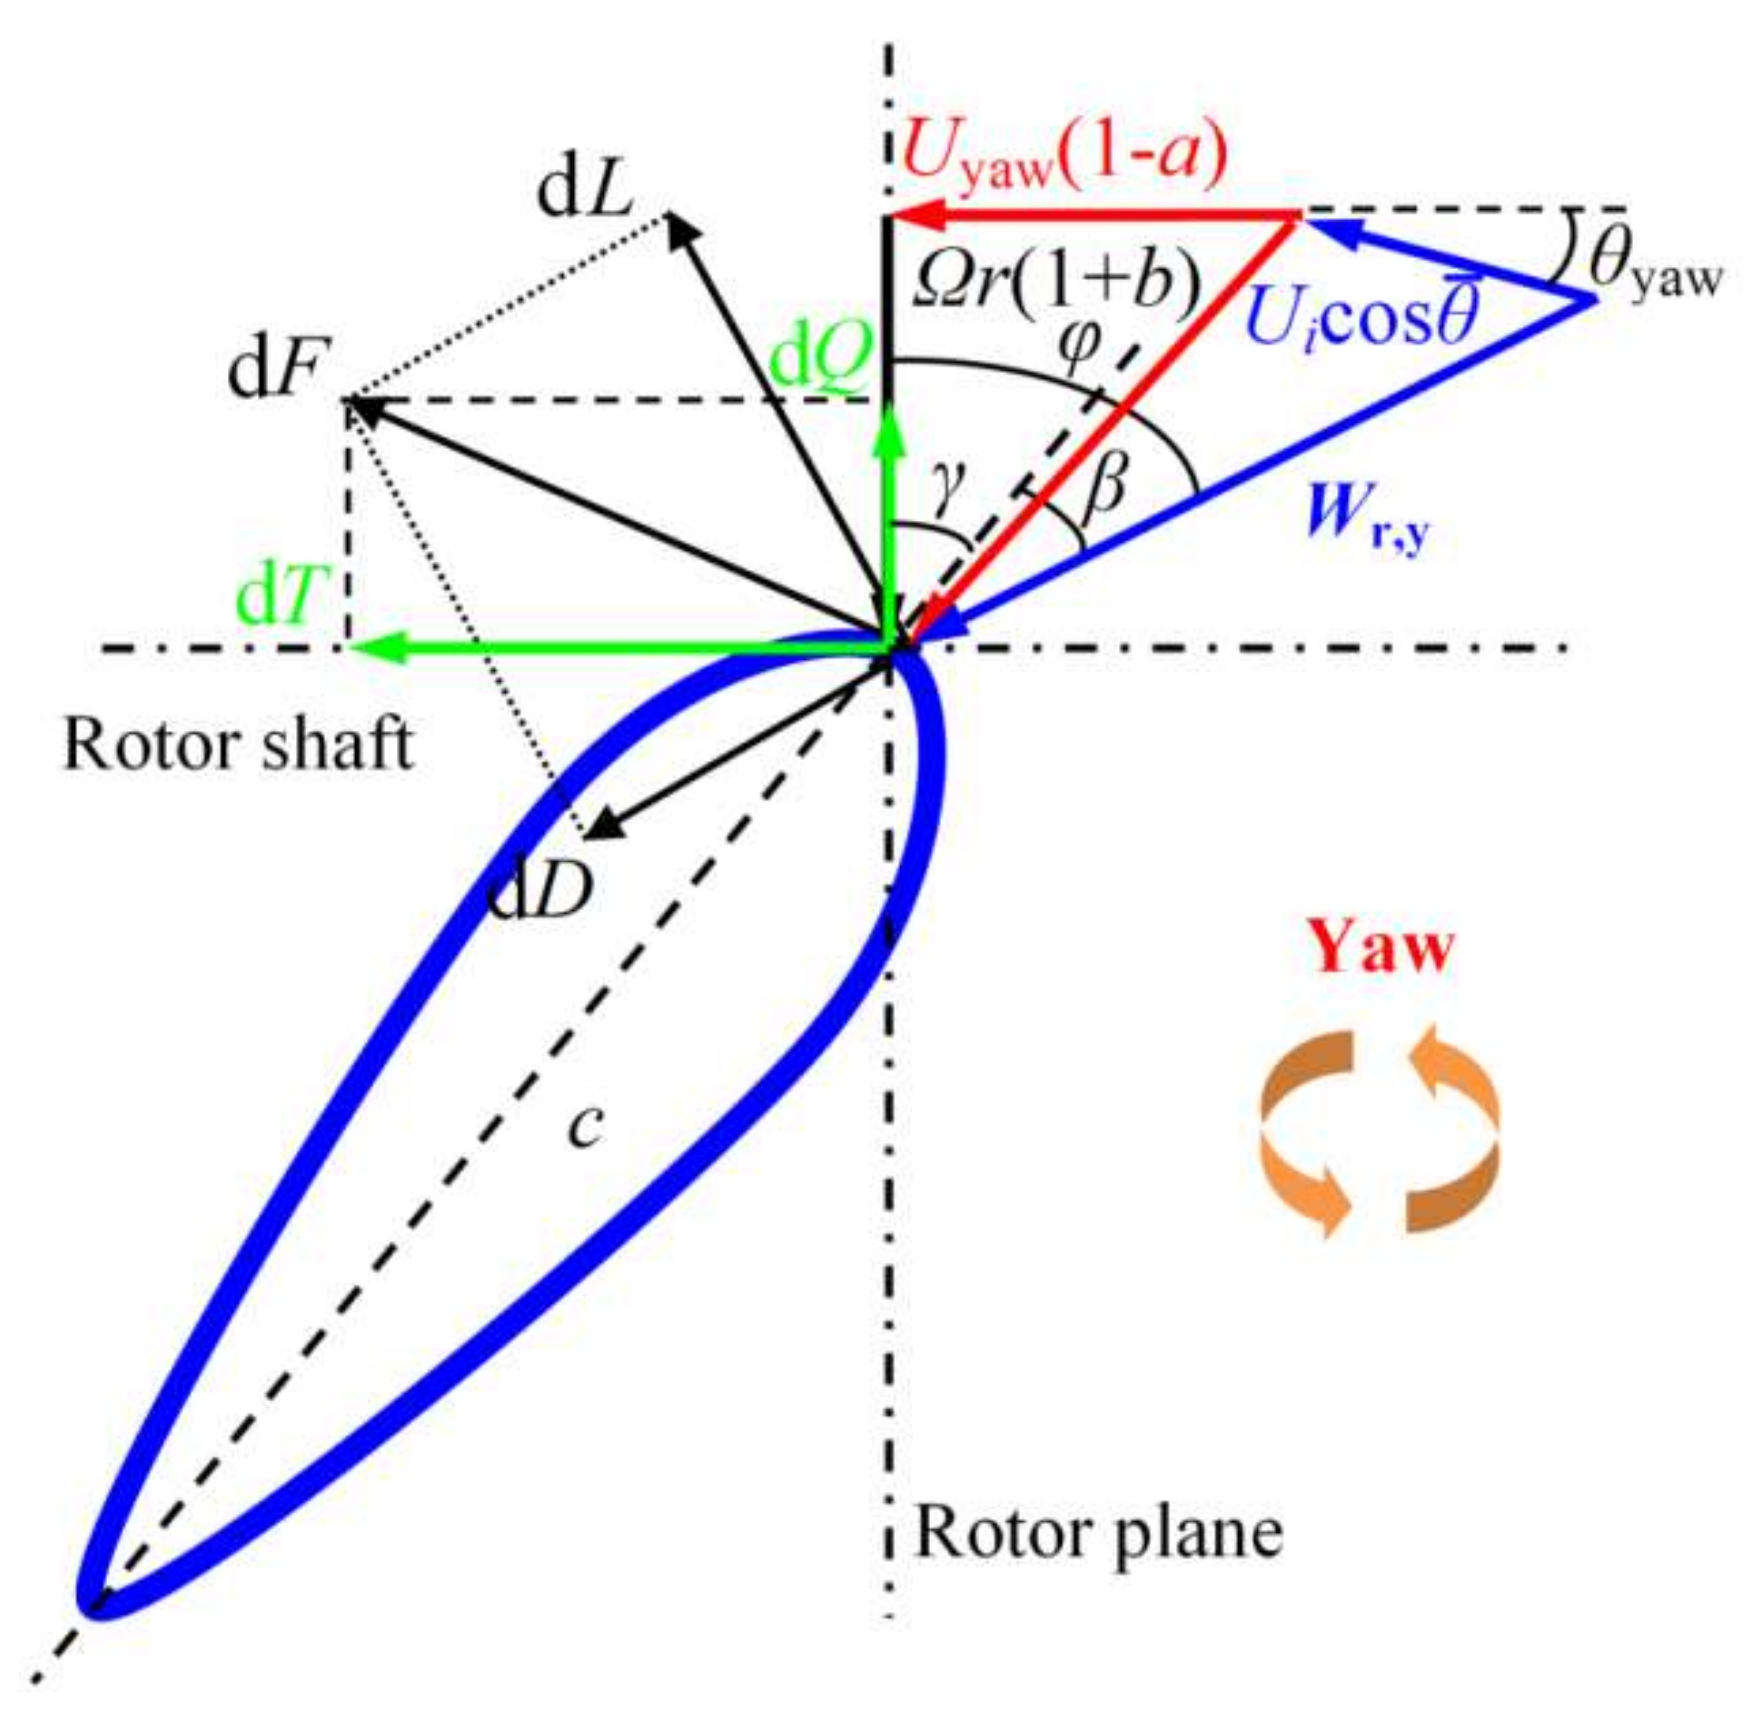
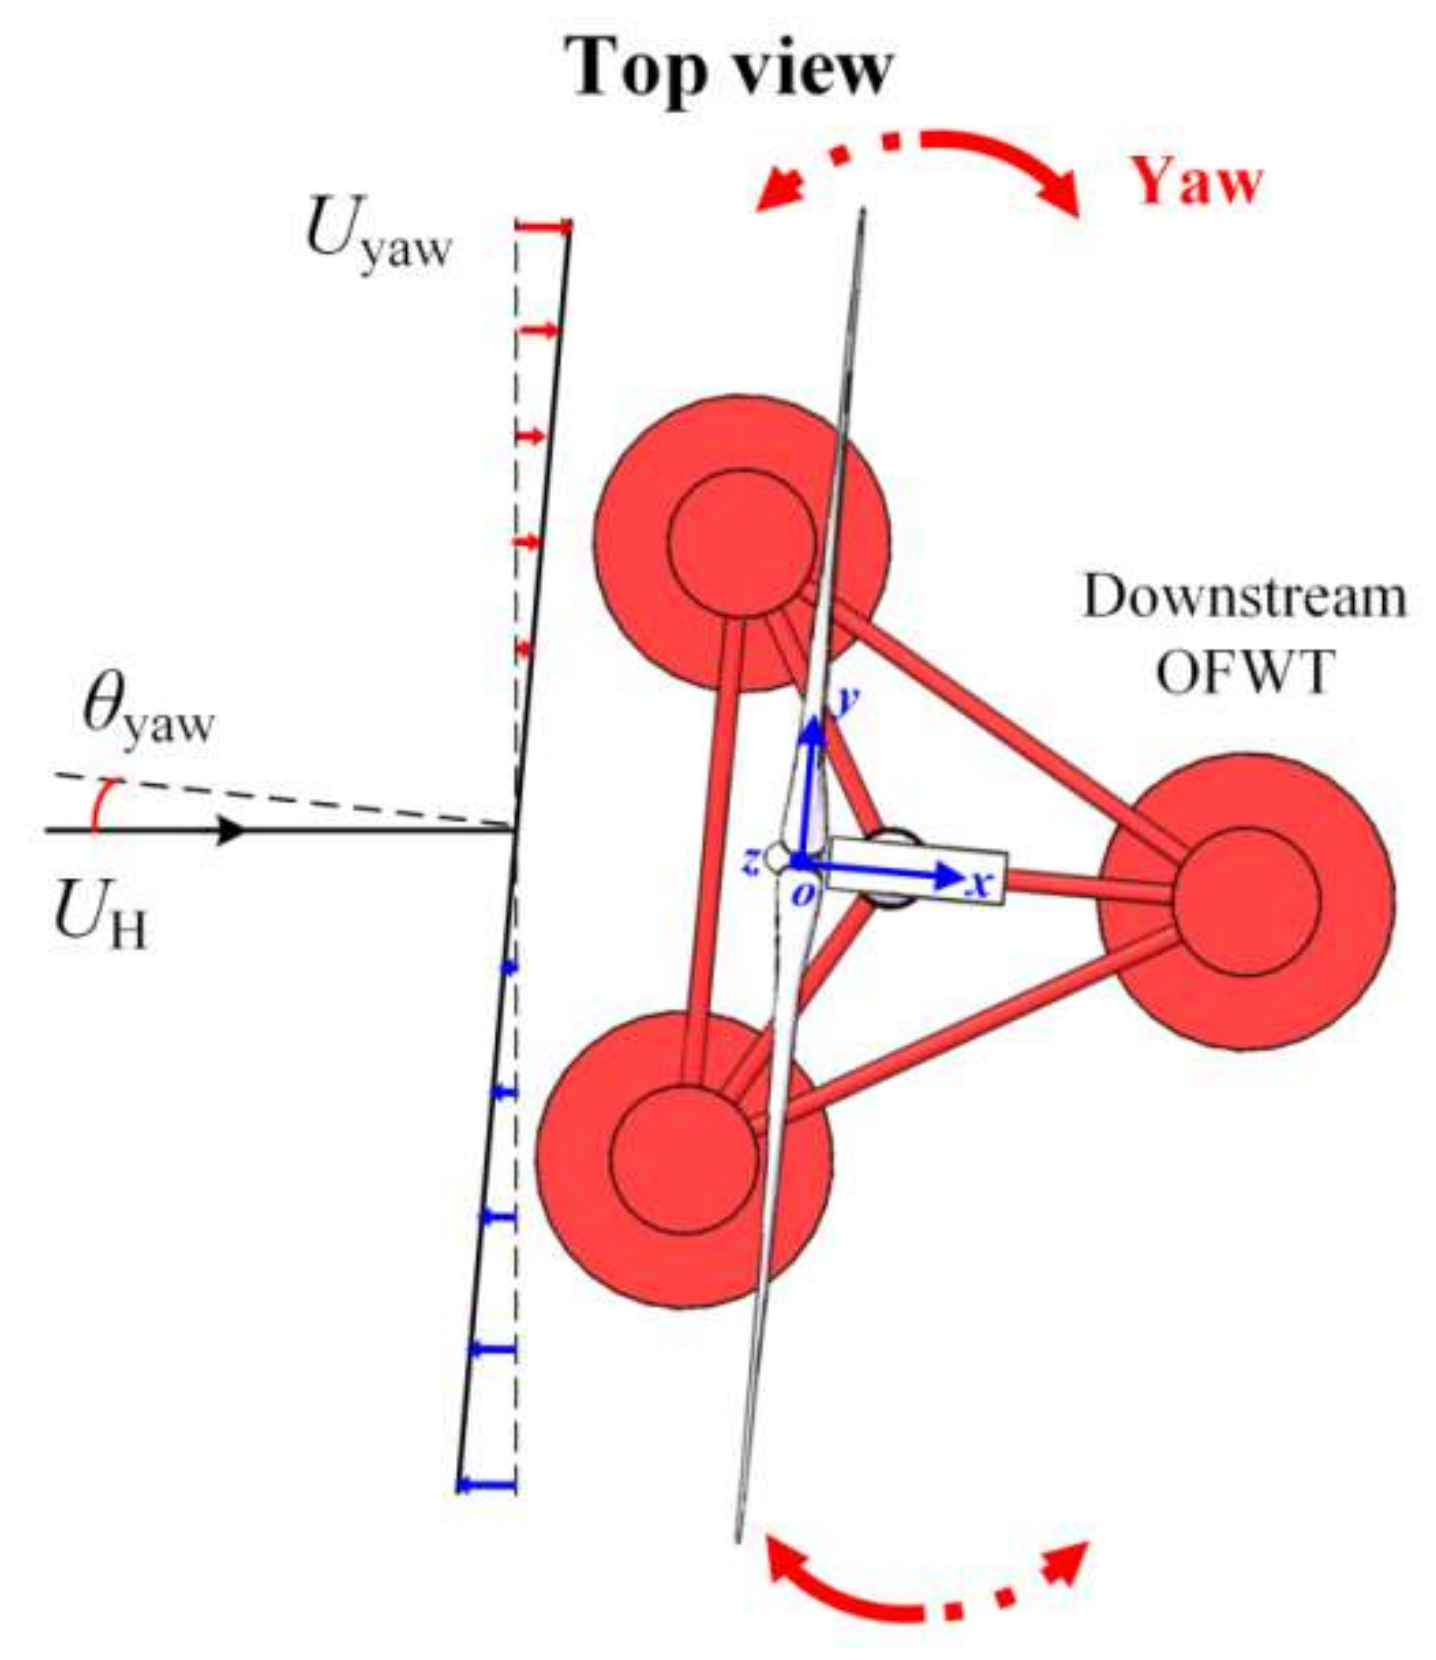
The yawed inflow condition refers to that there is an included angle between the inflow wind direction and the vertical direction of the wind rotor plane, that is, the yawed angle θyaw. This kind of inflow conditions can be divided into dynamic yawed inflow condition and static yawed inflow condition. The dynamic yawed inflow condition is caused by the platform yaw motions. When the OFWT operates with platform yaw motions, the yawed angle varies in the time domain [16,17,18]. To clarify the influences of the yaw motions, Qiu et al. [19] used the free-vortex method to predict the unsteady aerodynamic loads of wind turbines. They found that the shaft torque of the blade could be significantly affected by the yaw motions. Besides, Tran et al. [20] applied the blade element momentum (BEM) and the computational fluid dynamics (CFD) methods to investigate the aerodynamics of an OFWT. They detected that the blade-tip vortices were generated in the process of yaw motions, which could make the aerodynamic loads complicated. However, the knowledge about the influences of the dynamic yawed inflow condition on the aerodynamics of an OFWT is still limited. As for the static yawed inflow condition, it is caused by the changes of the incoming wind direction [21,22] or the wind rotor facing direction [23,24,25]. When these phenomena happen, a fixed yawed angle is generated. Extensive investigations about the static yawed inflow condition have been done [8]. Greco et al. [26] used a free-wake panel method to investigate the aerodynamic performance of a horizontal wind turbine in the static yawed inflow condition. Bangga et al. [27] used CFD and BEM methods to predict the aerodynamic loads on a 2.3 MW wind turbine rotor in three different inflow cases considering the static yawed inflow condition. Both the above two investigations indicated that the static yawed inflow condition has significant influences on the aerodynamics of an OFWT. In addition, Wen et al. [16] pointed out that the static yawed inflow condition could reduce the energy conversion efficiency due to the reduction of effective wind area. Other investigations about the static yawed inflow condition focus on its influences on the OFWT’s wake. Lee et al. [25] conducted a numerical simulation on the National Renewable Energy Laboratory (NREL) Phase VI wind turbine model based on the nonlinear vortex lattice method. They found that the static yawed inflow condition could make the wake skewed, which would finally affect the aerodynamic behavior of the wind turbine. Bastankhah et al. [28,29,30] conducted wind tunnel measurements to study the wake characteristics of a wind turbine with different static yawed angles. They found that the static yawed angles could reduce the wake velocity deficit while increase the wake deflection.
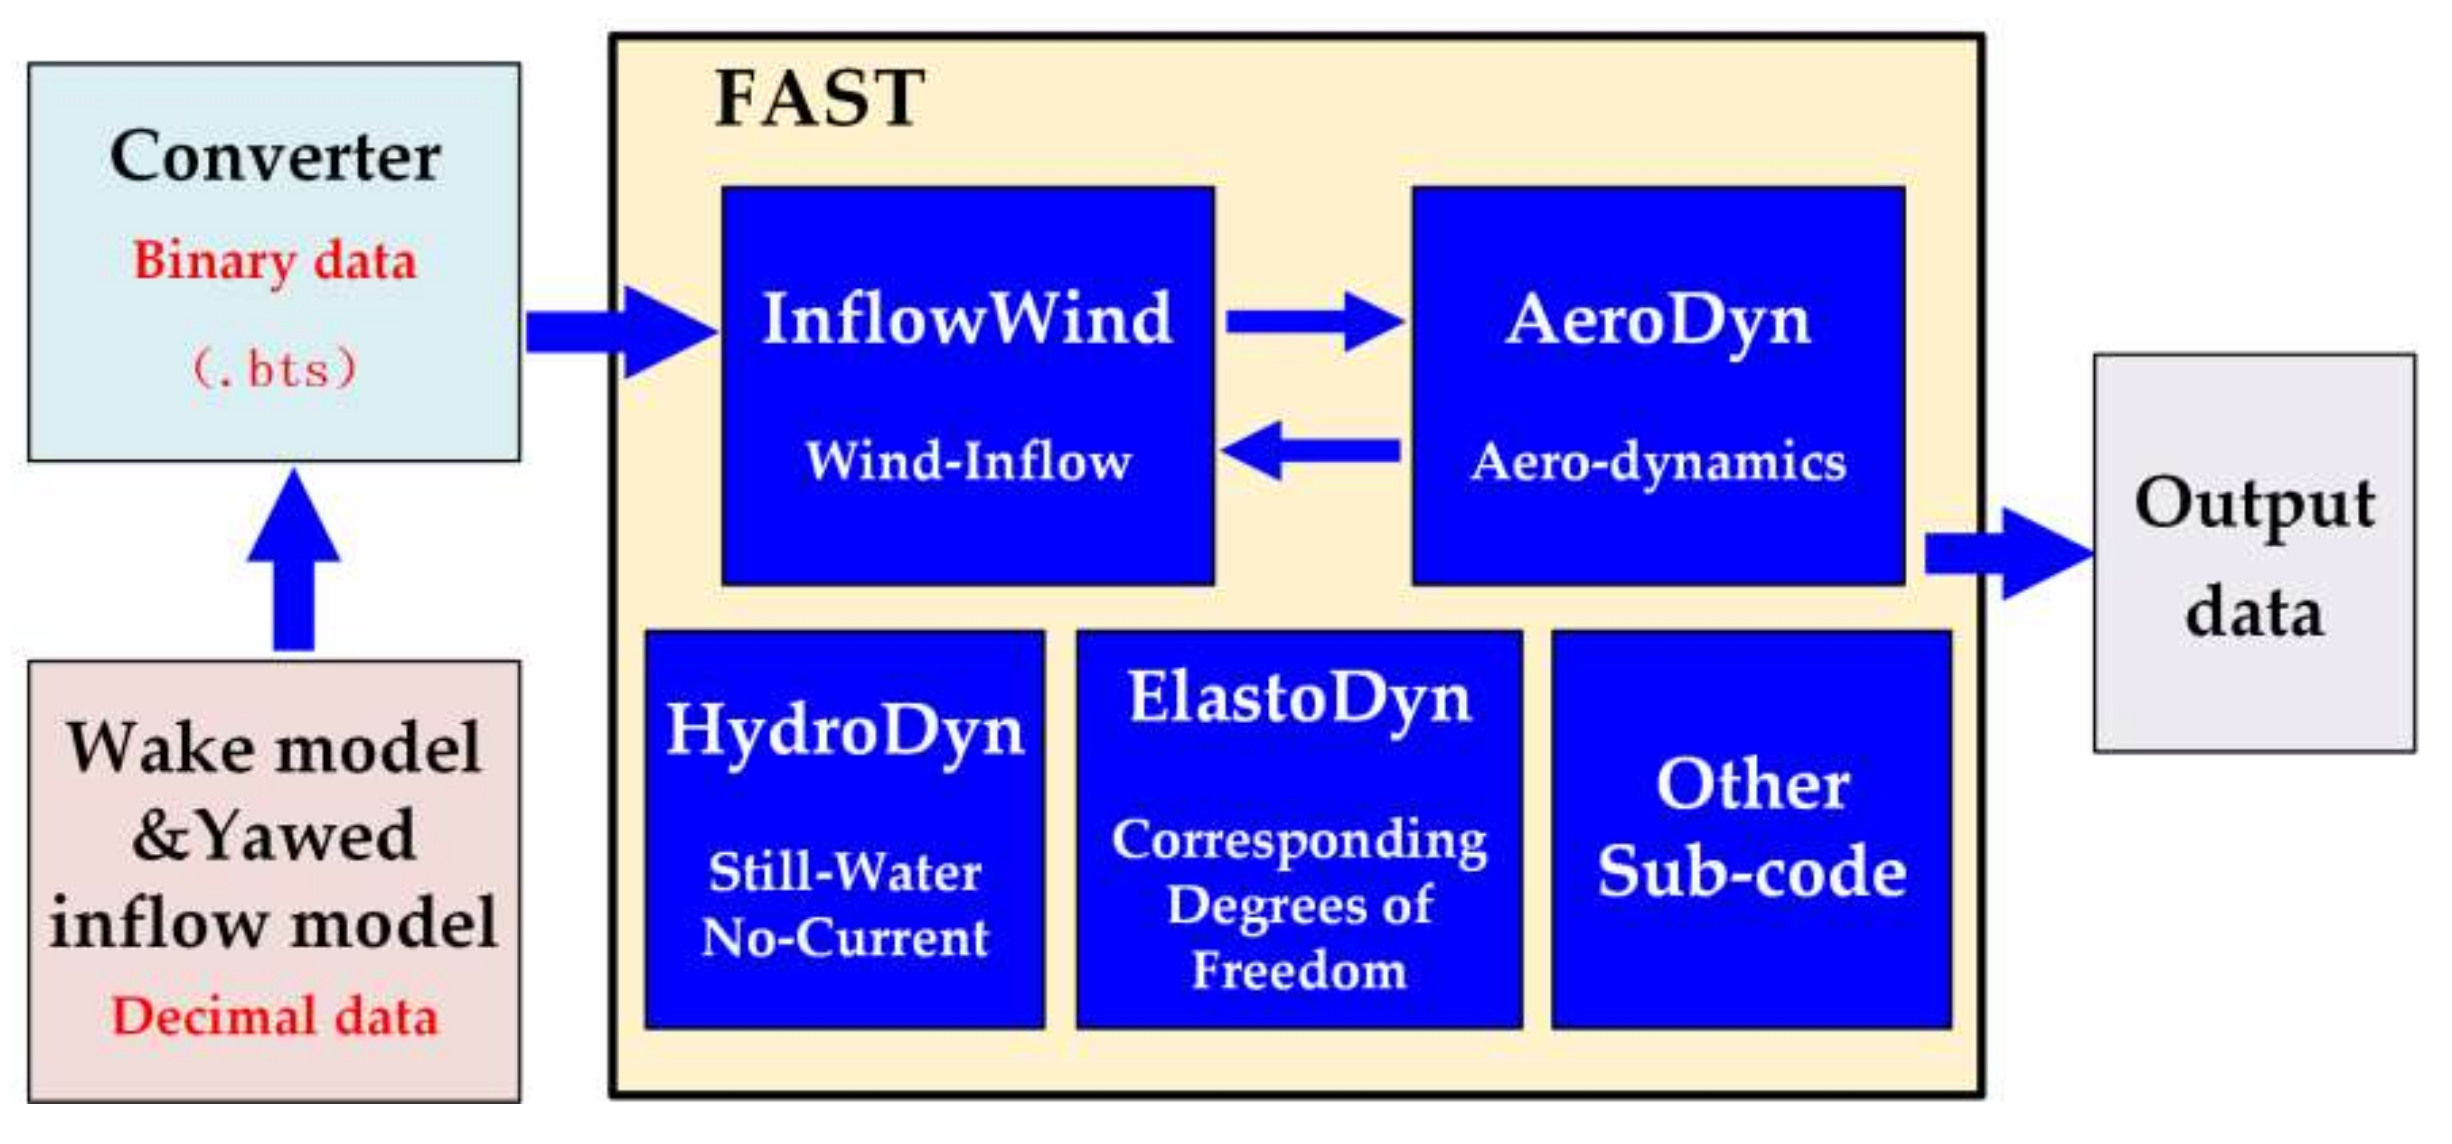
Based on the above literature reviews, there are two major limitations of the existing investigations. Firstly, the existing investigations on the aerodynamics under the yawed inflow conditions are mostly based on an isolated solo OFWT, without considering the influences of the upstream wake in the wind farm. With the gradual large-scale applications of the OFWT, the upstream wake conditions, especially the typical wake conditions under specific wind farm layouts, should be considered in the aerodynamics calculations of a downstream OFWT. Secondly, most existing investigations only focus on the aerodynamics under the dynamic yawed inflow condition or the static yawed inflow condition, and seldom consider the coupled condition of the two yawed inflow. It should be noted that due to the randomness of wave and wind directions in the environment and the hysteresis of yaw control system of the OFWT, the coupled condition of the two yawed inflow is quite likely to come into being. The drawbacks mentioned above result in the motivation of the present study: to investigate the thrust characteristics of a wake-influenced OFWT under dynamic yawed inflow, static yawed inflow, and coupled yawed inflow conditions. To achieve this investigation, the yawed inflow and the wake characterizations are integrated into the numerical method based on the BEM theory, and then simulations applying the FAST code (an open source simulation code defined by “Fatigue”, “Aerodynamic”, “Structure”, and “Turbulence”) are carried out for a typical semi-submersible OFWT. According to the simulation results, the thrust characteristics in typical wake flow under the three yawed inflow conditions are analyzed and discussed. Finally, a series of experimental tests are conducted to validate the analyses of simulations. The innovation of this method lies in that it can achieve the correct calculation of yawed inflow aerodynamics for the downstream OFWT.
The rest of this paper is organized as follows. In Section 2, the characterization of the yawed inflow conditions, the calculation method of aerodynamics in wake cases, the application of FAST and the simulation setups are described. In Section 3, the results of the thrust characteristics under different yawed inflow conditions from the simulations are analyzed and discussed. In Section 4, the experimental tests are set up to validate the analyses of simulations. Finally, in Section 5, the main conclusions of this paper are summarized.

2. Methodology

The object analyzed in the present study adopts the NREL 5-MW wind turbine [31] which is installed on the Offshore Code Comparison Collaboration Continuation (OC4) DeepCwind semi-submersible floater [32], as shown in Figure 1. The basic parameters of the OFWT are listed in Table 1 and Table 2, and more details can be found in Refs. [31,32].

2.1. Modeling of the Yawed Inflow Condition

The yawed inflow condition of an OFWT is shown in Figure 2. In this figure, the yawed angle and the yawed induced wind velocity can be clearly demonstrated. Note that oxyz represents the local coordinate system which is fixed to the geometric center of wind rotor. Its x-direction is along the nacelle’s direction; z-direction is along the vertical direction; y-direction is along the horizontal direction.
As done by prior investigations [8], the rotation center of the yaw motion is assumed to be the origin of the oxyz system, the static, dynamic, and coupled yawed angle can be expressed as follows:
θ yaw = θ ¯ yaw static condition θ yaw = θ yaw ( t ) = A yaw cos ( 2 π f yaw t + ϕ yaw , 0 ) dynamic condition θ yaw = θ ¯ yaw + θ yaw ( t ) coupled condition ,
where θ ¯ yaw , θ yaw ( t ) and θ ¯ yaw + θ yaw ( t ) denote the static, dynamic and coupled yawed angles, respectively; A yaw and f yaw denote amplitude and frequency of the yaw motion (resulting in dynamic yawed angle); ϕ yaw , 0 denotes the initial phase, and it is assumed to be 0 in this paper.
Then, the corresponding yawed induced angular velocity can be expressed as follows:
ω yaw ( t ) = d θ yaw d t = 0 static condition 2 π A yaw f yaw sin ( 2 π f yaw t ) dynamic condition 2 π A yaw f yaw sin ( 2 π f yaw t ) coupled   condition .
In order to convert the yawed angular velocity into the yawed induced wind velocity in the wind flow direction, an equivalent wind shear model is adopted, which can be expressed as the follow:
U yaw ( y , t ) = ω yaw ( t ) y cos θ yaw ( t ) ,
where U yaw ( y , t ) denotes the yawed induced wind velocity. Note that θ yaw ( t ) is usually small and therefore the value of cos θ yaw ( t ) is set as 1 in this paper. Inserting Equation (2) into Equation (3), the yawed induced wind velocity can be finally expressed as:
U yaw ( y , t ) = ω yaw ( t ) y = 0 static condition 2 π A yaw f yaw y sin ( 2 π f yaw t ) dynamic condition 2 π A yaw f yaw y sin ( 2 π f yaw t ) coupling   condition .

2.2. Modeling of the Aerodynamics

The yawed inflow condition of a blade airfoil is shown in Figure 3. In this figure, W r , y denotes the relative wind velocity of the blade airfoil considering the yawed inflow; Ω denotes the rotational angular speed; r denotes the distance from the rotor axis to the airfoil; a and b denote the axial flow induction coefficient and the tangential induction coefficient, respectively; dF denotes the resultant force acting on the airfoil; dL and dD denote the lift force and drag force, respectively; dT and dQ denote the axial force (thrust) and tangential force, respectively; γ denotes the twist angle; β denotes the angle of attack; c denotes the chord length.
As can be seen from Figure 3, due to the yawed inflow the magnitude and direction of relative wind velocity has been changed. Based on the geometry theory, the relative wind velocity W r , y and the corresponding angle of attack β can be calculated by the following Equations:
W r , y = [ U yaw ( 1 a ) + U i cos θ ¯ cos θ yaw ] 2 + [ Ω r ( 1 + b ) U i cos θ ¯ sin θ yaw ] 2 ,
β = tan 1 [ U yaw ( 1 a ) + U i cos θ ¯ cos θ yaw Ω r ( 1 + b ) U i cos θ ¯ sin θ yaw ] γ ,
where U i denotes the incoming wind velocity at the position where the airfoil locates.
For a downstream OFWT in a wind farm, the incoming wind velocity is actually the wake velocity of the upstream OFWT. Considering this situation, the distribution of the incoming wind velocity of a downstream OFWT is expressed by a widely used Gaussian wake model as the follow [10,33,34]:
U i ( X , Y , Z ) = U In j ( Z ) j = 1 n [ A j ( X ) 2 π σ j ( X ) 2 e Y 2 ( Z H 0 ) 2 2 σ j ( X ) 2 + B j ( X ) ] 2 ,
where the subscript i and j denote the downstream OFWT and the upstream OFWT, respectively; U In j ( Z ) denotes the incoming wind velocity of upstream OFWTs considering the wind shear effect as expressed in Equation (8) [35]; σ j ( X ) denotes the parameter characterizing wake expanding as expressed in Equation (9) [9]; A j ( X ) and B j ( X ) denote the two key parameters determining Gaussian-shaped wake deficit as expressed in Equation (10) and Equation (11) [10], respectively. Note that X, Y, and Z here belong to the global coordinate system OXYZ. The origin O is located at the central position of the upstream OFWTs at the still water level; X-direction is the stream-wise direction; Z-direction is the vertical upward direction; Y-direction is the horizontal direction determined by the right-hand rule.
U In j ( Z ) = U H ( Z H 0 ) α ,
σ j ( X ) = R 0 I 0 + k 0 X I 0 2 + [ 0.73 a 0.8325 I 0 0.0325 ( X D 0 ) 0.32 ] 2 C I 0 ,
A j ( X ) = π R 0 2 V 0 2 H 0 C σ j ( X ) H 0 + C σ j ( X ) U In j ( Z ) C 2 σ j ( X ) 2 ( Z H 0 ) 2 d Z 1 e C 2 2 C 2 2 e C 2 2 ,
B j ( X ) = C 2 A j ( X ) 2 π σ j ( X ) 2 e C 2 2 ,
where U H denotes the wind velocity at the hub height H 0 ; α denotes the wind shear exponent empirical constant; R 0 and D 0 denotes the radius and the diameter of wind rotor, respectively; I 0 denotes the turbulence intensity of the ambient wind; k 0 denotes the wake expansion rate; C is an empirical constant; V 0 denotes the wind velocity just behind the wind rotor.
After solving the relative wind velocity and the angle of attack, the axial force (thrust) dT and tangential force dQ can be calculated by the following Equations:
d T = 1 2 ρ W r , y 2 [ C L cos ( β + γ ) + C D sin ( β + γ ) ] c d r ,
d Q = 1 2 ρ W r , y 2 [ C L sin ( β + γ ) C D cos ( β + γ ) ] c d r ,
where ρ denotes the air density; C L and C D denote the lift coefficient and the drag coefficient. Then only C L and C D are not solved.
Based on the momentum theory in BEM, dT and dQ have the following Equation relationships [36]:
d T = 4 3 π r 2 ρ U i 2 ( 1 a ) a d r ,
d Q = 4 3 π r 2 ρ U i 2 Ω ( 1 a ) b d r ,
By combining Equations (12)–(15), a and b can be derived as follows:
a = { 1 + 8 π r sin 2 ( β + γ ) 3 c [ C L cos ( β + γ ) + C D sin ( β + γ ) ] } 1 ,
b = { 1 + 8 π r sin ( β + γ ) cos ( β + γ ) 3 c [ C L sin ( β + γ ) C D cos ( β + γ ) ] } 1 ,
As seen from the above equations, C L and C D can be obtained after a and b are determined. By the BEM iteration algorithm as introduced in Ref. [36], a and b can be accurately calculated.
After all the necessary parameters are ready, the aerodynamic force of each blade section can be obtained based on Equations (12) and (13). Then the thrust of the wind rotor T rotor can be calculated by integrating Equation (12) as the follow:
T rotor = n = 1 3 R h R 0 1 2 ρ W r , y 2 [ C L cos ( β + γ ) + C D sin ( β + γ ) ] c d r ,
where n denotes the number of the blades; R h denotes the radius of the hub.
Finally, the thrust coefficient of the wind rotor can be obtained as the follow:
C T , rotor = T rotor 0.5 ρ π R 0 2 U H 2 .

2.3. Application of the FAST

The simulation in this study applies the FAST code [37,38,39] developed by the NREL. However, the wind file code TurbSim of the FAST cannot provide the input wind velocity file under the required conditions such as the wake condition. Thus, the authors proposed a specialized converter which contains an algorithm supporting conversion of the decimal data (from the wake model and the yawed inflow model) to the binary data (compatible in FAST). The application method of this converter in FAST is shown in Figure 4.

2.4. Simulation Setting up

To obtain the aerodynamics of the analyzed OFWT, two main input conditions need to be set.
The first one is the wake condition. As seen in Figure 5, the downstream OFWT in a normal wind farm usually experiences three wake cases. Figure 5a shows a single-wake case where the downstream OFWT is located just along the central wake region of one upstream OFWT; Figure 5b shows another single-wake case where the downstream OFWT is offset from the central wake region of one upstream OFWT; Figure 5c shows a multiple-wake case where the downstream OFWT is located just behind two upstream OFWTs. In this study, the three wake cases are adopted in the simulations. The input parameters of the wake conditions are as follows: the downstream distance ΔX is set to be 5D0 and 10D0; the lateral offset ΔY is set to be equal to R0; the relative distance ΔL of the two upstream OFWTs is set to be 144 m; the incoming wind velocity is set to be 11.4 m/s; the tip speed ratio (TSR) is set to be 7; the wind shear exponent empirical constant is set to be 0.1; the parameter C is set to be 2.12; the turbulent intensity of the incoming wind is set to be 0.08; the wake expansion rate is set to be 0.02.
The second one is the yawed inflow condition. In this study, three yawed inflow conditions, i.e., the dynamic, static, and coupled yawed inflow conditions, are adopted. Specifically, the detailed parameters of each yawed inflow case are listed in Table 3. The platform fixed case (i.e., FC) is regarded as a reference in the comparisons. A 300 s simulation for each case is conducted, and only the data from 100 s~200 s (101 s in total) are taken for analysis to avoid the start and stop effects of the simulation.

3. Results and Discussion

3.1. Wake Cases

In this subsection, the thrust coefficients in the three wake cases are analyzed. For clarity, the YC3, SYC3, and YC3 + SYC3, as described in Table 3, are taken into account as case studies. The results at ΔX = 5D0 and ΔX = 10D0 are shown in Figure 6 and Figure 7.
As seen in Figure 6, one finding at ΔX = 5D0 is that the thrust coefficients of SYC3 and YC3 + SYC3 seem to be lower than that of YC3 in all the wake cases. This may be due to that the static yawed inflow conditions can reduce the equivalent windward area of the wind rotor resulting in the loss of the aerodynamic load. Another finding is that the fluctuations of thrust coefficient of YC3 + SYC3 are more violent than the other two cases. Due to the violent fluctuations, some thrust coefficient values of YC3 + SYC3 at the maximum points even exceed the values of YC3 marginally. This may be explained by that the combination of the two yawed inflow make the actual inflow condition more complex, which could lead to greater fluctuations of aerodynamic load. The third finding is that the fluctuations of thrust coefficient of the three yawed inflow conditions in wake case (b) are more complex than those in wake cases (a) and (c), which makes the corresponding time varying ripples of thrust coefficient curve more complex. The main reason may be that the wake case (b) has higher turbulent intensity and more unsteady wind velocity distribution, which could aggravate the fluctuations of aerodynamic load.
As seen in Figure 7, similar findings can be found at ΔX = 10D0. The thrust coefficients of YC3 are still the largest and the thrust coefficient fluctuations of YC3 + SYC3 are still the most violent in the three wake cases. However, although the fluctuation amplitudes and frequencies of the three yawed inflow conditions are still the largest in wake case (b), the trends are not presented as significant as those at ΔX = 5D0. This could be explained by the recovery of the wake flow with the increasing downstream distance at the far wake region.
In order to analyze the aerodynamics of yawed inflow conditions under different wake cases more specifically, the mean values, the variations, and the variances of the thrust coefficients ( C ¯ T , ξ C T , δ C T 2 ) are defined and calculated as follows:
C ¯ T = k = 1 m C T , rotor k / m ,
ξ C T = C T , rotor ( max ) C T , rotor ( min ) 2 C ¯ T ,
δ C T 2 = k = 1 m ( C T , rotor k C ¯ T ) 2 m 1 ,
where m denotes the number of analyzed points during the selected time period; C T , rotor k denotes the thrust coefficient at the kth point (k = 1~m); C T , rotor ( max ) and C T , rotor ( min ) denote the maximum and minimum values of the thrust coefficient, respectively.
The results are listed in Table 4. As seen from the results of C ¯ T , all the values under YC3 are maximums in each wake case, as highlighted in bold. For example, in wake case (a), the values of C ¯ T under YC3 (0.4296 at ΔX = 5D0 and 0.5143 at ΔX = 10D0) are larger than the values under SYC3 (0.3961 at ΔX = 5 D0 and 0.4787 at ΔX = 10D0) and the values under YC3 + SYC3 (0.3963 at ΔX = 5D0 and 0.4789 at ΔX = 10D0). As seen from the results of ξ C T , the values under YC3 + SYC3 are maximums in each wake case, as highlighted in bold. For example, in wake case (b), the values of ξ C T under YC3 (0.0978 at ΔX = 5D0 and 0.0751 at ΔX = 10D0) are obviously larger than the values under YC3 (0.0337 at ΔX = 5D0 and 0.0085 at ΔX = 10D0) and the values under SYC3 (0.0165 at ΔX = 5D0 and 0.0091 at ΔX = 10D0). As for the results of δ C T 2 , compared with the values of all the yawed inflow conditions, the values in wake case (b) are larger than the other wake cases, as highlighted in bold. Take YC3 at ΔX = 5D0 for instance, the value of δ C T 2 in wake case (b) is 0.0160, while the value in wake case (a) is 0.0018 and the value in wake case (c) is 0.0038. This phenomenon indicates that the fluctuations of thrust coefficient of the yawed inflow conditions are more unstable in wake case (b) which should be further studied. The specific data shown in Table 4 can fully validate the findings from Figure 6 and Figure 7.
According to the discussions in this subsection, the aerodynamics of a downstream OFWT under the three yawed inflow conditions in wake case (b) will be further analyzed in the following subsections.

3.2. Dynamic Yawed Inflow

In this subsection, the thrust coefficients of the wind rotor in wake case (b) at ΔX = 5D0 under different dynamic yawed inflow conditions are firstly demonstrated, as shown in Figure 8. As seen from the figure, with the increment of the yaw motion frequency and amplitude, the fluctuations of the thrust coefficient become more violent. However, this trend is not significant. To understand the influences of the yaw motion on the aerodynamics of a downstream OFWT more deeply, the normal forces at 0.2R0 section and 0.8R0 section of the blade are calculated and included in the analyses as shown in Figure 9.
As seen in Figure 9, the normal forces on the blade sections present similar trends with the thrust coefficient, i.e., with the increment of the yaw motion frequency and amplitude, the fluctuations of the normal force become more violent. This is because the thrust coefficient is calculated from the normal force at all the blade sections, as seen in Equations (12), (18) and (19). However, the normal force at 0.8R0 section of the blade seems to be larger and fluctuating more violently than the normal force at 0.2R0 section of the blade. Specifically, the mean values, variations, and variances of normal force at the two sections of the blade are listed in Table 5. The mean values of normal forces at each section are nearly the same under different inflow conditions. However, with the increment of the yaw motion frequency and amplitude from FC to YC3, both the variations and the variance of normal forces increase, which indicates that the normal forces fluctuate more violently and complicatedly. Especially at 0.8R0 section of the blade, the mean values of normal forces in all the inflow conditions are quite larger than those at 0.2R0 section of the blade, and the variations and the variances of normal forces increase more obviously from FC to YC3. This can be explained by the more complex wind velocity distribution experienced by the blade section near the outer edge of the wind rotor (i.e., near the blade tip).
To further illustrate the harmful influences of the higher frequency and larger amplitude of the yaw motion, the fast Fourier transform (FFT) of the time series normal force at 0.8R0 section of the blade is conducted, and the results are shown in Figure 10. As seen from the figure, the yaw motions do not significantly affect the 1P (once per revolution, introduced by the wind rotor rotation) or 3P (thrice per revolution, introduced by the blade rotation) component. However, they result in several other components (around 0.12 Hz and 0.28 Hz) which can be observed on both sides of the 1P component. With the increment of the yaw motion frequency and amplitude, these components are strengthened. This phenomenon will increase the possibility of the wind rotor resonance, which is not conducive to the safety of the OFWT structure.
It can be concluded from the above analysis that higher frequency and larger amplitude of yaw motion can take harmful influences on the blade, especially on the position near the blade tip. Thus this condition should be carefully controlled in actual engineering in considerations of the fatigue and service life of the OFWT blade.

3.3. Static Yawed Inflow

In this subsection, the thrust coefficients of the wind rotor in wake case (b) at ΔX = 5D0 under different static yawed inflow angles are demonstrated. As seen from Figure 11, with the increment of the static yawed angle (from 2° in SYC1 to 20° in SYC3), the mean value of the thrust coefficient decreases. To be more specific, in the platform fixed case (FC, 0°), the mean value of the thrust coefficient is 0.6143, while from SYC1 to SYC3 (2°, 10°, 20°), the mean values of the thrust coefficient are 0.6131, 0.6024 and 0.5757, respectively. However, the changes in the fluctuations of these cases are not significant. It indicates that the static yawed inflow angle has greater influences on the mean value characteristic of the aerodynamics and less on the fluctuation characteristic of the aerodynamics. This finding can be explained by that the static yawed inflow can reduce the effective wind capturing area of the wind rotor, and this behavior is actually static. To fully prove this finding, the normal forces at 0.2R0 section and 0.8R0 section of the blade are also calculated, and the results are shown in Figure 12.
As seen from Figure 12, similar findings can be obtained in both the normal forces at 0.2R0 section and 0.8R0 section of the blade. However, from 0° to 20° static yawed angle, the mean normal force at 0.2R0 section of the blade is reduced by 11.82% (0.914 × 10³ N/m to 0.806 × 10³ N/m), and the mean normal force at 0.8R0 section of the blade is only reduced by 4.39% (5.836 × 10³ N/m to 5.580 × 10³ N/m). That means the static yawed angle has a greater influence on the forces near the blade root. The finding is quite different from the dynamic yawed inflow conditions in Section 3.2 which have a greater influence on the forces near the blade tip. The main reason for the results of Section 3.2 may be that the aerodynamic force near the blade tip is more susceptible to dynamic motions in the wake because it is farther from the center of rotation. However, for the static yawed inflow conditions here, the aerodynamic force near the blade tip is not as susceptible as that near the blade root, because the blade root may be closer to the wake boundary area which has severe turbulence.
From the perspective of physical intuition, the directions of static yawed inflow will also have considerable influences on the aerodynamics in the complex asymmetric wake flow field such as the wake case (b). To analyze the influences, the static yawed inflow direction is defined, as shown in Figure 13. The positive value of static yawed inflow angle is defined as leaving away from the central wake area counterclockwise, as seen in Figure 13(left); the negative value is defined as closing to the central wake area clockwise, as seen in Figure 13(right). The static yawed angle is set to be 0°, 20° and −20 °, respectively. The thrust coefficients of the wind rotor and the normal forces at 0.2R0 section of the blade under these static yawed angles are calculated and the results are shown in Figure 14.
As seen from Figure 14a, the thrust coefficient is reduced due to the existence of the static yawed angle. Nevertheless, the reduction of thrust coefficient under static yawed angle −20° is smaller than that under static yawed angle 20°. In other words, the mean value of thrust coefficient under static yawed angle −20° is larger than that under static yawed angle 20°. Specifically, compared with the mean value of thrust coefficient under no yawed condition (0.6143), the mean values of thrust coefficient under static yawed angle −20° and 20° are 0.5922 (reduced by 3.60%) and 0.5757 (reduced by 6.28%), respectively. This phenomenon may be caused by “time lag”, that is, the longer downstream distance along the central wake means that the wind reaches the wind rotor later, not to mention that the wind velocity in the central wake area is small inherently. In addition, the directions of static yawed inflow, i.e., the signs of static yawed angle, have less influence on the fluctuation characteristic of thrust coefficient. For the normal force at 0.2R0 section of the blade, as shown in Figure 14b, the signs of static yawed angle have significant influences. The mean normal force under static yawed angle −20° is greater while the mean normal force under static yawed angle 20° is smaller than that under no static yawed inflow condition (FC, static yawed angle 0°). Similarly, the signs of static yawed angle also have less influence on the fluctuation characteristic of the normal force.

3.4. Coupled Yawed Inflow

In order to analyze the influences of coupled yawed inflow conditions on the aerodynamics of an OFWT, the thrust coefficients of wind rotor and normal forces of the blade in YC3 coupled with SYC1~SYC3 as listed in Table 3 are calculated and analyzed in this subsection. The results of thrust coefficients are shown in Figure 15, and the results of normal forces at 0.2R0 section of the blade and at 0.8R0 section of the blade are shown in Figure 16.
As seen in Figure 15a, the fluctuation of thrust coefficient in YC3 + SYC2 is more violent than those in YC3 + SYC1 and FC. Specifically, the variations of the thrust coefficient in YC3 + SYC2, YC3 + SYC1, and FC are 0.0719, 0.0488, and 0.0351, respectively. When the static yawed angle is smaller than the amplitude of yaw motion (dynamic yawed angle), the fluctuation of thrust coefficient in the coupled yawed inflow conditions is marginally slighter than that in the single dynamic yawed inflow condition. For example, the variation of thrust coefficient in YC3 + SYC1 is 0.0488 while the variation of thrust coefficient in YC3 is 0.0499. However, when the static yawed angle is larger than the dynamic yawed angle, the fluctuation of thrust coefficient in the coupled yawed inflow conditions is more violent than that in the single dynamic yawed inflow condition. It could be clearly seen that compared with 0.0499 in YC3, the variation of thrust coefficient in YC3 + SYC2 is 0.0719. As seen in Figure 15b, with the increment of the static yawed angle, the mean value of the thrust coefficient keeps decreasing and the fluctuation of thrust coefficient becomes more violent. Specifically, the mean values of the thrust coefficient in YC3 + SYC2 and YC3 + SYC3 are 0.6015 and 0.5745, while the variations of thrust coefficient in them are 0.0719 and 0.0984. As seen in Figure 15c, when the value of static yawed angle is negative (YC3 − SYC3), the mean value of thrust coefficient in the coupled yawed inflow condition increases, which is quite similar to that in single static yawed inflow condition. The fluctuation of the thrust coefficient under YC3 − SYC3 seems to be more violent than that under YC3 + SYC3. In addition, as clearly seen in the figure, when the thrust coefficient curve of YC3 + SYC3 is at the peak, the curve of YC3 − SYC3 is at the trough.
As seen in Figure 16, with the increment of the static yawed angle in the coupled yawed inflow conditions, both the fluctuations of normal forces at 0.2R0 and 0.8R0 sections of the blade become more violent and complex. Although the mean values of the normal forces seem to decrease, the trends are not significant. However, for the coupled yawed inflow condition when the static yawed angle is negative (YC3 − SYC3), things are quite different. At 0.2R0 section of the blade, the fluctuation of the normal force in YC3 − SYC3 is more violent and more complex than that in other conditions, while the trend at 0.8R0 section of the blade is just opposite. Specifically, the detailed data of mean value, variation, and variance of normal force at the two sections of the blade are listed in Table 6.
The FFT of the time series normal force at 0.2R0 section and 0.8R0 section of the blade is conducted and the results are shown in Figure 17. As seen from the figure, the coupled yawed inflow conditions from YC3 + SYC1 to YC3 − SYC3 result in multiple components which can be clearly observed around 1P and 3P components as indicated by the red arrows in the figure. However, the coupled yawed inflow conditions do not significantly affect the 1P and 3P components except YC3 − SYC3. The condition of YC3 − SYC3 at 0.2R0 section of the blade enhances the 1P component which can be seen in Figure 17a, while that at 0.8R0 section of the blade weakens the 1P component which can be seen in Figure 17b. These phenomena are also not conducive to the safety of the OFWT structure. Thus the coupled yawed inflow conditions should also be carefully controlled in actual engineering.

4. Experimental Validation

4.1. Experiments Set up

In order to validate the analysis results of the simulation in the above section, experimental tests are conducted on a set of dedicated apparatus. As shown in Figure 18, the apparatus consists of a wind generating system, an upstream scale model wind turbine (SMWT), a downstream SMWT, a yawed conditions generating mechanism, and a load cell. The wind generating system can provide a maximum 8 m/s wind flow field with a turbulent intensity about 0.22 in an area of 15.75 m × 3.2 m × 2.52 m (Length, width, height). The SMWTs are designed at a 1/80 scaling ratio with reference to the NREL 5-MW wind turbine, and the major components such as the blades and the towers are manufactured of carbon fiber by 3D printing technology. The upstream SMWT, mounted on a fixed base, is used to provide the wake conditions (the wake case (b) in this section). The downstream SMWT is mounted on the yawed conditions generating mechanism which is actually a Stewart platform. The Stewart platform can provide yaw motions or static yawed poses. The six-component load cell is installed between the nacelle and the tower to measure the thrust characteristics of the wind rotor.
During the tests, the downstream SMWT and the yawed conditions generating mechanism are located at a downstream distance of ΔX = 5D0 (7.875 m) and an offset of ΔY = R0 (0.7875 m) behind the upstream SMWT. The experimental wind speed is set to be 1.63 m/s and the tip speed ratios of the two SMWTs are both controlled to be 7. The yawed conditions in the tests are listed in Table 7. The data acquisition time is 60 s.

4.2. Validation

In the experiments, the thrust can be measured by the six-component load cell and then the thrust coefficient of the wind rotor can be calculated based on Equation (19).
The results of the thrust coefficients of wind rotor under dynamic yawed inflow conditions are presented in Figure 19. As seen from Figure 19a, due to the existence of the dynamic yawed condition, a clear increment of the fluctuation of thrust coefficient can be observed. As seen from Figure 19b, with the increment of yaw motion amplitude (from 5° to 10°), an increment of the fluctuation also can be observed. This phenomenon is clearer when the yaw motion frequency is larger (0.72 Hz), as observed from Figure 19c. Besides, as seen from Figure 19d, with the increment of yaw motion frequency (from 0.36 Hz to 0.72 Hz), a more violent fluctuation can be observed. For the dynamic yawed inflow conditions, the influence trends of the experimental data are in consistent with those of the simulation data as discussed in Figure 8 of Section 3.2. In order to illustrate the reliability of this validation, the mean values of the thrust coefficient of the experimental data in FC and YC are calculated and compared with the simulation data. The value of the experimental data in FC (0°, 0 Hz) is 0.5725, and the relative error is −6.28% compared with the value 0.6143 of the simulation data. The value of the experimental data in YC (5°, 0.72 Hz) is 0.5918, and the relative error is −3.60% compared with the value 0.6139 of the corresponding simulation data in YC3 (5°, 0.08 Hz).
The results of the thrust coefficients of wind rotor under static yawed inflow conditions are presented in Figure 20. As seen from figure, with the increment of the static yawed angle (from 0° to 20°), the thrust coefficient gradually decreases. However, when the static yawed angle is negative (−20°), the thrust coefficient increases. It is quite similar to the trends of the simulation results discussed in Figure 11 and Figure 14 of Section 3.3. The comparisons of mean thrust coefficients between the experimental data and the simulation data are also conducted. The experimental data values under static yawed angles 10°, 20° and −20° are 0.5615, 0.5319 and 0.5497, respectively. The corresponding relative errors are −6.79%, −7.61% and −7.18% compared with the values 0.6024, 0.5757 and 0.5922 of the simulation data, respectively.
The thrust coefficients of the wind rotor under the coupled yawed inflow conditions are presented in Figure 21. As seen from the figure, with the increment of static yawed angle (from 0° to 20°) in the coupled yawed condition, the thrust coefficient keeps decreasing and its fluctuation becomes more violent. However, when the static yawed angle is negative (−20°), the thrust coefficient increases which is also similar to that in the single static yawed inflow condition as discussed in Figure 20. The fluctuation of thrust coefficient under the condition (5° − 20°, 0.72 Hz) is more violent than that under the condition (5° + 20°, 0.72 Hz). Thus, for the coupled yawed inflow conditions, the influence trends of the experimental data are in consistent with those of the simulation data as discussed in Figure 15 of Section 3.4. The values of the experimental data under coupled yawed conditions (5° + 10°, 0.72 Hz), (5° + 20°, 0.72 Hz) and (5° − 20°, 0.72 Hz) are 0.5488, 0.5090 and 0.5205, respectively, and the corresponding relative errors are −8.76%, −11.40% and −11.99% compared with the values 0.6015, 0.5745 and 0.5914 of the simulation data.
From the above discussions, it can be roughly concluded that the thrust characteristics of a downstream OFWT under dynamic, static, and coupled yawed inflow conditions from the simulations are validated by the experimental testing data.

5. Conclusions

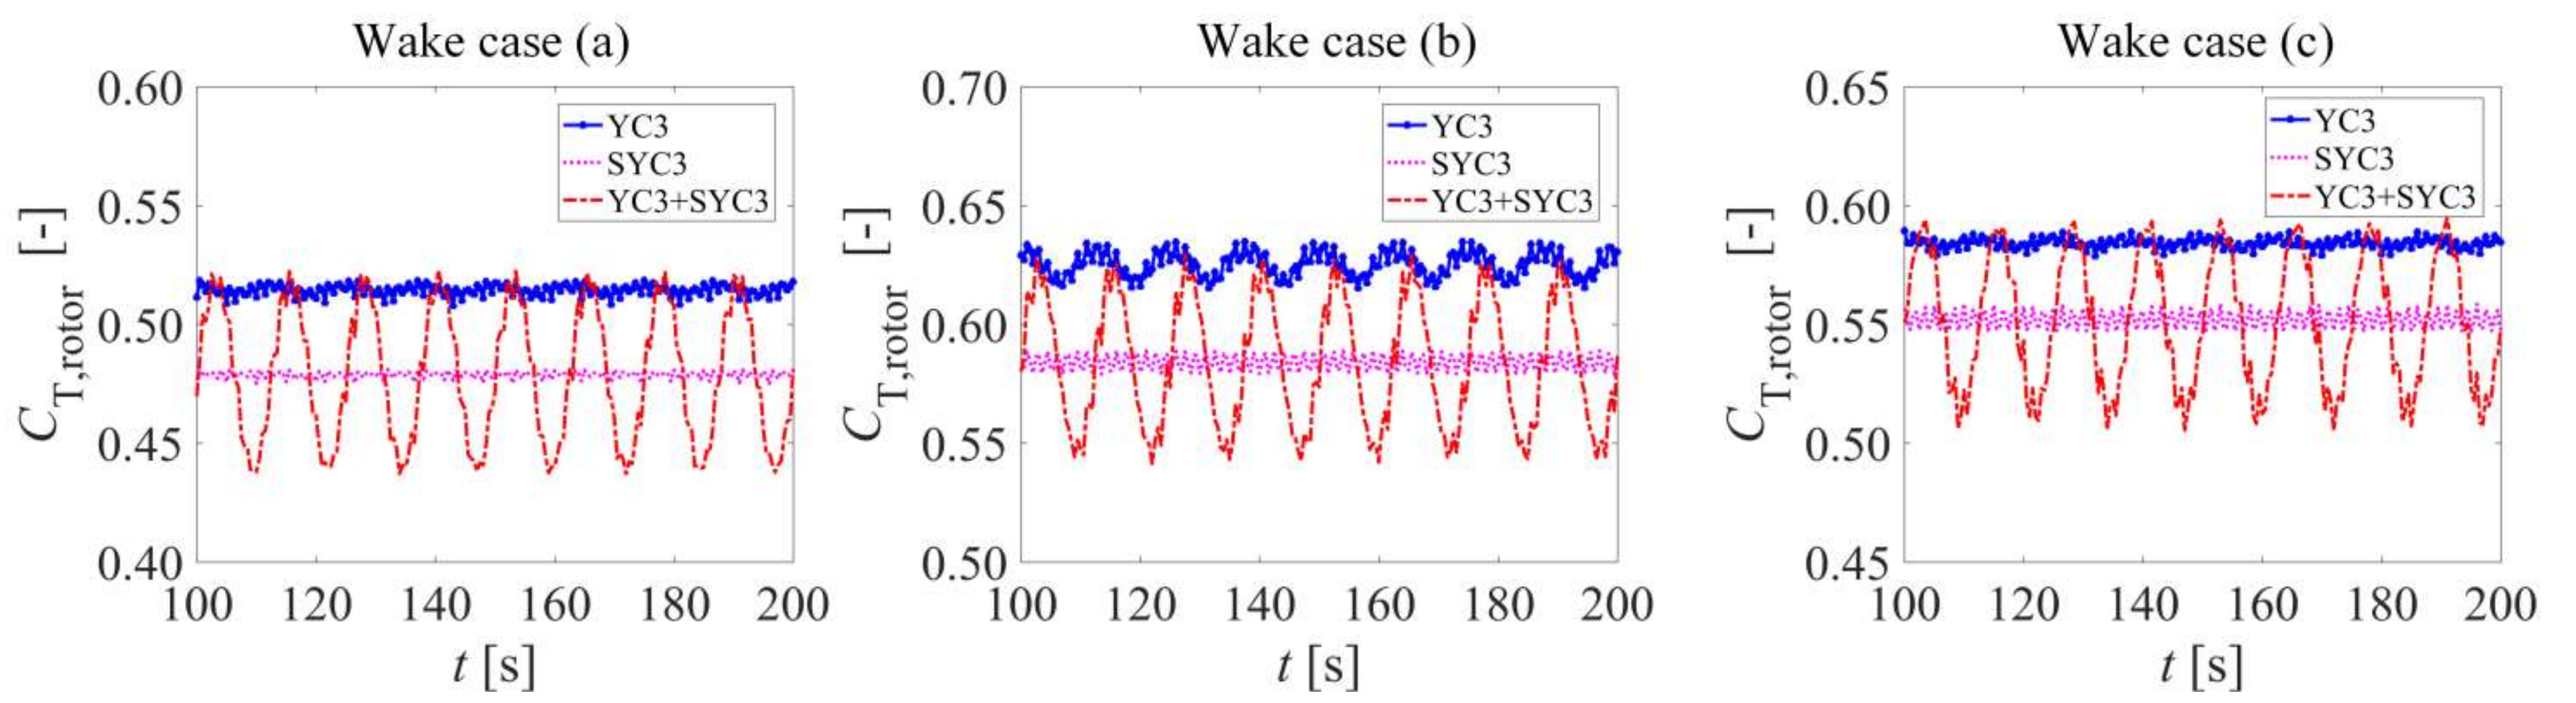
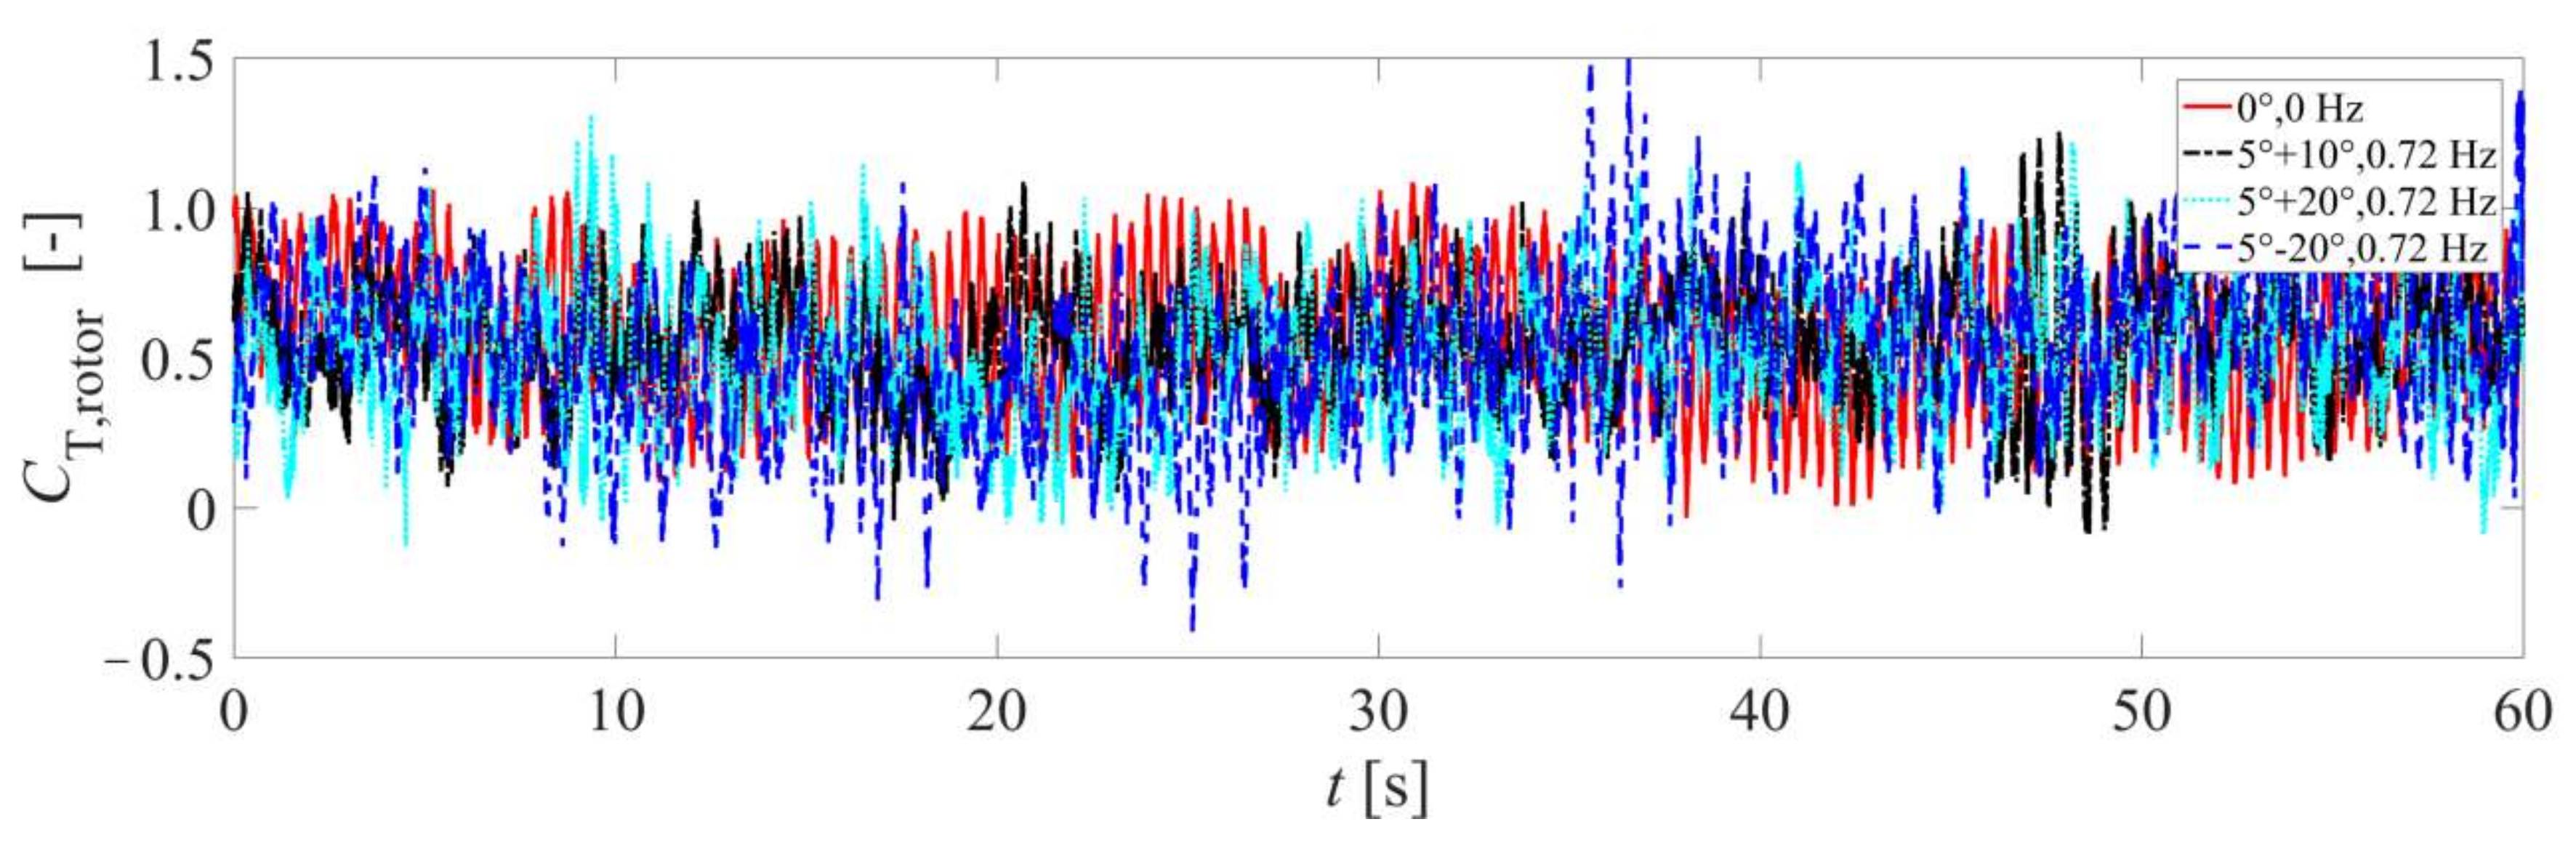
In this study, the aerodynamics of a downstream NREL 5-MW OFWT in the wake flow under dynamic, static, and coupled yawed inflow conditions are investigated based on the FAST simulations. According to the simulation results, the three yawed inflow conditions have more significant influences on the thrust characteristics in wake case (b) than in wake cases (a) and (c). Thus the following discussions are all conducted in wake case (b).
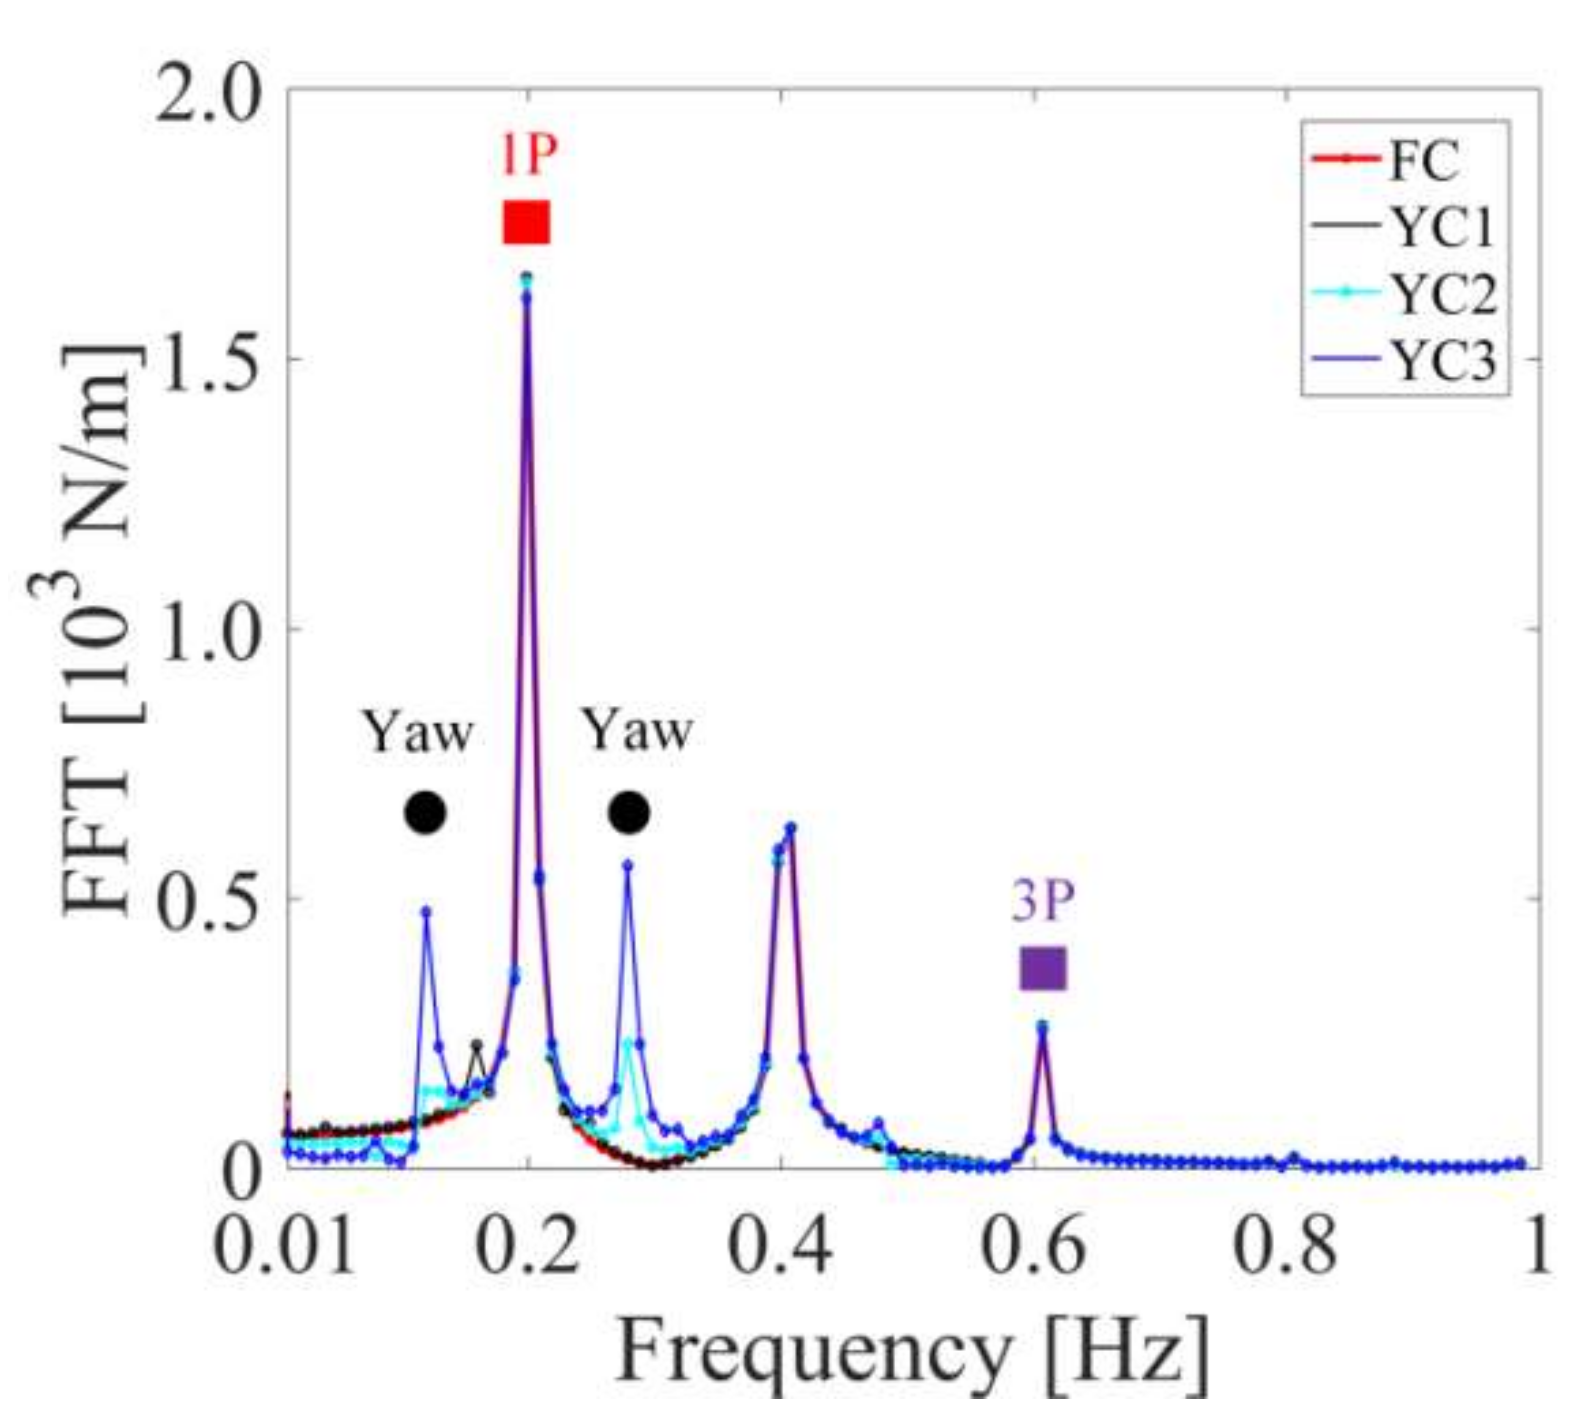
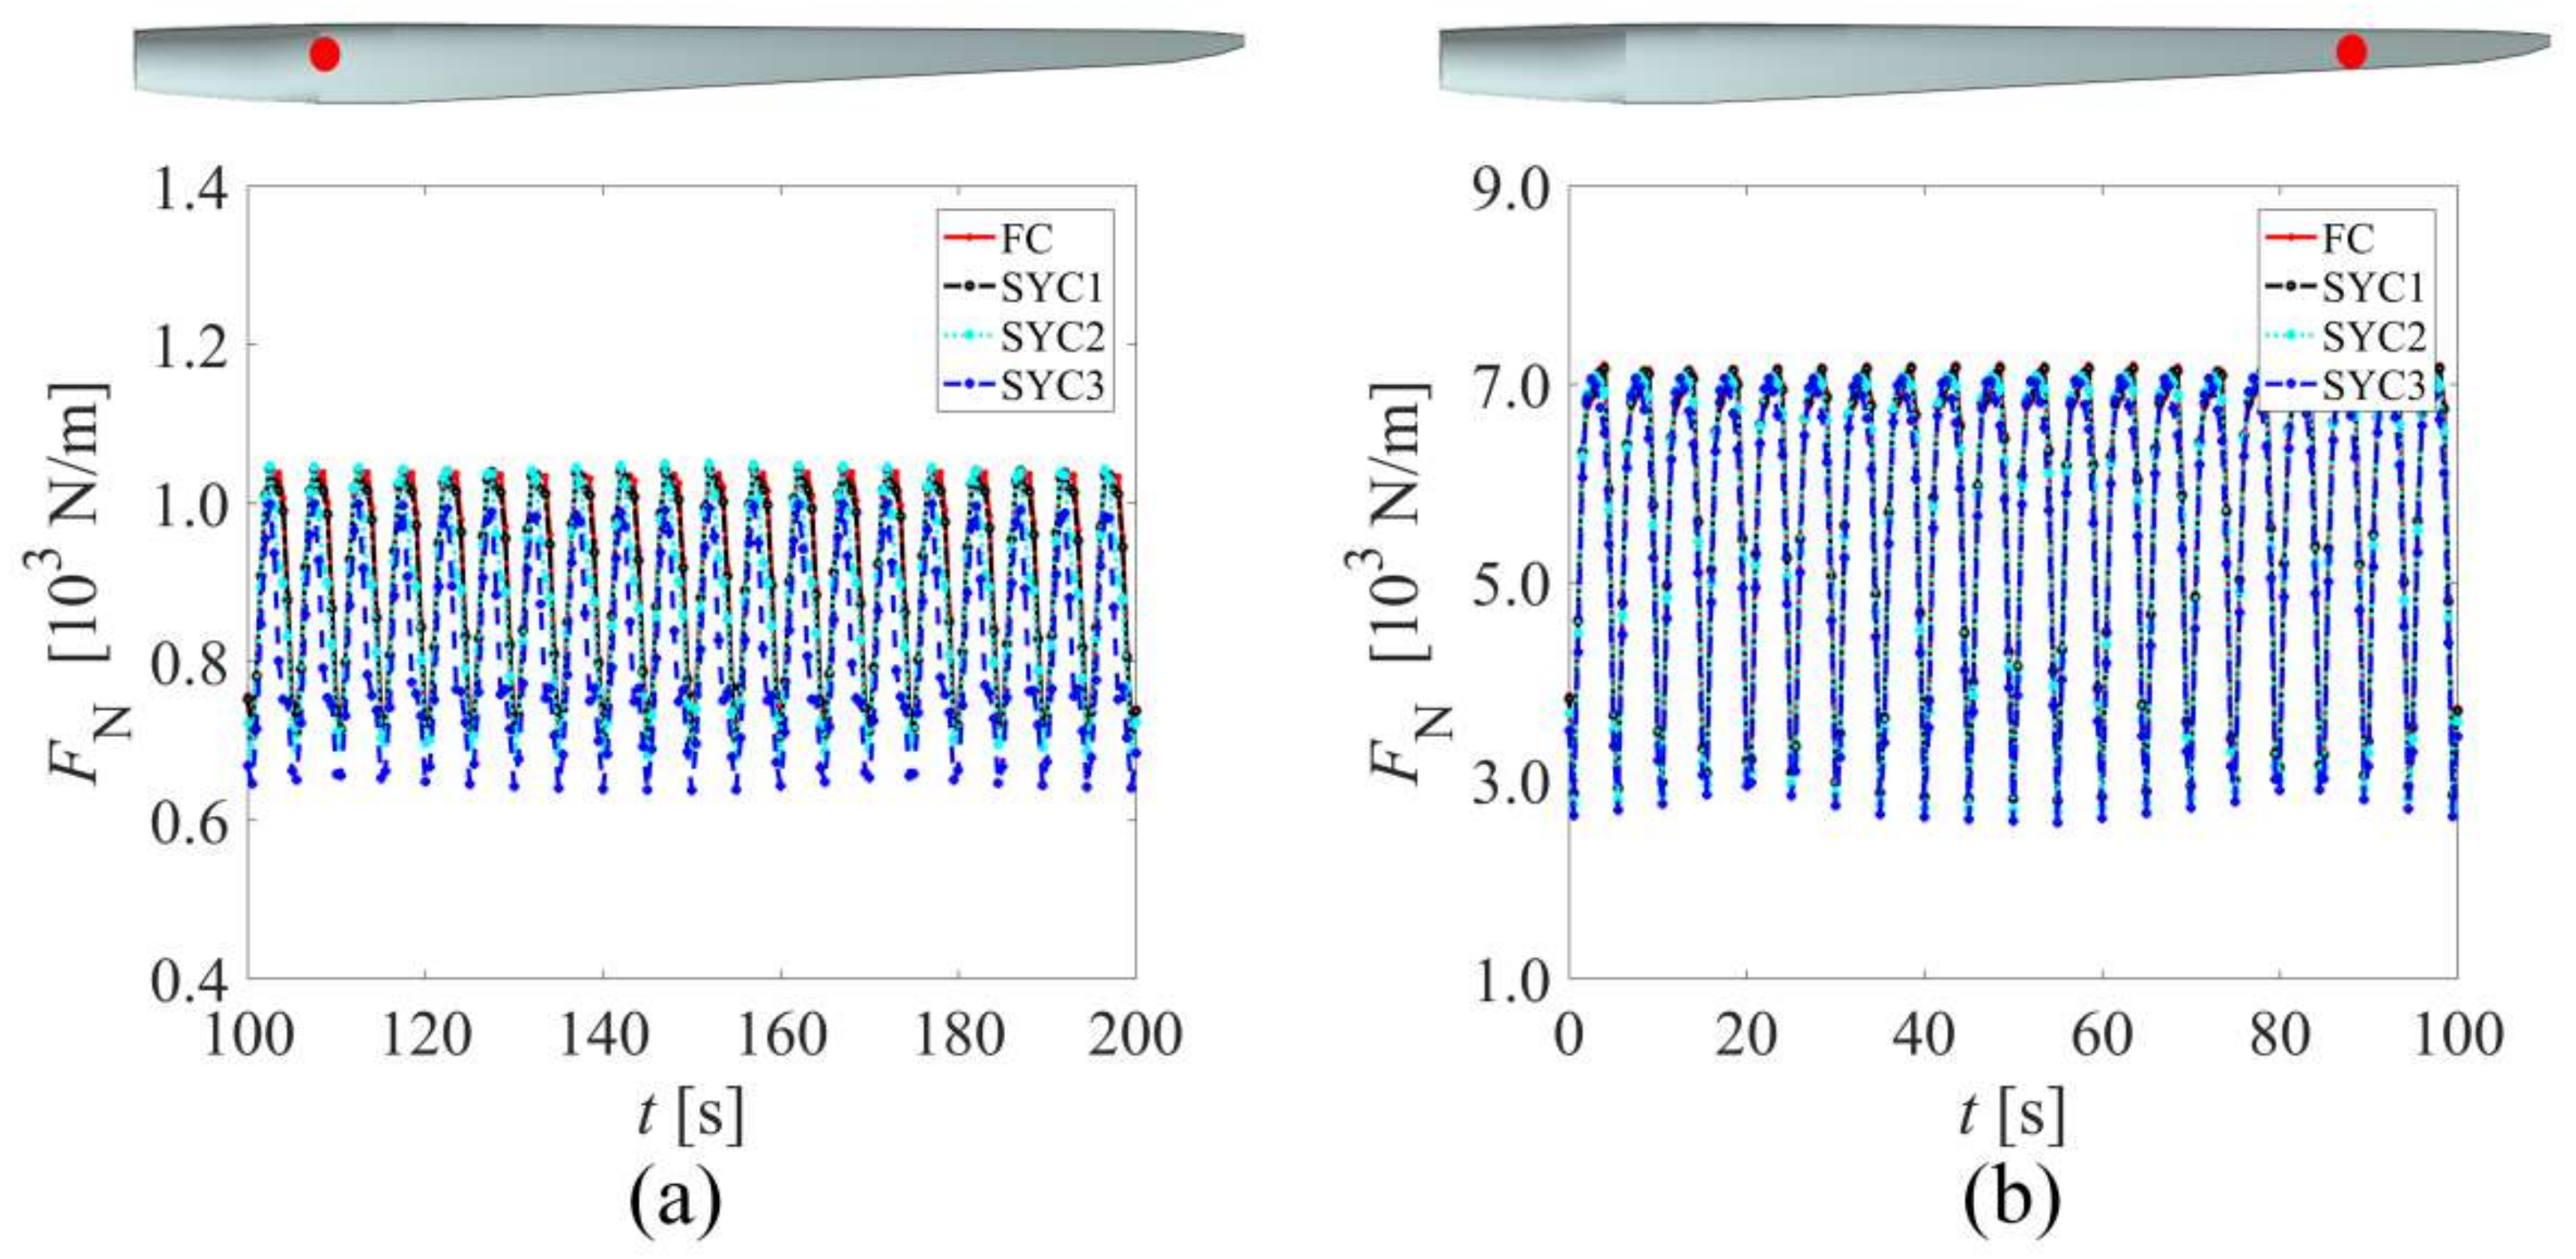
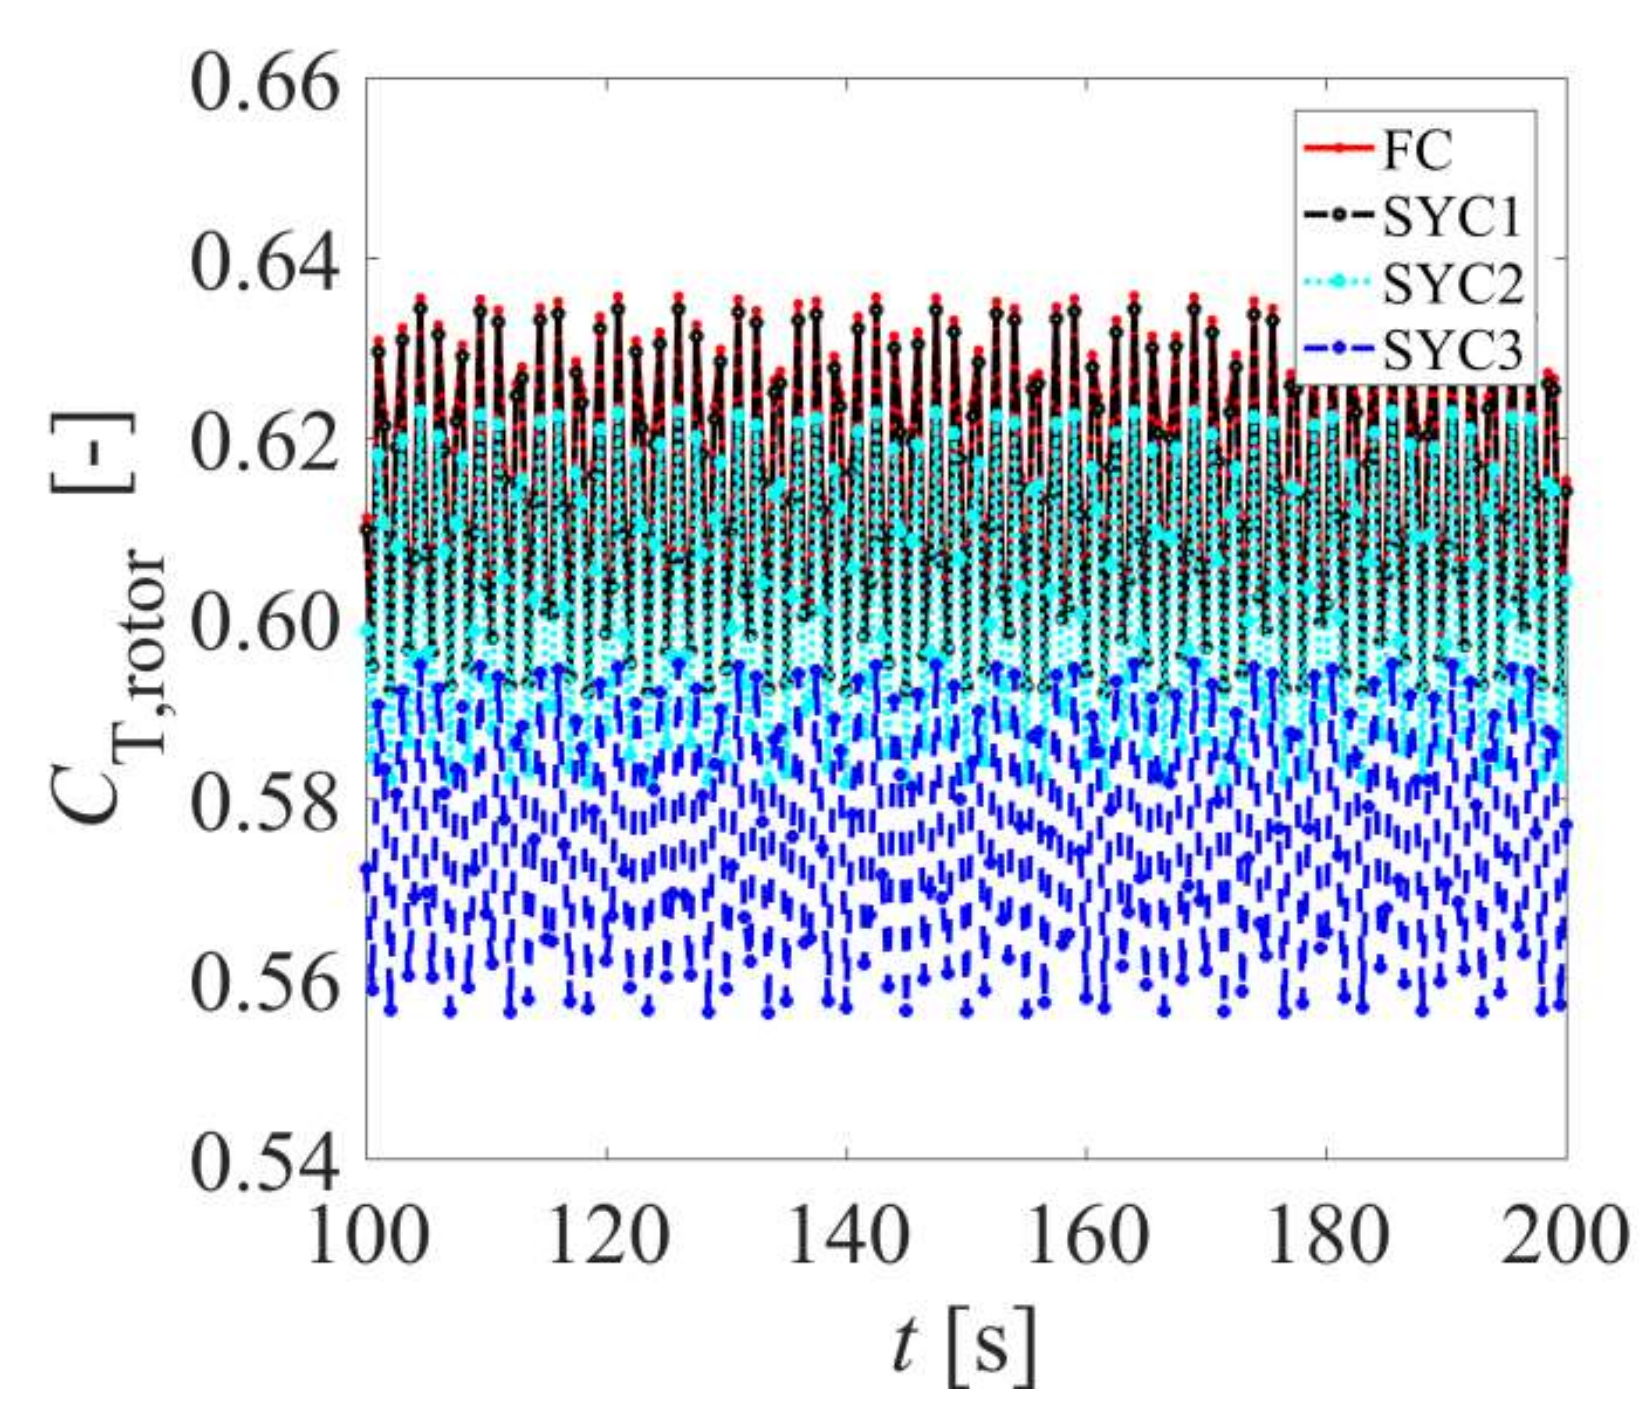
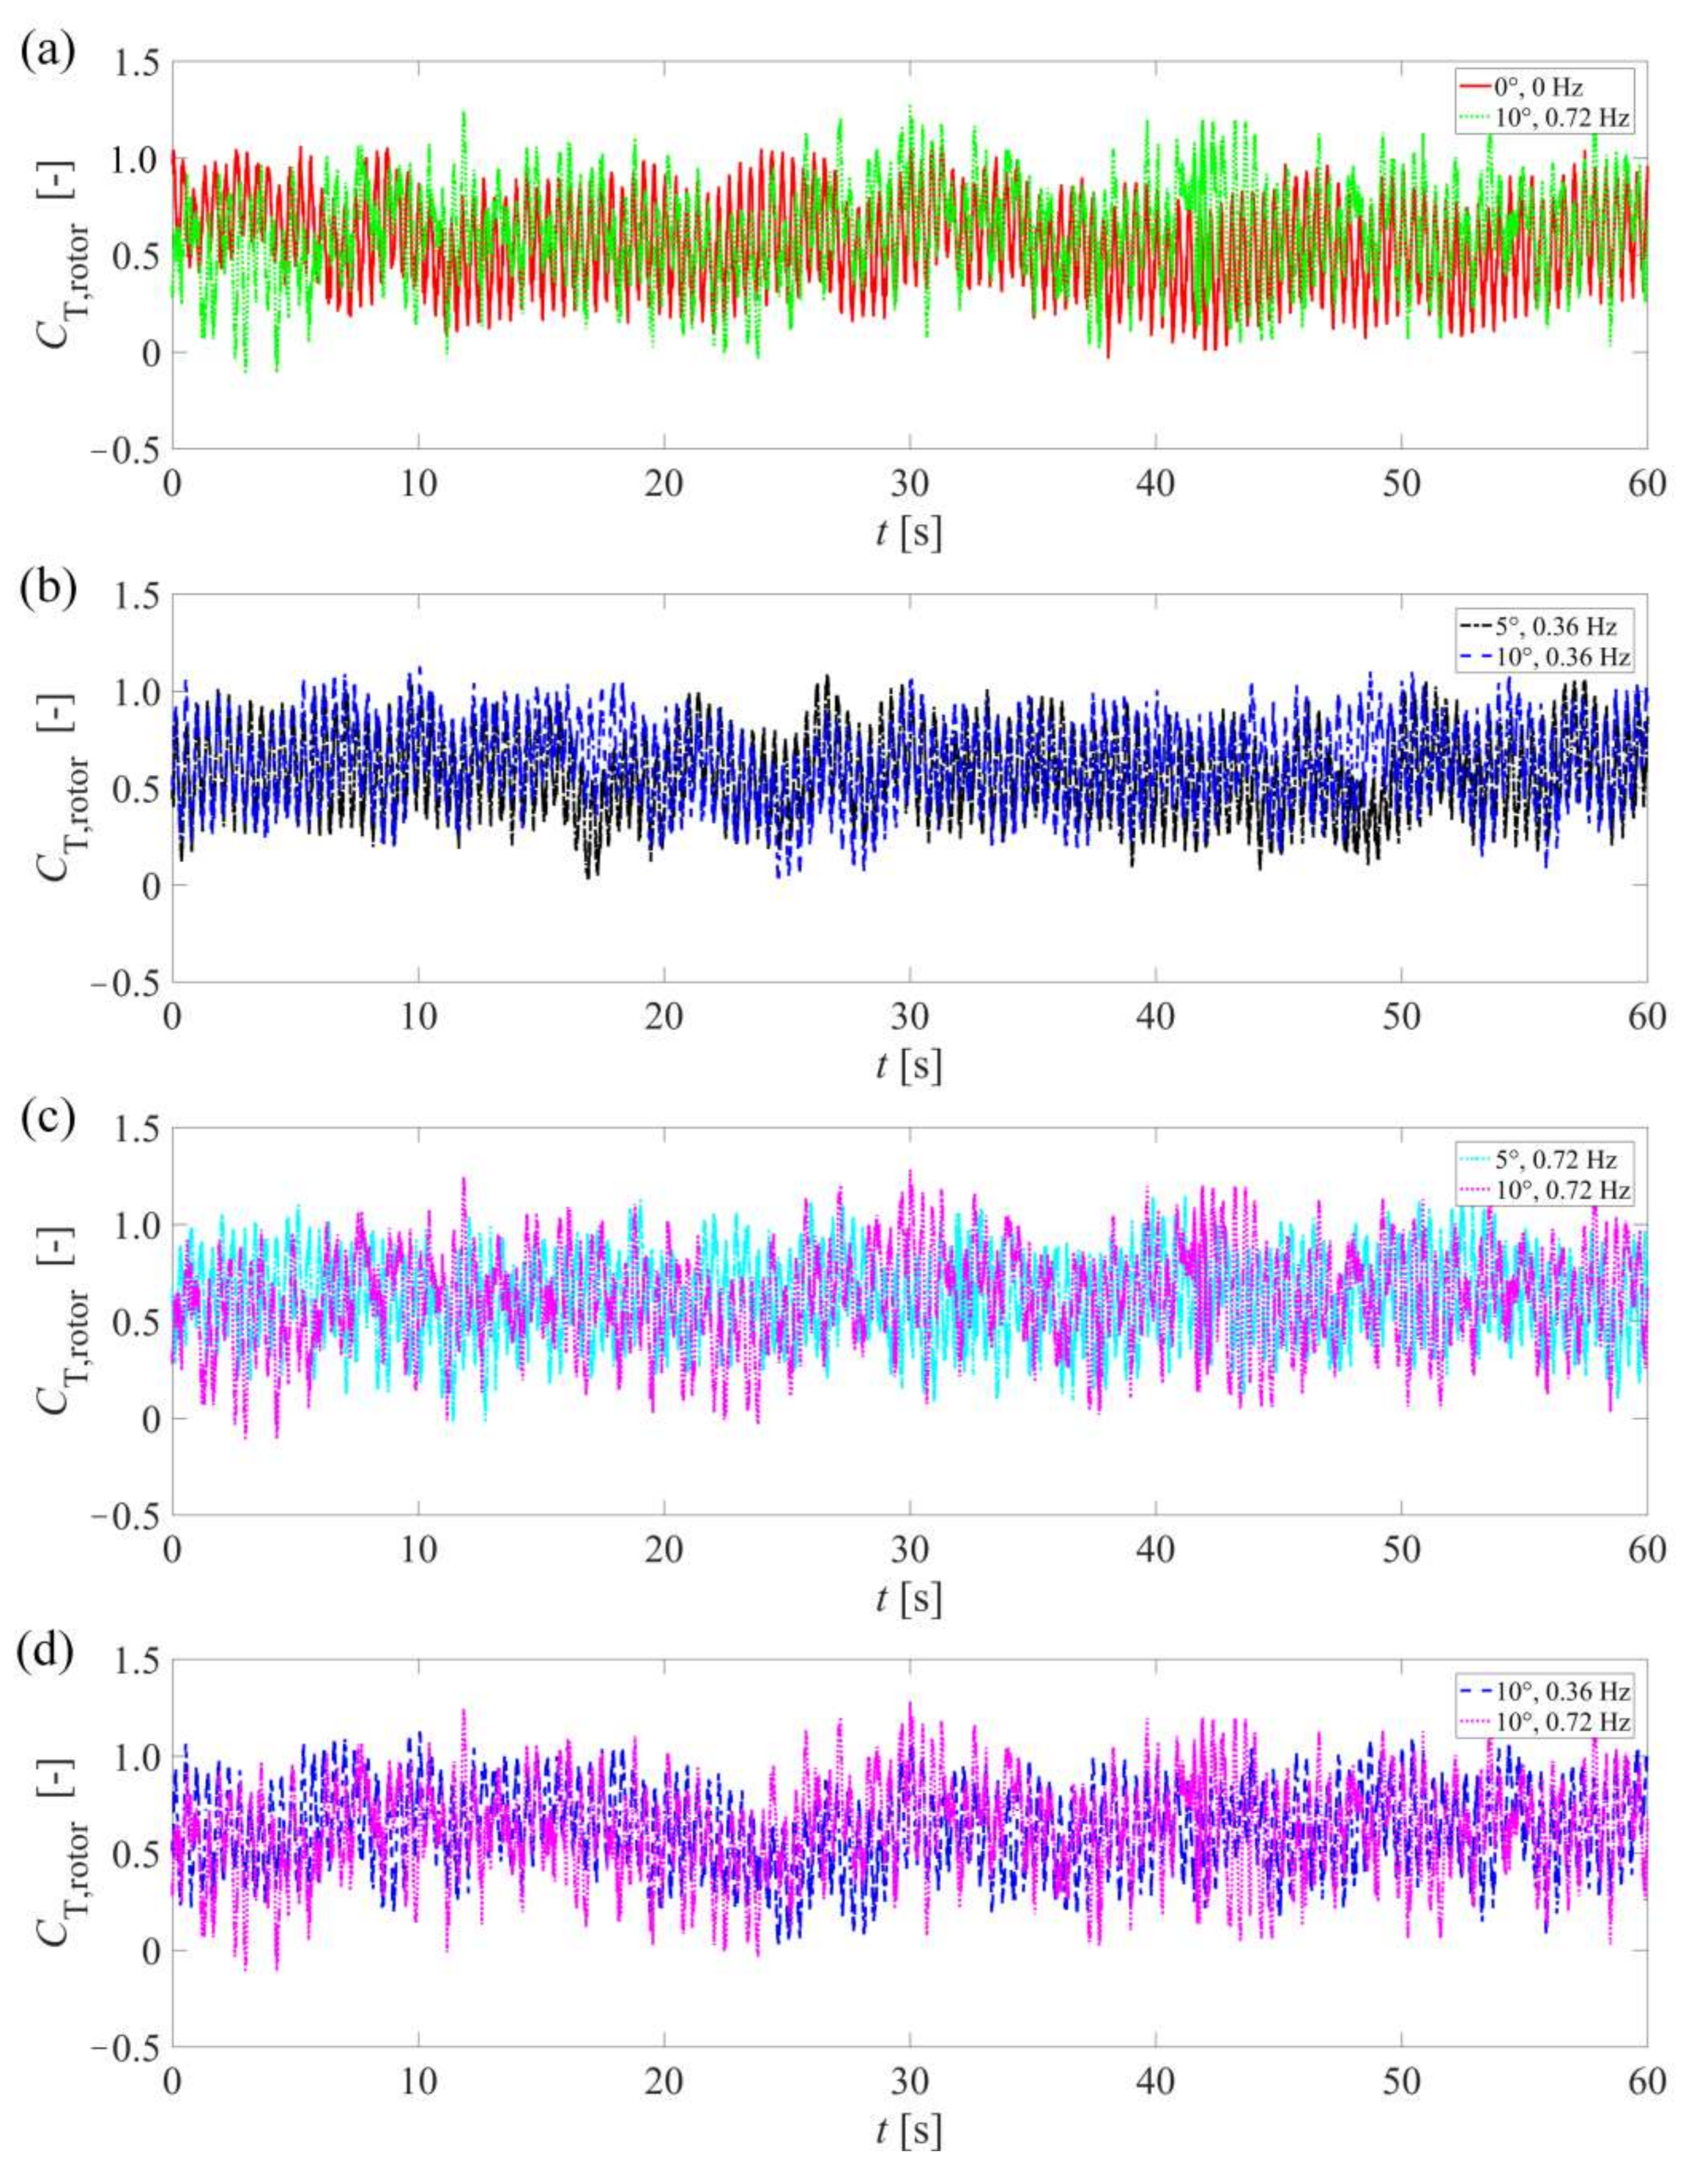
For the dynamic yawed inflow conditions, the thrust coefficient fluctuates more violently with the increment of the yaw motion frequency and amplitude. The normal forces present similar trends, but the normal force near the blade tip fluctuates more violently and complicatedly than that near the blade root. Significant components can be observed around the 1P of FFT of normal force, which indicates higher yaw motion frequency and amplitude are not conducive to the safety of the OFWT structure.
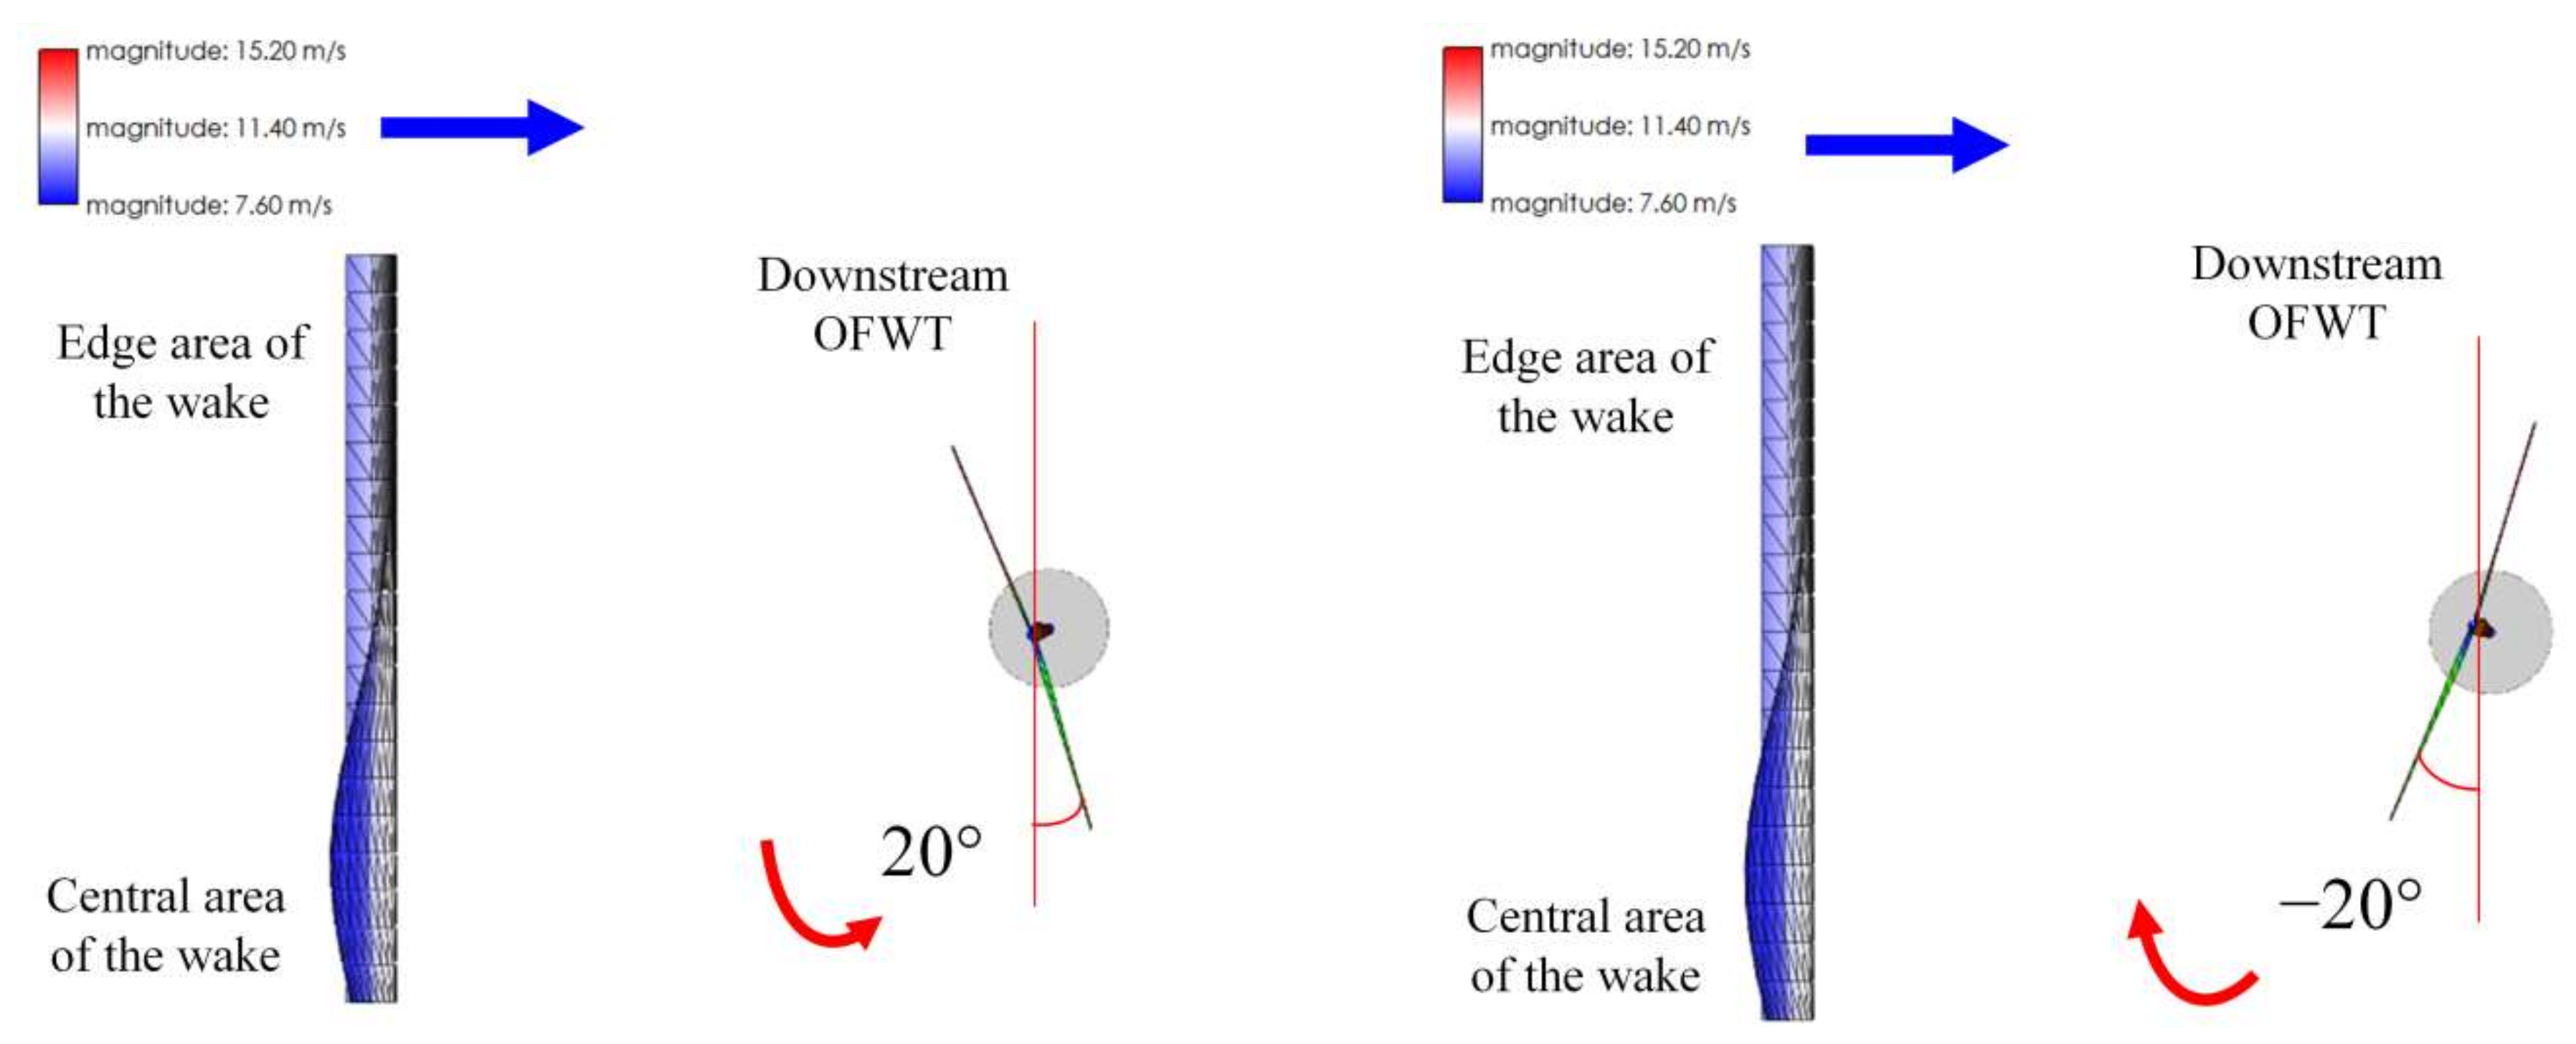
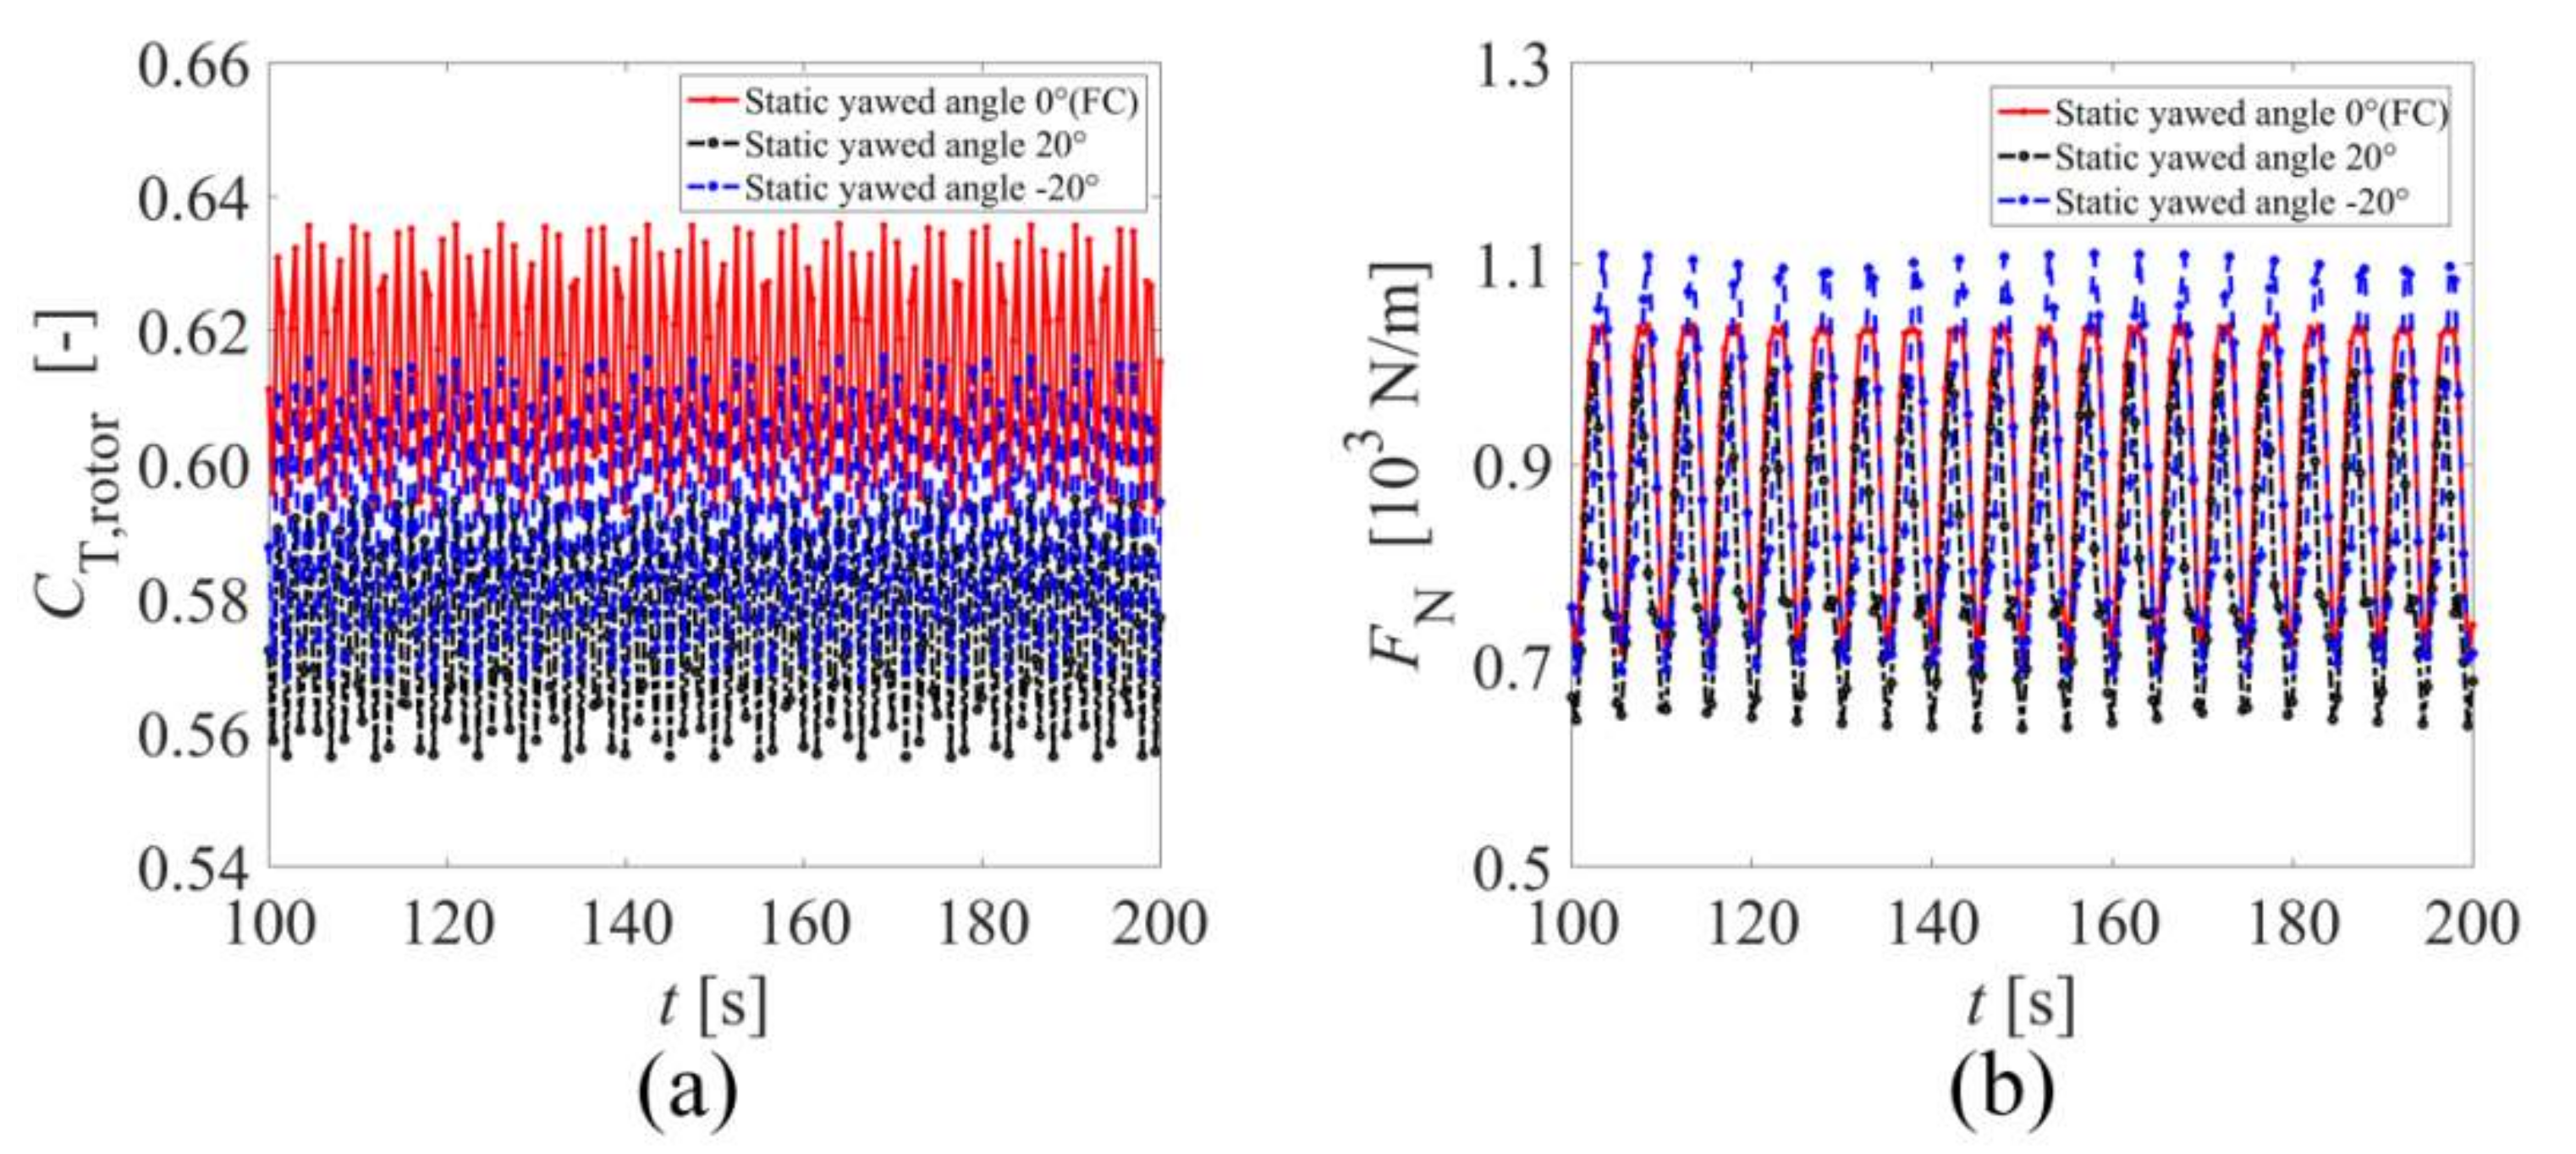
For the static yawed inflow conditions, the thrust coefficient decreases with the increment of the yawed angle, but the fluctuation does not change much. The normal forces present similar trends, but the normal force near the blade root is reduced more than that near the blade tip. Both the thrust coefficient and the normal force under the negative static yawed angle are larger than those under the corresponding positive one.
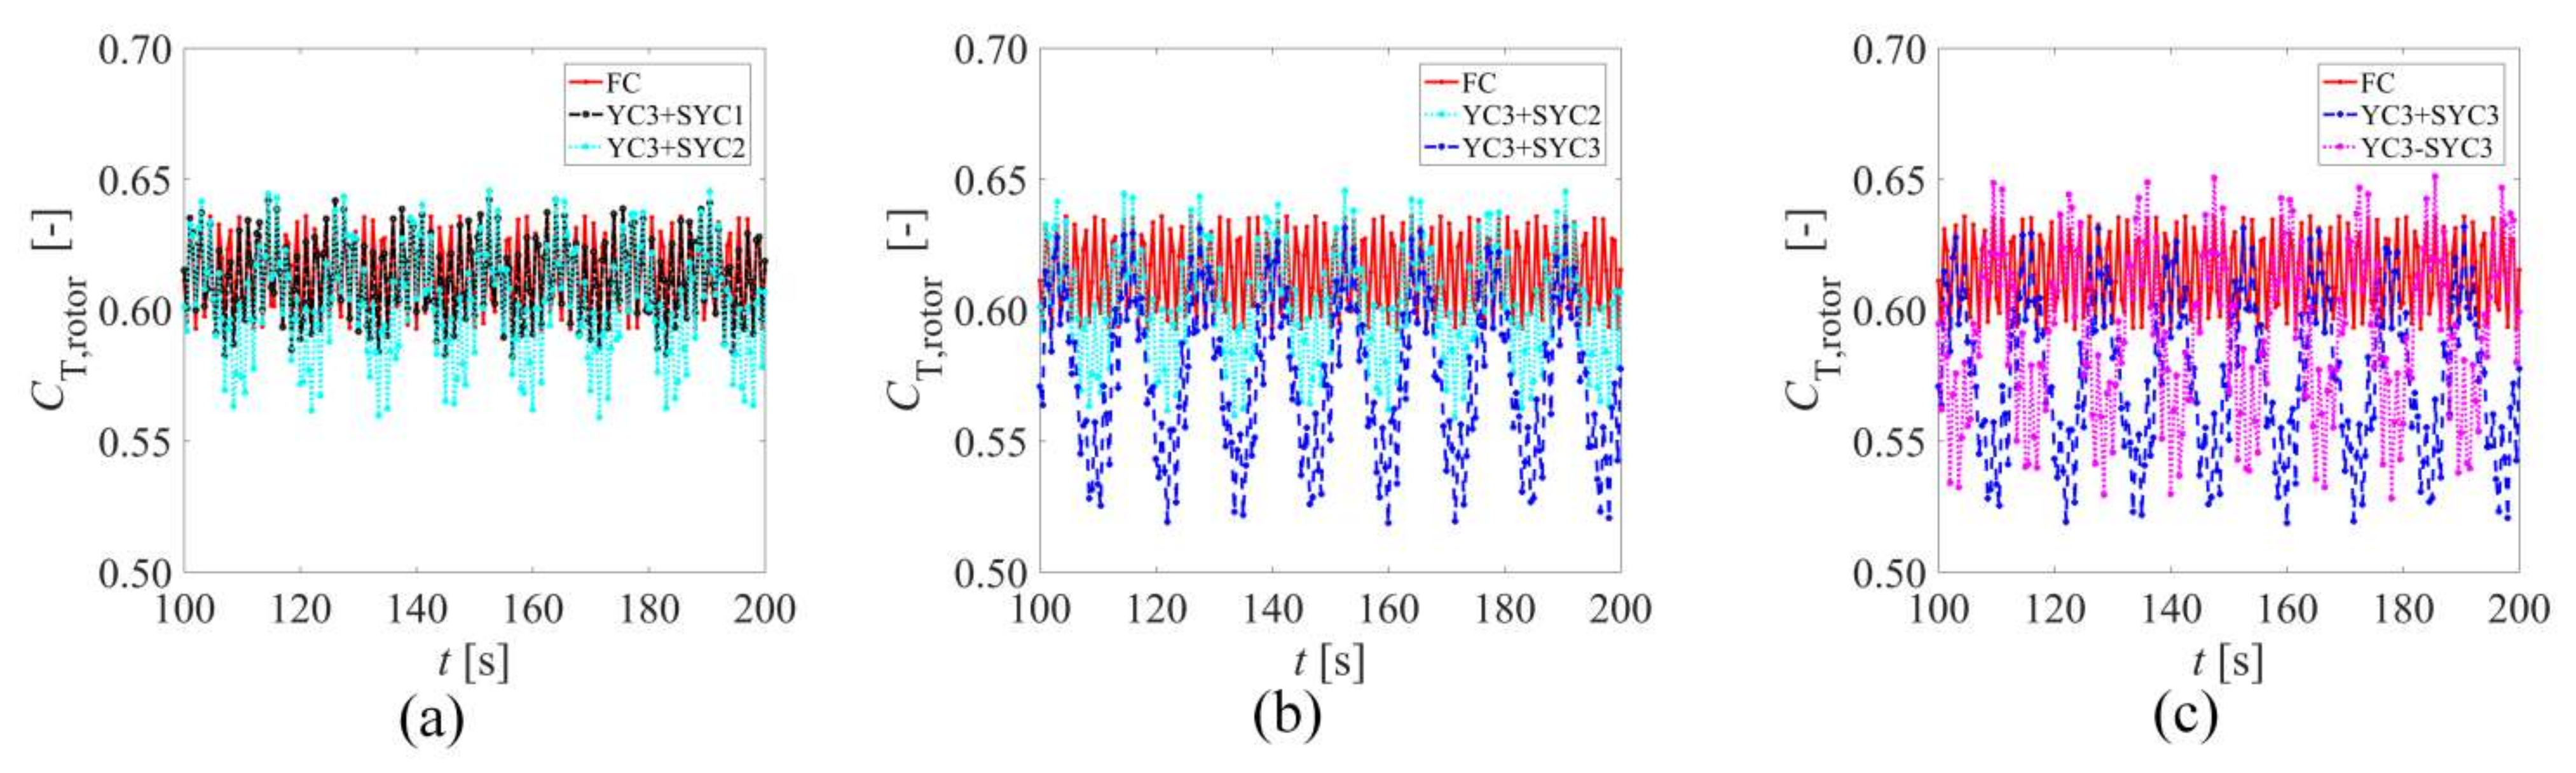
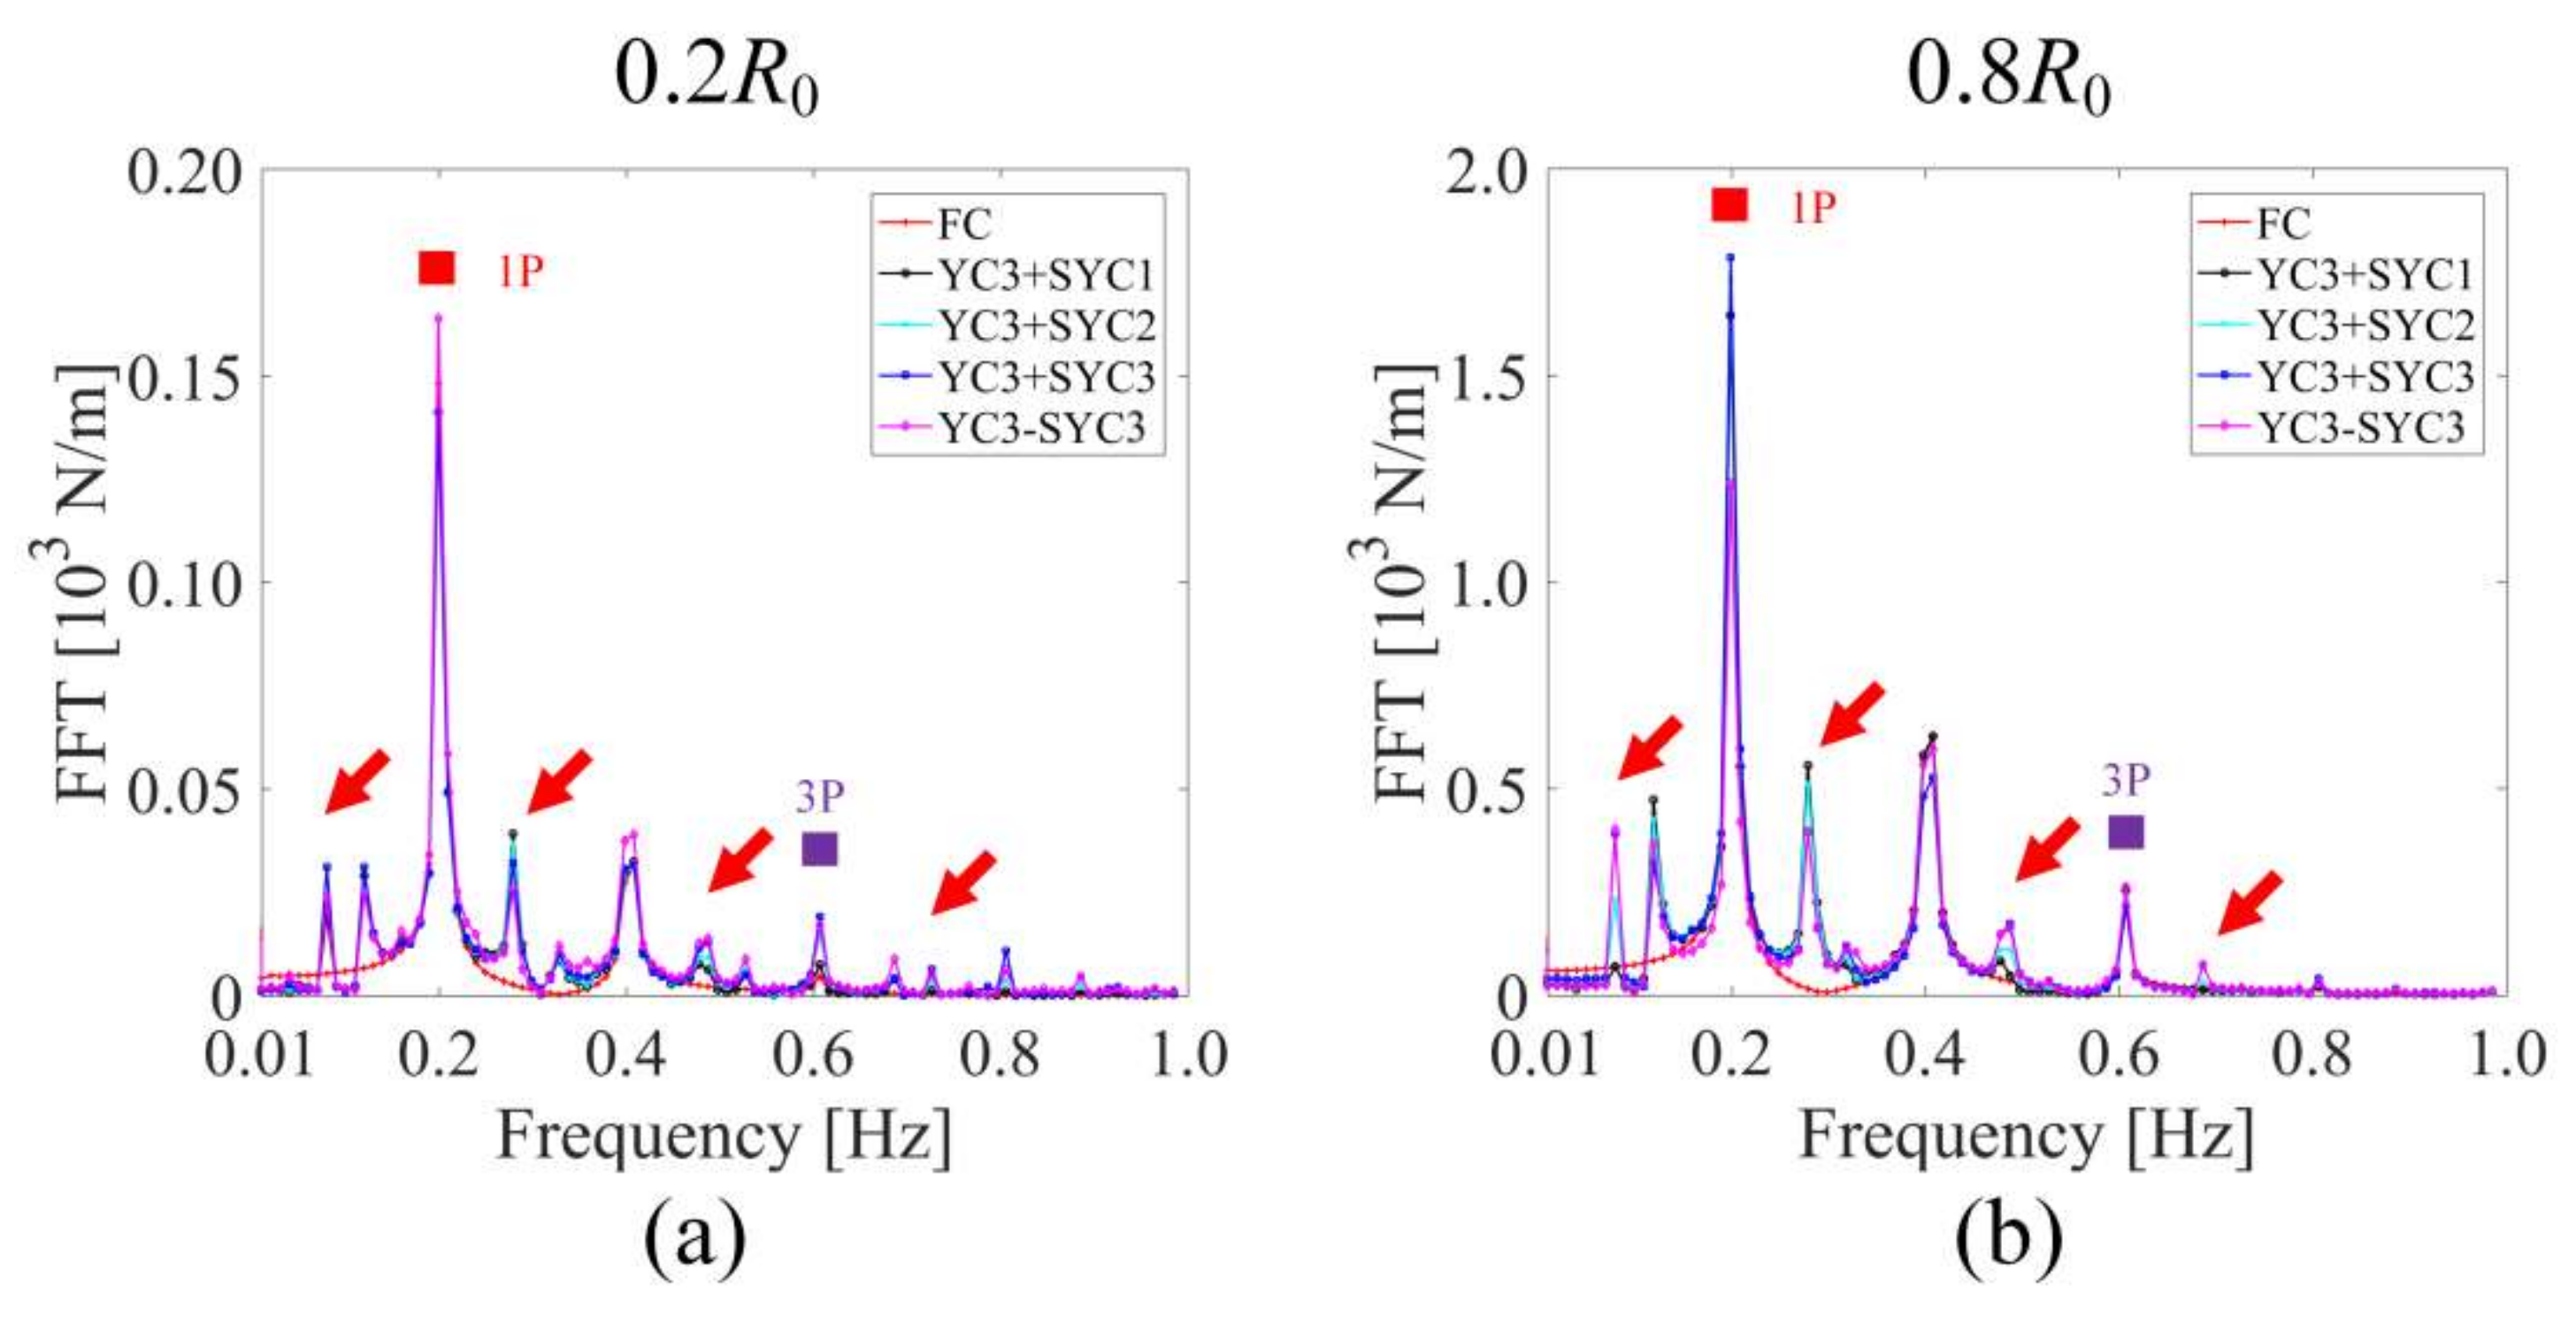
For the coupled yawed inflow conditions, although the thrust coefficient decreases with the increment of static yawed angle of the coupled inflow condition, it fluctuates more violently. The normal forces present similar trends but are not as significant as the thrust coefficient. Both the thrust coefficient and the normal force under the negative static yawed angle are larger, and they fluctuate more violently than those under the corresponding positive one.
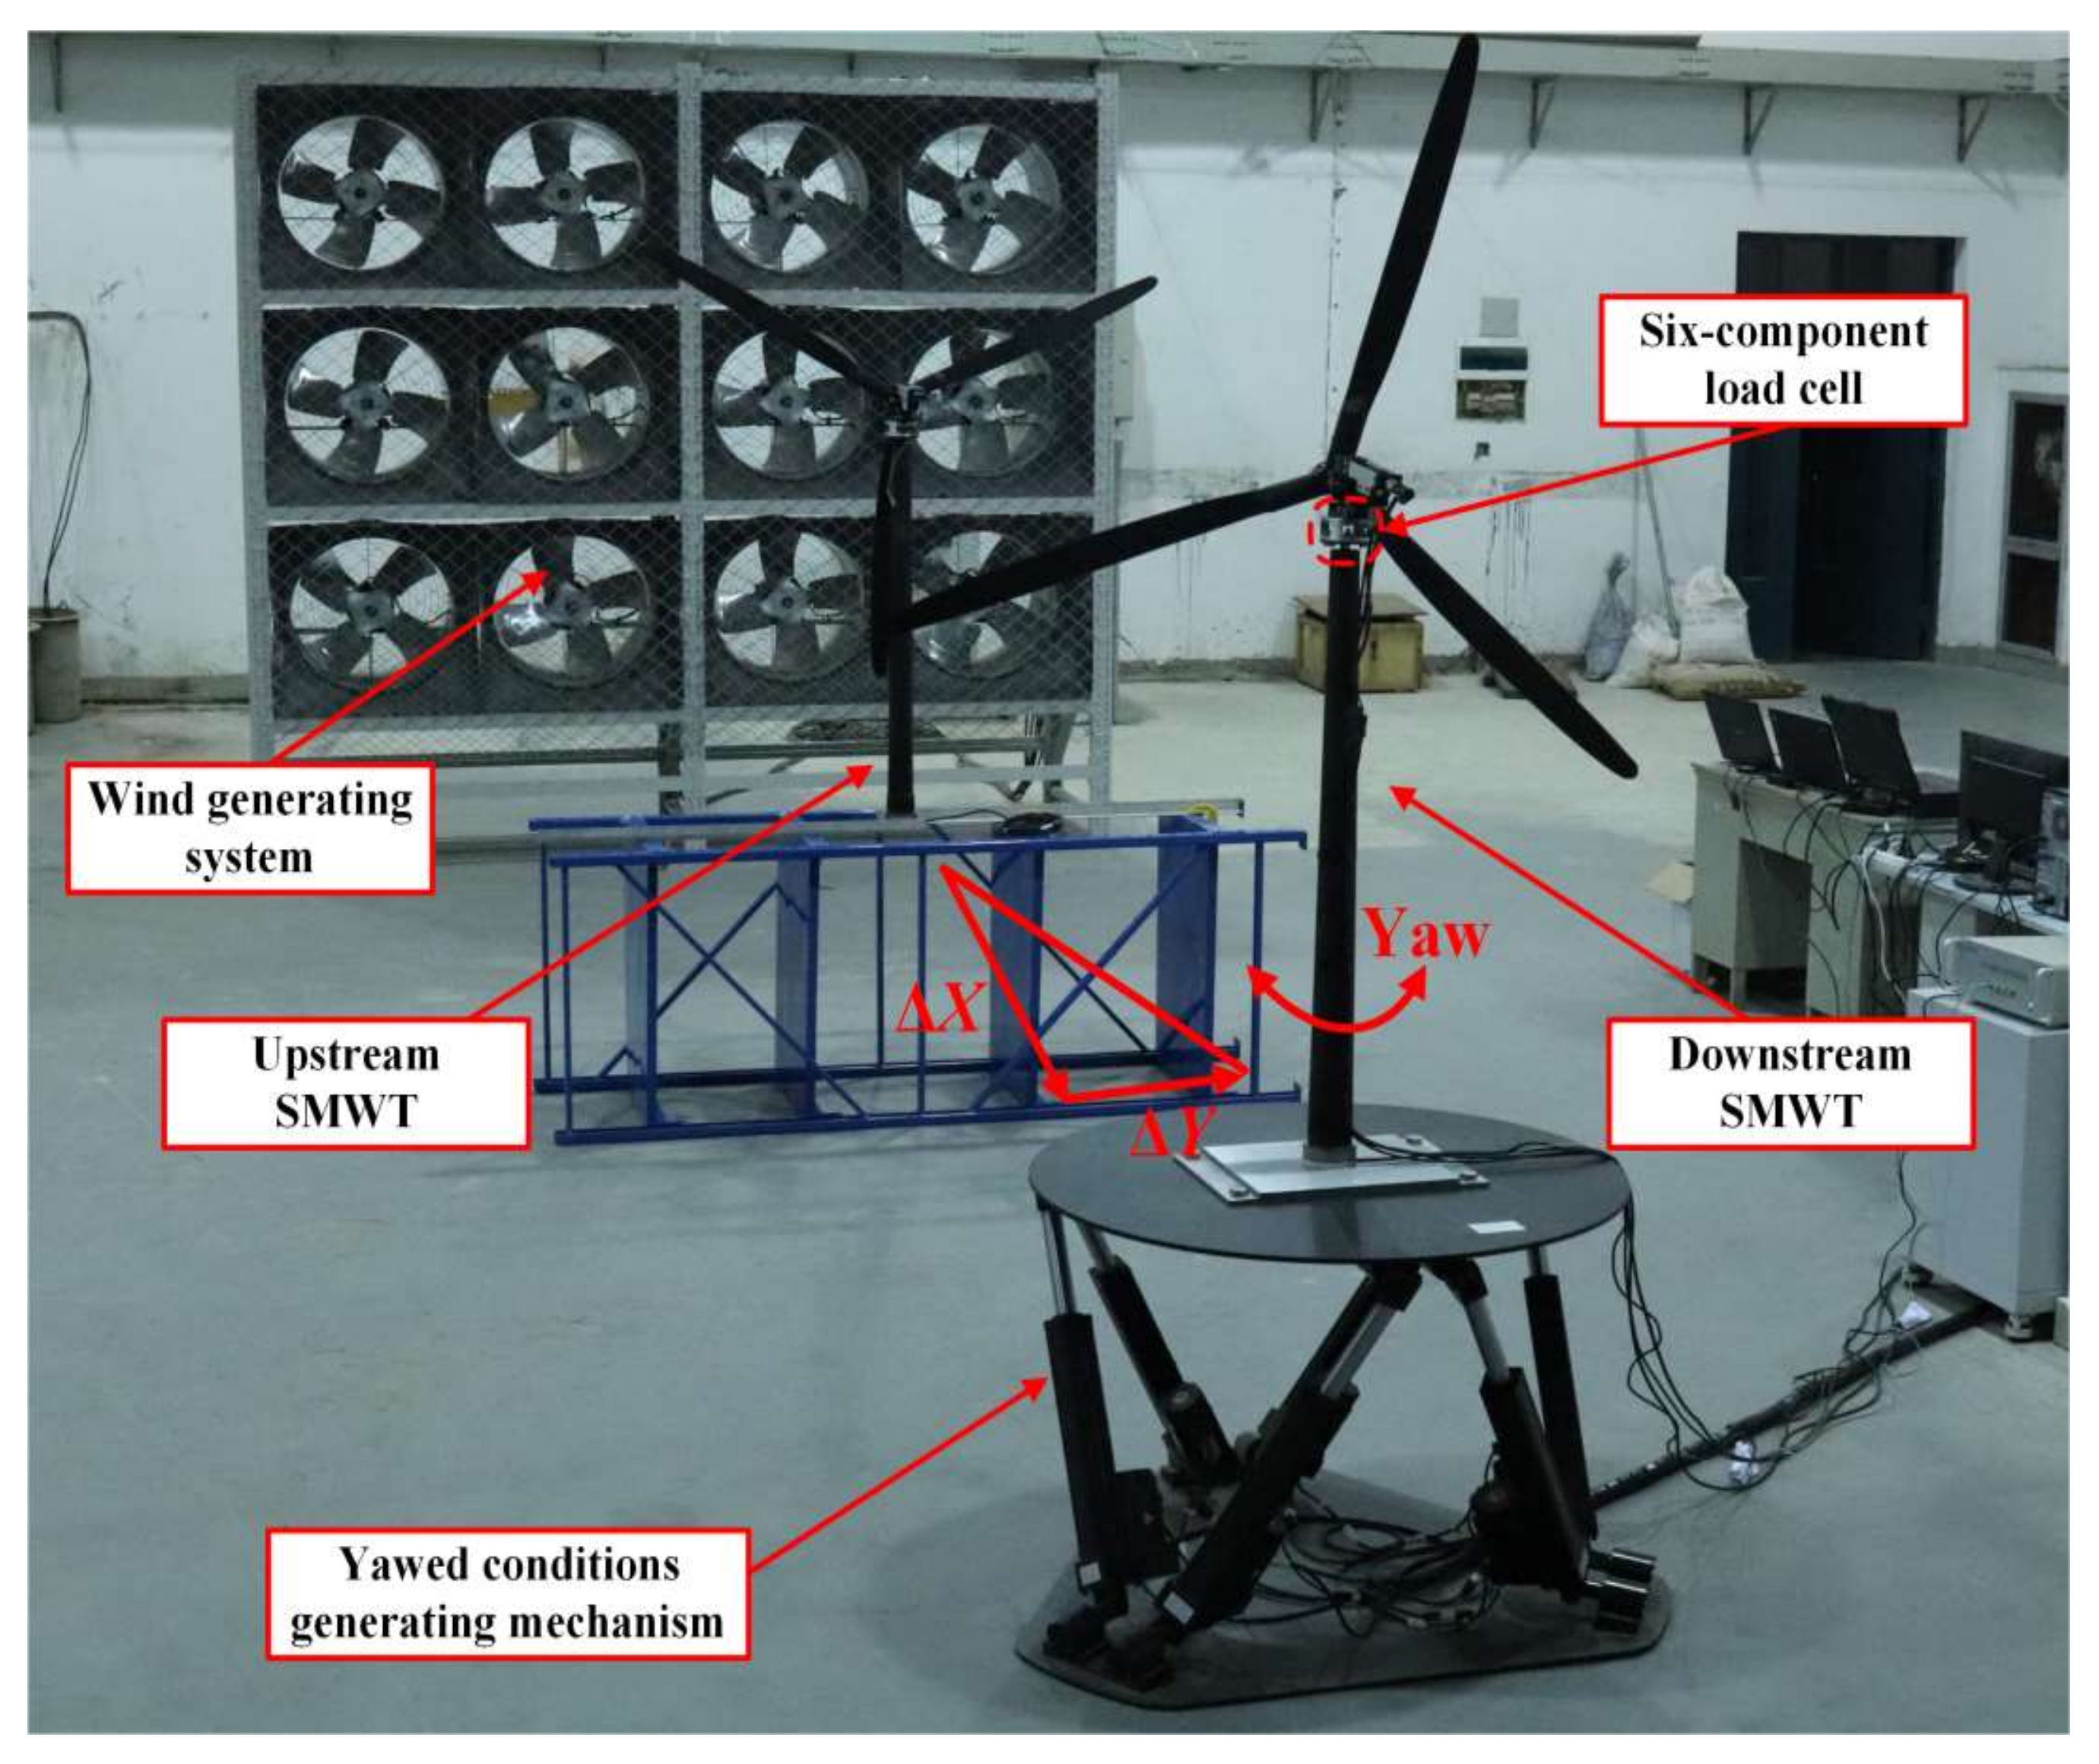
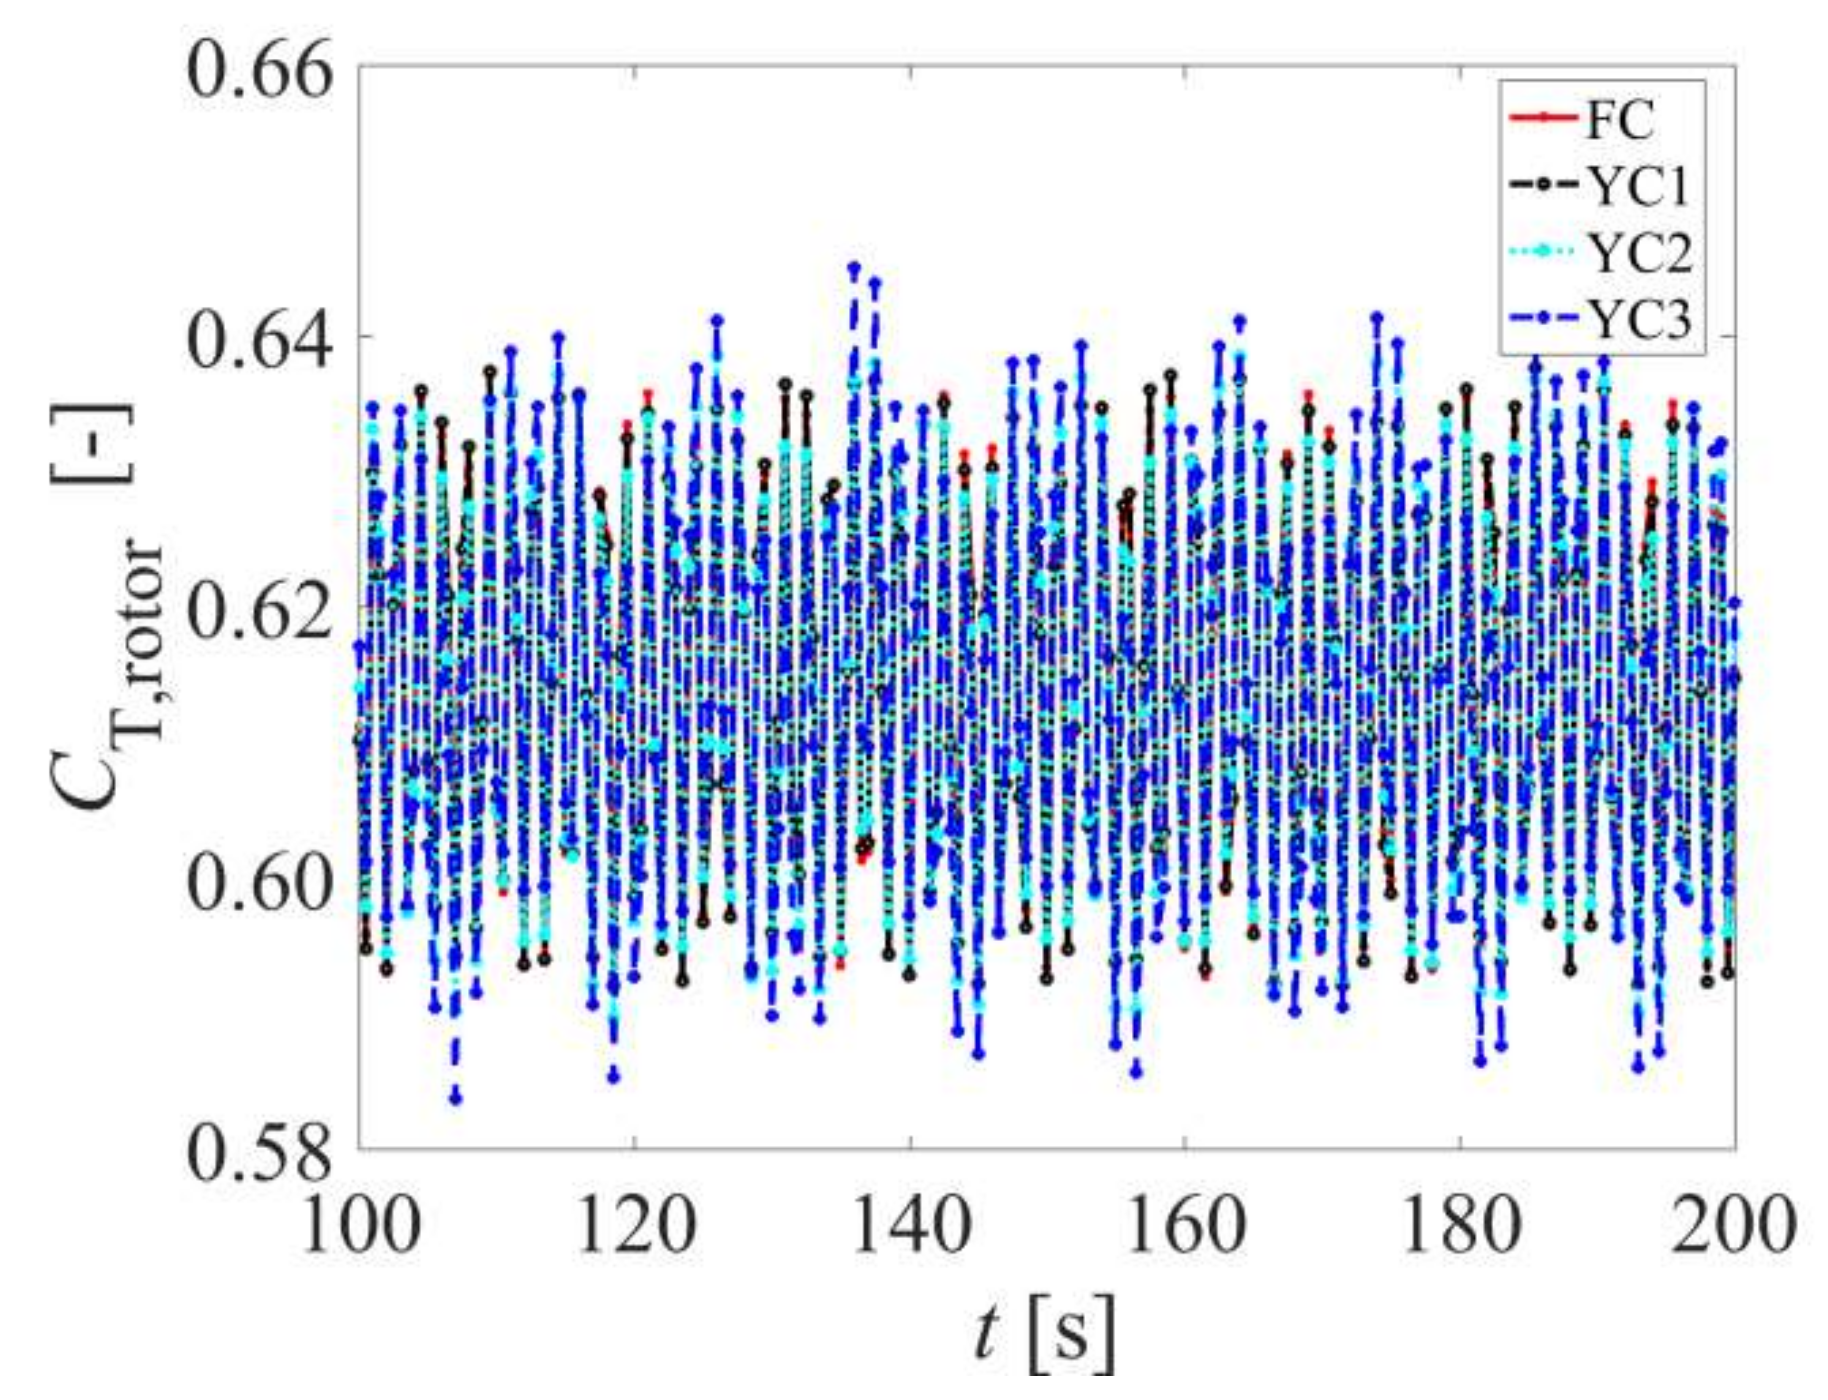
Experimental tests are conducted on a set of dedicated apparatus. According to the analysis of the experimental data of thrust coefficient and comparisons with the simulation results, it can be roughly validated that the analyses of thrust characteristics of a downstream OFWT under the dynamic, static, and coupled yawed inflow conditions from the simulations are correct. More experimental studies will be done to further verify the accuracy of the simulation results in our future work.

Author Contributions

Conceptualization, Y.W.; methodology, Y.W.; software, Y.W. and J.L.; validation, Y.W., J.L. and H.D.; investigation, Y.W., J.L. and H.D.; writing—original draft preparation, Y.W.; writing—review and editing, J.Z.; supervision, J.Z.; funding acquisition, J.Z. All authors have read and agreed to the published version of the manuscript.

Funding

This research was funded by [National Natural Science Foundation of China] grant number [51875105].

Institutional Review Board Statement

Not applicable.

Informed Consent Statement

Not applicable.

Data Availability Statement

Not applicable.

Conflicts of Interest

The authors declare no conflict of interest.

Abbreviations

OFWTOffshore Floating Wind Turbine
BEMBlade Element Momentum
FASTFatigue, Aerodynamic, Structure, and Turbulence
CFDComputational Fluid Dynamics
NRELNational Renewable Energy Laboratory
OC4Offshore Code Comparison Collaboration Continuation
TSRTip Speed Ratio
FCPlatform fixed case
YCDynamic yawed inflow case
SYCStatic yawed inflow case
1POnce per revolution
3PThrice per revolution

References

  1. Fernández-Guillamón, A.; Das, K.; Cutululis, N.A.; Molina-García, Á. Offshore Wind Power Integration into Future Power Systems: Overview and Trends. J. Mar. Sci. Eng. 2019, 7, 399. [Google Scholar] [CrossRef] [Green Version]
  2. Kosasih, K.M.A.; Suzuki, H.; Niizato, H.; Okubo, S. Demonstration Experiment and Numerical Simulation Analysis of Full-Scale Barge-Type Floating Offshore Wind Turbine. J. Mar. Sci. Eng. 2020, 8, 880. [Google Scholar] [CrossRef]
  3. Zhao, Z.; Li, X.; Wang, W.; Shi, W. Analysis of Dynamic Characteristics of an Ultra-Large Semi-Submersible Floating Wind Turbine. J. Mar. Sci. Eng. 2019, 7, 169. [Google Scholar] [CrossRef] [Green Version]
  4. Feng, X.; Lin, Y.; Zhang, G.; Li, D.; Liu, H.; Wang, B. Influence of Combined Motion of Pitch and Surge with Phase Difference on Aerodynamic Performance of Floating Offshore Wind Turbine. J. Mar. Sci. Eng. 2021, 9, 699. [Google Scholar] [CrossRef]
  5. Sebastian, T.; Lackner, M.A. Characterization of the unsteady aerodynamics of offshore floating wind turbines. Wind. Energy 2013, 16, 339–352. [Google Scholar] [CrossRef]
  6. Sant, T.; Cuschieri, K. Comparing three aerodynamic models for predicting the thrust and power characteristics of a yawed floating wind turbine rotor. J. Sol. Energy Eng. 2016, 138, 031004. [Google Scholar] [CrossRef]
  7. Ebrahimi, A.; Sekandari, M. Transient response of the flexible blade of horizontal-axis wind turbines in wind gusts and rapid yaw changes. Energy 2018, 145, 261–275. [Google Scholar] [CrossRef]
  8. Wen, B.; Tian, X.; Dong, X.; Peng, Z.; Zhang, W.; Wei, K. A numerical study on the angle of attack to the blade of a horizontal-axis offshore floating wind turbine under static and dynamic yawed conditions. Energy 2019, 168, 1138–1156. [Google Scholar] [CrossRef]
  9. Gao, X.; Yang, H.; Lu, L. Optimization of wind turbine layout position in a wind farm using a newly-developed two-dimensional wake model. Appl. Energy 2016, 174, 192–200. [Google Scholar] [CrossRef]
  10. Sun, H.; Yang, H. Study on an innovative three-dimensional wind turbine wake model. Appl. Energy 2018, 226, 483–493. [Google Scholar] [CrossRef]
  11. Bastankhah, M.; Porté-Agel, F. A new analytical model for wind-turbine wakes. Renew. Energy 2014, 70, 116–123. [Google Scholar] [CrossRef]
  12. Ge, M.; Wu, Y.; Liu, Y.; Li, Q. A two-dimensional model based on the expansion of physical wake boundary for wind-turbine wakes. Appl. Energy 2019, 234, 975–984. [Google Scholar] [CrossRef]
  13. Kanev, S. Dynamic wake steering and its impact on wind farm power production and yaw actuator duty. Renew. Energy 2020, 146, 9–15. [Google Scholar] [CrossRef] [Green Version]
  14. Tian, X.L.; Xiao, J.R.; Liu, H.X.; Wen, B.R.; Peng, Z.K. A Novel Dynamics Analysis Method for Spar-Type Floating Offshore Wind Turbine. China Ocean Eng. 2020, 34, 99–109. [Google Scholar] [CrossRef]
  15. Cai, X.; Wang, Y.; Xu, B.; Feng, J. Performance and effect of load mitigation of a trailing-edge flap in a large-scale offshore wind turbine. J. Mar. Sci. Eng. 2020, 8, 72. [Google Scholar] [CrossRef] [Green Version]
  16. Wen, B.; Tian, X.; Dong, X.; Peng, Z.; Zhang, W. Influences of surge motion on the power and thrust characteristics of an offshore floating wind turbine. Energy 2017, 141, 2054–2068. [Google Scholar] [CrossRef]
  17. Xu, B.F.; Wang, T.G.; Yuan, Y.; Cao, J.F. Unsteady aerodynamic analysis for offshore floating wind turbines under different wind conditions. Philos. Trans. R. Soc. A Math. Phys. Eng. Sci. 2015, 373, 20140080. [Google Scholar] [CrossRef] [PubMed]
  18. Aird, J.; Gaertner, E.; Lackner, M. Dynamic prescribed-wake vortex method for aerodynamic analysis of offshore floating wind turbines. Wind. Eng. 2019, 43, 47–63. [Google Scholar] [CrossRef]
  19. Qiu, Y.X.; Wang, X.D.; Kang, S.; Zhao, M.; Liang, J.Y. Predictions of unsteady HAWT aerodynamics in yawing and pitching using the free vortex method. Renew. Energy 2014, 70, 93–106. [Google Scholar] [CrossRef]
  20. Tran, T.T.; Kim, D.H. The aerodynamic interference effects of a floating offshore wind turbine experiencing platform pitching and yawing motions. J. Mech. Sci. Technol. 2015, 29, 549–561. [Google Scholar] [CrossRef]
  21. Li, X.; Zhu, C.; Fan, Z.; Chen, X.; Tan, J. Effects of the yaw error and the wind-wave misalignment on the dynamic characteristics of the floating offshore wind turbine. Ocean Eng. 2020, 199, 106960. [Google Scholar] [CrossRef]
  22. Li, X.; Qiu, Y.; Feng, Y.; Wang, Z. Wind turbine power prediction considering wake effects with dual laser beam LiDAR measured yaw misalignment. Appl. Energy 2021, 299, 117308. [Google Scholar] [CrossRef]
  23. Wei, D.; Zhao, W.; Wan, D.; Xiao, Q. A new method for simulating multiple wind turbine wakes under yawed conditions. Ocean Eng. 2021, 239, 109832. [Google Scholar] [CrossRef]
  24. Ma, H.; Ge, M.; Wu, G.; Du, B.; Liu, Y. Formulas of the optimized yaw angles for cooperative control of wind farms with aligned turbines to maximize the power production. Appl. Energy 2021, 303, 117691. [Google Scholar] [CrossRef]
  25. Lee, H.; Lee, D.J. Wake impact on aerodynamic characteristics of horizontal axis wind turbine under yawed flow conditions. Renew. Energy 2019, 136, 383–392. [Google Scholar] [CrossRef]
  26. Greco, L.; Testa, C. Yaw-Wind turbine unsteady aerodynamics and performance by a free-wake panel method. Renew. Energy 2021, 164, 444–459. [Google Scholar] [CrossRef]
  27. Bangga, G.; Lutz, T. Aerodynamic modeling of wind turbine loads exposed to turbulent inflow and validation with experimental data. Energy 2021, 223, 120076. [Google Scholar] [CrossRef]
  28. Bastankhah, M.; Porté-Agel, F. Experimental and theoretical study of wind turbine wakes in yawed conditions. J. Fluid Mech. 2016, 806, 506–541. [Google Scholar] [CrossRef]
  29. Bastankhah, M.; Porté-Agel, F. A new miniaturewind turbine for wind tunnel experiments. Part I: Design and performance. Energies 2017, 10, 908. [Google Scholar] [CrossRef] [Green Version]
  30. Bastankhah, M.; Porté-Agel, F. A new miniaturewind turbine for wind tunnel experiments. Part II: Wake structure and flow dynamics. Energies 2017, 10, 923. [Google Scholar] [CrossRef] [Green Version]
  31. Jonkman, J.; Butterfield, S.; Musial, W.; Scott, G. Definition of a 5-MW Reference Wind Turbine for Offshore System Development; National Renewable Energy Laboratory (NREL): Golden, CO, USA, 2009. [Google Scholar]
  32. Robertson, A.; Jonkman, J.; Masciola, M.; Song, H.; Goupee, A.; Coulling, A.; Luan, C. Definition of the Semisubmersible Floating System for Phase II of OC4; National Renewable Energy Laboratory (NREL): Golden, CO, USA, 2014. [Google Scholar]
  33. Sun, H.; Yang, H. Numerical investigation of the average wind speed of a single wind turbine and development of a novel three-dimensional multiple wind turbine wake model. Renew. Energy 2020, 147, 192–203. [Google Scholar] [CrossRef]
  34. Shao, Z.; Wu, Y.; Li, L.; Han, S.; Liu, Y. Multiple wind turbine wakes modeling considering the faster wake recovery in overlapped wakes. Energies 2019, 12, 680. [Google Scholar] [CrossRef] [Green Version]
  35. Thiringer, T.; Dahlberg, J.-A. Periodic Pulsations from a Three-Bladed. IEEE Trans. Energy Convers. 2001, 16, 128–133. [Google Scholar] [CrossRef]
  36. Wen, B.; Wei, S.; Wei, K.; Yang, W.; Peng, Z.; Chu, F. Power fluctuation and power loss of wind turbines due to wind shear and tower shadow. Front. Mech. Eng. 2017, 12, 321–332. [Google Scholar] [CrossRef] [Green Version]
  37. Jonkman, B.J.; Jonkman, J.M. FAST v8.16.00a-bjj User’s Guide; National Renewable Energy Laboratory (NREL): Golden, CO, USA, 2016. [Google Scholar]
  38. Jonkman, J.M.; Hayman, G.J.; Jonkman, B.J.; Damiani, R.R. AeroDyn v15 User’s Guide and Theory Manual; National Renewable Energy Laboratory (NREL): Golden, CO, USA, 2015. [Google Scholar]
  39. Platt, A.; Jonkman, B.; Jonkman, J. Inflow Wind User’s Guide; National Renewable Energy Laboratory (NREL): Golden, CO, USA, 2016. [Google Scholar]
Figure 1. Object OFWT under the yawed inflow.
Jmse 09 01215 g001
Figure 2. Schematic diagram of the yawed inflow condition from the top view.
Jmse 09 01215 g002
Figure 3. Schematic diagram of the yawed inflow condition of a blade airfoil.
Jmse 09 01215 g003
Figure 4. Application of the proposed converter in FAST.
Jmse 09 01215 g004
Figure 5. Schematic diagram of three upstream wake cases: (a) A single-wake case; (b) Another single-wake case; (c) A multiple-wake case from two upstream OFWTs.
Jmse 09 01215 g005
Figure 6. Thrust coefficients of the wind rotor in the three wake cases at ΔX = 5D0.
Jmse 09 01215 g006
Figure 7. Thrust coefficients of the wind rotor in the three wake cases at ΔX = 10D0.
Jmse 09 01215 g007
Figure 8. Thrust coefficients of the wind rotor under dynamic yawed inflow.
Jmse 09 01215 g008
Figure 9. Normal forces at 0.2R0 section of the blade (a) and at 0.8R0 section (b) of the blade.
Jmse 09 01215 g009
Figure 10. FFT of the normal force at 0.8R0 section of the blade.
Jmse 09 01215 g010
Figure 11. Thrust coefficients of the wind rotor under different static yawed inflow angle.
Jmse 09 01215 g011
Figure 12. Normal forces at 0.2R0 section of the blade (a) and at 0.8R0 section (b) of the blade.
Jmse 09 01215 g012
Figure 13. Definition of the signs of static yawed angle from the top view: positive value (left) and negative value (right).
Jmse 09 01215 g013
Figure 14. Thrust coefficients of the wind rotor (a) and the normal forces at 0.2R0 section of the blade (b) under different static yawed inflow directions.
Jmse 09 01215 g014
Figure 15. Thrust coefficients of the wind rotor under different coupled yawed inflow conditions: (a) YC3 + SYC1 and YC3 + SYC2; (b) YC3 + SYC2 and YC3 + SYC3; (c) YC3 + SYC3 and YC3 − SYC3. Note that FC is regarded as reference.
Jmse 09 01215 g015
Figure 16. Normal forces at 0.2R0 section of the blade (a) and at 0.8R0 section of the blade (b).
Jmse 09 01215 g016
Figure 17. FFT of the normal forces at 0.2R0 section of the blade (a) and at 0.8R0 section (b) of the blade.
Jmse 09 01215 g017
Figure 18. Images of the apparatus for experimental tests.
Jmse 09 01215 g018
Figure 19. The thrust coefficients by the experimental tests under the dynamic yawed inflow conditions: (a) 0°, 0 Hz and 10°, 0.72 Hz; (b) 5°, 0.36 Hz and 10°, 0.36 Hz; (c) 5°, 0.72 Hz and 10°, 0.72 Hz; (d) 10°, 0.36 Hz and 10°, 0.72 Hz.
Jmse 09 01215 g019
Figure 20. Thrust coefficients by the experimental tests under the static yawed inflow conditions.
Jmse 09 01215 g020
Figure 21. Thrust coefficients by the experimental tests under the coupled yawed inflow conditions.
Jmse 09 01215 g021
Table 1. Basic parameters of the NREL 5-MW wind turbine.
TermsValue
Rated power5 MW
Rotor type3 Blades, upwind
Drive-trainMultiple-stage gearbox, high speed
Rotor diameter, hub diameter and hub height126 m, 3 m, 90 m
Shaft tilt, pre-cone and overhang5°, 2.5°, 5 m
Tower length, tower top/bottom diameter77.6 m (for OC4), 3.87 m/6 m
Cut-in, rated, cut-out wind speed3 m/s, 11.4 m/s, 25 m/s
Rotor, nacelle and tower mass1.1 × 105 kg, 2.4 × 10⁵ kg, 3.4746 × 10⁵ kg
Table 2. Basic parameters of the OC4 DeepCwind semi-submersible floater.
TermsValue
Draft20 m
Elevation of platform top/offset columns10 m/12 m
Spacing between offset columns50 m
Length of upper columns/base columns26 m/6 m
Depth to top of base columns14 m
Diameter of main column/upper columns/base columns6.5 m/12 m/24 m
Platform mass/Displacement13,473,000 kg/13,986.8 m3
Platform roll inertia6.827 × 109 kg m2
Platform pitch inertia6.827 × 109 kg m2
Platform yaw inertia1.226 × 1010 kg m2
Table 3. Yawed inflow parameters in the three wake cases.
YawWake Case (a)Wake Case (b)Wake Case (c)
Ayaw [°]fyaw [Hz]Ayaw [°]fyaw [Hz]Ayaw [°]fyaw [Hz]
FC 1000000
YC1 220.0420.0420.04
YC2 220.0820.0820.08
YC3 250.0850.0850.08
SYC1 3202020
SYC2 3100100100
SYC3 3200200200
YC3 + SYC15 + 20.085 + 20.085 + 20.08
YC3 + SYC25 + 100.085 + 100.085 + 100.08
YC3 + SYC35 + 200.085 + 200.085 + 200.08
YC3 − SYC35 − 200.085 − 200.085 − 200.08
1 FC denotes the platform fixed case; 2 YC1~3 denote three cases of yaw motion, i.e., dynamic yawed inflow cases; 3 SYC1~3 denote three static yawed inflow cases.
Table 4. Mean values, variations, and variances of the thrust coefficient under three wake cases.
Wake CaseYawed Inflow Conditions C ¯ T ξ C T δ C T 2
5D010D05D010D05D010D0
Wake case (a)YC30.42960.51430.00980.01010.00180.0023
SYC30.39610.47870.00480.00640.00090.0015
YC3 + SYC30.39630.47890.10690.08940.02820.0284
Wake case (b)YC30.61390.62520.04990.01560.01600.0053
SYC30.57570.58400.03370.00850.01380.0034
YC3 + SYC30.57550.58490.09780.07510.03000.0273
Wake case (c)YC30.56670.58410.01650.00910.00380.0022
SYC30.53830.55200.02070.01060.00660.0030
YC3 + SYC30.54070.55280.09140.08050.02830.0218
Table 5. Mean values, variations and variances of normal force at sections 0.2R0 and 0.8R0.
Normal ForceMean Value [103 N/m]VariationVariance [103 N/m]
FCYC1YC2YC3FCYC1YC2YC3FCYC1YC2YC3
0.2R00.9140.9140.9150.9150.1820.1950.2110.2540.1210.1220.1220.125
0.8R05.8365.8345.8405.8430.3750.3980.4320.5371.4771.4841.4891.576
Table 6. Mean values, variations and variances of normal force at sections 0.2R0 and 0.8R0.
Normal ForceMean Value [103 N/m]VariationVariance [103 N/m]
YC3 + SYC1YC3 + SYC2YC3 + SYC3YC3 − SYC3YC3 + SYC1YC3 + SYC2YC3 + SYC3YC3 − SYC3YC3 + SYC1YC3 + SYC2YC3 + SYC3YC3 − SYC3
0.2R00.9090.8750.8040.8710.2660.3060.3230.3270.1250.1240.1270.143
0.8R05.8335.7625.5765.6640.5440.5680.5830.4981.5921.6281.6191.314
Table 7. Yaw parameters in the experimental tests.
YawFCYCSYCYC + SYC
Ayaw [°]05, 1010, 20, −205 + 10, 5 + 20, 5 − 20
fyaw [Hz]00.36, 0.7200.72
Publisher’s Note: MDPI stays neutral with regard to jurisdictional claims in published maps and institutional affiliations.

