Abstract
Composite breakwater is a commonly employed structure for coastal and harbor protection. However, strong hydrodynamic impact can lead to failure and instability of these protective structures. In this study, a two-dimensional fluid-porous-solid coupling model is developed to investigate the stability of composite breakwaters. The fluid-porous model is based on the Volume-Averaged Reynolds-Averaged Navier-Stokes equations, in which the nonlinear Forchheimer equations are added to describe the porous layer. The solid model employs the Nodal-based Discontinuous Deformation Analysis (NDDA) method to analyze the displacement of the caisson. NDDA is a nodal-based method that couples FEM and DDA to improve non-linear processes. This proposed coupled model permits the examination of the influence of the thickness and porosity of the porous layer on maximum impacting wave height () and the turbulent kinetic energy (TKE) generation. The results show that high porosity values lead to the dissipation of TKE and reduce the . However, the reduction in the is not monotonic with increasing porous layer thickness. We observed that reaches an optimum value as the porous layer thickness continues to increase. These results can contribute to improve the design of composite breakwaters.
1. Introduction
Sea level has been rising year by year due to global climate warming, leading to more violent storm events [,]. Consequently, the coastal structure protection faces increasingly severe challenges. Breakwater is an essential structure designed to protect coastlines from wave action. According to its structural configuration, traditional breakwaters can be categorized as vertical breakwaters, rubble mound breakwaters, or composite breakwaters []. Composite breakwater can be regarded as a combination of the former two types, typically comprising a concrete caisson, a rubble mound foundation, and a porous layer [], as shown in Figure 1. Composite breakwaters combine wave-energy dissipation with wave-reflection capabilities and are frequently employed in harsh wave environments to protect against wave attack []. However, wave impacts can compromise the stability of the breakwater, potentially leading to failure. Typically, three modes of failure are observed: the sliding or inclining of caisson, and scouring of the foundation or layer [].

Figure 1.
Composite breakwater structure.
In order to investigate the process of breakwater failure, numerous researchers have applied a range of methods such as laboratory experiments, analytical formulations and various numerical models. Ref. [] used centrifuge model tests and circular-slip analysis to investigate failure characteristics and performance-assessment methods for composite breakwaters. The experiments indicate that sliding failure is likely when friction between the soil mound and the caisson is low, when the caisson is wide, or when the reinforced berm is relatively tall and/or wide. Reference [] employed centrifuge model tests to investigate the failure process and influencing factors of berm-reinforced breakwaters under overturning modes. To gain deeper insight into the physical mechanisms driving breakwater instability and to extend and supplement laboratory observations, numerical models have been increasingly adopted. Several studies have employed CFD-based numerical models to simulate wave–structure interactions. The shallow water equations are commonly employed to formulate the motion of wave and investigate its impact on breakwaters [,].
Subsequently, Simulations based on the RANS equations have been widely applied. Ref. [] developed a RANS solver model to study the wave propagation in a steady current flow. The results of numerical simulation correlate well with experimental data. Ref. [] implemented a RANS-formulation model in OpenFOAM to investigate the interaction between solitary waves and a vertical wall mounted on a reef. The results indicate that the waves are broken by the reef into turbulent bores, which subsequently impact upon the vertical wall, leading to pronounced splash-up and air entrapment. Results also demonstrate the advantage of OpenFOAM in capturing turbulence details, such as turbulent kinetic energy and vorticity.
Furthermore, fluid–structure coupling models have been increasingly established to simulate the dynamic response of the breakwater’s solid components under wave impact. A Smoothed Particle Hydrodynamics (SPH) - Distinct Element Method (DEM) coupling model was used by [] to analysis method to analyze scouring and seepage flow phenomena at caisson-type breakwaters under the condition of the tsunami. Ref. [] formulated a model, which is based on simplified Bishop method, to do discrete elements method analysis and slip analysis on caisson-type breakwater. The stability was investigated under tsunami-induced seepage and then introduced a caisson foundation design approach. Ref. [] validates OpenFOAM numerical simulations of the wave-induced forces acting on crest walls of composite breakwaters. The calibrated model predicts the peak forces generated by breaking waves with errors below 20%. Recently, Ref. [] couples the SPH-based DualSPHysics code with the multiphysics library Project Chrono to set up a model for simulating the stability of tetrapods under solitary wave impact, thereby investigating the effects of different materials and surface roughness on tetrapod stability. Reference [] developed a CFD–DEM coupled model to investigate the effects of initial placement and friction coefficient on the stability of discrete tetrapods. In study of [], CFD simulations coupled with DIANA FEA structural analyses were employed to examine pressure distributions and structural responses of fully curved and recurved crownwalls under Confined-Crest impact. It was found that the fully curved crownwall markedly reduces overtopping, while the recurved crownwall exhibits better structural performance.
Additionally, porous media have been widely incorporated into the models because of its critical role in breakwater performance. Darcy-Forchheimer equations are commonly used to describe the linear and non-linear movement of flow in the porous layer. In order to implement these equations, a volume-averaging procedure is usually applied to the RANS equations, resulting in the VARANS formulation. Ref. [] built a fluid-porous-solid coupling model to investigate the global stability of caisson-type breakwater. In this model, Discontinuous deformation analysis (DDA) method is employed to simulate the motion of caisson and blocks. Ref. [] established a model based on VARANS for surface waves in front of composite breakwaters, employing the Darcy–Forchheimer equation to describe the porous medium. The result shows good agreement with experimental data reported by []. Ref. [] investigated the porous media flow by a IH-3VOF model which is based on volume-averaging approach of the NS equations. The porous medium parameters are calibrated by the experimental result of []. Then the model is employed to study a three-dimensional dam-breaking problem.
In this paper, the main objective is to analyze the various hydrodynamic and physical factors that can cause structural instability, such as sliding, and trigger phenomena such as overtopping or scour. Therefore, a two-dimensional fluid-porous-solid coupling model is built to analysis the stability of composite breakwaters. Here, structural instability is not defined as the failure of the structure itself, but rather as a dynamic process resulting from the movement of its constituent elements, such as the main caisson or the armour units. This movement creates a static imbalance within the structure, causing it to lose its essential function of protecting property and people. The fluid-porous model is formulated by the Volume-Averaged Reynolds-Averaged Navier-Stokes(VARANS) equations, where the porous layer flow is described by the nonlinear Forchheimer equations []. The solid model is based on the Nodal-based Discontinuous Deformation Analysis (NDDA) method []. NDDA can be treated as the coupling of FEM and DDA, which is nodal-based and can be used to calculated the non-linear displacement of block. The fluid-solid coupling is achieved by converting the pressure at the fluid interface nodes into external forces applied to the nearest solid nodes, which is derived from a previously established method [].
This paper is organized as follows: formulations of fluid-porous and solid model, and their coupling procedure are introduced in Section 2. Next, the validation of fluid and solid models is presented in Section 3. In Section 4, simulation results about the porous layer and the stability and design study of composite breakwater are presented. Finally, Section 5 highlighted the conclusions of this work.
2. Mathematical Formulation
For the purpose of investigating the stability of composite breakwater, a two-dimensional Fluid-porous-solid coupled model is developed. The Fluid-porous model is founded on Volume-Averaged RANS equations extended with Darcy-Forchheimer terms, and solid model is based on NDDA method. The formulation of the models are as below:
2.1. Formulation of Coupled Fluid-Porous Model
2.1.1. Volume-Averaged RANS Equations
The Reynolds-Averaged Navier–Stokes (RANS) equations are commonly used to characterize fluid flow []. However, in this study, restricted by the solid framework, the fluid can only flow within the pores of the porous medium, rendering the standard RANS equations inapplicable under these circumstances. Therefore, to incorporate the additional resistance term contributed by the solid structure, namely the Darcy-Forcheimer equation formulation, a volume-averaged velocity is introduced, defined by []:
where is instantaneous fluid velocity in x, y, z directions. is the total volume, and represents the volume occupied by fluid.
The conservations of mass and momentum of RANS model are []:
Then, we substitute volume-averaged velocity Equation (1) in the RANS Equations Equations (2) and (3), and we acquire the VARANS equations for incompressible fluid []:
where represents the fluid averaged density, V represents the velocity. In the momentum conservations, P is the pressure, g denotes the gravitational acceleration vector, and is the Cartesian position vector. The term is efficient viscosity, which is calculated by adding weighted average dynamic viscosity to dynamic turbulence viscosity . The last term denotes the surface tension effects, where represents the surface tension, represents the fluid volume fraction, and .
2.1.2. Nonlinear Forcheimer Equation for Porous Media
The first approach to describe the transport properties of flow through porous media is introduced by Darcy (1856) []. It is appropriate to model laminar flows because it include only linear term (first term in Equation (6)). In order to study the non-linear relationship between pressure and velocity of more energetic flows, Forcheimer (1901) added a quadratic velocity term (second term in Equation (6)) []. Furthermore, the inertial term (third term in Equation (6)) is extended by Polubarinova-Kochina (1962) to describe the inertial resistance of the fluid when it accelerates in the porous medium []. By combining these three terms, the expression of the drag force from porous media can be written as:
where represents the porous medium pressure. denotes the added mass coefficient. The coefficients p and q are defined and first applied by Engelund (1953), and then modified by van Gent (1995) as below []:
where and are empirical coefficients to calculate p and q, respectively. is dynamic viscosity, and is the median particle diameter of the porous layer, which is commonly made of crushed stones. KC is called the Keulegan-Carpenter number, which is calculated by . represents the maximum oscillatory velocity, and is the period of the oscillation.
2.1.3. Air-Fluid Interface Capture by VOF Method
In the model, in addition to the solid-fluid two-phase elements within the porous medium, there are also air-fluid two-phase elements at the free surface of the seawater, as well as pure air elements and pure fluid elements. As mentioned in Equations (3) and (10), is used to represent the fluid volume fraction and its value ranges from 0 to 1. When = 1, the element is full of fluid and = 0 corresponds to full of air. In order to calculate inside each computational cell, the transport equation of Volume-of-Fluid (VOF) method is employed as follow []:
where represents interface compression velocity, which is used to prevent numerical diffusion and maintain interface sharpness. Therefore, it enhances the accuracy of the volume fraction transport equation and ensure a more physical result.
In conclusion, the governing equations of fluid-porous model are composed of VARANS equations (Equations (9) and (10)) and VOF equation (Equation (11)). During the model solving process, firstly, OpenFOAM solves Equation (11) by MULES solver (Multidimensional Universal Limiter for Explicit Solution) which bounds the solution between 0 and 1 by using a limiter factor on the third term. Nextly, the VARANS equations are solved by a hybrid PIMPLE algorithm, which is from merging aspects of PISO (Pressure Implicit with Splitting of Operators) and SIMPLE (Semi-Implicit Method for Pressure Linked Equations) algorithms. In each step, iterative solution of velocity field and pressure is operating because they are coupled in the Equation (10). Finally, the process advances to next step with updated pressure and velocity field [,].
2.2. Formulation of Solid Model by Nodal-Based DDA
The Nodal-based discontinuous deformation analysis (NDDA) method was employed to analysis the solid model. As the displacement and deformation of blocks are nonlinear process, the NDDA formulation may help to improve this nonlinear state process.
NDDA is derived from the DDA approach. The key distinction is that NDDA applies a mesh to each block, thus enabling a more accurate representation of deformation and pressure distribution within the block. Therefore, NDDA can also be viewed as a coupling of the FEM and DDA []. In this study, three-node triangular elements are employed for meshing the blocks.
In NDDA, the displacement of an arbitrary point within block i is calculated in a manner similar to FEM, wherein it is described as an interpolation of the nodal displacements using the element shape functions []:
where , and represent the shape function coefficient of each node, and is the displacements of the nodes within the element to which the point belongs. They correspond, in sequence, to the displacements of nodes 1, 2, and 3 in the x and y directions, respectively.
Based on the strain-displacement relationship, the strain at point can be derived as follows []:
As in the original DDA method, the simultaneous equations of NDDA are derived by minimizing the total potential energy. For any virtual displacement, the total potential energy of the system comprises the total elastic potential energy and the work performed by external forces, and equals to zero. Mathematically, this condition can be expressed as [,]:
where U is the elastic potential energy of the system, W is the work performed by the external loads, and denotes the total potential energy of the entire system. Therefore, the total potential energy includes elastic, gravitational, initial stress, inertial force, loading, and contact force components, and can be written as []:
elastic submatrix:
point force:
body force:
Inertia force:
Notably, the penalty method is used to enforce contact constraints. By considering the contact of two blocks 1 and 2, the penetration distance of point i into element edge of block 2, as shown in Figure 2, can be calculated as follows [,]:
where l is the length of and represents the area of triangle . By combining Equation (12) and Equation (23), we have:
where:
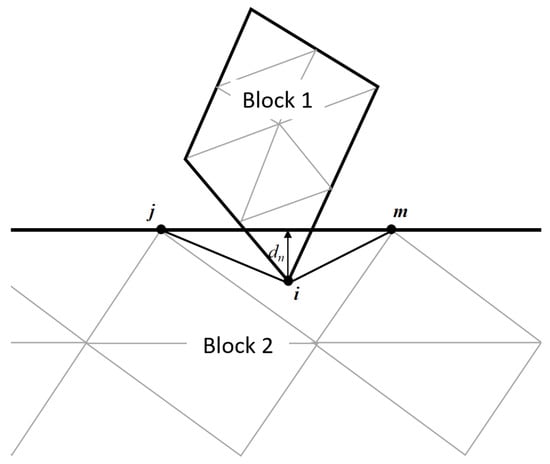
Figure 2.
Interaction between elements of two contacting blocks.
and
Therefore, the contact energy between blocks 1 and 2 is calculated as [,]:
where p is the spring stiffness.
By minimizing the total potential energy , the global equilibrium equations for a system with n nodes will have the following form:
where K is the global stiffness matrix, a 2n × 2n matrix. D is the unknown vector and F is the equivalent force vector. Write in submatrix form, we have [,]:
where the sub-matrices in the coefficient matrix is a 2 × 2 submatrix. is a 2 × 1 submatrix and denotes the displacements unknowns of node i. is a 2 × 1 submatrix and denotes the equivalent nodal forces applied on node i.
To obtain each submatrix, we first compute the total potential energy of each element and then minimize it, yielding the corresponding equation for each element. Subsequently, based on the nodes connectivity, each element’s submatrix and load contributions is assembled into the appropriate entries of the global equation, as shown in Figure 3.
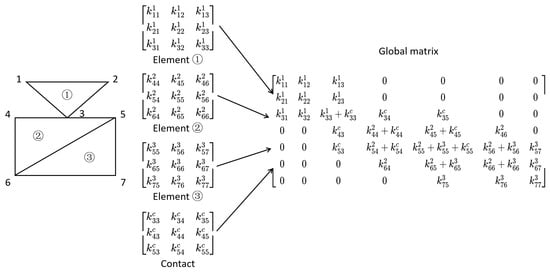
Figure 3.
Schematic assembly process of NDDA method.
2.3. Interaction Process of Fluid-Solid Coupled Model
The fluid-solid coupling requires a transfer from pressure in fluid domain to external force in solid part. When coupling CFD with DDA method, the fluid pressure can only be applied to the two end nodes of the solid [,], which is shown by Figure 4a. In this study, the fluid and solid domains are both meshed. Therefore, the nodal pressure forces of the fluid (, ) are converted into equivalent nodal forces and of the nearest nodes of the solid, as shown in Figure 4b,c. To illustrate, the external fluid nodal forces and on solid nodes 1 and 2 are determined by Equation (31).

Figure 4.
Fluid/solid interface: (a) CFD-DDA; (b) CFD-NDDA; (c) coupling scheme.
In this formula, n represents the total number of fluid mesh nodes located between solid nodes 1 and 2, and denotes the pressure at the fluid grid node i. and are the distances from point i to nodes 1 and 2, respectively. The fluid loads on the other solid nodes are computed using the same procedure. This coupling scheme is based on the previous method [], and enhances the accuracy of the fluid-load calculations.
To describe the operation process of the coupled fluid-porous-solid model, a flowchart is created as shown in Figure 5, with the details of boundary conditions, inputs, outputs and connection of each model. The numerical simulations for the fluid-porous model are performed using the OpenFOAM platform, employing the Olaflow solver to solve the coupled equations of the fluid and porous medium. The mesh generation is also performed within OpenFOAM using BlockMesh tools. Regarding the simulation of solid displacement, we have developed a home-made NDDA numerical model which considers the displacements of the nodes of the finite elements, unlike classical DDA which considers the displacements of blocks.
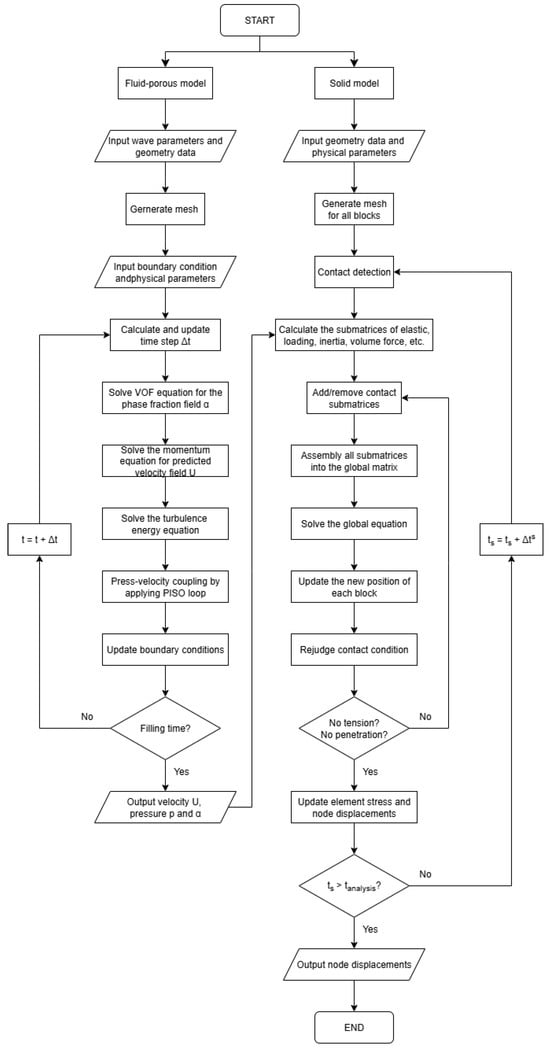
Figure 5.
Flow chart of computational process.
3. Validation Tests for Fluid and Solid Models
The model was developed to simulate the interaction between waves and the composite breakwater, enabling stability analysis and design optimization, as shown in Figure 6. The overall model domain is 230 m in length and 23.5 m in height. The hydrodynamic load is generated by the solitary wave, in which the height () is 4.5 m and the water depth () is 10 m. For the structure of breakwater, the caisson is in shape of square and its height () equals 13 m. The height of foundation () is 8 m, and the slope of wave-facing side is 1:2 []. Three gauges, labeled P1, P2 and P3 in Figure 6, are positioned at 26 m, 180 m and 207 m from the left boundary of the domain to measure the free-surface elevation.

Figure 6.
Schematic illustration of composite breakwater model without armour units.
In order to investigate the effect of porous layer on stability, tests with different conditions were conducted.To obtain realistic porosity and thickness parameters, previous studies were reviewed and porosity of 0.35, 0.417, 0.49 and 0.6 and thicknesses of 1 m, 1.5 m, 2 m and 2.5 m were selected for the simulations [,].
3.1. Boundary Conditions for Fluid Model Input
The simulation begins by generating a solitary wave at the left boundary of the computational domain. Solitary wave generation is done by a numerical wave tank, which is already implemented in Olaflow. All the simulations were conducted under the same solitary wave condition, which is prescribed with a period of 3.0 s and a height of 4.5 m. It is based on wave Boussinesq theory, which leads to the expressions for free surface elevation and velocity for a solitary wave as follows [,]:
where represents the wave height, and is the water depth. denotes the wave phase shift. X = (x − ct), in which c is the wave celerity and equal to . The velocity in the horizontal and vertical directions is given by []:
Here, x and y denote the horizontal and vertical spatial coordinates, respectively, with the left boundary of the computational domain defined at x = 0.
The top boundary is treated as an open surface at atmospheric pressure, leaving the water phase unaffected. The lower boundary is prescribed with a slip condition, which neglects viscous bottom friction, thereby simplifying the water-solid bottom interaction.
3.2. Fluid Model Validation
The fluid model is validated by comparing analytical (calculated by Equation (32)) and simulated values of free-surface elevation at point (see Figure 6). Mesh sensitivity tests was carried out with a refinement ratio of [], and three mesh densities were adopted: coarse (38,088 cells), medium (76,440 cells), and fine (153,317 cells), as shown in Figure 7. Subsequently, to verify time-step sensitivity, time step of 0.1 s, 0.01 s, and 0.001 s were respectively evaluated.

Figure 7.
Computational grids for mesh sensitivity test: (a) Coarse mesh; (b) Medium mesh; (c) Fine mesh.
The agreement between simulation and analytical solutions was assessed using the root-mean-square error (RMSE) metric. As shown in Figure 8a and Table 1, the fine and medium mesh results coincide closely and both offer a better match to the analytical solution compared to the coarse mesh. Considering both computational time and precision, the medium mesh was adopted for the subsequent simulations. As illustrated in Figure 8b and Table 2, the results of the three time step cases of 0.1 s, 0.01 s and 0.001 s are all overlap almost perfectly, and each time-step setting result shows good agreement with the analytical solution. Therefore, = 0.1 s was adopted for the remaining work.
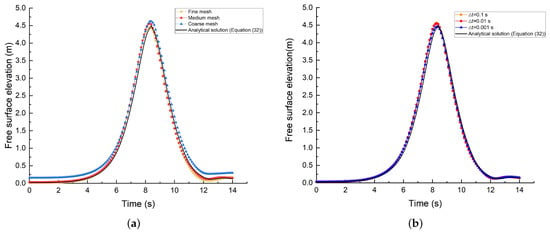
Figure 8.
Free surface elevation of mesh and time step sensitivity: Comparison between computed solution and analytical solution (Equation (32)): (a) Mesh sensitivity; (b) Time step sensitivity.

Table 1.
RMSE for mesh sensitivity.

Table 2.
RMSE for time step sensitivity.
In this study, each numerical simulation requires an average computation time of approximately 1800 s, on a personal computer with a single processor (AMD Ryzen 5 3600 CPU). For the numerical setup, a time step of t = 0.1 s is used, which leads to a maximum Courant number of Cr = 0.45. The Piso algorithm (Pressure Implicit with Splitting of Operators) was employed for pressure-velocity coupling. The temporal term was discretized using the explicit first-order forward Euler scheme, while the convective and all other terms were discretized with the central differencing scheme (linear in OpenFOAM). Since spatial discretization in OpenFOAM relies on the finite volume method, face-centered values were used in the discretized Navier-Stokes equations, with all explicit terms evaluated using the central differencing (linear) scheme. Finally, since we are in shallow water and the bottom slope varies by an angle alpha, velocity and pressure gradients can occur. The k-omega SST model was therefore adopted to take these gradients into account.
3.3. Solid Model Validation
The solid model was validated a slope-slider model compared against analytical predictions. For the NDDA solid model, the parameters are based on the physical characteristics of concrete. The unit mass is 2500 kg/, and elastic modulus is 50 GPa, with Poisson ratio of 0.25. The contact stiffness is N/m and friction angle is [].
In the validation test, an isosceles right-triangle block with leg length 2 m was positioned at the top of an isosceles right-triangle slope of leg length 10 m. Tests were carried out at friction angles of 0° and 30°. The simulation results were evaluated against analytical solutions using the RMSE. In both cases, the simulated displacements exhibited good agreement with the theoretical solutions, although the numerical results were consistently slightly larger than the analytical predictions, as shown in Figure 9 and Table 3.
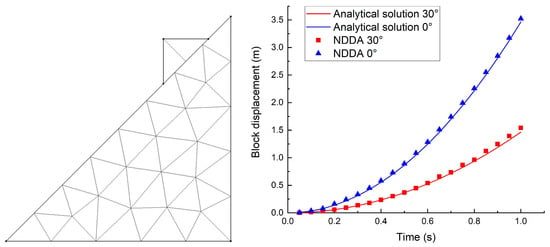
Figure 9.
Sliding block over a slope test.

Table 3.
RMSE for slope test.
4. Cfd/Ndda Simulation Results
4.1. Flow Patterns Around the Composite Breakwater with Porous Layer
The simulation results reveal the process of wave–breakwater interaction. Before the waves reach the structure, the wave velocity is mainly directed toward the foundation and the lower half of the caisson, as shown in Figure 10a. Correspondingly, vortex structures appear in the porous layer and ahead of the caisson, shown in Figure 10b.
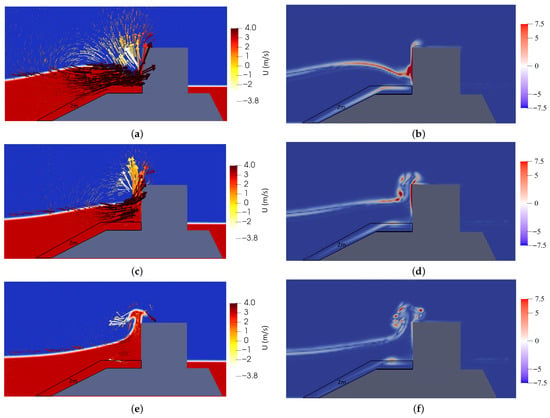
Figure 10.
Flow patterns around the composite breakwater: figures (a,c,e) for velocity fields; figures (b,d,f) for corresponding vorticity map.
After the waves impact with the caisson, the blocked flow is squeezed such that the upper fluid layer is driven upward while the lower layer generates downward and returning currents (Figure 10b,c). As a result, vortices with upward and downward rotation form in front of the caisson (Figure 10e,f). Upward flows may lead to wave overtopping and subsequently influence the leeward side of the breakwater. Downward-directed vortices may impose shear stresses on the porous medium or foundation, altering their shape and leading to performance failure. With sustained action, scouring may occur, leading to caisson tilt and eventually breakwater failure.
4.2. Solution Behavior with Various Porous Layer Thickness and Porosity Values
In order to analyze the influence of the porosity and the thickness of porous layer, the maximum impacting wave height () and the turbulent kinetic energy (TKE) are tested with four different porosity values (0.35, 0.417, 0.49 and 0.6). is the maximum elevation which the wave run-up exceeds the caisson crest following wave impact. The porous layer thickness is defined in two segments: on the seaward-facing slope, and on the slope platform in front of the caisson, as shown in Figure 11.
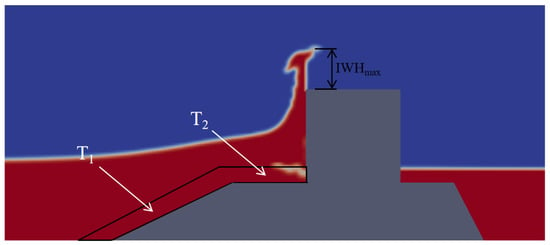
Figure 11.
and porous layer thickness definition.
Based on these simulation results, as the porosity increases, the decreases significantly, as shown in Figure 12 and Table 4, and lower turbulent kinetic energy generates due to a large dissipation, which also means less effects of the waves on breakwater, as shown in Figure 13. The effect can be attributed to higher porosity, which expands the porous layer’s total pore volume in the porous layer, thereby allowing more fluid to be stored and thus absorbing a greater portion of wave energy before it reaches the caisson.
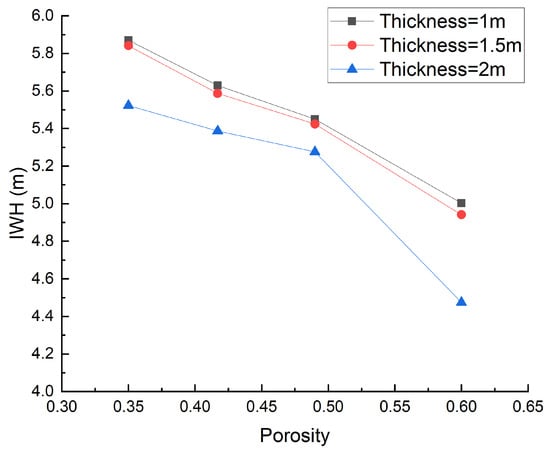
Figure 12.
with various porosity, T1 = 1 m, 1.5 m and 2 m, T2 = 2 m.

Table 4.
values with various porosity.
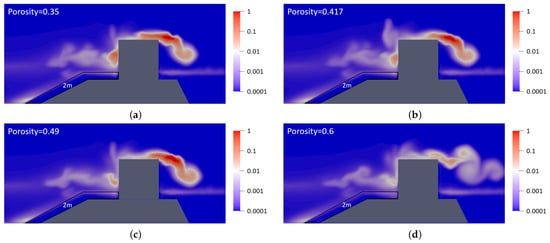
Figure 13.
TKE with various porosity values (T1 = T2 = 2 m): (a) Porosity = 0.35; (b) Porosity = 0.417; (c) Porosity = 0.49; (d) Porosity = 0.6.
However, the porosity of porous media has an upper limit, particularly for layers composed of crushed rock, where porosity seldom exceeds 0.6. Therefore, to enhance the performance of the porous layer, modifying its thickness is a more practical approach. Therefore, investigating the influence of porous-layer thickness is essential. This study evaluates for various thickness combinations, with set to 0.5 m, 1.0 m, 1.5 m, 2.0 m, and 2.5 m, and set to 1.0 m, 1.5 m, and 2.0 m.
Figure 14 presents the fitted surfaces of as functions of and for various porosity, and the blue markers indicate the simulation data for each parameter set. It is evident that every fitted surface reaches its minimum around = 0.5 m and = 1.0 m. A thicker porous layer provides a greater pore volume for wave-energy absorption. However, the short duration of wave impact its utilization of this capacity. Simultaneously, the increased thickness elevates the wave height, thereby causing to increase.” Furthermore, as illustrated in Figure 14, higher porosity consistently corresponds to lower values of regardless of thickness. Therefore, to achieve the minimum , this study proposes the optimal parameter combination.
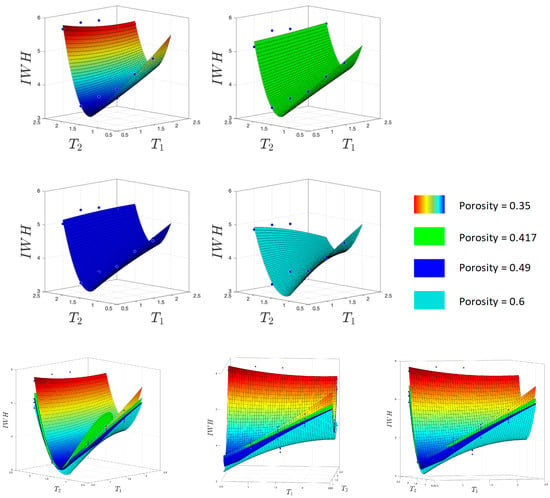
Figure 14.
with various porosity values and thickness.
4.3. Solution Behavior with Various Caisson Shape
To enhance the breakwater’s performance, the caisson plays an essential role. This study optimizes the caisson’s geometry by proposing four novel shapes and simulating their behavior, as shown in Figure 15. It should be noted that the crest added to the shapes of Types a and b are intended to prevent wave overtopping, while the shape of Type c is designed to prevent scour at the base of the structure. Finally, the shape of Type d is designed to prevent both overtopping and sliding processes of the caisson.

Figure 15.
Caissons with various shapes which investigated by numercial simulation.
The simulation results of the seawater flow patterns for shaped caissons are shown in Figure 16. Under wave attack, Type a shows an overturning tendency caused by impact forces on its crown. Type b, similar to standard caissons, tends to undergo sliding. In contrast, Type d demonstrates greater stability, attributable to an increased area and duration of wave-structure interaction. In fact, when the wave strikes the structure, it follows the curved profile on the seaward side of the caisson, which reduces the impact force on the caisson and thus minimizes the risk of its sliding. This hybrid design also helps to dissipate the kinetic energy of the wave, thereby reducing the maximum Impacting Wave Height () thanks to the crest located above the caisson.
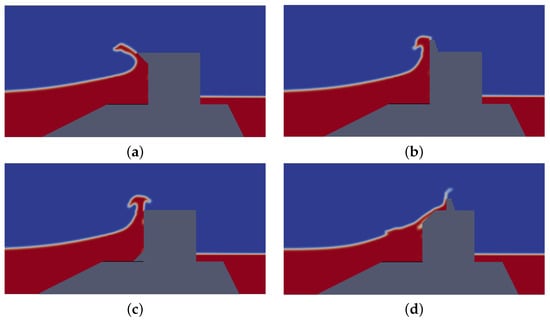
Figure 16.
Flow patterns according to different caisson shape. (a) Type a. (b) Type b. (c) Type c. (d) Type d.
Figure 17 shows the corresponding values for different caisson shapes under wave action. The minimum is observed for Type a, and the crown at the caisson top effectively directs the flow so that almost no seawater overtops the structure. The for Type b is similar to that for Type d, and only a small amount of seawater overtops the caisson in both cases. Type c produces the highest , indicating minimal effectiveness in preventing seawater overtopping.
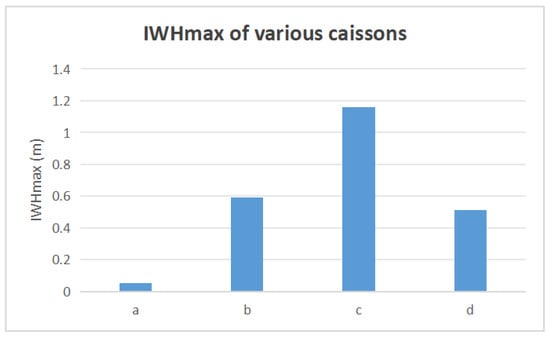
Figure 17.
value with various caissons.
5. Conclusions
In this study, a fluid–porous–solid coupled model was developed to simulate the the behavior of a composite breakwater under violent wave attack. It is based on the Volume-Averaged Reynolds-Averaged Navier-Stokes(VARANS) equations. We considered that the porous layer produces nonlinear effects, and therefore we adopted the Forcheimer formulation, in which an inertial term to describe the inertial resistance of the fluid as it accelerates in the porous medium was added. The drag force induced by the porous medium is then added to the forces acting on the fluid particles, but the inertial terms of the porous medium induce an added mass term in the general equations of fluid dynamics.
The solid model is based on the NDDA method to describe the deformation and displacement of breakwater under external loading. Coupling between the two models is achieved by converting nodal fluid pressures into equivalent forces at nodal solid model. The main conclusions of the numerical simulations are as follows:
- The porosity of the porous layer has a significant effect on the spatial distribution of turbulent kinetic energy (TKE). Higher porosity enhances the layer’s capacity to absorb and dissipate TKE, leading to a lower TKE intensity.
- The porosity and thickness of the porous layer both significantly influence maximum impacting wave height (). Higher porosity leads to a lower .
- Four caisson shapes were investigated. The simulation results show that the triangular crest added to the shapes of types (a) and (b) prevent wave overtopping, while the shape of type (c) prevent scour at the base of the structure, and shape of type (d) prevent both overtopping and sliding processes of the caisson.
However, it should be noted that the present numerical investigations are based on the assumption of a fixed geometry, and do not account for morphological changes of the porous layer or seabed under wave action. The applicability of this model to more detailed cases can be improved by taking into account the evolution of the seabed by implementing a morphodynamic model, for example [,]. Besides this, in maritime and coastal engineering most of the protection structures are also made up of Armors units of different shapes. Therefore, besides the role of porosity and thickness of the porous layer in the attenuation of TKE and IWHmax, it is necessary to examine the role of these blocks (Armors units) in the stability of the entire structure so that it fulfills its role of protecting property and people against the devastating effects of storm events etc.
Author Contributions
Conceptualization, A.O. and X.W.; methodology, A.O.; software, X.W.; validation, X.W.; investigation, X.W.; writing—original draft preparation, X.W.; writing—review and editing, A.O. and X.W.; visualization, X.W.; supervision, A.O. All authors have read and agreed to the published version of the manuscript.
Funding
This research was funded by China scholarship council (CSC).
Data Availability Statement
The original contributions presented in this study are included in the article. Further inquiries can be directed to the corresponding author.
Acknowledgments
The authors wish to thank the financial support from the China Scholarship Council (CSC).
Conflicts of Interest
The authors declare no conflicts of interest.
References
- Almar, R.; Ranasinghe, R.; Bergsma, E.W.J.; Diaz, H.; Melet, A.; Papa, F.; Vousdoukas, M.; Athanasiou, P.; Dada, O.; Almeida, L.P.; et al. A global analysis of extreme coastal water levels with implications for potential coastal overtopping. Nat. Commun. 2021, 12, 3775. [Google Scholar] [CrossRef] [PubMed]
- Suh, K.D.; Kim, S.W.; Kim, S.; Cheon, S. Effects of climate change on stability of caisson breakwaters in different water depths. Ocean. Eng. 2013, 71, 103–112. [Google Scholar] [CrossRef]
- Kumar, R.; Balaji, R.; Mukul, P. Review of Indian research on innovative breakwaters. Indian J.-Geo-Mar. Sci. 2017, 46, 431–452. [Google Scholar]
- Takahashi, H. Stability of composite-type breakwaters reinforced by rubble embankment. Soils Found. 2021, 61, 318–334. [Google Scholar] [CrossRef]
- Sadeghi, K.; Abdeh, A.; Al-Dubai, S. An Overview of Construction and Installation of Vertical Breakwaters. Int. J. Innov. Technol. Explor. Eng. (IJITEE) 2017, 7, 1–5. [Google Scholar]
- Oumeraci, H. Review and analysis of vertical breakwater failures—Lessons learned. Coast. Eng. 1994, 22, 3–29. [Google Scholar] [CrossRef]
- Kurihara, O.; Takahashi, H. Backfilling configuration to improve tenacity of composite-type breakwaters. Coast. Eng. J. 2023, 65, 217–233. [Google Scholar] [CrossRef]
- Magdalena, I.; Marcela, I.; Karima, N.; Jonathan, G.; Harlan, D.; Adityawan, M.B. Two layer shallow water equations for wave attenuation of a submerged porous breakwater. Appl. Math. Comput. 2023, 454, 128096. [Google Scholar] [CrossRef]
- Shiach, J.B.; Mingham, C.G.; Ingram, D.M.; Bruce, T. The applicability of the shallow water equations for modelling violent wave overtopping. Coast. Eng. 2004, 51, 1–15. [Google Scholar] [CrossRef]
- Zhang, J.S.; Zhang, Y.; Jeng, D.S.; Liu, P.L.F.; Zhang, C. Numerical simulation of wave–current interaction using a RANS solver. Ocean. Eng. 2014, 75, 157–164. [Google Scholar] [CrossRef]
- Fang, K.; Xiao, L.; Liu, Z.; Sun, J.; Dong, P.; Wu, H. Experiment and RANS modeling of solitary wave impact on a vertical wall mounted on a reef flat. Ocean. Eng. 2022, 244, 110384. [Google Scholar] [CrossRef]
- Iwamoto, T.; Nakase, H.; Nishiura, D.; Sakaguchi, H.; Miyamoto, J.; Tsurugasaki, K.; Kiyono, J. Application of SPH-DEM coupled method to failure simulation of a caisson type composite breakwater during a tsunami. Soil Dyn. Earthq. Eng. 2019, 127, 105806. [Google Scholar] [CrossRef]
- Sawada, Y.; Miyake, M.; Miyamoto, J.; Kawabata, T. Numerical Analysis on Stability of Caisson-Type Breakwaters under Tsunami-Induced Seepage. Transp. Infrastruct. Geotechnol. 2015, 2, 120–138. [Google Scholar] [CrossRef]
- Mata, M.I.; Boersen, S.; van Gent, M.R.A.; Antonini, A.; Jensen, B.; van der Lem, C. A validation of wave loads on crest walls on top of composite breakwaters using OpenFOAM. In Proceedings of the 37th International Conference on Coastal Engineering (ICCE 2022), Sydney, Australia, 4–9 December 2022; Cox, D., Ed.; American Society of Civil Engineers (ASCE): Reston, VA, USA, 2023. [Google Scholar] [CrossRef]
- Mitsui, J.; Altomare, C.; Crespo, A.J.C.; Domínguez, J.M.; Martínez-Estévez, I.; Suzuki, T.; Kubota, S.; Gómez-Gesteira, M. DualSPHysics modelling to analyse the response of Tetrapods against solitary wave. Coast. Eng. 2023, 183, 104315. [Google Scholar] [CrossRef]
- Barcet, M.; Benguigui, W.; Laviéville, J.; Benoit, M.; Wachs, A.; Fede, P.; Bonometti, T. Resolved DEM-CFD coupling for wave-armour blocks interactions. Ocean. Eng. 2025, 337, 121865. [Google Scholar] [CrossRef]
- Gísladóttir, L.M.; Castellino, M.; Dermentzoglou, D.; Hendriks, M.A.; de Girolamo, P.; van Gent, M.R.; Antonini, A. Curved concrete crownwalls on vertical breakwaters under impulsive wave load: Finite Element Analysis. Coast. Eng. 2025, 201, 104791. [Google Scholar] [CrossRef]
- Ding, D.; Ouahsine, A.; Xiao, W.; Du, P. CFD/DEM coupled approach for the stability of caisson-type breakwater subjected to violent wave impact. Ocean. Eng. 2021, 223, 108651. [Google Scholar] [CrossRef]
- Hsu, T.J.; Sakakiyama, T.; Liu, P.L.F. A numerical model for wave motions and turbulence flows in front of a composite breakwater. Coast. Eng. 2002, 46, 25–50. [Google Scholar] [CrossRef]
- Sakakiyama, T.; Liu, P.L.F. Laboratory experiments for wave motions and turbulence flows in front of a breakwater. Coast. Eng. 2001, 44, 117–139. [Google Scholar] [CrossRef]
- Del Jesús, M.; Lara, J.L.; Losada, I.J. Three-dimensional interaction of waves and porous coastal structures. Part I: Numerical model formulation. Coast. Eng. 2012, 64, 57–72. [Google Scholar] [CrossRef]
- Lin, P. Numerical Modeling of Breaking Waves. Ph.D. Thesis, Cornell University, Ithaca, NY, USA, 1998. [Google Scholar]
- Bao, H. Nodal-Based Discontinuous Deformation Analysis. Ph.D. Thesis, Nanyang Technological University, Singapore, 2010. [Google Scholar]
- Kaidi, S.; Rouainia, M.; Ouahsine, A. Stability of breakwaters under hydrodynamic loading using a coupled DDA/FEM approach. Ocean. Eng. 2012, 55, 62–70. [Google Scholar] [CrossRef]
- Kajishima, T.; Taira, K. Reynolds-Averaged Navier–Stokes Equations. In Computational Fluid Dynamics: Incompressible Turbulent Flows; Springer International Publishing: Cham, Switzerland, 2017; pp. 237–268. [Google Scholar] [CrossRef]
- Zhao, P.H.; Sun, D.P.; Wu, H. Application of a VARANS based resistance-type porosity model on simulating wave interactions with perforated caisson sitting on a rubble-mound foundation. Appl. Ocean. Res. 2021, 112, 102600. [Google Scholar] [CrossRef]
- Ji, S.; Ouahsine, A.; Smaoui, H.; Sergent, P. 3D modeling of sediment movement by ship-generated wakes in confined shipping channel. Int. J. Sediment Res. 2014, 29, 49–58. [Google Scholar] [CrossRef]
- Higuera, P.; Lara, J.L.; Losada, I.J. Three-dimensional interaction of waves and porous coastal structures using OpenFOAM®: Part I: Formulation and validation. Coast. Eng. 2014, 83, 243–258. [Google Scholar] [CrossRef]
- Darcy, H. Les Fontaines Publiques de la Ville de Dijon: Exposition et Application des Principes à Suivre et des Formules à Employer Dans les Questions de Distribution d’eau: Ouvrage Terminé par un Appendice Relatif Aux Fournitures d’eau de Plusieurs Villes, au Filtrage des Eaux et à la Fabrication des Tuyaux de Fonte, de Plomb, de tôle et de Bitume; V. Dalmont: Paris, France, 1856; Volume 2, p. 647. [Google Scholar]
- Forchheimer, P. Wasserbewegung durch Boden. Z. Des Vereins Dtsch. Ingenieure 1901, 45, 1782–1788. [Google Scholar]
- Polubarinova-Kochina, P.Y. Theory of Ground Water Movement; Princeton University Press: Princeton, NJ, USA, 1962. [Google Scholar]
- van Gent, M.R.A. Wave Interaction with Permeable Coastal Structures. Ph.D. Thesis, Delft University of Technology, Delft, The Netherlands, 1995. [Google Scholar]
- Guler, H.G.; Baykal, C.; Arikawa, T.; Yalciner, A.C. Numerical assessment of tsunami attack on a rubble mound breakwater using OpenFOAM®. Appl. Ocean. Res. 2018, 72, 76–91. [Google Scholar] [CrossRef]
- Shi, G.H. Discontinuous deformation analysis: A new numerical model for the statics and dynamics of deformable block structures. Eng. Comput. 1992, 9, 157–168. [Google Scholar] [CrossRef]
- Ding, D.; Ouahsine, A.; Xiao, W.; Du, P. Numerical study of ballast-flight caused by dropping snow/ice blocks in high-speed railways using Discontinuous Deformation Analysis (DDA). Transp. Geotech. 2020, 22, 100314. [Google Scholar] [CrossRef]
- Vu, V.N.; Lee, C.; Jung, T.H. Extended Boussinesq equations for waves in porous media. Coast. Eng. 2018, 139, 85–97. [Google Scholar] [CrossRef]
- Lee, J.J.; Skjelbreia, J.E.; Raichlen, F. Measurement of velocities in solitary waves. J. Waterw. Port Coastal Ocean. Div. 1982, 108, 200–218. [Google Scholar] [CrossRef]
- Higuera, P.; Lara, J.L.; Losada, I.J. Realistic wave generation and active wave absorption for Navier–Stokes models: Application to OpenFOAM®. Coast. Eng. 2013, 71, 102–118. [Google Scholar] [CrossRef]
- Ji, S.C.; Ouahsine, A.; Smaoui, H.; Sergent, P.; Jing, G.Q. Impacts of ship movement on the sediment transport in shipping channel. J. Hydrodyn. 2014, 26, 706–714. [Google Scholar] [CrossRef]
- Ouahsine, A.; Smaoui, H.; Meftah, K.; Sergent, P.; Sabatier, F. Numerical study of coastal sandbar migration, by hydro-morphodynamical coupling. Environ. Fluid Mech. 2012, 13, 169–187. [Google Scholar] [CrossRef]
- Vasquez, J.; Steffler, P.; Millar, R. Modeling Bed Changes in Meandering Rivers Using Triangular Finite Elements. J. Hydraul. Eng. (ASCE) 2008, 134, 1348–1352. [Google Scholar] [CrossRef]
Disclaimer/Publisher’s Note: The statements, opinions and data contained in all publications are solely those of the individual author(s) and contributor(s) and not of MDPI and/or the editor(s). MDPI and/or the editor(s) disclaim responsibility for any injury to people or property resulting from any ideas, methods, instructions or products referred to in the content. |
© 2025 by the authors. Licensee MDPI, Basel, Switzerland. This article is an open access article distributed under the terms and conditions of the Creative Commons Attribution (CC BY) license (https://creativecommons.org/licenses/by/4.0/).