Abstract
Considering that the information contained in the interference structure of the “target-receiver” path in active sonar is crucial for remote sensing of the target position or the environmental information, this paper studies the method for coherent extraction and enhancement of the interference structure of the scattered sound field using a monostatic horizontal line array (HLA) in deep water. The HLA element–frequency domain sound intensity interference pattern of the monostatic scattered sound field is numerically simulated, and the “cutting” effect on the pattern is explained by combining the scattered sound pressure expression. Then, the mechanism of the sound propagation effect of the “source-target” path on the interference structure of the “target-receiver” path is clarified. In deep water, the phase relationship of the HLA scattered sound pressure is derived based on the ray theory, and its similarity with the phase relationship of the array passive received signals affected by the source spectrum is researched. The method for the coherent enhancement of the interference structure between the target and the reference array element for the deep-water active sonar is proposed, which uses the phase information of the single-element (SE) signal to generate the array cross-correlation data and then performs striation-based beamforming on it (i.e., the striation–correlation-based beamforming with single element, SCBF-SE). The results of numerical simulation and sea trial data analysis show the effectiveness of this method for interference structure enhancement. The performance differences between SCBF-SE and the incoherent accumulation of the striation energy (IASE) method in interference structure enhancement are compared. The results indicate that SCBF-SE has better performance under the conditions of the same received signal-to-noise ratio and the number of array elements.
1. Introduction
In physics, when two or more waves with different phases arrive at the receiving point together, interference occurs. In the sound field, the total interference structure is formed by the superposition of interference structures contributed by different multipaths (or modes), and its structure becomes more complex. When the parameters such as the signal frequency, range and sound speed profile under study change, the interference structure characteristics (amplitude, frequency selectivity, etc.) of the sound field change accordingly. Therefore, we can observe the interference structure on the range–frequency sound intensity spectrum, which can form interference striations as the range and frequency change.
The geometric characteristics of interference striations are mainly reflected in their slope, and the widely used tool to describe this parameter is the waveguide invariant [1]. Since the waveguide invariant integrates information such as the signal frequency, the source range and the striation slope, it has also been used in many fields of underwater acoustics, such as passive ranging [2,3,4,5], source depth estimation [6,7,8] and beamforming algorithms [9,10,11]. By utilizing the array signals collected at different receiving depths, a broadband interference pattern can be constructed in the frequency–depth domain [12,13], which can be used for source localization. In addition, in the applications related to horizontal line array (HLA) signal processing, a notable feature is that inclined interference striations can be observed at the range scale where the element position changes [10]. Moreover, by using the definition of waveguide invariant and the striations formation conditions, the phase and amplitude relationship between two points at different positions on the interference structure can be further characterized [14,15]. This enables coherent processing based on striations to be possible, such as the frequency shift compensation to improve the array signal correlation [14] and striation-based beamforming (SBF) [10,11]. These coherent processing methods can also improve the array processing gain to a certain extent [16,17].
The above research on the waveguide invariant is mainly focused on the passive sonar. With the development of the theory of the target scattered sound field in waveguide, researchers have gradually turned their attention to the analysis of the interference structure and waveguide invariant of active sonar-received signals. Quijano et al. [18] extend the waveguide invariant to the active sonar and verify the active waveguide invariant through shallow-water trials. The range–frequency domain interference striations observed in the experiment were relatively blurred due to the low signal-to-noise ratio (SNR) of the echo. Furthermore, Quijano et al. [19] analyze the influence of the target’s scattered characteristics and active sonars’ configuration on the active waveguide invariant through a water tank experiment. The results show that the scattered characteristics of the target have a significant impact on the interference pattern, but some time–frequency interference characteristics are still retained. Under the premise that the active waveguide invariant is approximately equal to 1, He et al. [20] combine the additional information provided by the time–frequency interference structure and add frequency as a constraint to the extended Kalman filter to improve the target tracking performance.
For active sonar, similar to the passive sonar scenario [21], the interference structure between the target and receiver contains both the propagation characteristics of the sound field and the target’s location information—features that are highly significant for target positioning and classification [20,21,22,23]. Zurk et al. [24] pointed out that in deep water, the sound intensity of the active sonar-received signals can also form interference striations similar to those of the passive sonar in the array element–frequency domain. Meanwhile, leveraging SBF’s capability to process coherently along striations, they further applied it to active sonar array signal processing—achieving better fidelity of the interference structure in the broadband beam output compared to conventional beamforming (CBF). However, this study was based on an echo-repeater source and cannot reflect the combined influence of sound propagation along the “source-target” path and target scattering characteristics on the interference structure. The coupling relationship between the sound field interference structure of the “source-target” path and that of the “target-receiver” path is also not discussed in Ref. [24].
Mathematically, for active sonar, sound propagation along the “source-target” path can induce an amplitude modulation effect on the interference structure of the “target-receiver” path. Owing to the frequency selectivity of the interference structure, this modulation manifests as a “cutting” effect where one path’s interference structure is impinged upon by another, disrupting the distribution pattern of the interference structure [25]. The inclusion of the target scattering characteristic function can further exacerbate this cutting effect. In this paper, it is shown that in active sonar, the combined influence of “source-target” path sound propagation and target scattering characteristics can resemble the influence of the source amplitude spectrum on the “target-receiver” path interference structure in passive sonar. For the latter, Liu et al. [11] have shown that the striation–correlation-based beamforming with single element (SCBF-SE) can be used to suppress the source amplitude spectrum and maintain the interference structure of the “target-receiver” path in passive sonar with good fidelity. Therefore, in this paper, considering the complete “source-target-receiver” signal transmission path in the active sonar, an attempt is made to extend SCBF-SE to active sonar signal processing, and to explore the feasibility of using SCBF-SE to enhance the interference structure of the “target-receiver” path. This is of great significance for research on suppressing the combined influence of “source-target” path sound propagation and target scattering characteristics, and for obtaining target position information using the range–frequency characteristics of active sonar echoes. In addition, SCBF-SE eliminates the sound source spectrum through a cross-correlation process, making it possible to omit the matched filtering process in traditional active sonar processing (i.e., avoiding the prior information on source waveform). Meanwhile, the suppression of the “source-target” path interference structure and enhancement of the “target-receiver” path interference structure can further convert the two-way detection problem into a single-way one (i.e., analogous to a passive acoustic scenario), thereby expanding target detection means—enabling both active and passive signal processing to be applied.
This paper is structured as follows. Based on the modeling of scattered sound pressure at different array elements in deep water and the distribution of scattered sound intensity in element–frequency domain, the principle of scattered field interference and the cutting effect is explained in Section 2. The phase relationship of the scattered sound pressure with the horizontal line array (HLA) in the active sonar is conducted in Section 3, followed by analyzing its similarity with the phase relationship of passive received signals affected by the source spectrum and extending SCBF-SE to enhance the interference structure of the scattered sound field. The enhancement for the interference structure is simulated in Section 4, including the simulation results and performance analysis. Then, the experimental data are analyzed in Section 5. Finally, the conclusions are given in Section 6.
2. Interference of Deep-Water Scattered Sound Signals in the Element–Frequency Domain
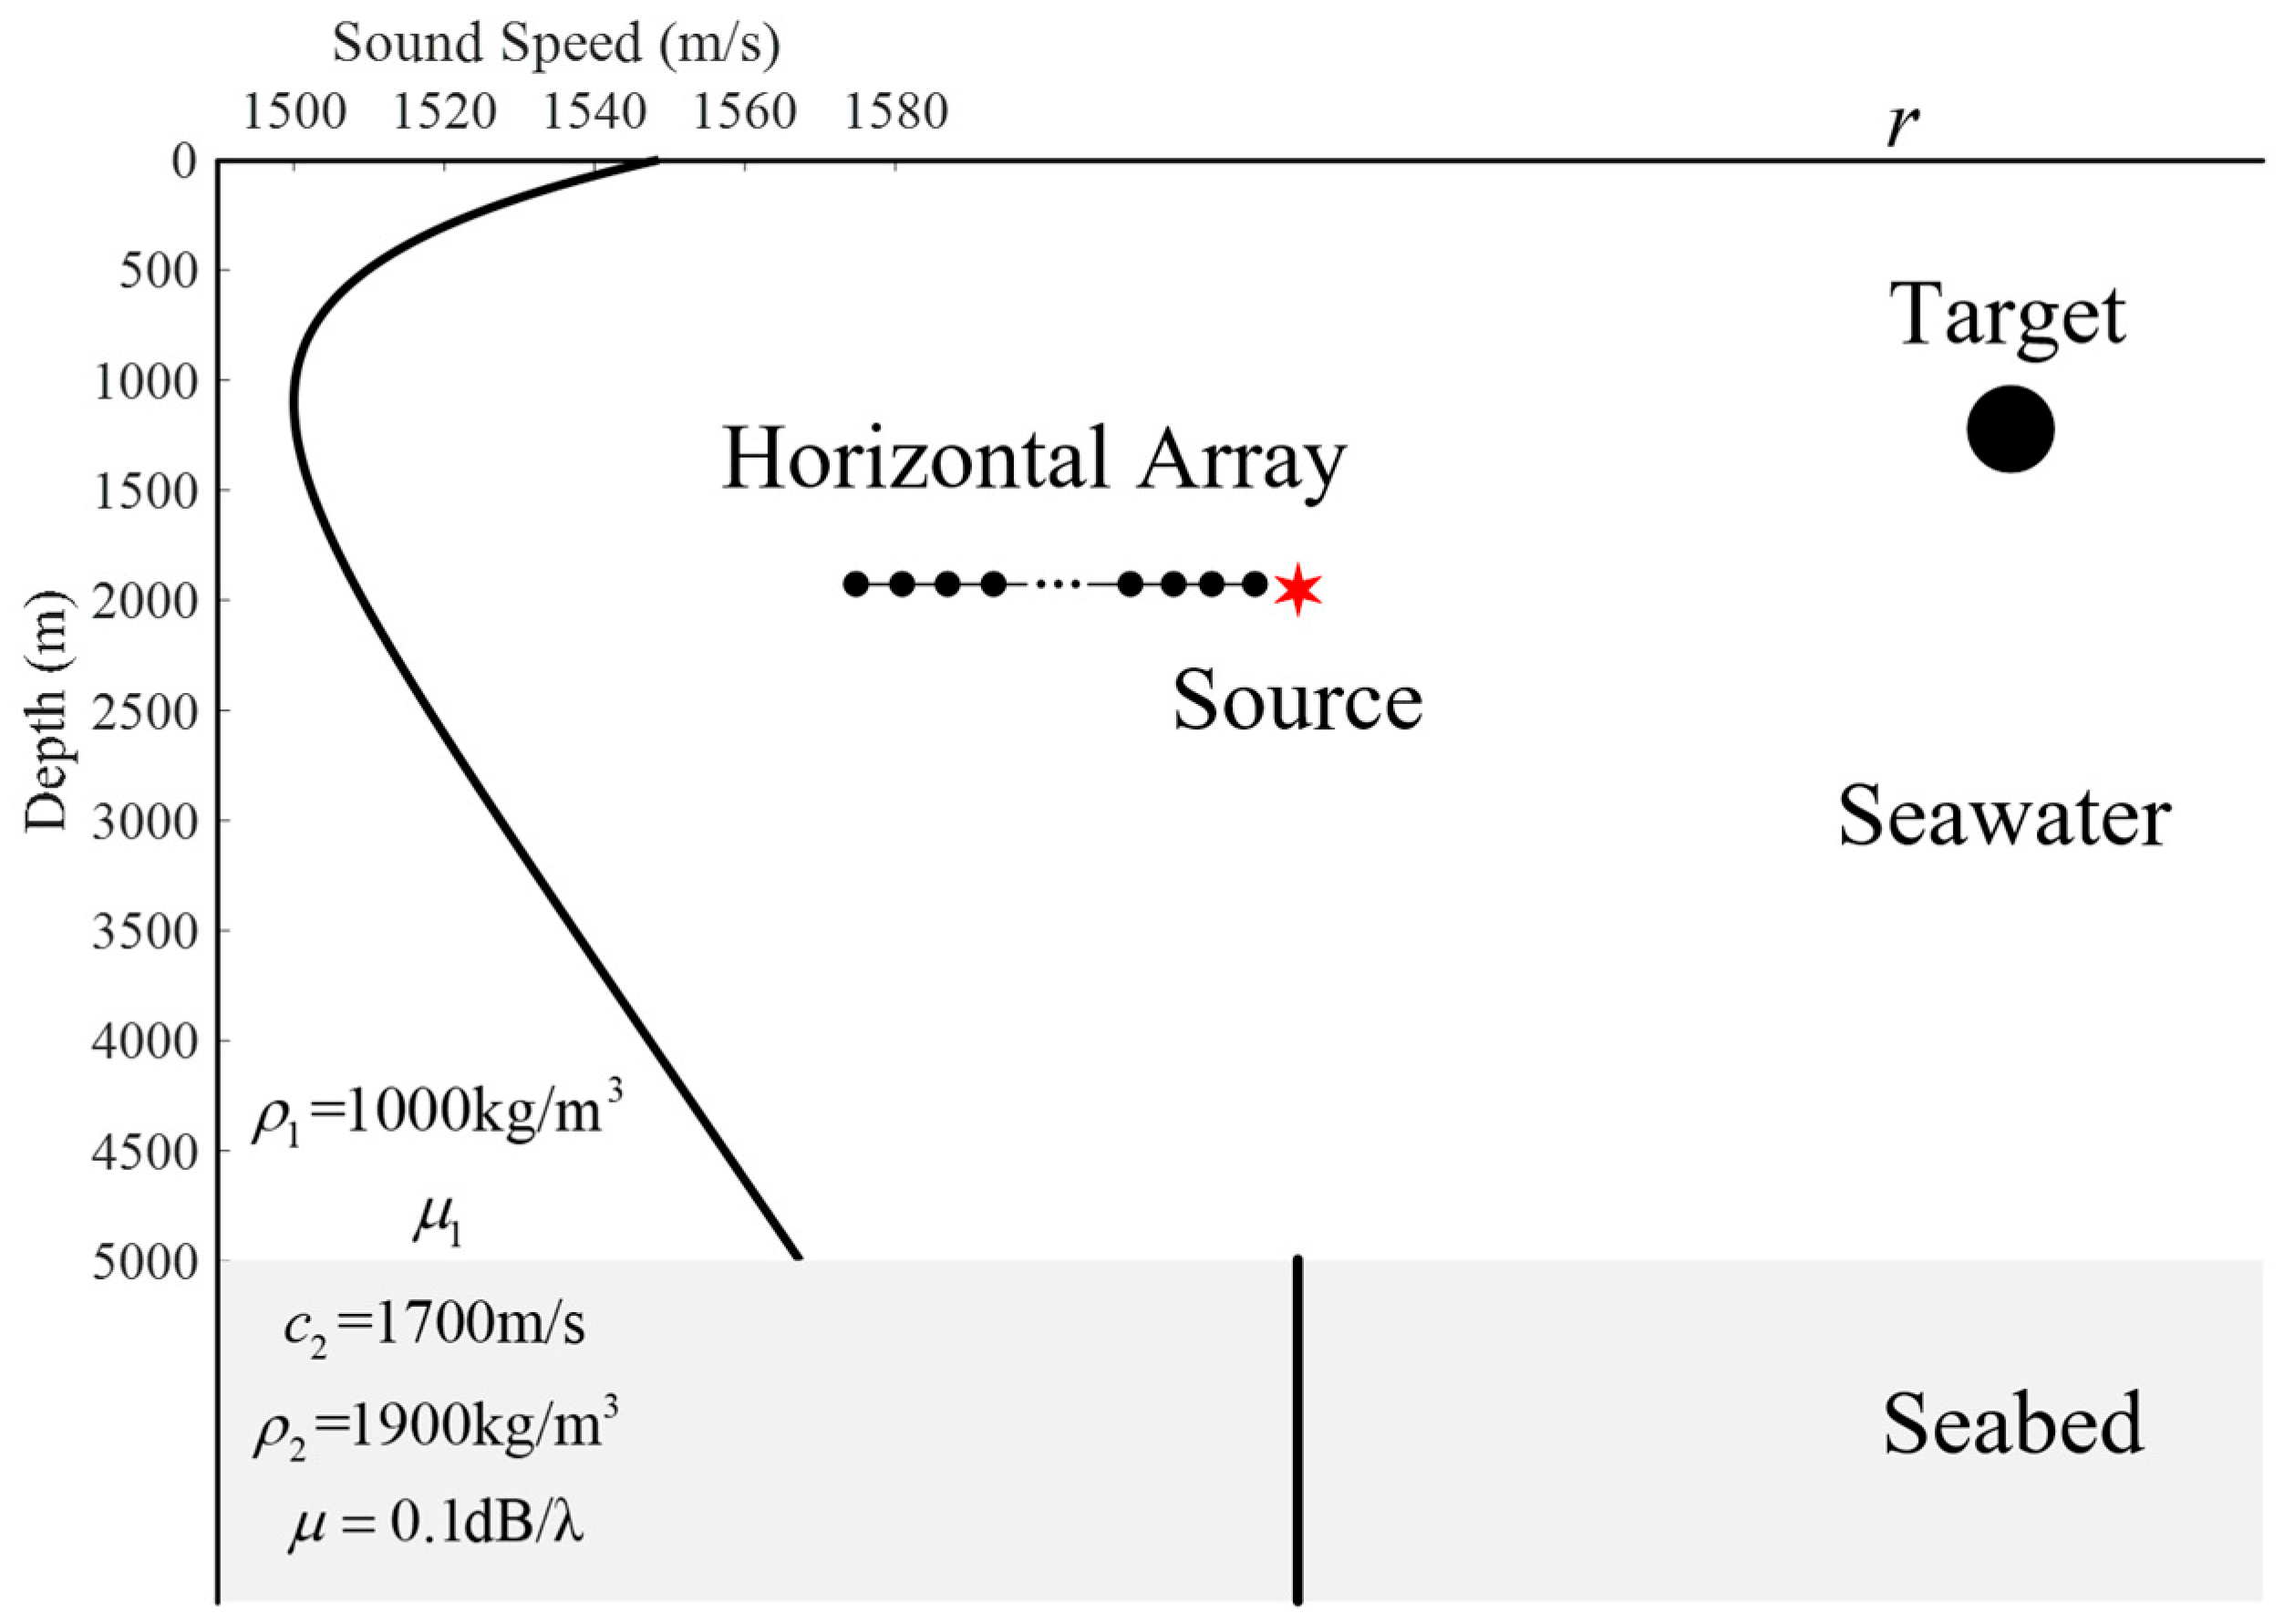
Firstly, a simulation case is employed to show the “cutting” effect of the interference structure within the deep-water scattered sound field. Figure 1 depicts the simulation environment. The receivers used in the simulation are uniformly spaced arrays, each element of which is an omnidirectional sound pressure sensor. The sound speed profile used in the simulation is the Munk profile [26]. The relationship between the sound speed and the depth is shown as [26]
where , is the converted depth, and is the depth of the acoustic channel axis.
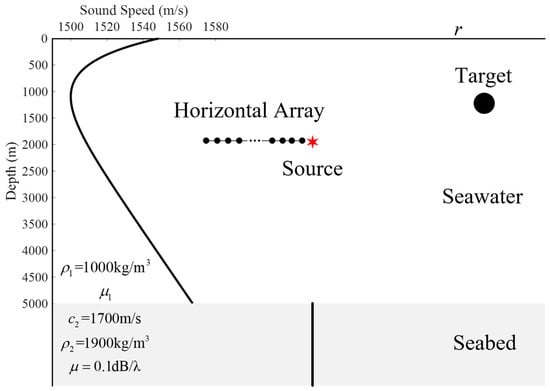
Figure 1.
Schematic of the scattered sound field for the monostatic active sonar with the HLA in deep water. The sound speed profile used in the simulation is the Munk profile. The target depth is set at 200 m. An HLA with an aperture of 75 m and an element spacing of 0.75 m is deployed at a depth of 500 m to receive signals. The central element of the array serves as the reference element, with a horizontal distance of 2.5 km to the target. The source is collocated with the HLA. The sound speed and medium densities of the seawater and seabed are as labeled in the diagram, and their absorption parameters are referenced from [27]. The studied frequency band is 950~1050 Hz. The target is modeled as an omnidirectional target.
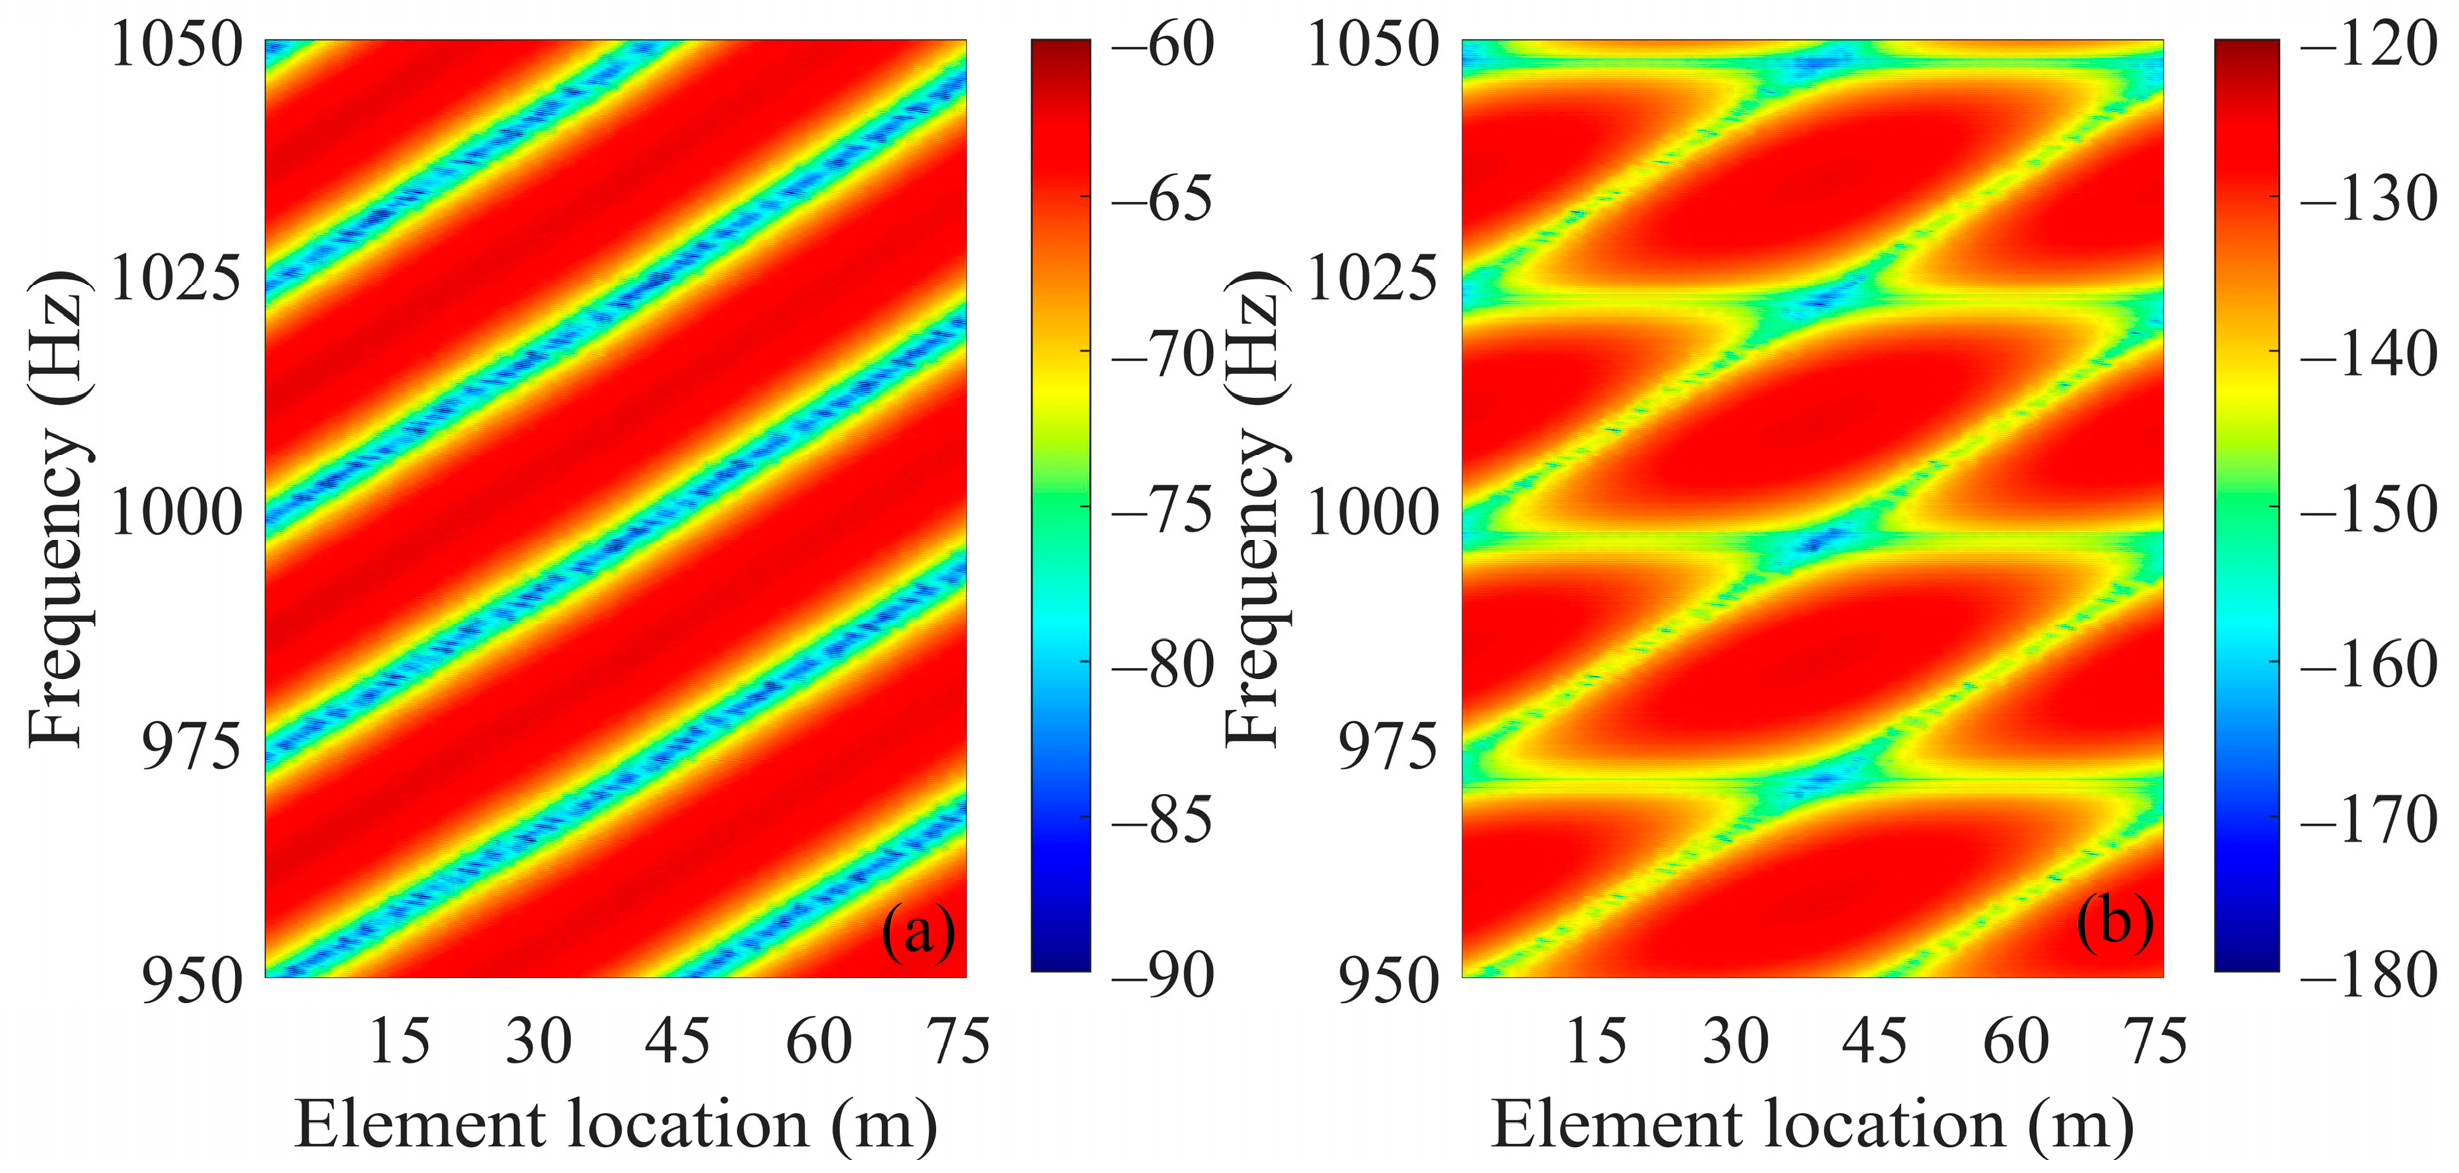
Figure 2a illustrates the results of the interference patterns formed in the element–frequency domain for the one-path acoustic propagation from the target to the receiving array (i.e., the “target- receiver” path). Figure 2b illustrates the scattered acoustic signals from the sound source to the target and then to the receiving array (i.e., the “source-target-receiver” path). A comparison of Figure 2a,b reveals that, in contrast to the one-path propagation of the target–receiver path in Figure 2a, the originally inclined interference striations appear “cut” and fragmented into block-like shapes in Figure 2b.
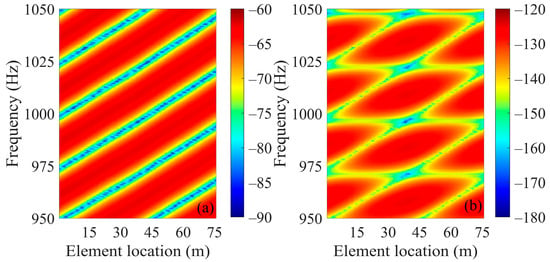
Figure 2.
Numerical simulation results of the interference pattern of the scattered sound field in element–frequency domain with an HLA in deep water. (a) One-path propagation from the target to the HLA (i.e., the “target- receiver” path); (b) scattered sound field formed by propagation from the source to the target and then to the HLA (i.e., the “source-target-receiver” path).
The mathematical representation of the scattered sound field can be utilized to conduct a theoretical analysis of this striation cutting phenomenon. As known from [24], with the Kirchhoff approximation and the ray theory, the mathematical expression of the scattered sound pressure received by a certain reference element in the HLA can be expressed as [27]
where and represent amplitude and the range from the source to the incident point of the target for the m-th eigenray, and represent amplitude and the range from the exit point to the receiver for the n-th eigenray, represents the horizontal range from the target to the reference element, represents the signal frequency, is the scattering function related to the incident angle and scattering angle . In the active sonar signal processing, the influence of the phase spectrum of the source on the received signals can be eliminated through the matched filtering. Therefore, the sound source term is not explicitly expressed in Equation (2).
If the target is assumed to be an omnidirectional target, i.e., it satisfies [25] where C is a constant, then the waves emitted by the source have the same sound propagation effect on all receiving array elements during the propagation from the source to the target. Assuming that the frequency response of the waves in the source–target propagation path is , then Equation (2) can be simplified to
where
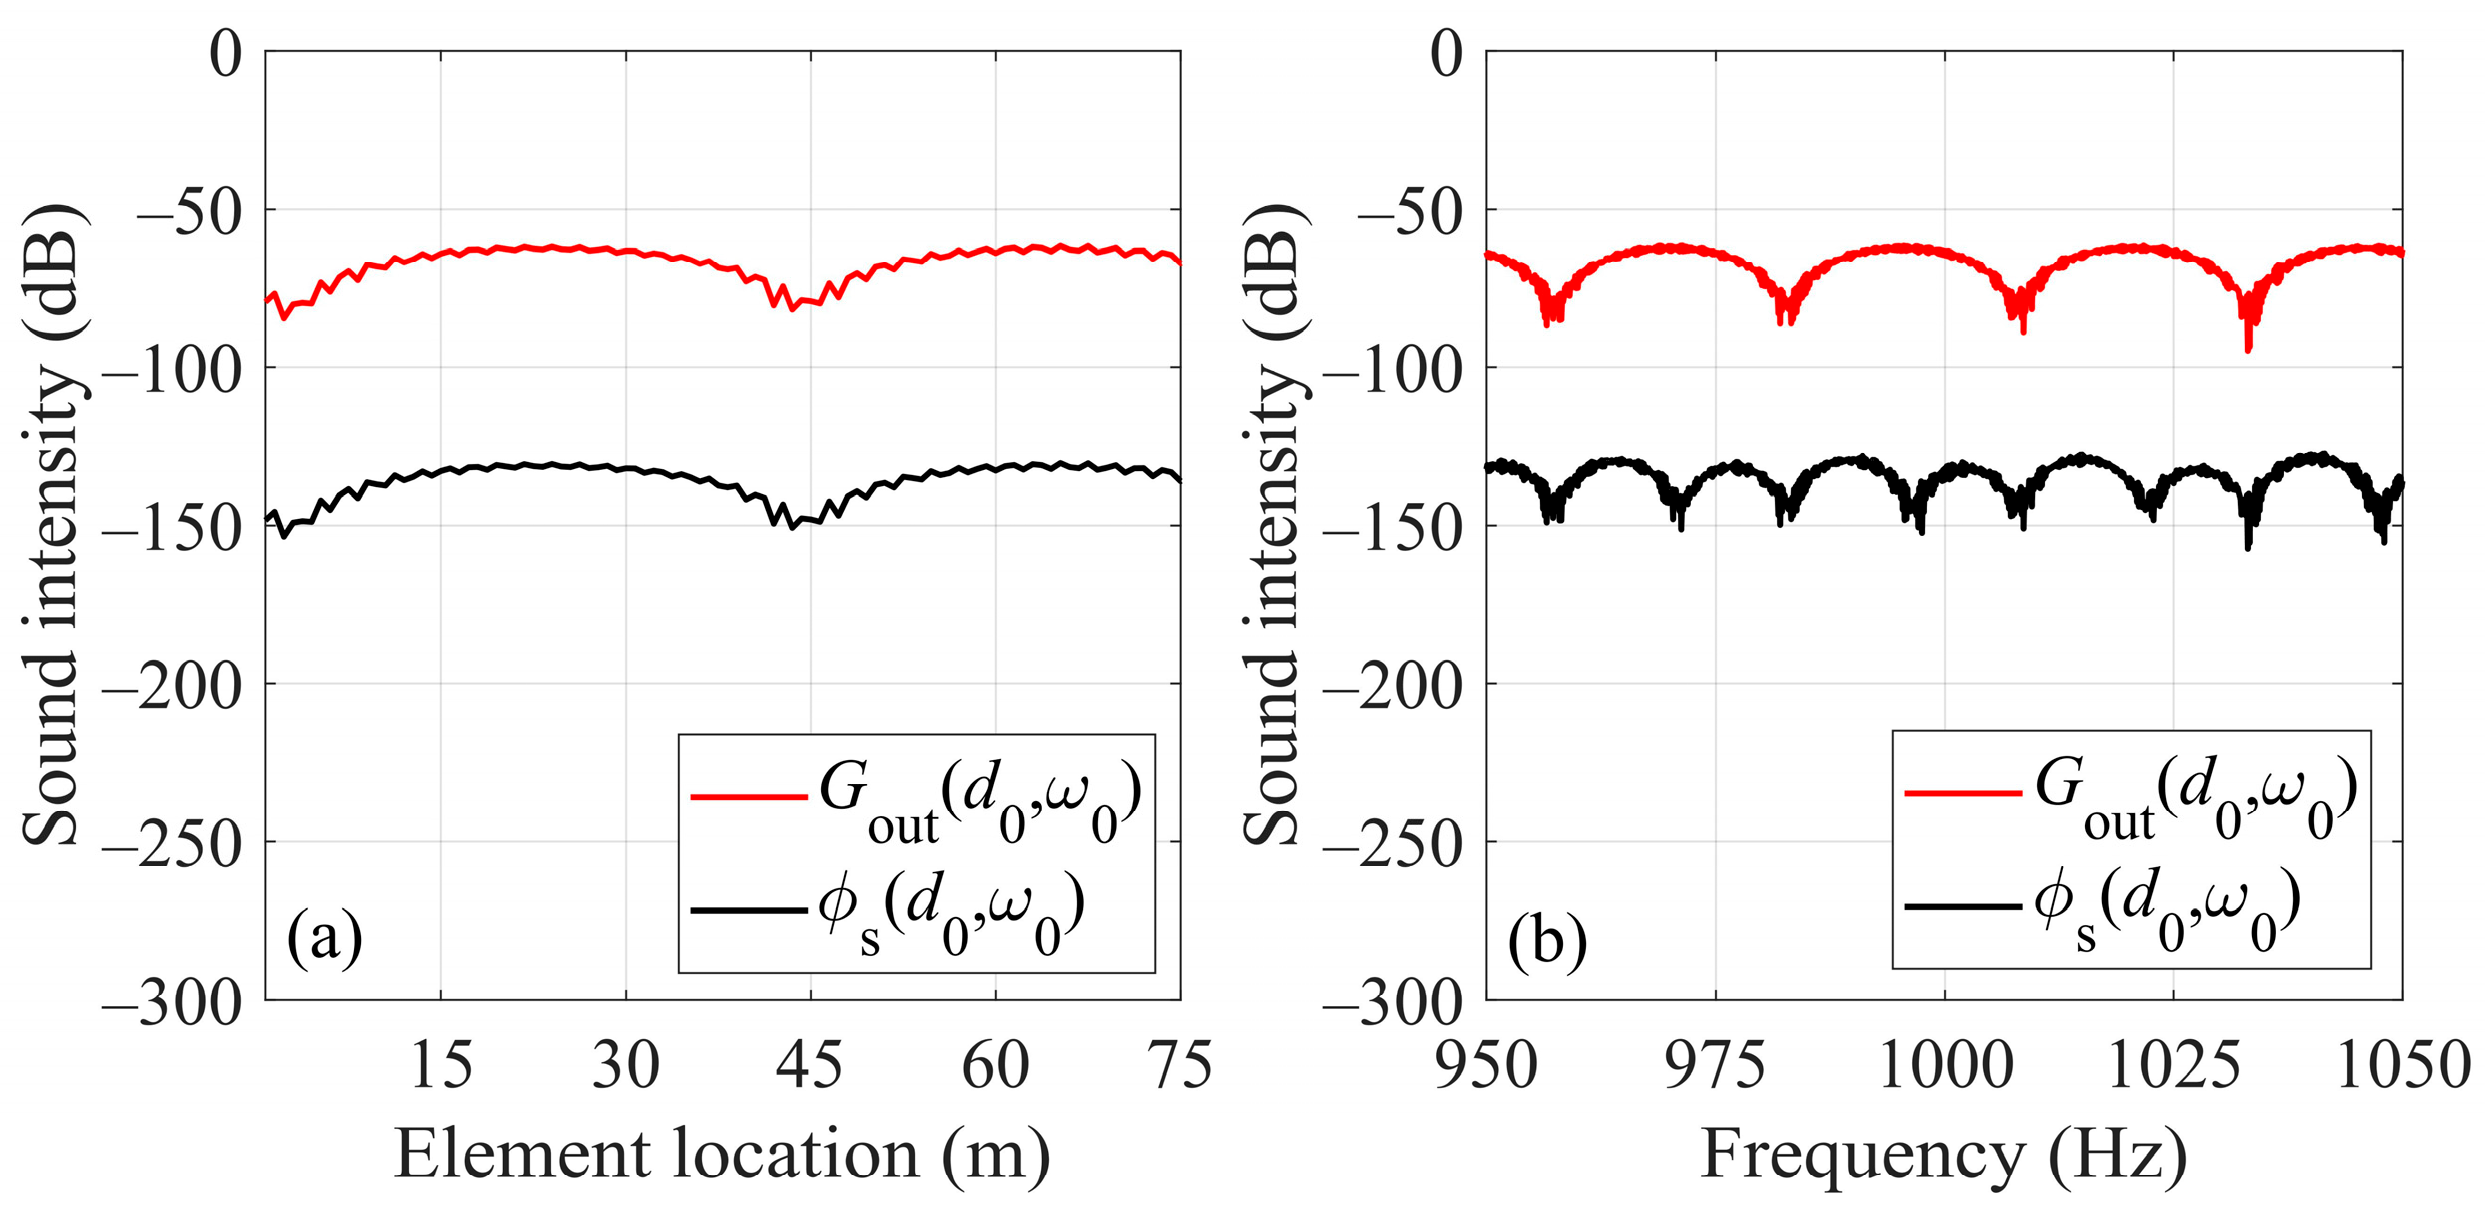
is the Green’s function of the target–receiver path. It can be seen that for the scattered sound signals received by the HLA, the information on the target range is provided by Equation (3). To illustrate the influence of the source–target path on the target–receiver path’s interference structure, Figure 3 shows the sound intensity curves with frequency and array element position held constant, respectively. It can be seen that, although the frequency response of the source–target path () does not change with the variations in the array element position, its amplitude spectrum can produce a cutting effect (or the amplitude modulation) on the interference structure of the target–receiver path (i.e., the square of the amplitude spectrum of ).
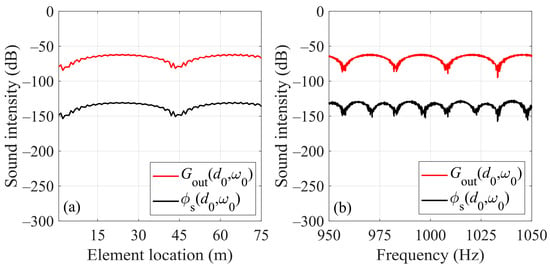
Figure 3.
The simulation results of the sound intensity curves for the scattered sound field on the HLA. (a,b) are the curves of the sound intensity at frequency 1000 Hz and element location 0 m, respectively.
To further understand the cutting effect on interference pattern, as shown in Figure 3a, when the frequency is constant, the effect of the source–target propagation path on the interference structure of the target–receiver path is equivalent to introducing a constant (which is independent of element position), then the intensity curve corresponding to the two-path propagation field () has an overall shift. As can be seen in Figure 3b, when the array element position is constant, since the frequency response is related to the frequency, the sound intensity curve corresponding to the two-path field has not only a frequency-related shift but also amplitude modulations. Finally, considering different element positions and frequencies, the scattered sound intensity of element–frequency domain results in the cutting striations as shown in Figure 2b.
The analysis of the cutting effect in this section is conducted in a deep-water environment and employs the ray model to facilitate the analysis. A similar explanation of this cutting effect under the shallow-water normal mode model can be found in Reference [23].
3. Coherent Enhancement of Interference Structure of Scattered Sound Field
Existing interference structure enhancement methods include coherent methods (such as SBF [24]) and incoherent methods (such as image processing methods [28,29]). Among them, SBF can utilize the amplitude and phase information of received signals from phase matching process. However, it requires knowledge of the source spectrum and elimination of the phase difference induced by striation-based processing via frequency shift [24], so as to steer its main lobe toward the source azimuth. In contrast, the incoherent methods usually work on the sound intensity (only amplitude information is used), so it avoids the influence from phase terms. However, this makes it fail to achieve coherent processing gain, which may result in sensitivity to ambient noise.
In passive sonar signal processing, SCBF-SE enables the extraction of element–frequency domain sound intensity interference structures using a horizontal line array (HLA). Through autocorrelation of array signals, it eliminates the influence of the source amplitude spectrum and the truncated phase caused by signal truncation point selection, thereby achieving target azimuth estimation [11]. In SCBF-SE processing, the source amplitude spectrum also exerts a destructive effect on the sound intensity interference structure in the element–frequency domain (as illustrated in Figure 4 of Reference [11]), which is analogous to the cutting effect of the “source-target” path on the “target-receiver” path interference structure in active sonar, as discussed in Section 2. This thus implies that, for the scattered sound field of active sonar employing an HLA, array cross-correlation data can be generated using the single-element (SE) signal to suppress the transmitted source amplitude spectrum. Subsequently, striation-based coherent processing is applied to these data to suppress the influence of the “source-target” path interference structure, thereby enhancing the structure information of the “target-receiver” path interference with coherent processing gain.
3.1. Phase Relationship of the Scattered Sound Pressure with the HLA
First, we can establish the phase relationship of the sound pressure between two array elements on the same striation in the interference pattern of the HLA scattered sound field. Under the far-field assumption, if the target azimuth is and the horizontal range between the target and the reference element is , then for the other receiving element with a spacing of from the reference element, the horizontal range between it and the target is
On this basis, the striation equation can be written as
is also the corresponding frequency of this receiving element on the same striation, where the frequency shift is . In Equation (6), is the center frequency of the interference striation, is the striation slope, and satisfies
Considering that the received scattered pressure of the reference element at the center frequency is , then the received scattered pressure of the other array element with a spacing of on the same striation can be written on the basis of Equation (3) as
where and . In Equation (8), can be expressed on the basis of Equation (4) as
where is the propagation distance of the n-th ray between the target and the receiving element with a spacing of . actually corresponds to the Green’s function from the sound source to the receiver in the passive scenario, and its simplification process can thereby refer to that of the deep-water passive scenario as discussed in Ref. [28]. Assuming is the horizontal range between the target and the receiver (same as defined in Equation (4)), the target depth is , the receiver depth is , the sea depth is , the propagation distance of the n-th ray can be written as [30]
where is the longitudinal distance generated by the n-th ray when it is reflected between the sea surface and the seabed (e.g., the direct path ray has ).
Under the far-field assumption, there is , so [30]
and
where is the grazing angle of the n-th ray. Substituting Equations (11) and (12) into Equation (9), we can get
Considering the q-th ray that contributes to the striation, Equation (13) can be further written as
where .
According to the definition of wavenumber, can be expressed as
where is the sound speed. For the striation formed by the interference of the n-th ray and the q-th ray, its sound intensity nearly satisfies
where represents one certain constant. Further, Equation (16) requires that the total differential of the sound intensity with respect to range and frequency is 0, that is,
Under the far-field assumption, Equation (16) can be further derived as [30]
According to Equations (11) and (18),
that is,
Combining Equations (11)–(13) and Equations (19) and (20), as well as the Green’s function of the target–receiver path shown in Equation (4), Equation (14) can be further simplified to
Substituting Equation (21) into Equation (8), we have
Using and , as well as the relationship between the distance and grazing angle shown in Equation (12), Equation (22) can be written as
where .
Equation (23) is the phase relationship of the scattered sound pressure between two points on the same striation in the interference pattern of the HLA scattered sound field in deep water. The presence of phase term causes the azimuth output by SBF to deviate from the true target azimuth, which is consistent with the discussion in Ref. [24].
3.2. Similarity Analysis of Phase Relationship of Passive Received Signals Affected by Source Spectrum
In passive sonar signal processing, the phase relationship of the pressure signals between two points on the same striation considering the influence of the source spectrum and the truncation phase is [11]
where , is the source spectrum with frequency shift, is the phase shift caused by the truncation time, and are the Green’s function between the target and the reference element, and are the group velocity and phase velocity of the n-th normal mode.
Comparing Equations (22) and (24), the following conclusions can be drawn:
- (1)
- The scattered sound field received by the active sonar can be expressed as the product of the factor containing the Green’s function of the source–target path (i.e., ), the Green’s function of the target–receiver path (i.e., ) and three phase terms, i.e.,
- (2)
- In contrast, for the passive sonar, the received signals can be expressed as the product of the factor containing source spectrum (i.e., ), the Green’s function of the target–receiver path (i.e., ) and three phase terms, i.e.,
Therefore, the received signals of active and passive sonar share a similar form. Specifically, the factor containing the source spectrum in passive sonar (i.e., in Equation (24)) and the factor containing the Green’s function of the source–target path in active sonar (i.e., in Equation (22)) exert an equivalent effect on their respective received signals.
The above results indicate that active sonar signals possess a phase relationship structure adaptable to the SCBF-SE algorithm used in passive sonar processing. For the scattered signals received by active sonar, the phase of the single-element signal can be cross-correlated with the signals of all array elements. Subsequently, the cross-correlated array data are coherently superimposed along the interference striations to suppress the interference structure disruption caused by the sound propagation effect of the source–target path, thereby enhancing the interference structure of the target–receiver path. This is elaborated in the next subsection.
3.3. SCBF-SE in the Active Sonar to Enhance the Interference Structure
3.3.1. Single-Element Phase Cross-Correlation of the Scattered Sound Field
We introduce the frequency shift to the received signals of the reference element shown in Equation (3) and extract the contribution of the q-th ray to the sound field, and have
The phase of Equation (27) is
where and are, respectively, the phases of and
Multiply the conjugate of with the phase relationship of the scattered sound pressure shown in Equation (22), and the phase cross-correlation data of the single element of the scattered sound field in deep water with the HLA is obtained as
In Equation (30), it can be found that the phase of the frequency response of the source–target propagation path has been eliminated. Although the source spectrum is omitted in the formula, its phase is actually eliminated by this cross-correlation process, thus replacing the role of matched filtering. The phase term that leads to the azimuth shift in SBF is also eliminated while the term is still reserved, so there is no need for azimuth correction process as discussed in Ref. [24] and the azimuth information can still be extracted by matching the phase term . At the same time, the amplitudes of Equations (22) and (31) satisfy
This shows that the interference structures reflected by the phase cross-correlation data and the scattered sound pressure signal are still consistent.
3.3.2. SCBF and the Enhancement of the Interference Structure of the Scattered Sound Field
The beamforming weight coefficient of the SCBF-SE is [11]
where is the search angle of beamforming, and is the length of the HLA. Then, after performing SCBF-SE on the array cross-correlation data shown in Equation (30), the beam output in frequency domain is obtained as
where “” represents the conjugate operation. If the main lobe direction of the beam output is , referring to the formula derivations in the Ref. [11], the main lobe beam output of SCBF-SE in this active sonar scenario can be obtained as
Equation (34) shows that the main lobe beam output of SCBF-SE can be expressed as the product of a constant , a phase shift term and the Green’s function of the target–receiver path. Taking the amplitude information into consideration, it further has
where is one certain constant related to .
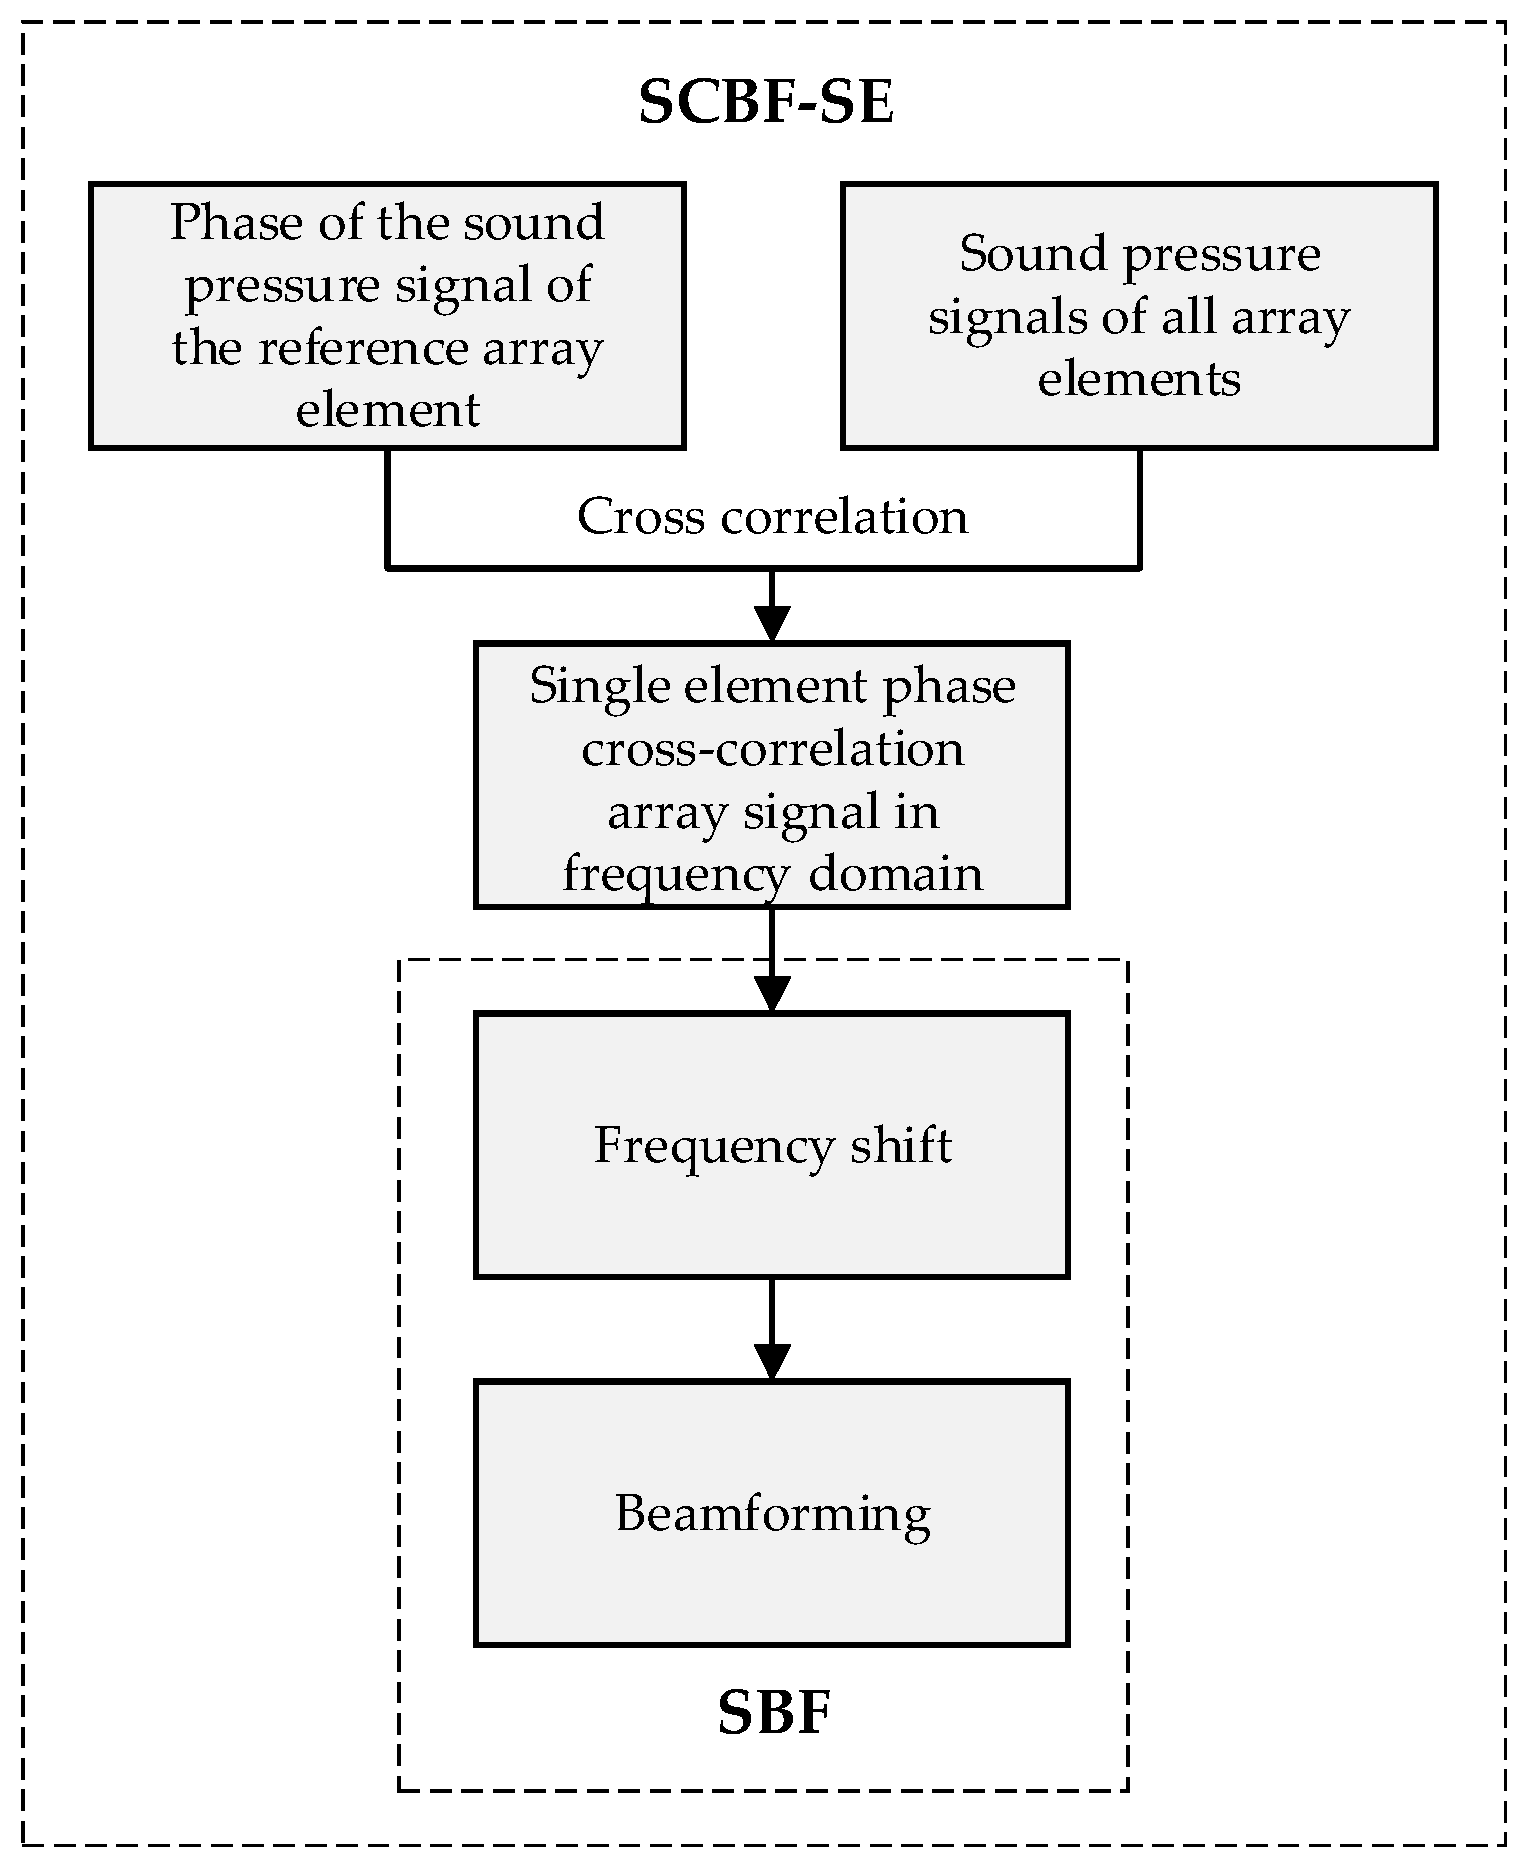
Equation (35) illustrates that the main lobe beam output of SCBF-SE can be used to enhance the interference structure of the target–receiver path. Through the cross-correlation process between the SE signal and the signals of other elements, the phase spectrum—including those of the source spectrum and the Green’s function of the source–target path—are eliminated (thus making the matched filtering process redundant as well). Next, striation-based processing is used to suppress the influence of the amplitude spectrum of the source–target path Green’s function on the target–receiver path interference structure. Finally, the enhancement and extraction of the target–receiver path interference structure are achieved by leveraging the consistency between the SCBF-SE beam output and the amplitude of the source–target path Green’s function. The scheme of SCBF-SE is shown in Figure 4.
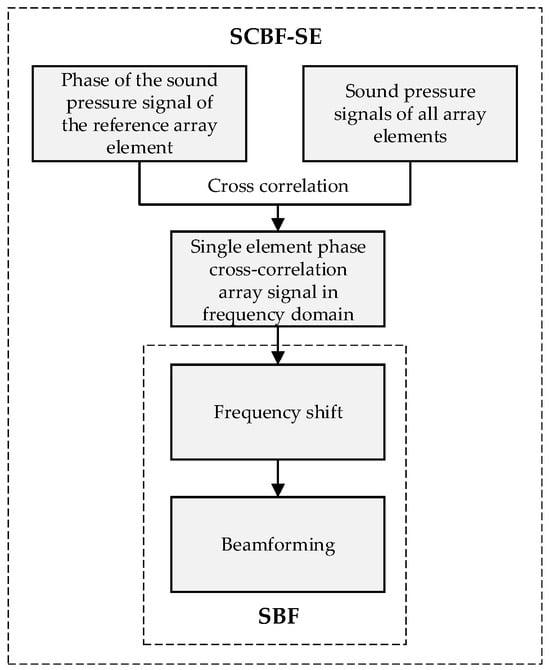
Figure 4.
The scheme of SCBF-SE.
4. Simulation Results and Performance Analysis of the Enhancement for the Scattered Sound Field Interference Structure
4.1. Simulation Results
In this section, the effect of the SCBF-SE on the enhancement for the interference structure of the target–receiver path is analyzed when the target is an omnidirectional target and a rigid sphere. The simulation environment and the signal frequency are consistent with those in Section 2, and the simulation is conducted with the scattering model as presented in Ref. [27].
4.1.1. Omnidirectional Target
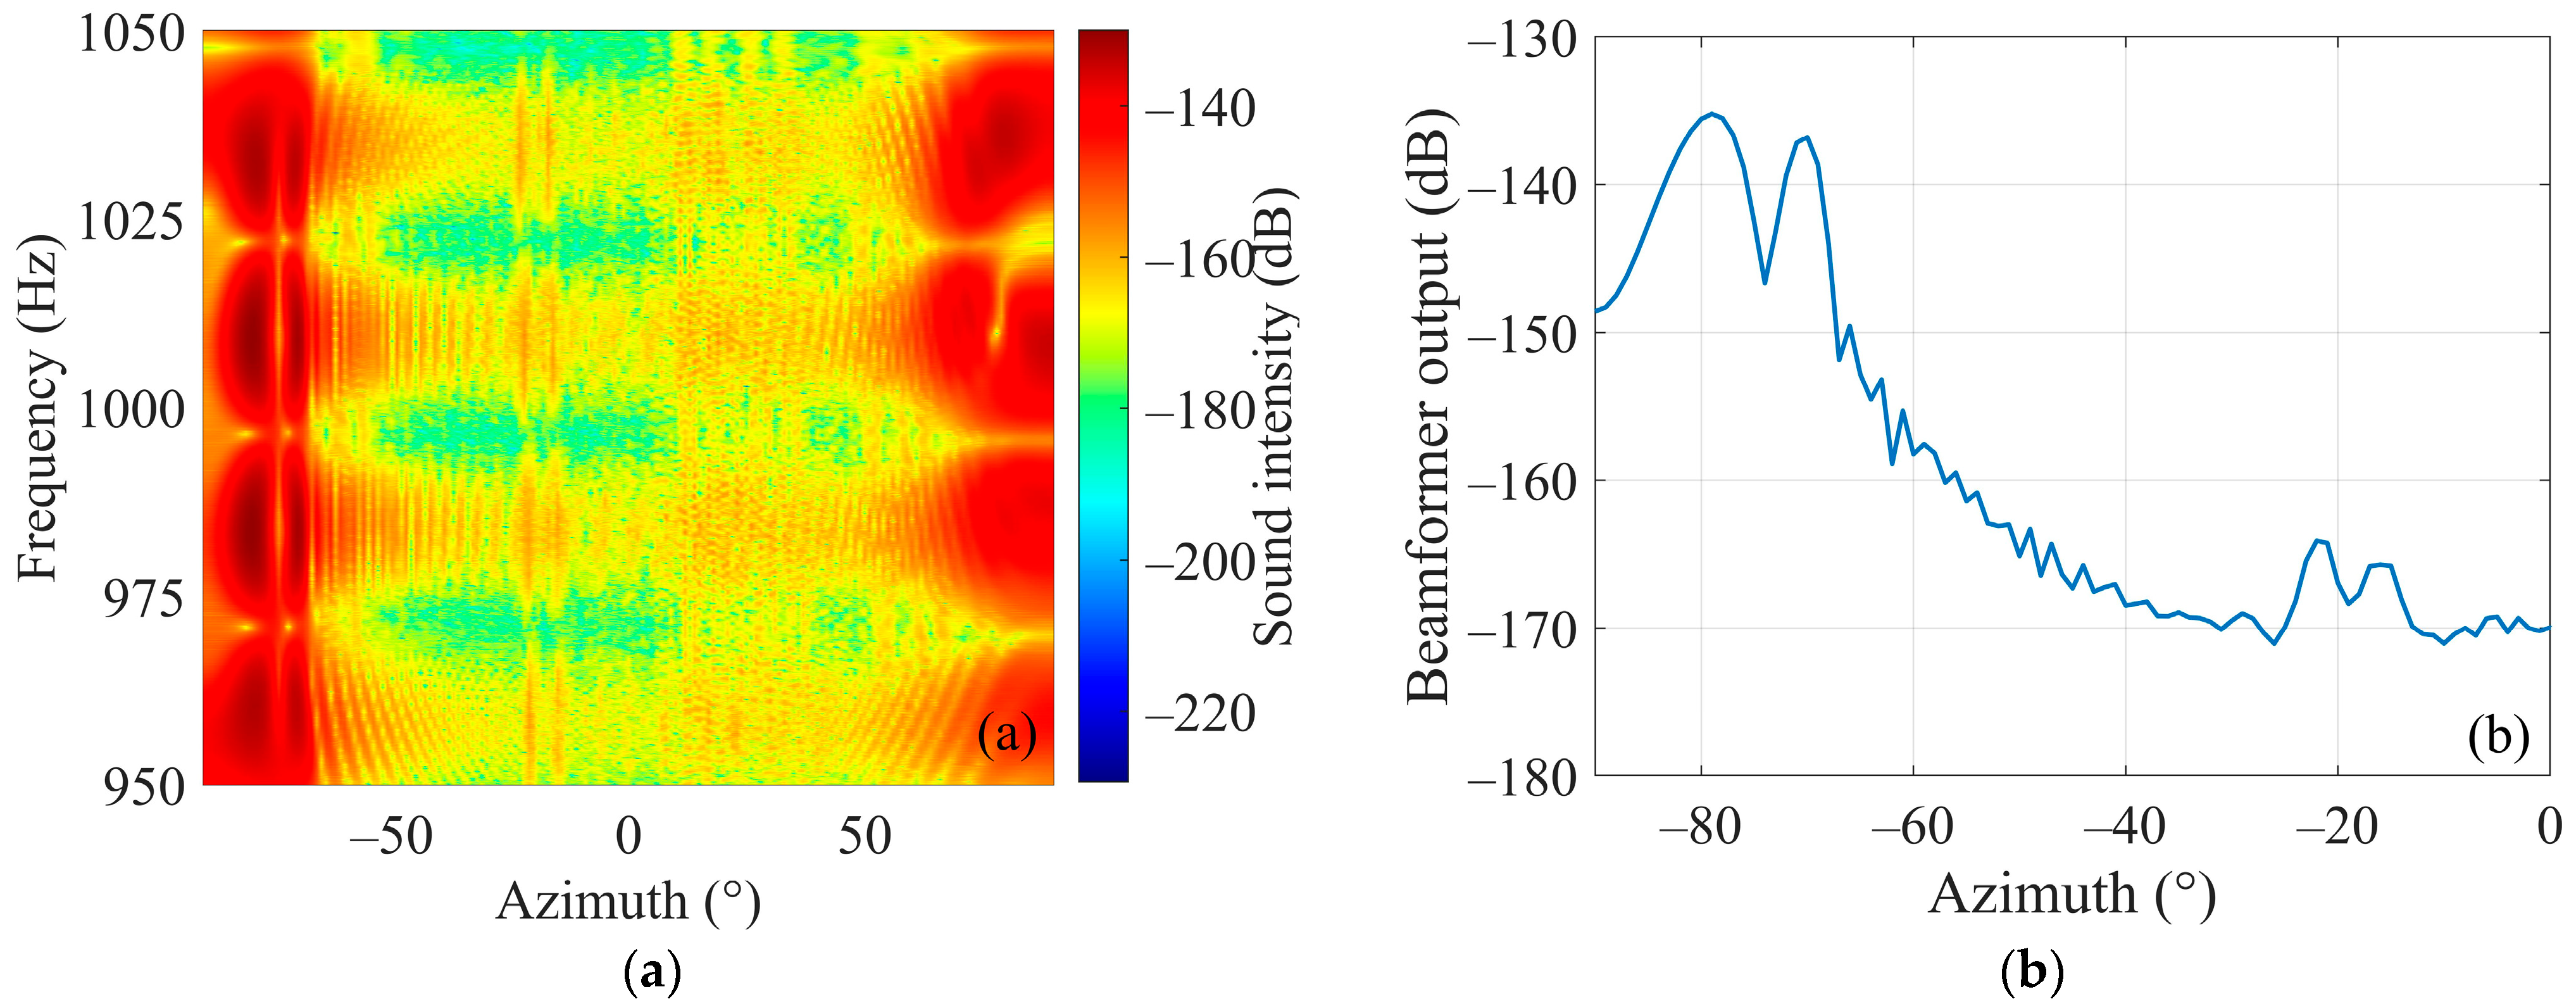
When the target is an omnidirectional target, the interference structure of the scattered sound field on the HLA is shown in Figure 2b. The phase cross-correlation data are processed by SCBF-SE, then the beam output results are shown in Figure 5a,b. Among them, Figure 5b is the average beam output over the studied frequency band.
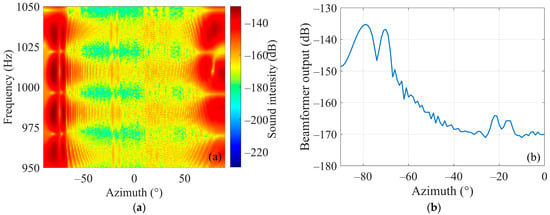
Figure 5.
Beamforming results of SCBF-SE of phase-correlated data for the scattered sound field of an omnidirectional target. (a,b) are the beamforming results and the average beam output over the studied frequency band, respectively.
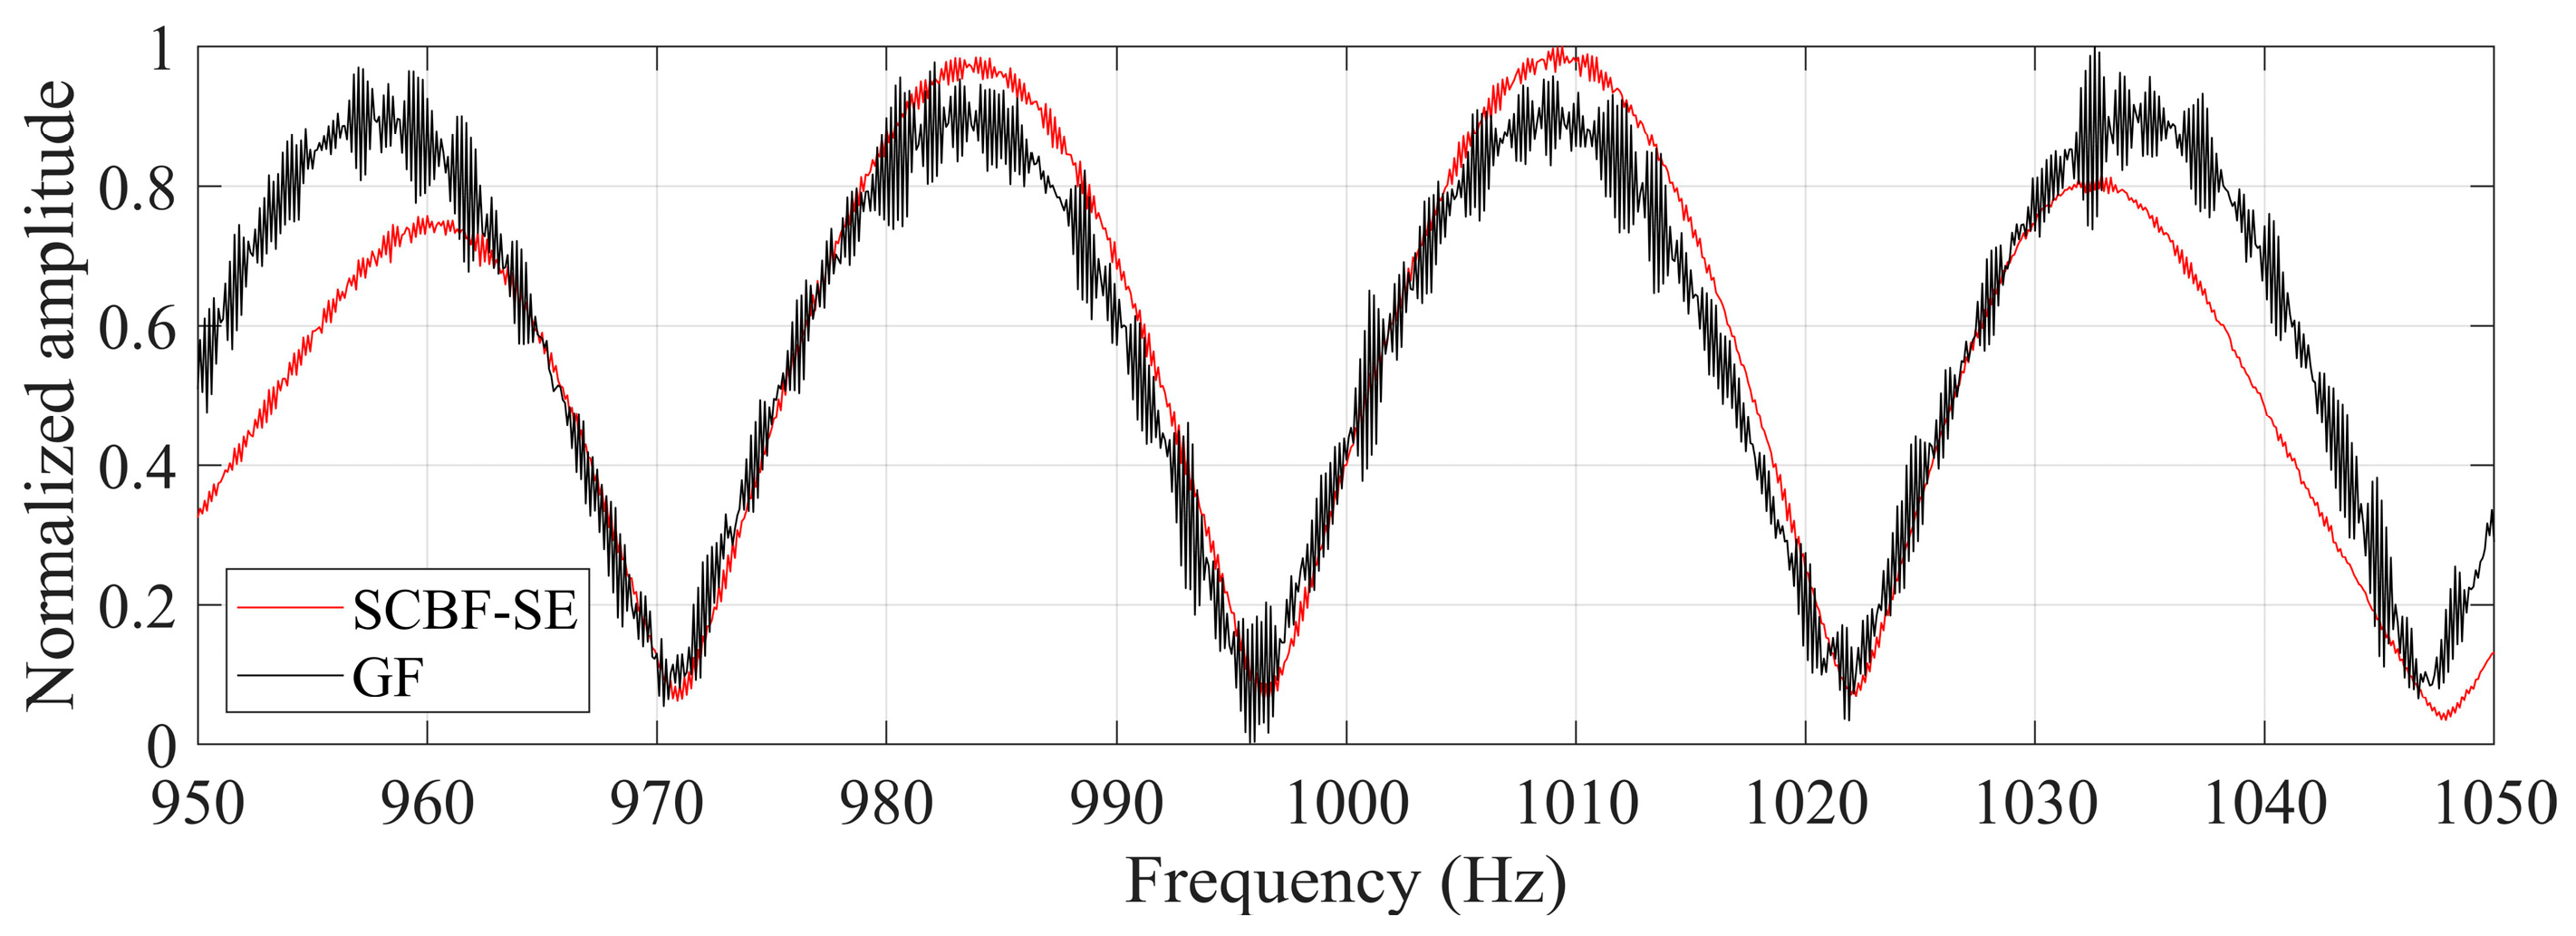
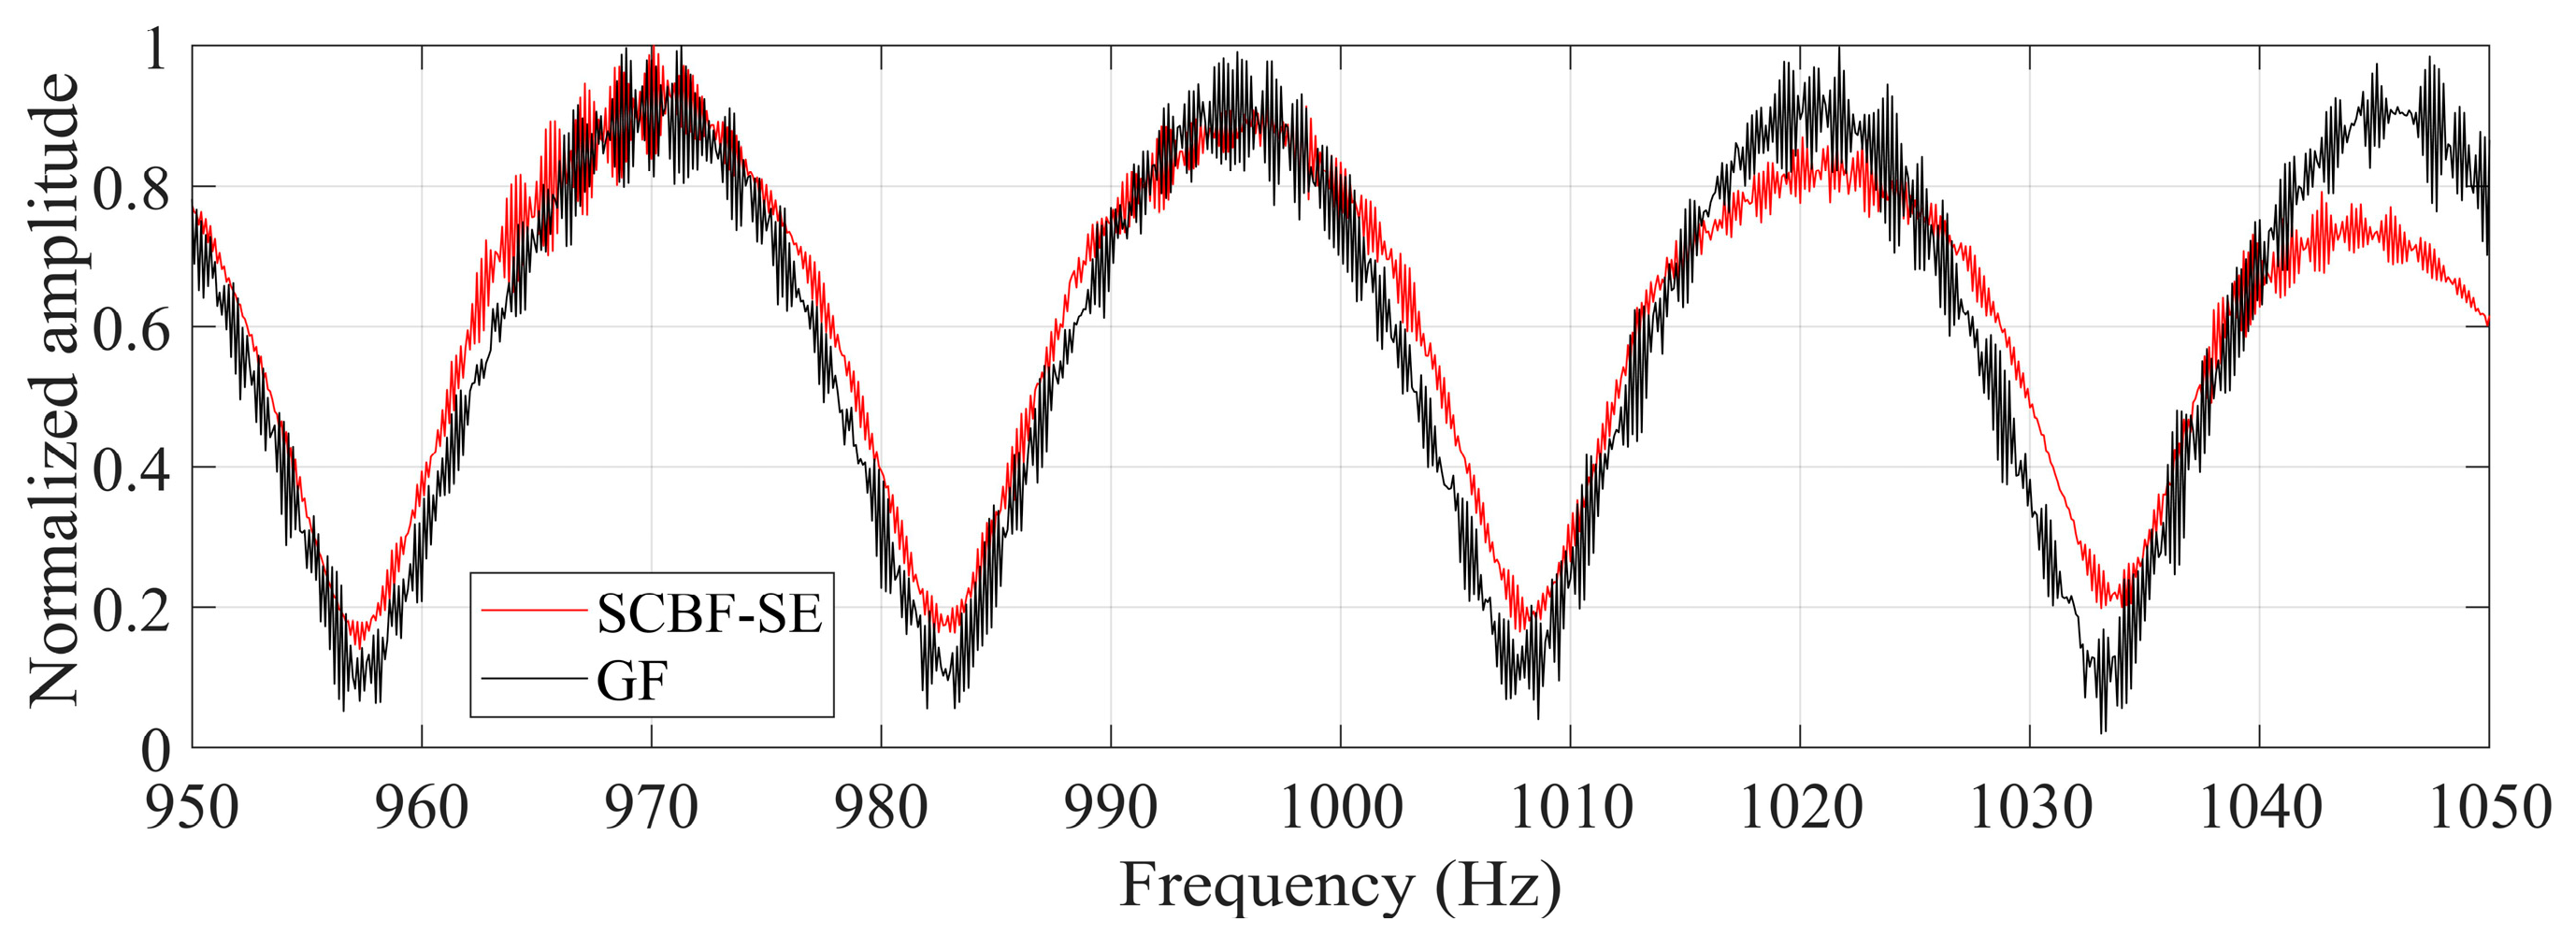
According to the average beam output of SCBF-SE over the studied frequency band, the estimated target azimuth under simulation conditions is about −78° (corresponding to the maximum output). Based on the main lobe direction determined by this angle, the main lobe output in different frequencies are calculated as shown in Figure 6. The black line represents the reference result of the interference structure, which is the amplitude spectrum of the real Green’s function (GF) between the target and the reference element. It can be seen that the result of SCBF-SE obtains the interference structure estimate that is relatively close to the interference structure of the real Green’s function (corresponding to the target–receiver path).
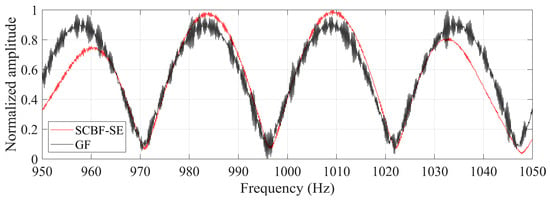
Figure 6.
The interference structures of the scattered sound field for an omnidirectional target estimated by SCBF-SE. The black line represents the reference result of the interference structure, which is the amplitude spectrum of the real Green’s function (GF) between the target and the reference element (the target–receiver path), while the red line denotes the interference structure estimated by SCBF-SE.
4.1.2. Rigid Sphere Target
Further, we consider the influence of the target scattering function. Unlike its modeling as a constant in Equation (3), we introduce certain variable factors into the target scattering function to further examine the applicability of the SCBF-SE algorithm. Here, we use a rigid sphere, which is commonly employed in theoretical studies on underwater acoustic-scattering problems.
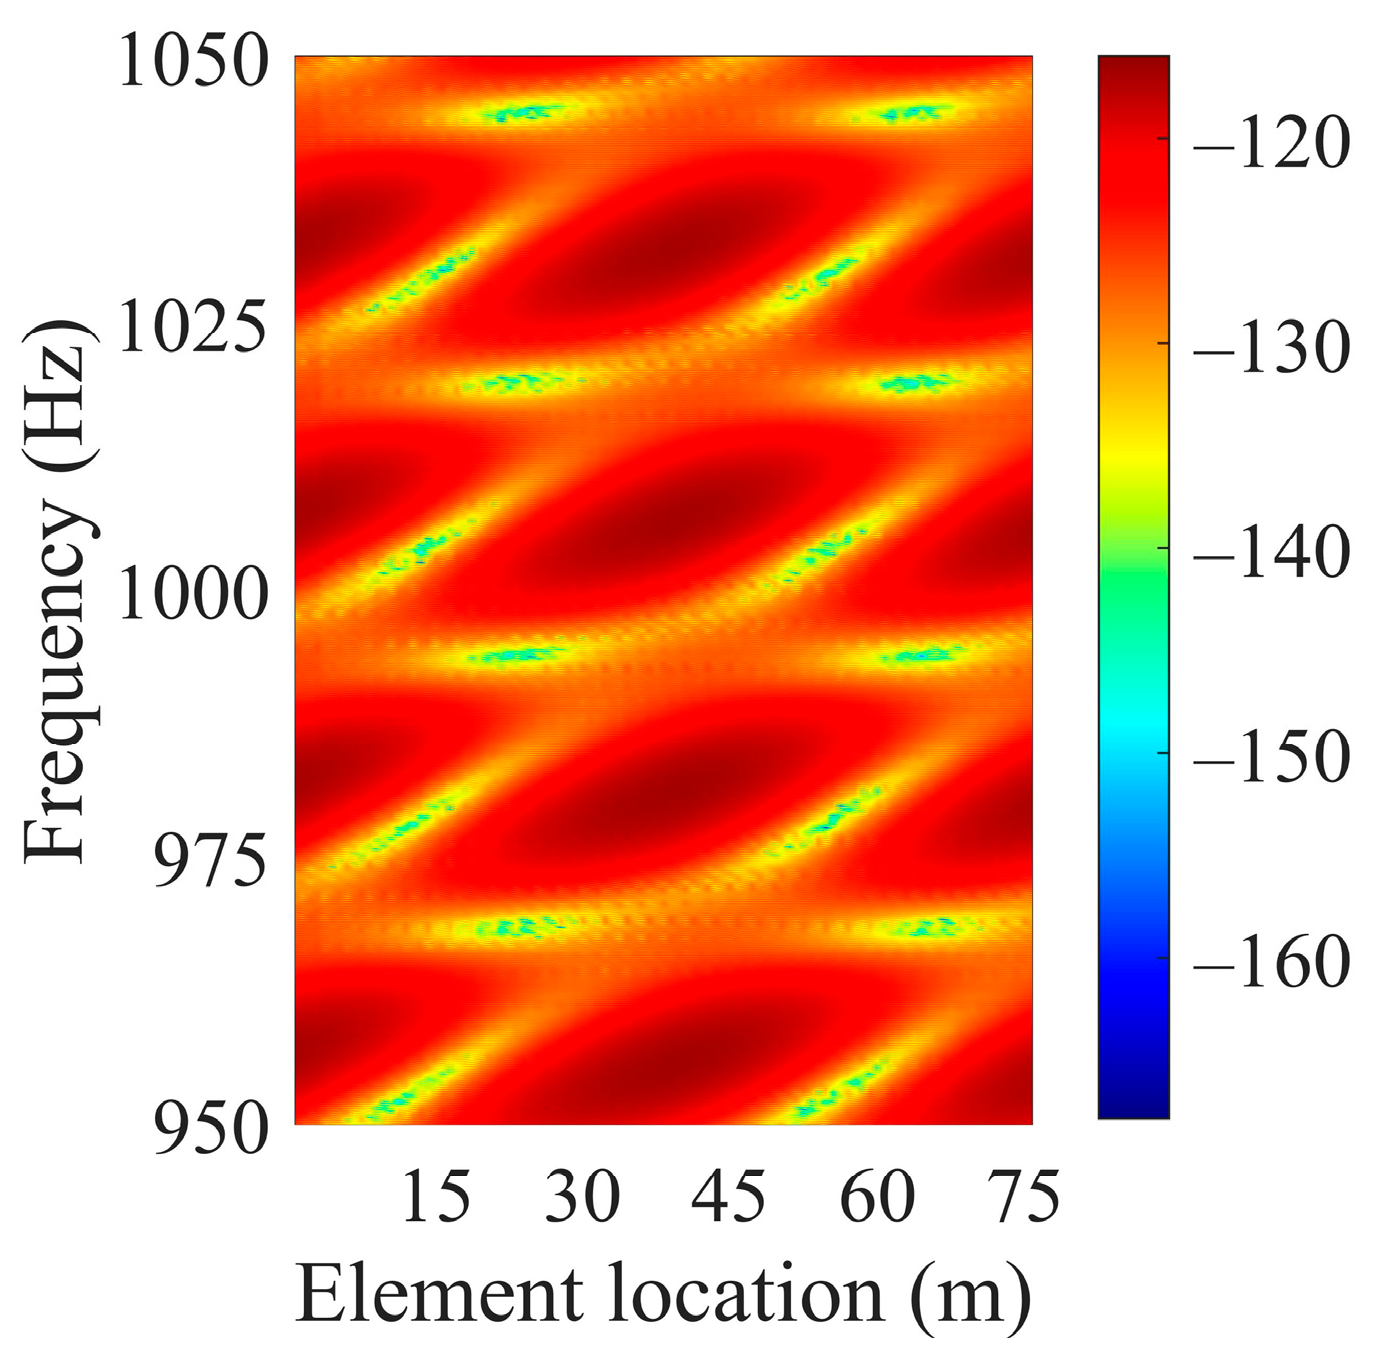
The interference structure of the scattered sound field of a rigid sphere on the HLA is shown in Figure 7. Compared with the result in Figure 2b, the pattern of the interference structure shows some differences in detail.
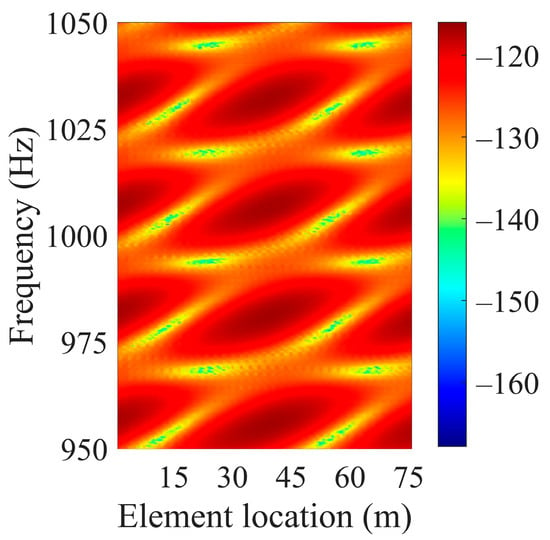
Figure 7.
Numerical calculation results of the interference pattern of the scattered sound field for a rigid sphere target in element–frequency domain on the HLA.
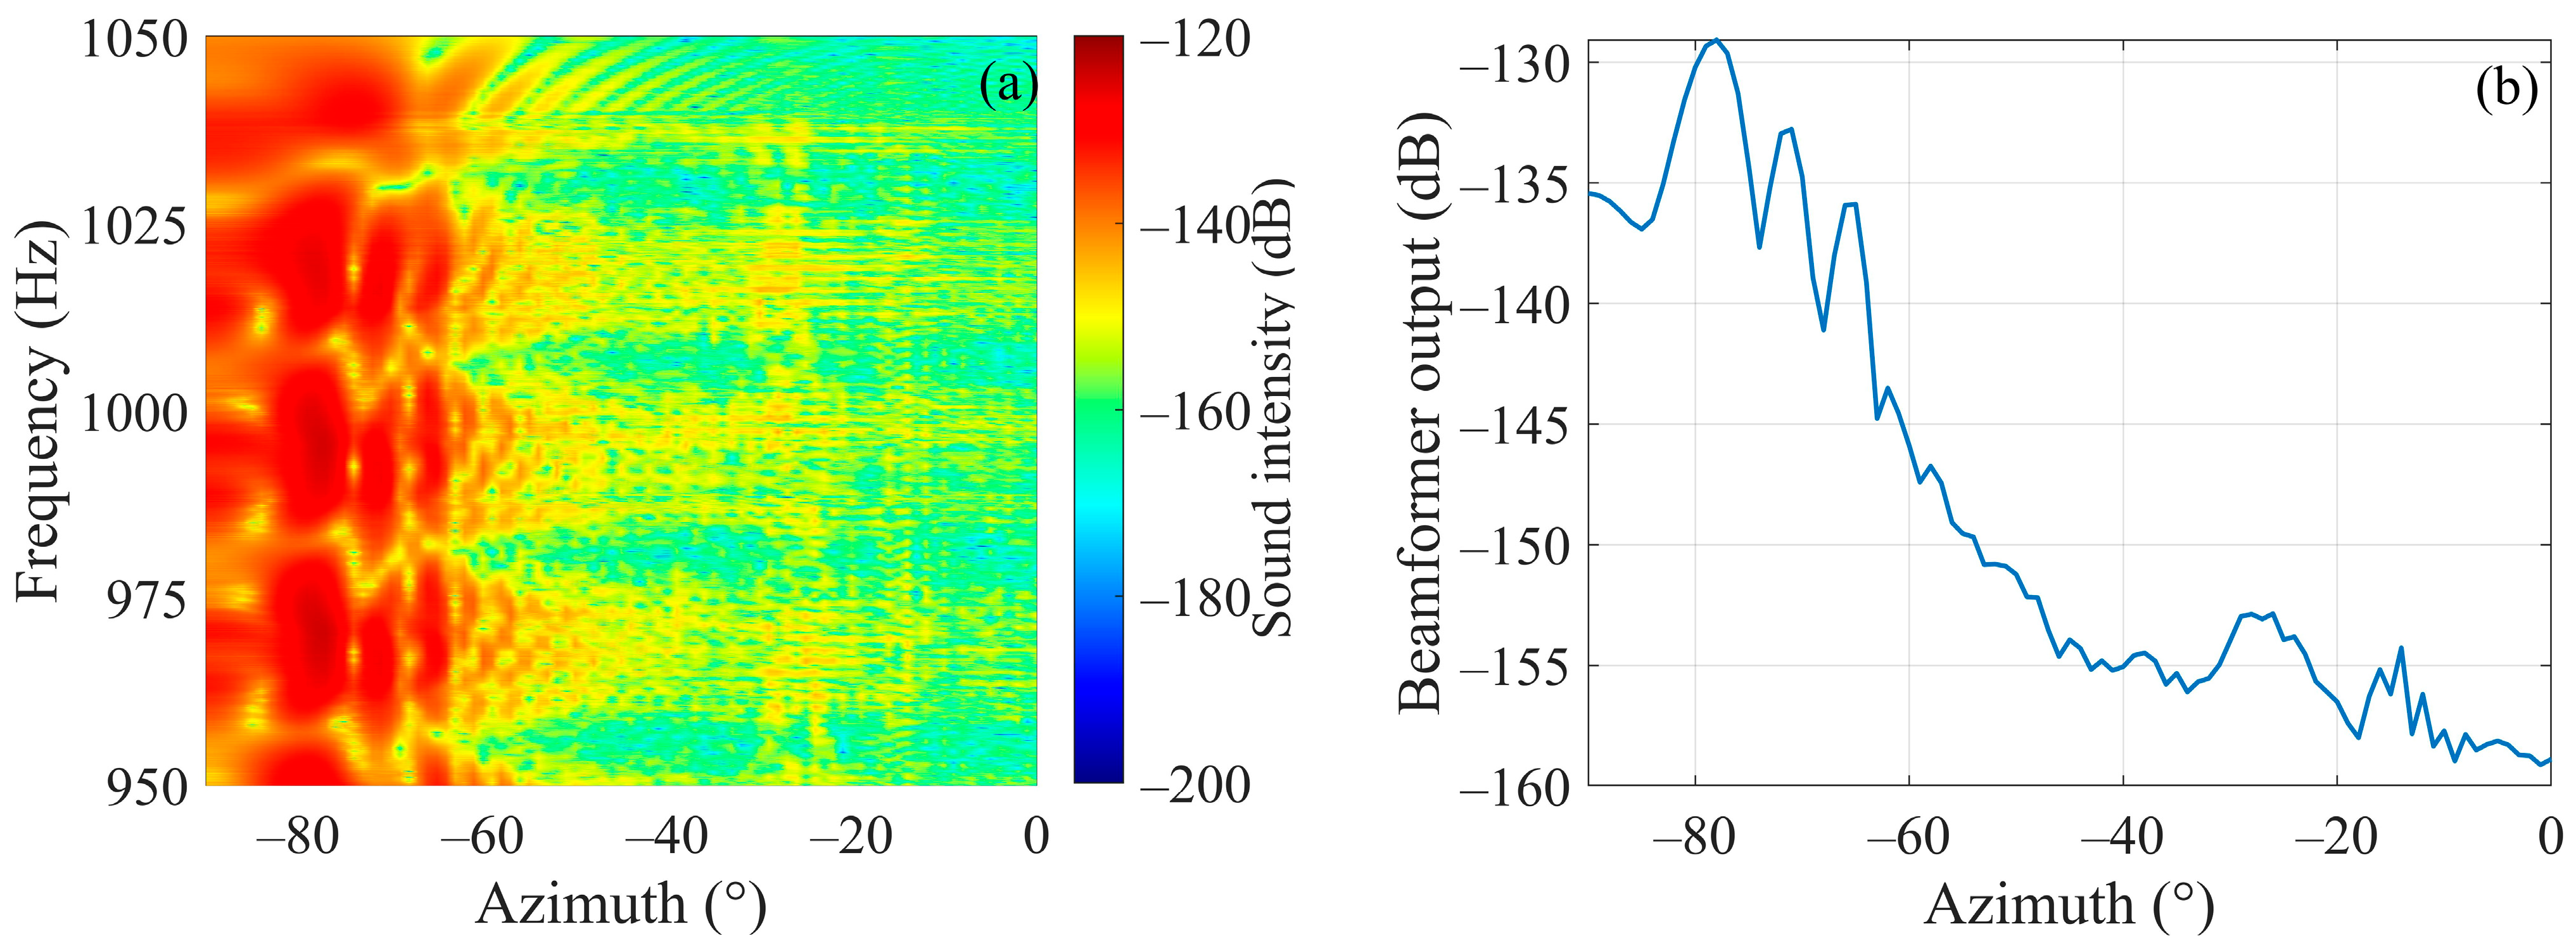
The phase cross-correlation data are processed by SCBF-SE, then the beam output results are shown in Figure 8a,b. Among them, Figure 8b is the average beam output over the studied frequency band.
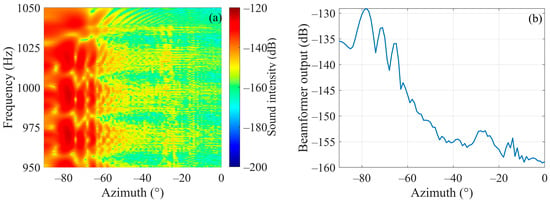
Figure 8.
Beamforming results of SCBF-SE of phase-correlated data for the scattered sound field of a rigid sphere target. (a,b) are the beamforming results and the average beam output over the studied frequency band, respectively.
According to the average beam output of SCBF-SE over the studied frequency band, the estimated target azimuth is about −78°. Based on the main lobe direction determined by this angle, the main lobe output in frequency domain is collected as shown in Figure 9. The black line represents the reference result of the interference structure. It can be seen that the result of SCBF-SE obtains the interference structure estimate that is relatively close to the real Green’s function (the target–receiver path). Compared with the results in Figure 6, it can be found that for a completely symmetrical rigid body such as a rigid sphere, SCBF-SE can still achieve a good estimate of the interference structure of the target–receiver path.
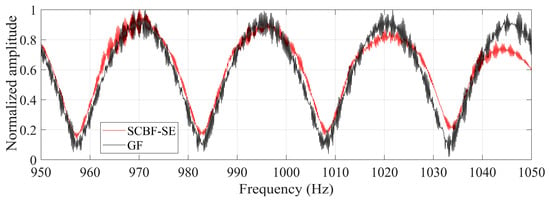
Figure 9.
The interference structures of the scattered sound field for a rigid sphere target estimated by SCBF-SE. The black line represents the reference result of the interference structure, which is the amplitude spectrum of the real Green’s function (GF) between the target and the reference element (the target–receiver path), while the red line denotes the interference structure estimated by SCBF-SE.
4.2. Performance Analysis
Among the existing interference structure enhancement methods, SBF requires the known source spectrum information and the elimination of the influence of azimuth offset, while the interference structure output of CBF can be distorted [24]. Therefore, we focus on the SCBF-SE and the incoherent accumulation of the striation energy (IASE) method in this section. The IASE method is defined as
where is estimate of the interference structure of the IASE method, and represents the interference intensity pattern of the received scattered sound filed. The IASE represents a classical processing method referring to the Hough transform of image processing [3]. A series of numerical simulations are conducted to further analyze the performance of these two methods as they vary with changes in the SNR and the number of array elements. These two methods represent the coherent (SCBF-SE) and incoherent (IASE) approaches for enhancing the interference striation structure of the target–receiver path without relying on external source spectrum information or beam output azimuth correction. Such a comparison also helps explore the performance advantages brought by coherent processing.
The simulation conditions are consistent with those in Section 4.1. The correlation coefficient defined in [31] is used as an indicator to evaluate the accuracy of the interference structure enhancement results. When using a certain method to extract the interference structure of the scattered sound field, if the correlation coefficient between the estimated result of the interference structure waveforms and its corresponding theoretical result is higher, it means that this method has better performance in interference structure enhancement.
4.2.1. SNR
In the following simulations of the interference structure enhancement, received signals with varying SNR are considered. The ambient noise is modeled as white Gaussian noise. The SNR is defined as
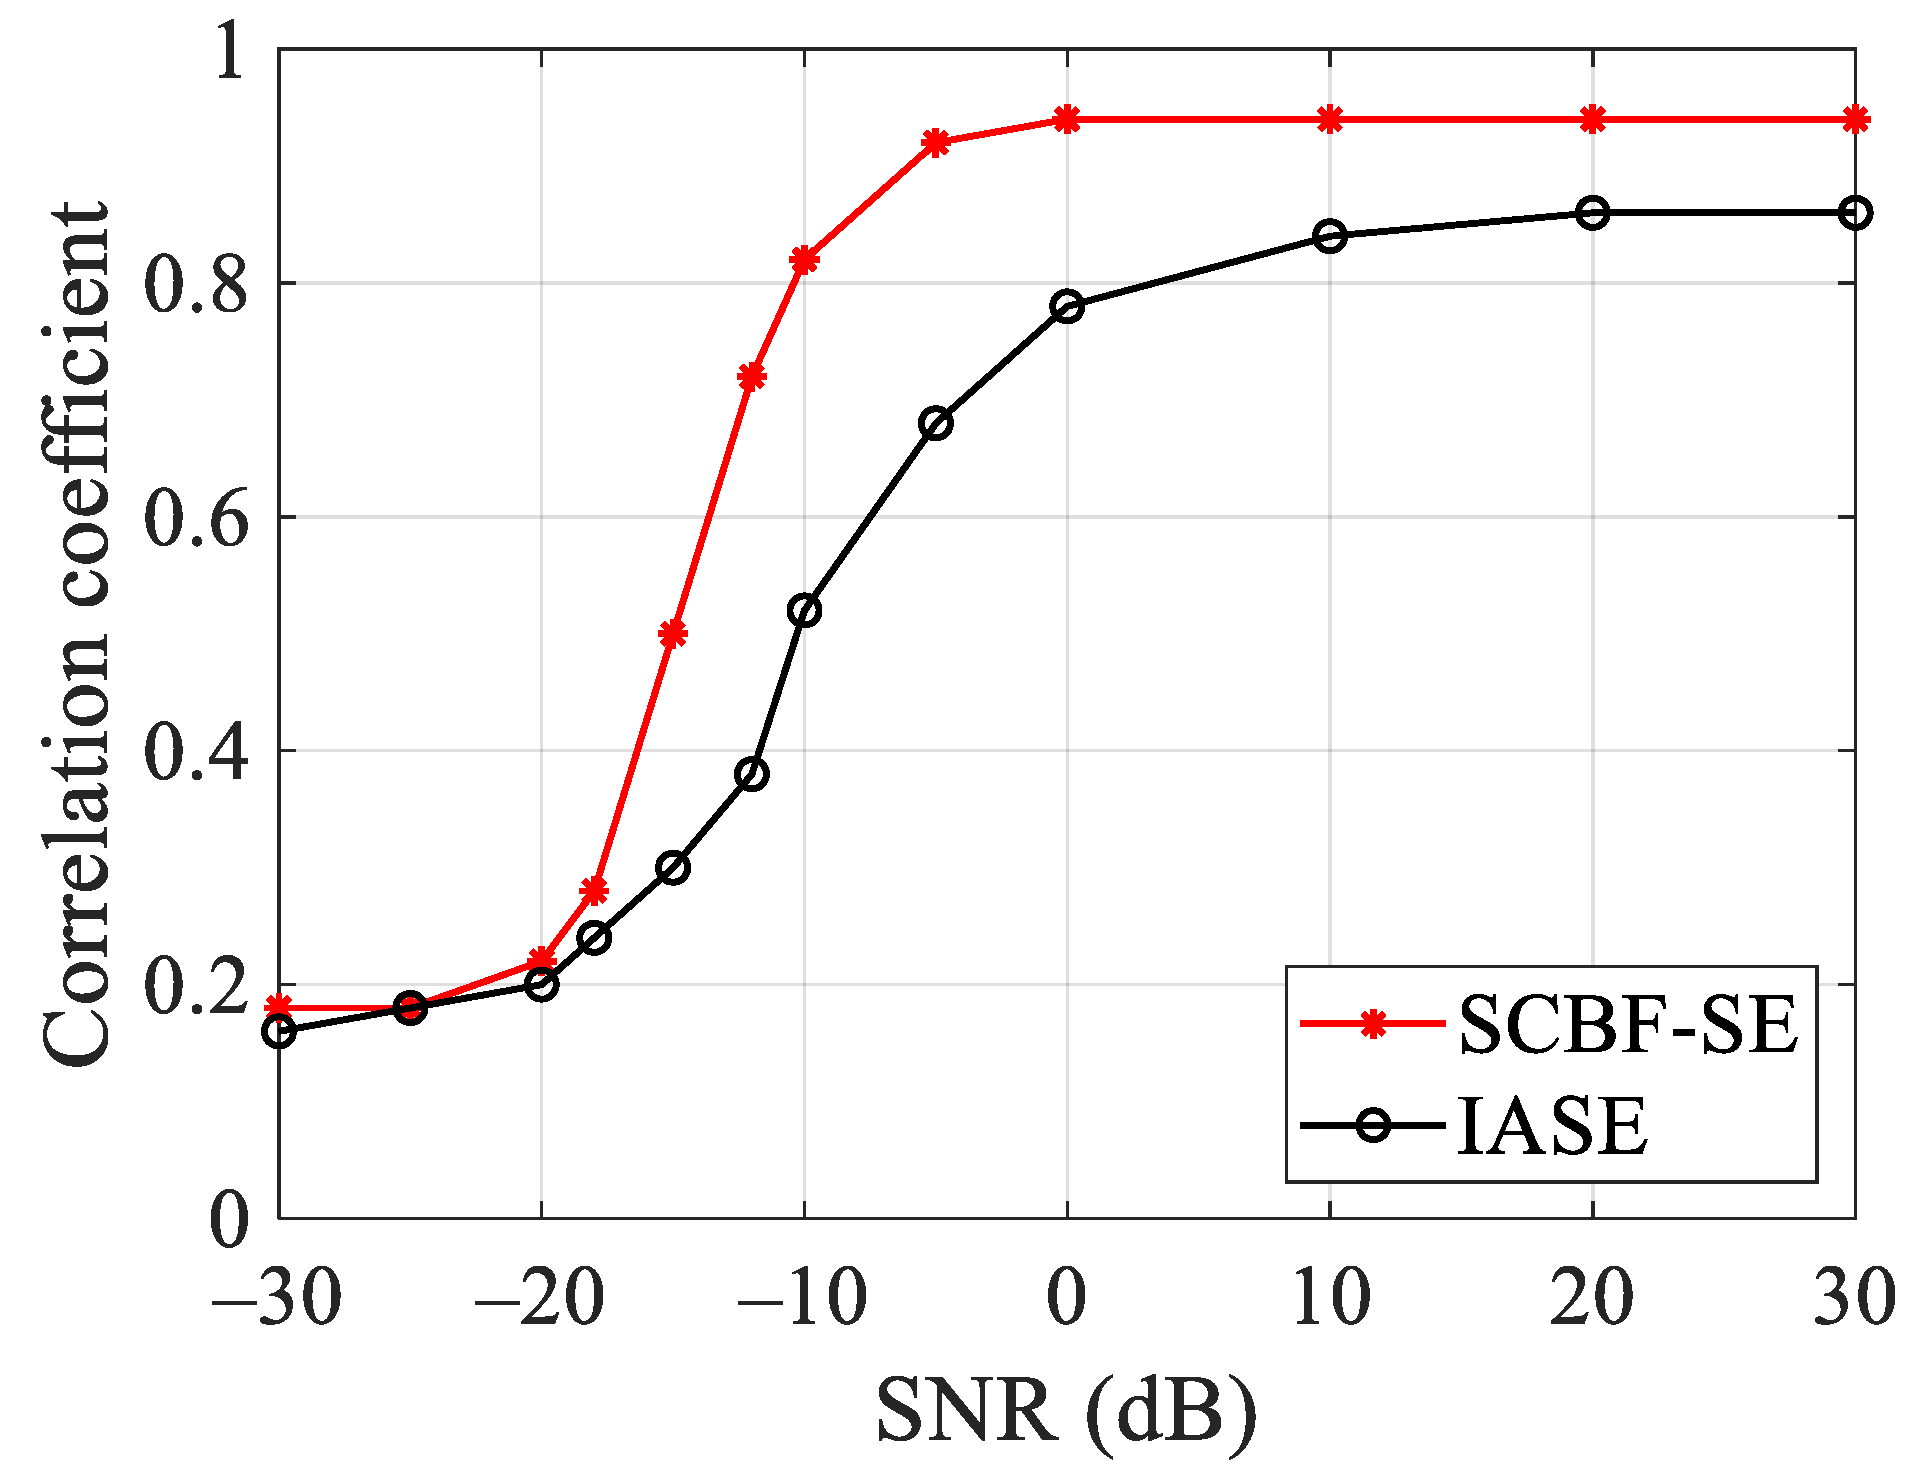
where is the Hertz frequency in the studied band of and indicates the added ambient noise. After 50 Monte Carlo simulations, the correlation coefficient of the interference structure waveform estimation results of SCBF-SE and IASE under different SNRs is shown in Figure 9.
As can be seen from Figure 10, compared with the result of IASE, SCBF-SE can still obtain interference structure waveform estimation results with higher correlation coefficients under lower SNRs. The theoretical gain of the HLA used in the simulation is about 20 dB, so the performance of both methods begins to improve when the SNR is more than about −20 dB. When the SNR exceeds about −20 dB, the robustness of SCBF-SE is higher than IASE. At the same time, since SCBF-SE is a coherent processing method, it can obtain more gain than incoherent processing, and the estimation accuracy of SCBF-SE improves more rapidly than IASE.
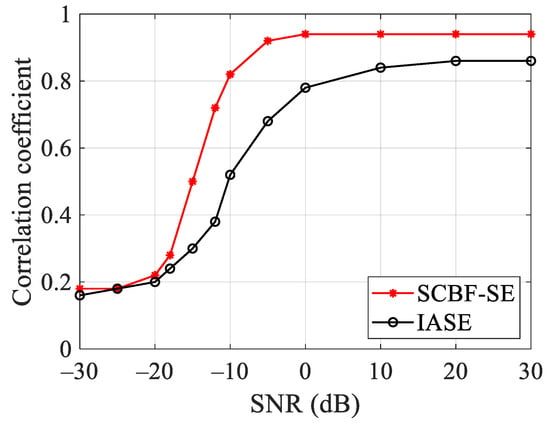
Figure 10.
The performance comparison of SCBF-SE and IASE methods versus the SNR of received signals after 50 Monte Carlo runs.
4.2.2. Number of Array Elements
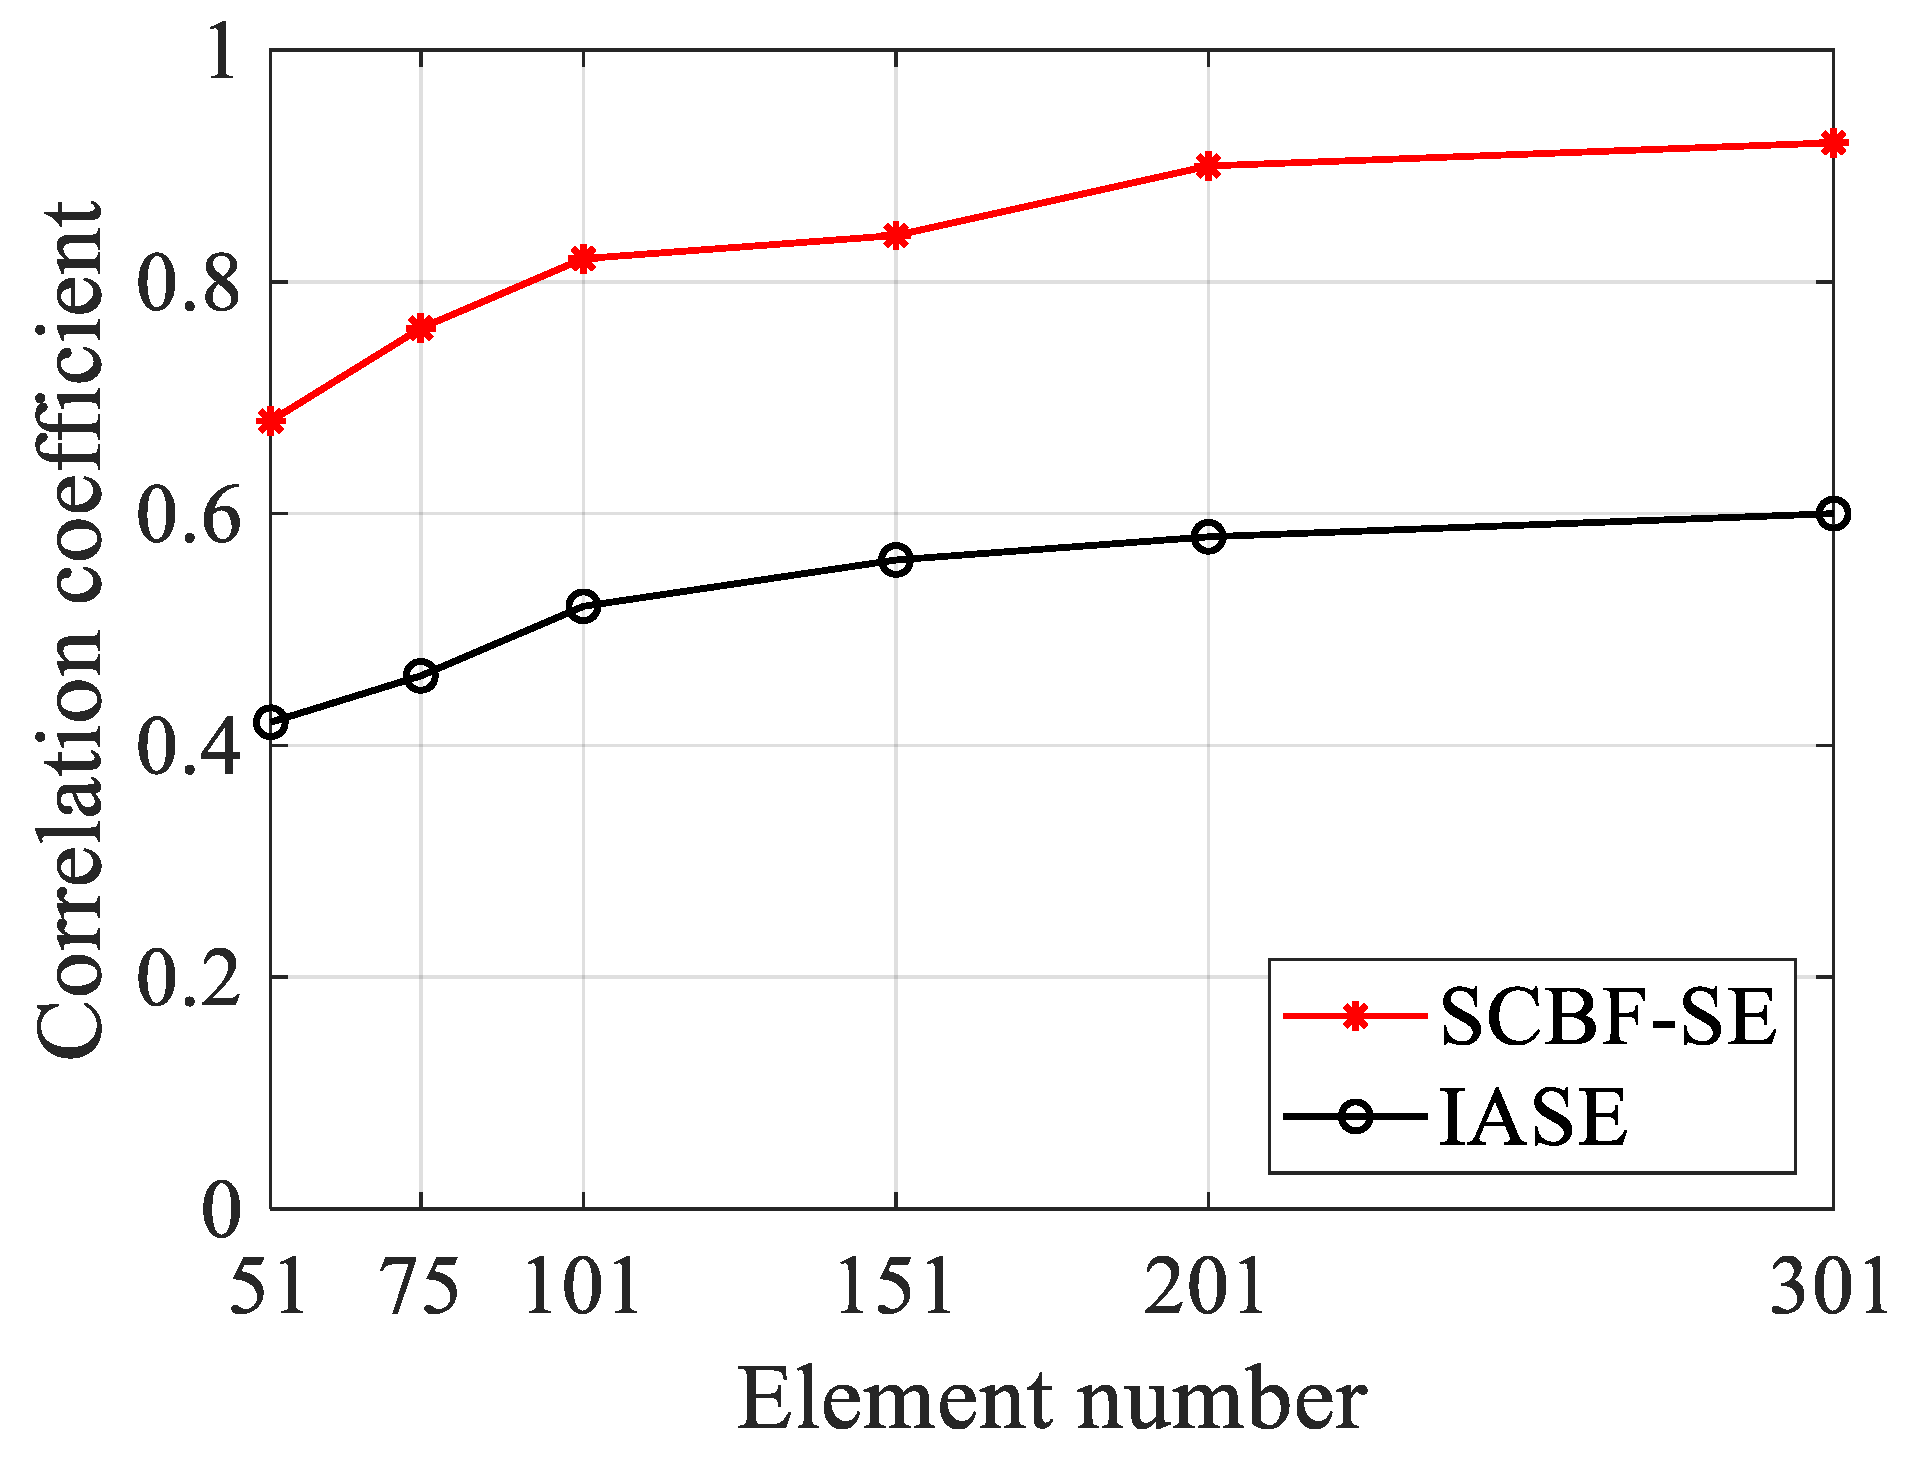
In this section, the effect of the number of array elements used in the HLA on the performance of interference structure enhancement is considered. The SNR is set to −10 dB, and the array aperture is set to 150 m and remains unchanged. The number of array elements is selected to be 51, 75, 101, 151, 201 and 301. After 50 Monte Carlo simulations, the correlation coefficient of the interference structure waveform estimation results of SCBF-SE and IASE under different numbers of array elements is shown in Figure 11.
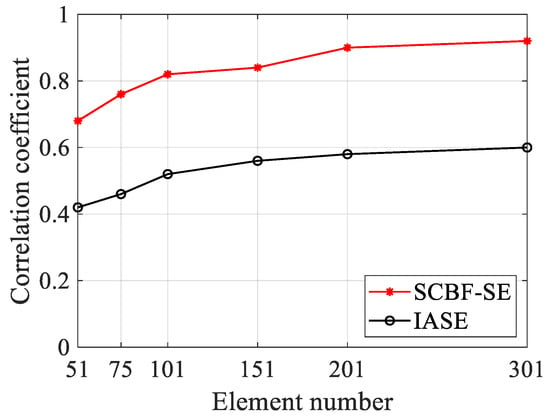
Figure 11.
The performance comparison of SCBF-SE and IASE methods versus the element number of the HLA after 50 Monte Carlo runs. The studied element numbers are 51, 71, 101, 151, 201, and 301. The array aperture is set as 150 m for each simulation.
As can be seen from Figure 11, the estimation performance of SCBF-SE gradually improves as the number of array elements increases. This is because the essence of SCBF-SE is beamforming along the striations. Then, its theoretical gain rises with the increase in the number of array elements, and the accuracy of SCBF-SE in extracting the interference structure can also increase. Meanwhile, coherent processing has a significant effect on suppressing ambient noise, so SCBF-SE is better than IASE in enhancing the interference structure.
Although SCBF-SE outperforms IASE in interference structure enhancement, it suffers from higher computational complexity. The computational complexity of the IASE algorithm is O(M × F), where M is the number of array elements and F is the number of frequencies. The computational complexity of the SCBF-SE algorithm is O(M × F × Q), where Q is the number of angles searched. While SCBF-SE’s computational complexity is higher than IASE’s, it is consistent with that of CBF.
5. Experimental Data Analysis
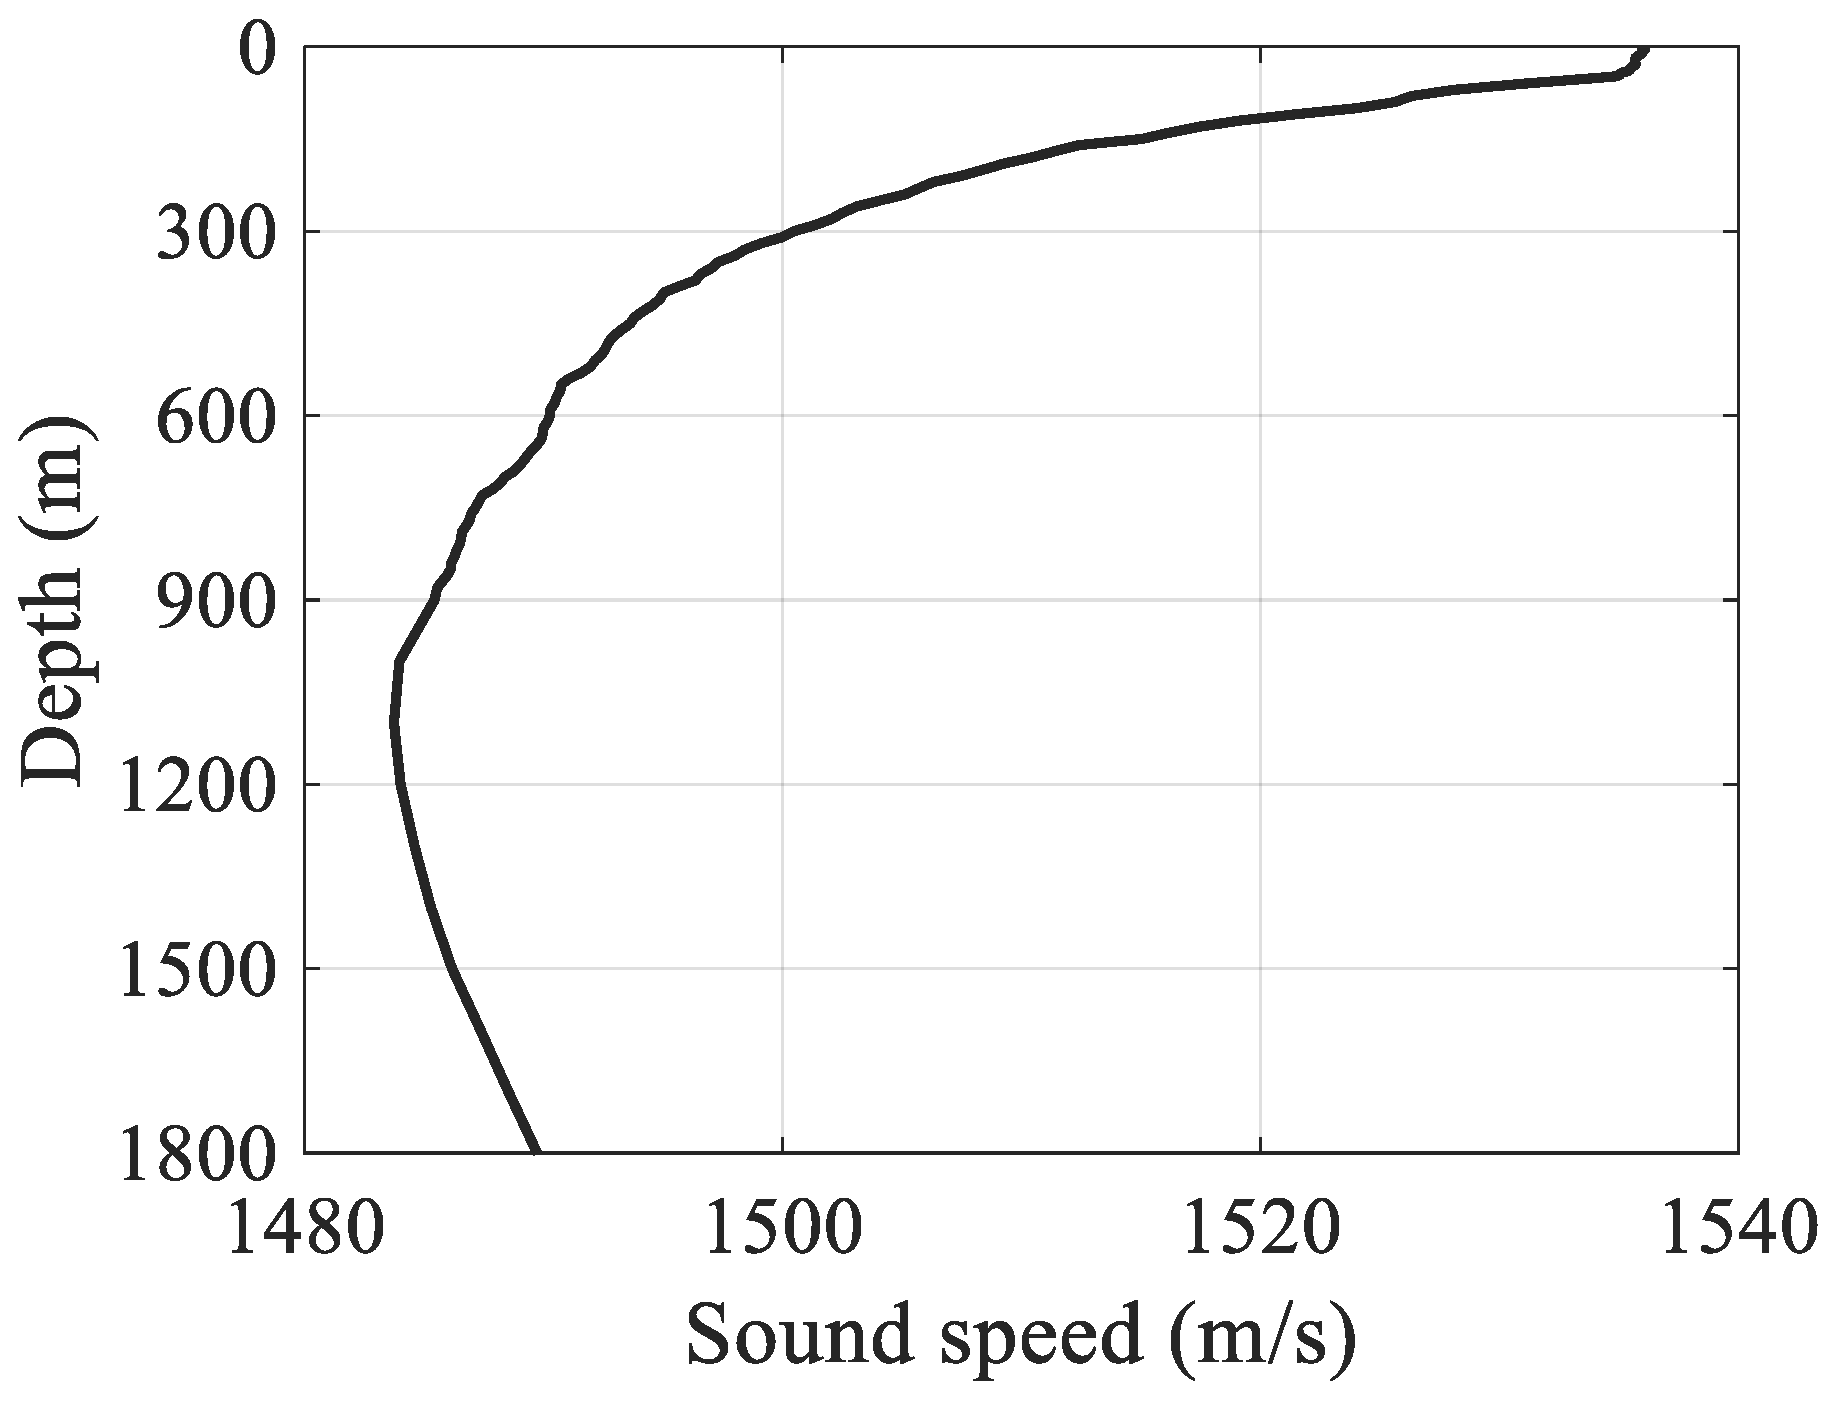
In this section, the experimental data are processed to validate our proposed method. The sound speed profile in the experimental sea area is shown in Figure 12, and the sea depth is 1800 m. The source used in this experiment are the 200 m explosive sources, and the receiving array is an HLA with an aperture of 1000 m laid on the seabed. The source is located in the end-fire direction of the HLA. The reference element is the center element of the array. The array signals received with a range of 13.69 km is specifically processed, and the studied frequency band is 30–50 Hz. The receivers used in the experiments are unequally spaced arrays, each element of which is an omnidirectional sound pressure sensor. The experimental setup in this paper is described in Ref. [32].
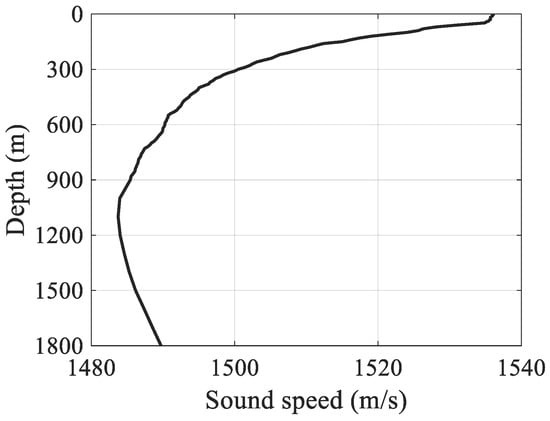
Figure 12.
Sound speed profile of the deep-water experimental area.
The experiment is used to generate the scattered sound field data of the omnidirectional target with the HLA. Since the received signals generated by the explosive sources (i.e., the impulsive response of the ocean waveguide) used in the experiment physically possess the ability to characterize the Green’s function, this facilitates the generation of the scattered sound field data and the accuracy test of the enhanced results of the Green’s function interference structure. The specific operation is as follows: the passive received signal of a reference element obtained in the test is used to represent the GF of the source–target path in the active sonar, and this signal is convolved with the received signals of all array elements (representing the GF of the target–receiver path in the active sonar). Then, the scattered sound field data of the omnidirectional target with the HLA for experimental verification can be obtained.
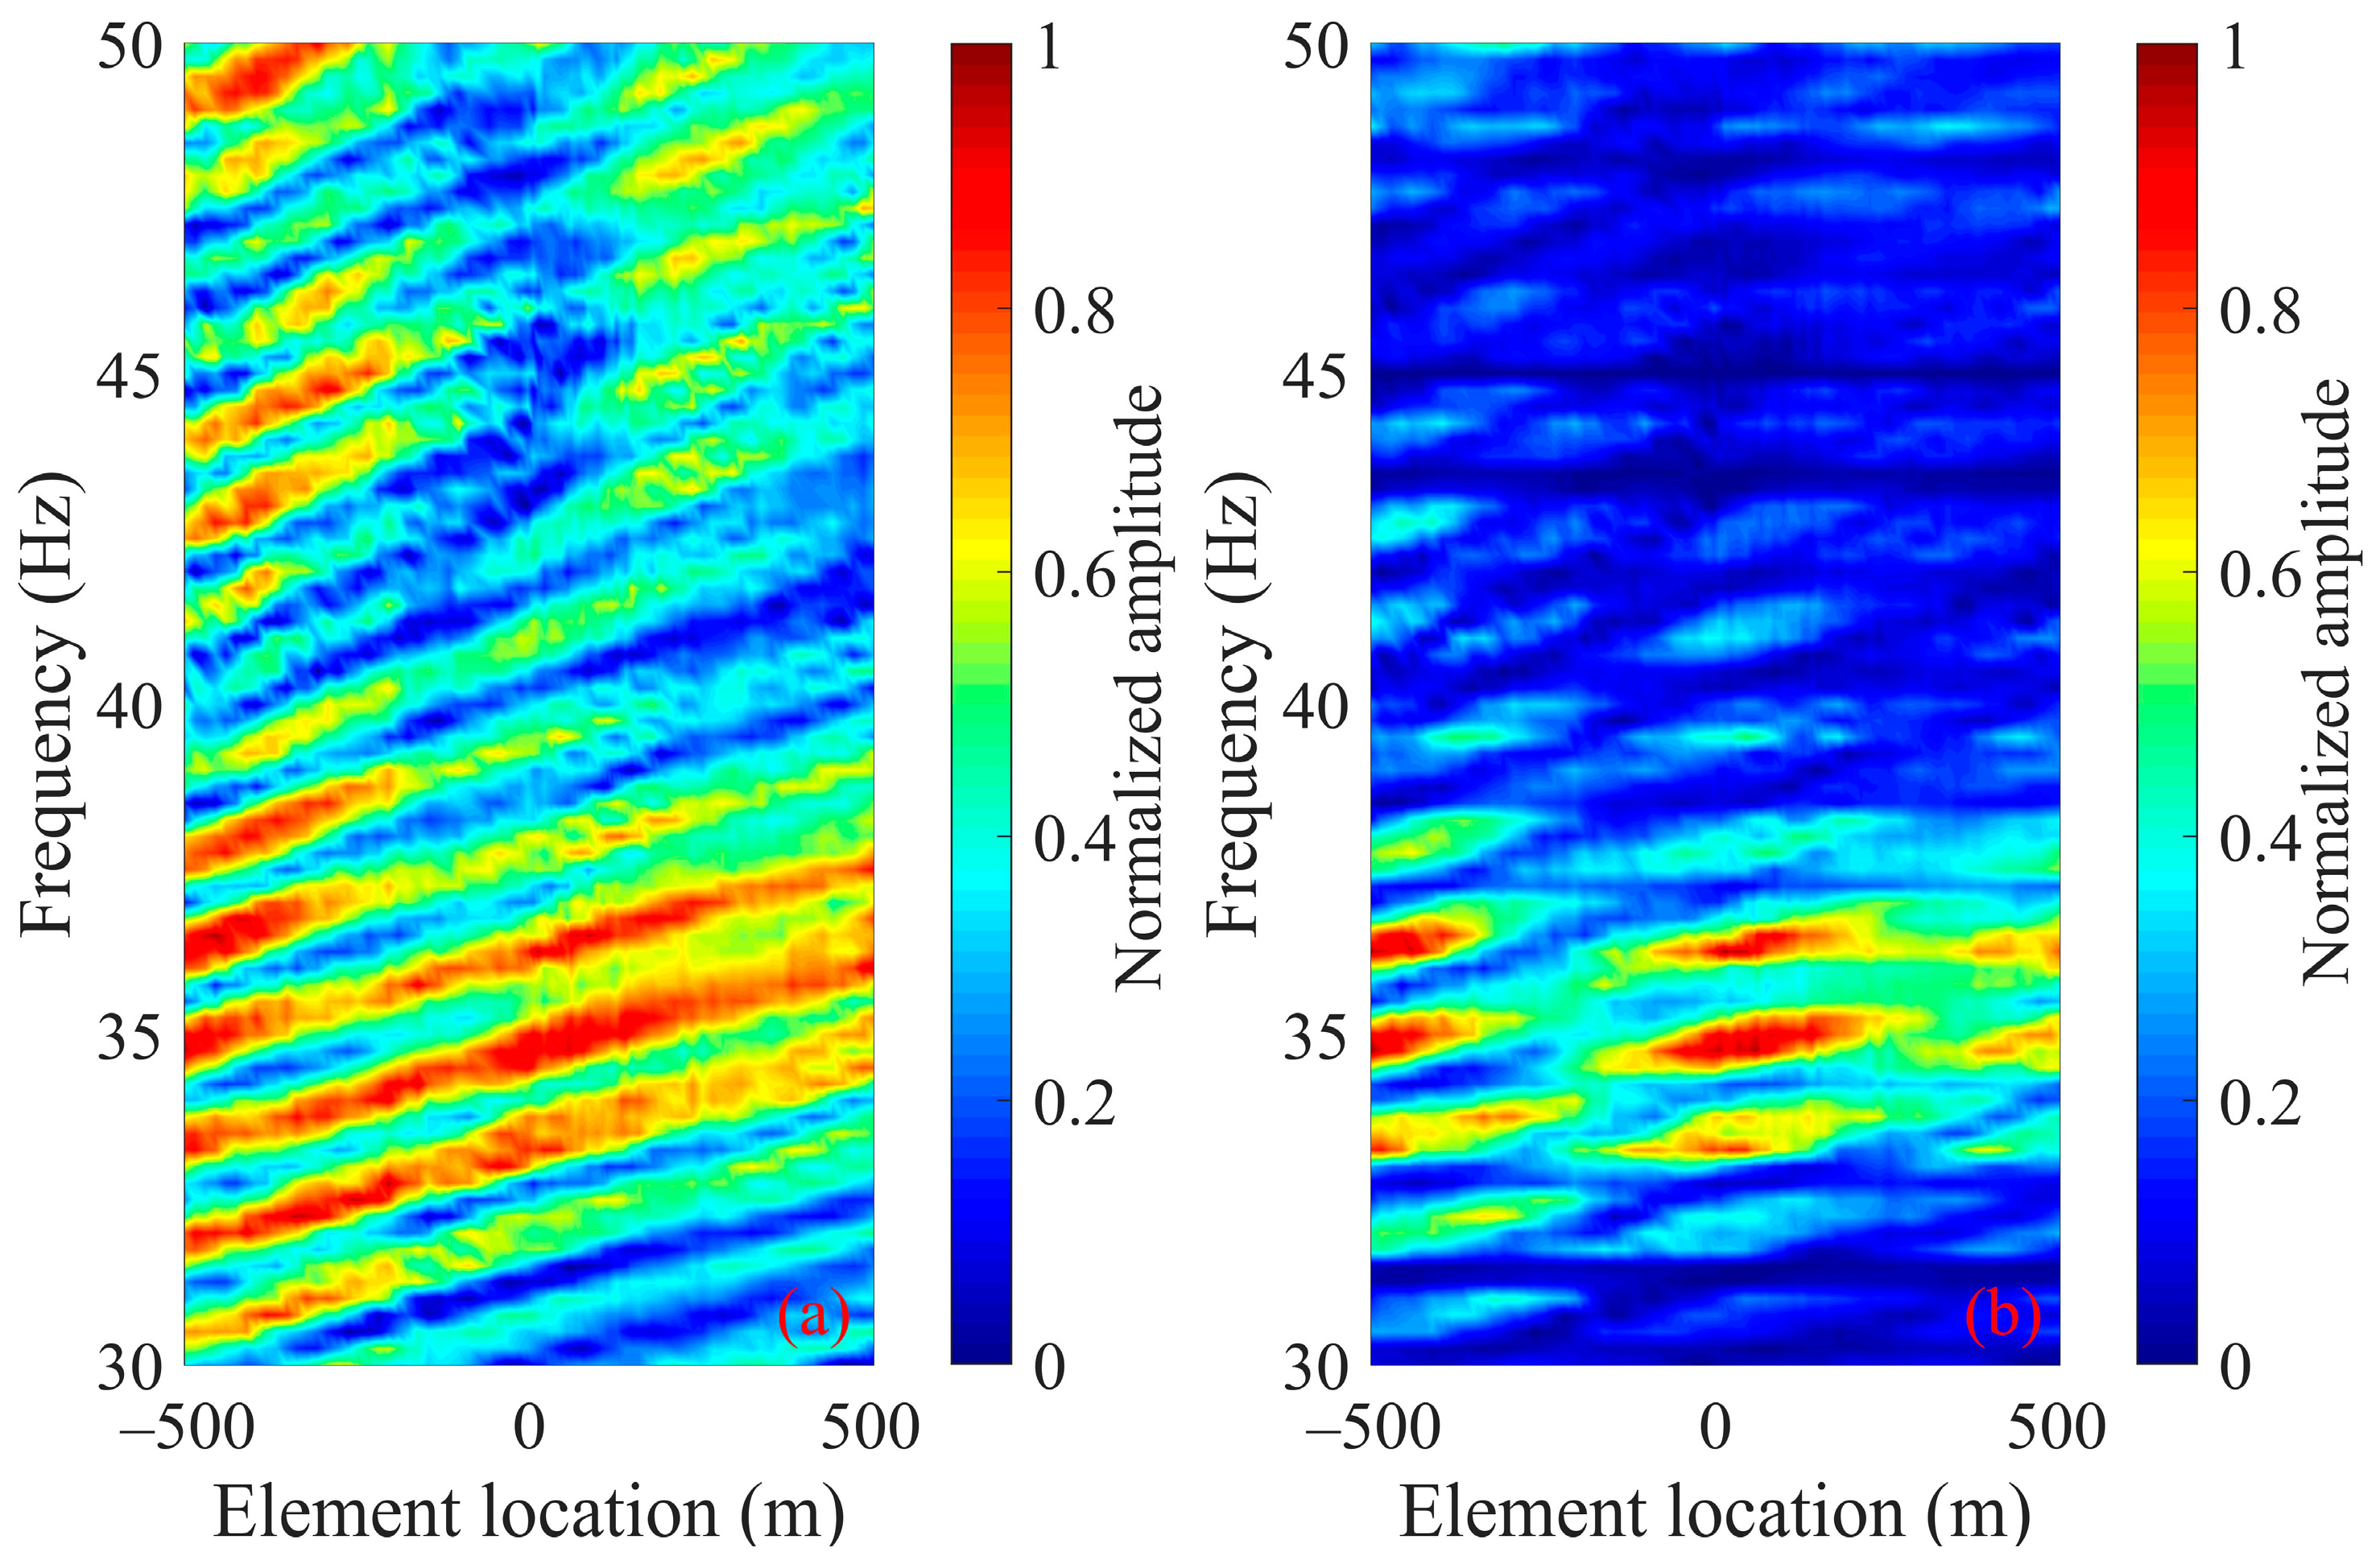
The interference structure of the scattered sound field of the omnidirectional target on the HLA generated by the experimental data are shown in Figure 13. Figure 13a,b are the interference pattern in element–frequency domain of the experimental data in the target–receiver path and the source–target–receiver path, respectively. By comparing Figure 13a,b, it can be seen that the sound propagation effect of the source–target path has the cutting effect on the interference structure of the target–receiver path, and the striations fragment into block-like shapes.
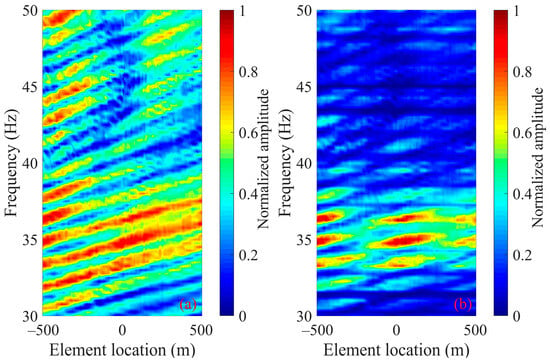
Figure 13.
Experimental results of the interference pattern of the scattered sound field in element–frequency domain on the HLA in deep-water active experiment. (a) One-path propagation from the target to the HLA; (b) scattered sound field formed by propagation from the source to the target and then to the HLA.
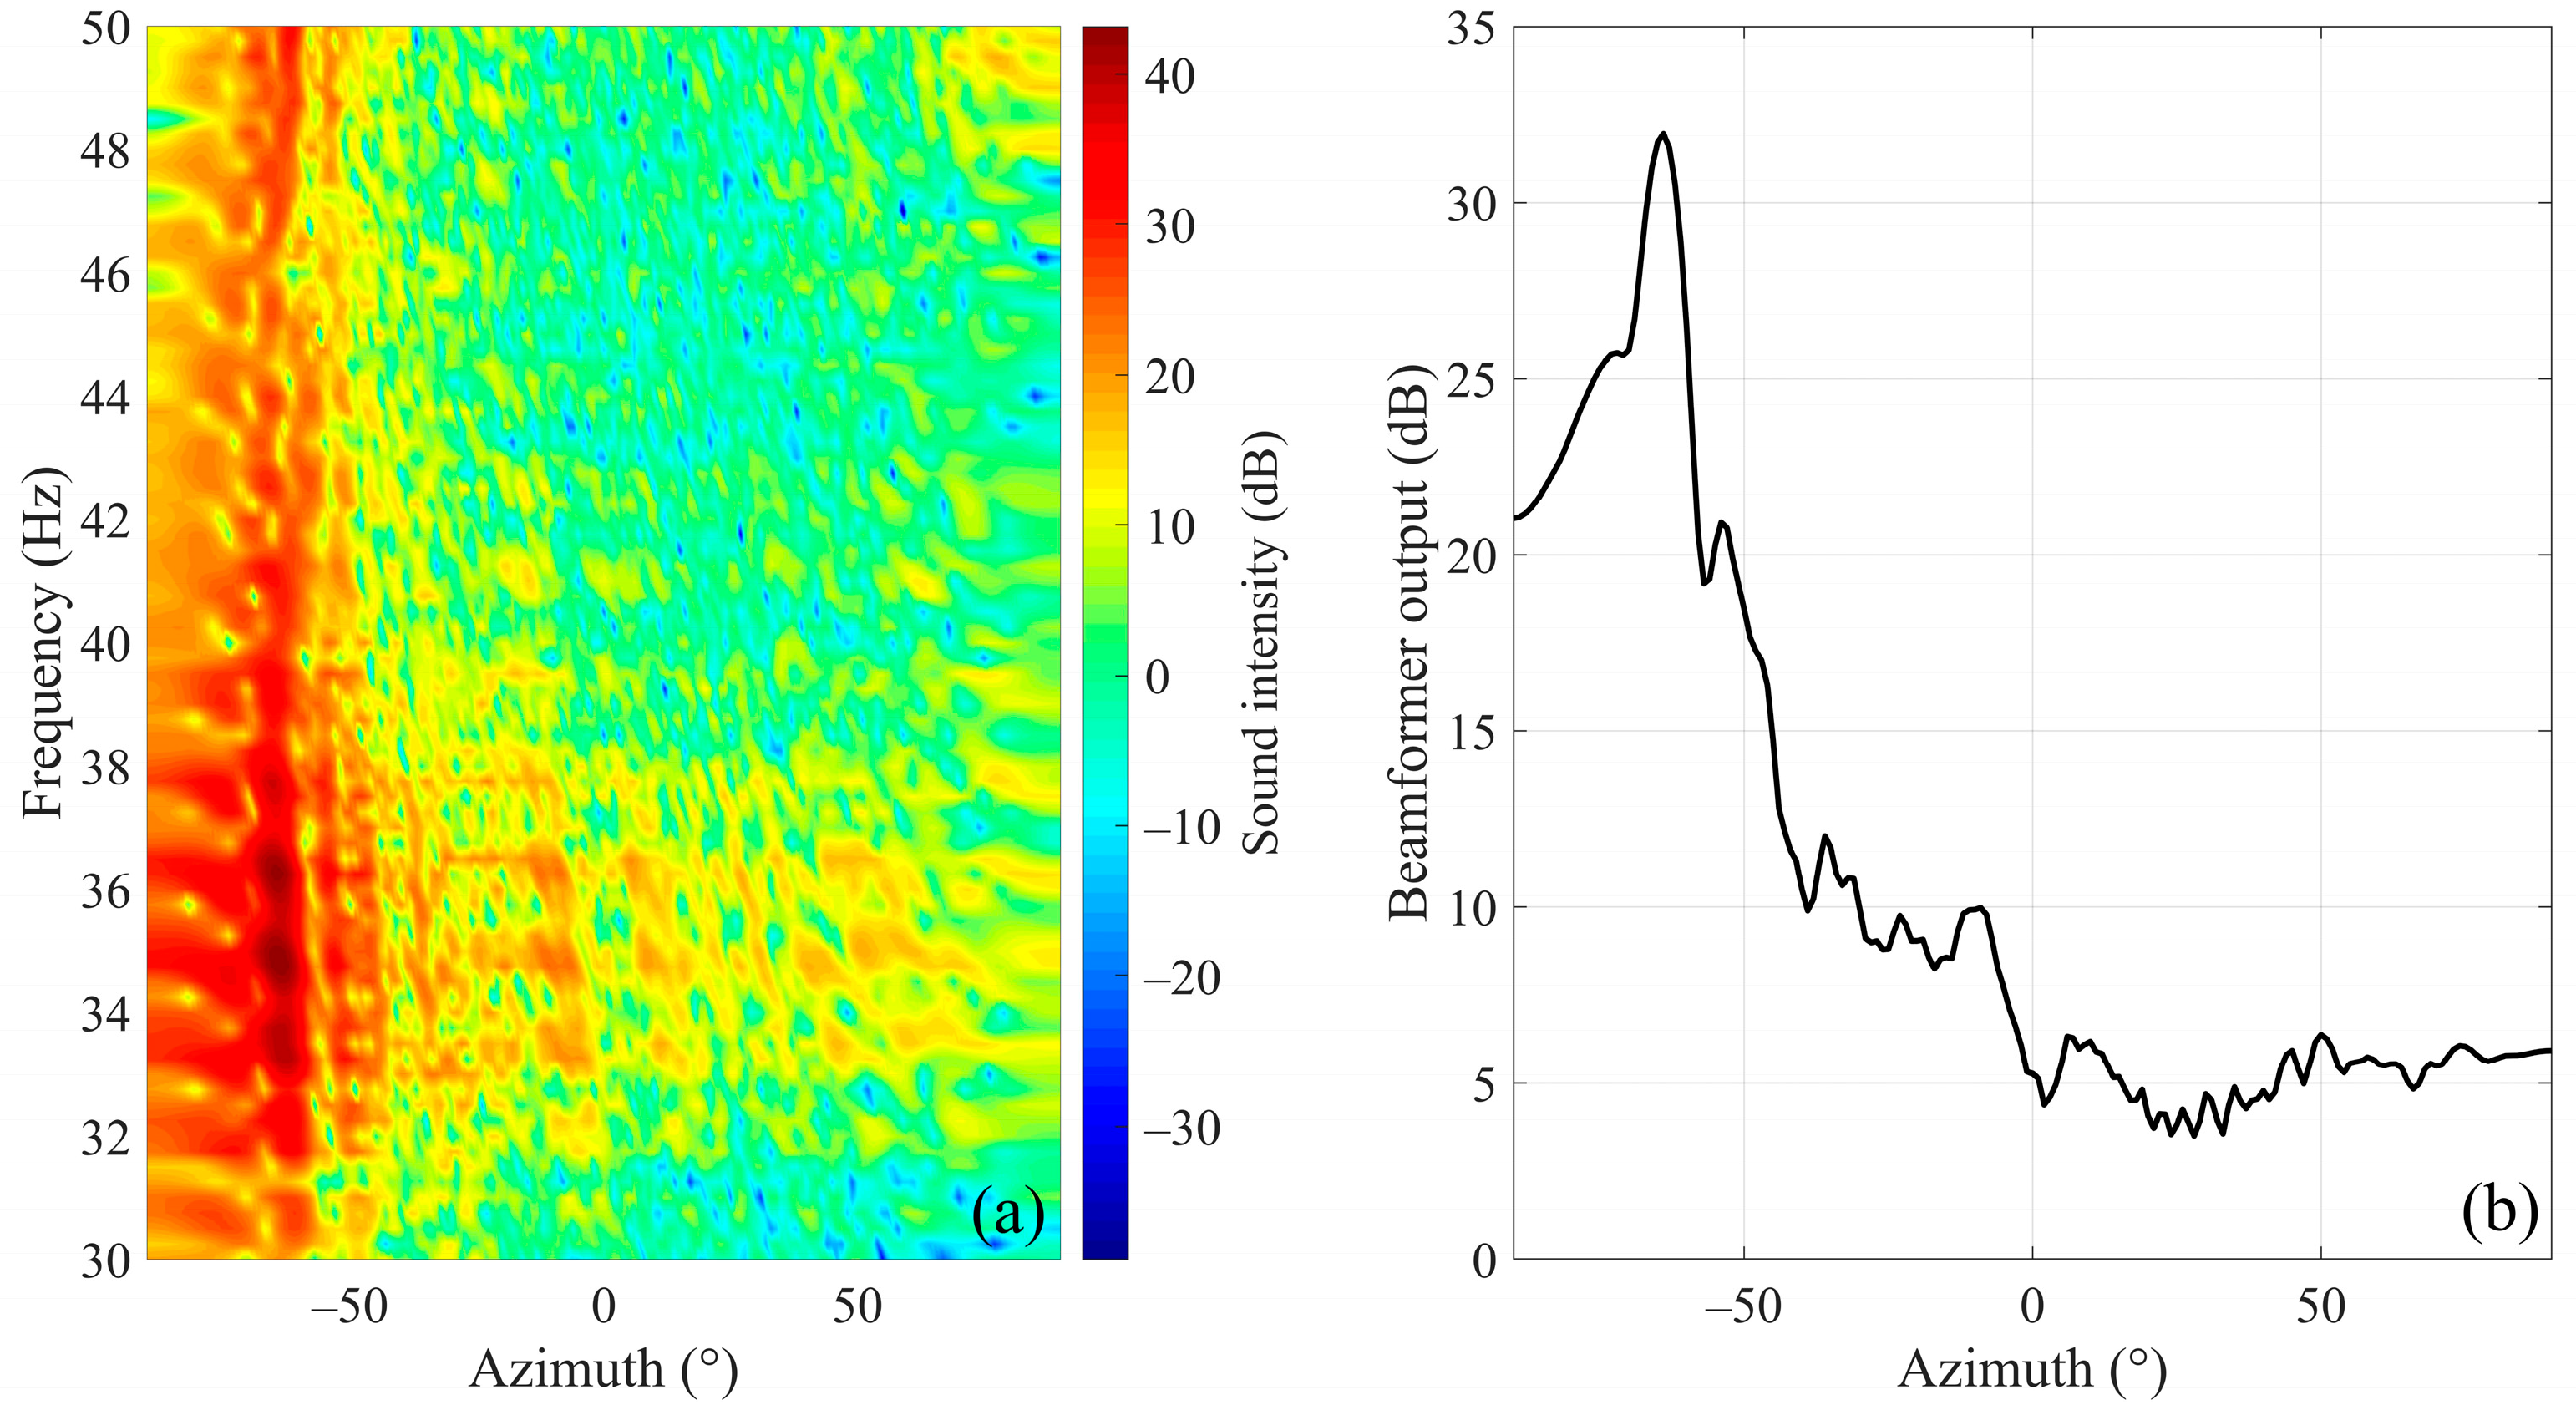
The phase cross-correlation data are processed by SCBF-SE, then the beam output results are shown in Figure 14a,b. Among them, Figure 14b is the average beam output over the studied frequency band. According to the main lobe position of average beam output of SCBF-SE over the studied frequency band, the estimated target azimuth is about −64°.
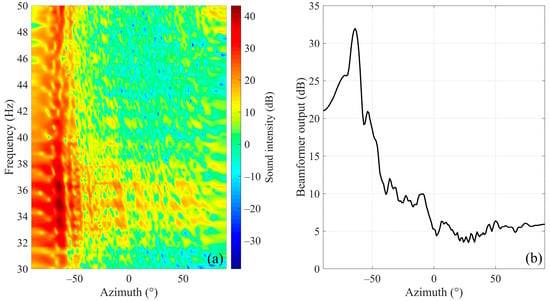
Figure 14.
Beamforming results of SCBF-SE of phase-correlated data for the scattered sound field of an omnidirectional target in deep-water active experiment. (a,b) are the beamforming results over different frequencies and the average beam output over the studied frequency band, respectively.
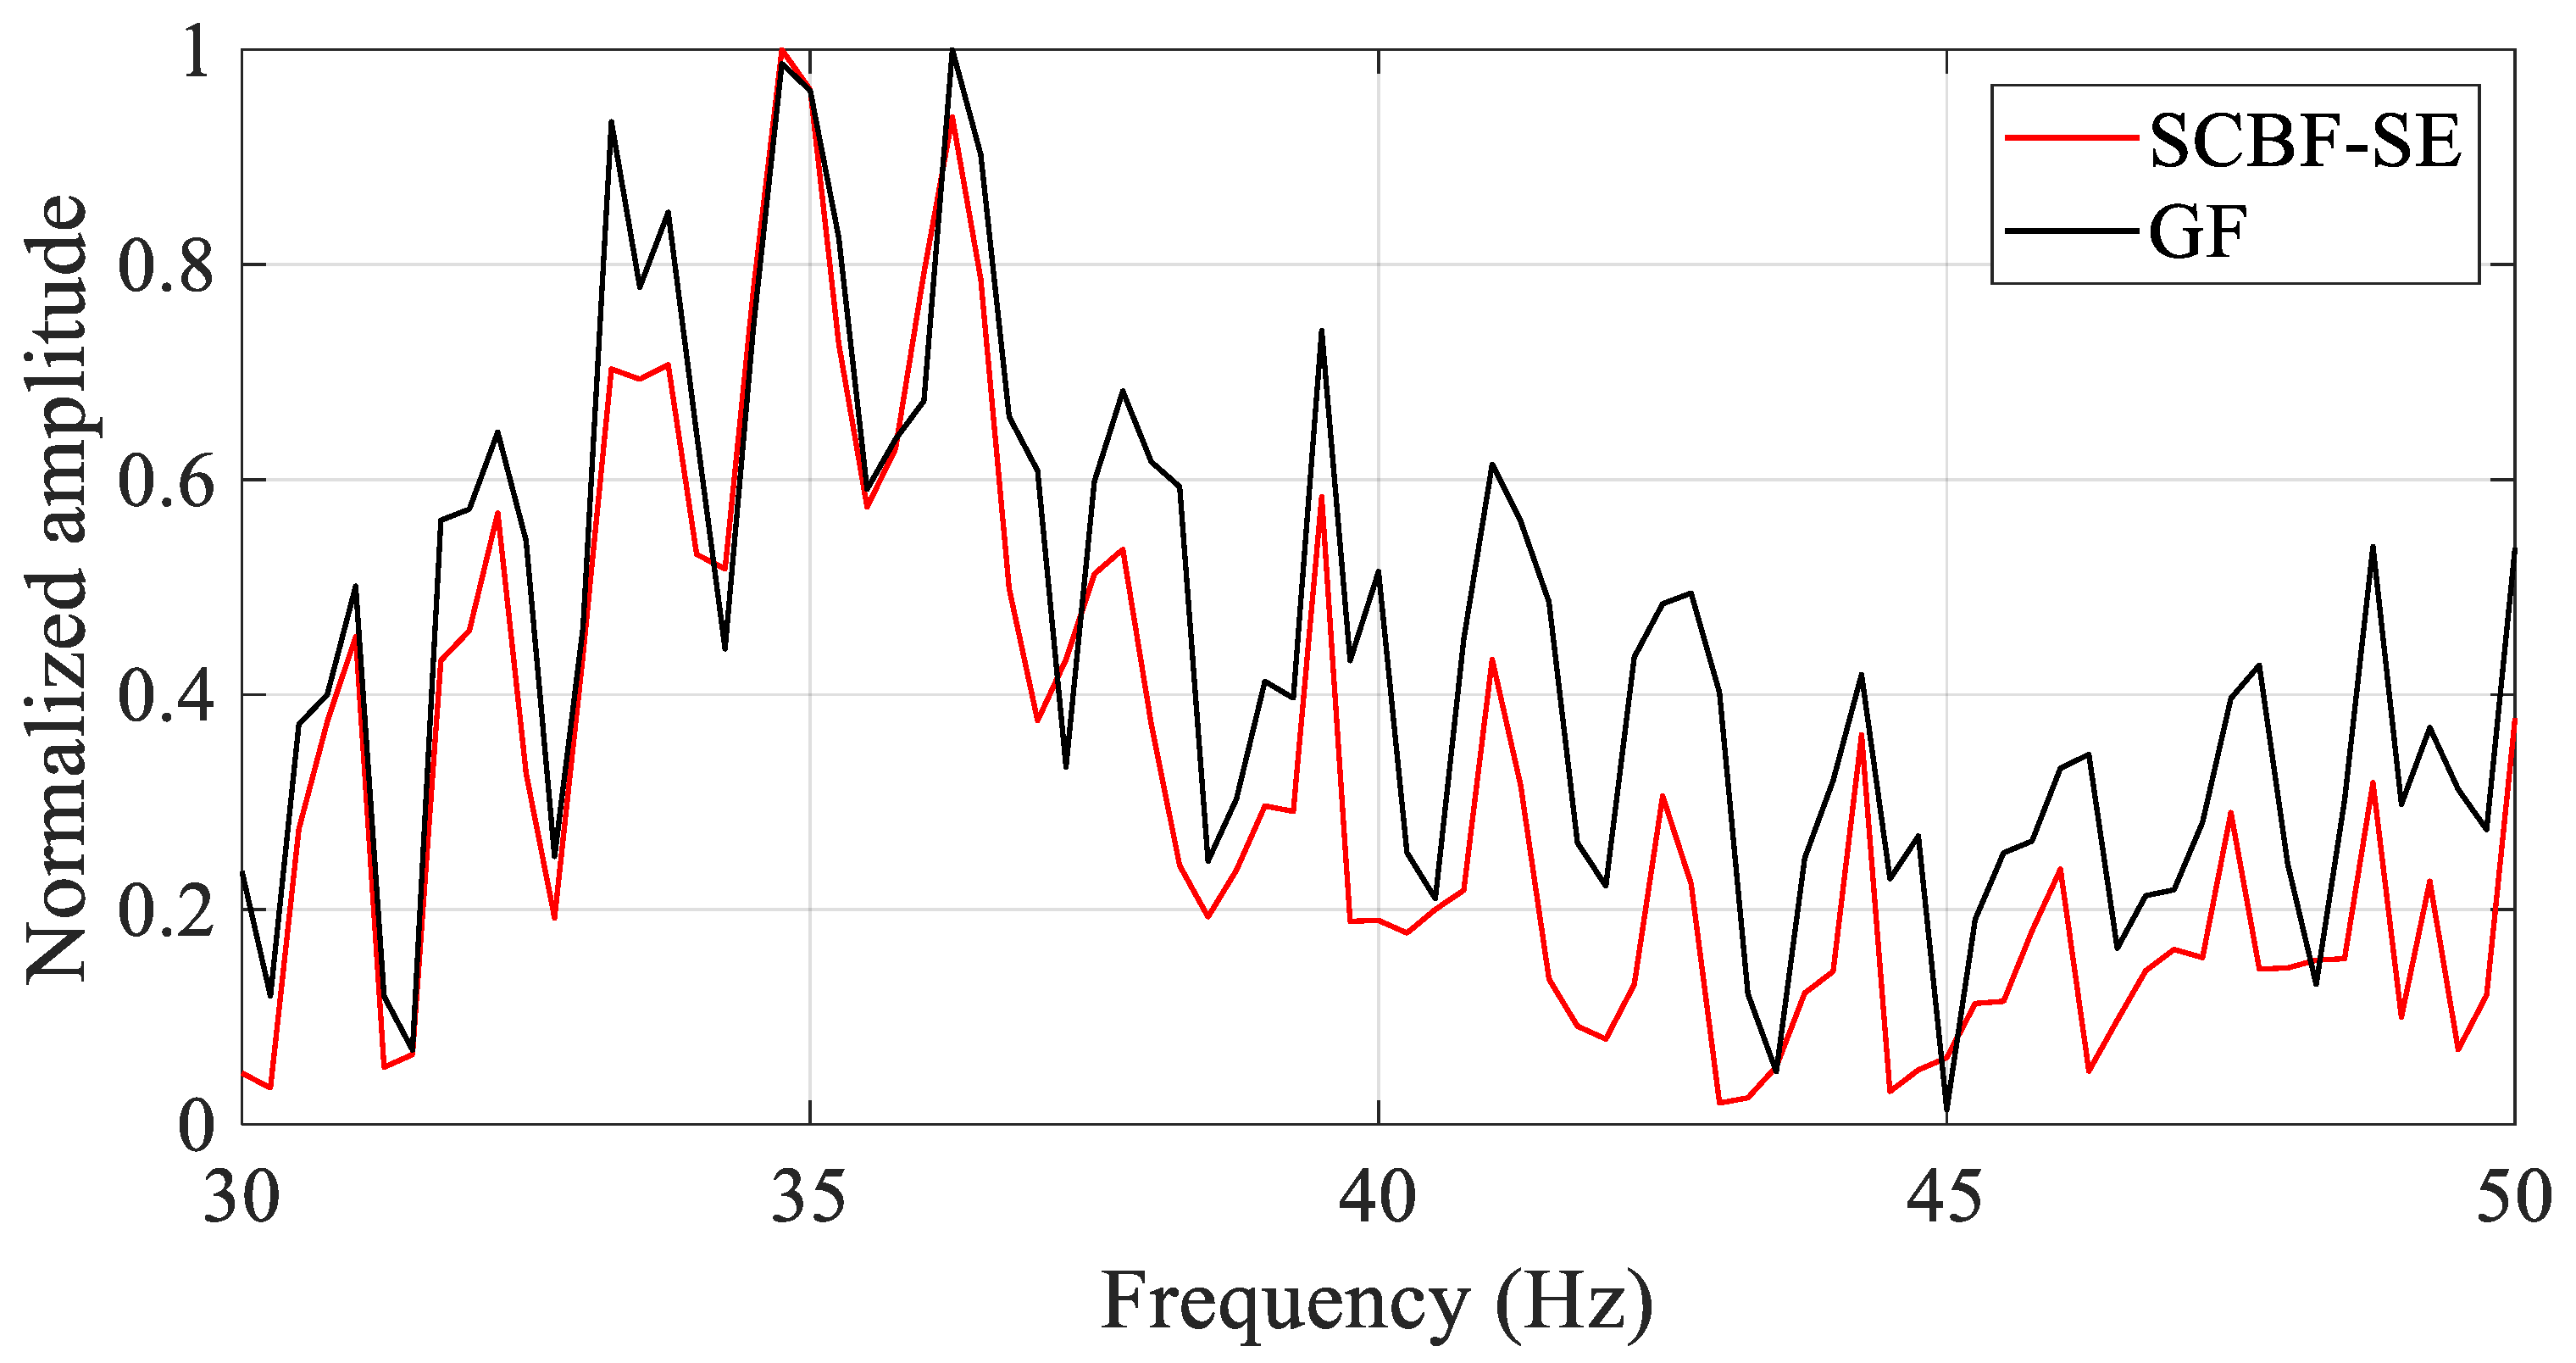
Based on the main lobe direction, the main lobe output in frequency domain is collected as shown in Figure 15. The black line represents the reference result of the interference structure, and the red line represents the estimated result of the interference structure of the scattered sound field enhanced by SCBF-SE of the active sonar in deep water. It can be seen that the trend of the interference structure result estimated by SCBF-SE is basically consistent with its theoretical value, indicating that in a deep-water experimental environment, SCBF-SE can also enhance the interference structure between the target and the reference element well. As can be seen from Figure 15, within the frequency range of 30~37 Hz, the enhanced value of the interference structure is basically consistent with the real value.
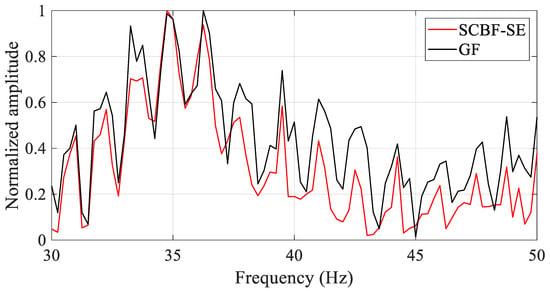
Figure 15.
The interference structures of the scattered sound field for an omnidirectional target estimated by SCBF-SE in deep-water active experiment. The black line represents the true interference structure between the target and the reference element, while the red line denotes the interference structure estimated by SCBF-SE.
It should be noted, in the frequency range of 37~50 Hz, although the trend of the estimated result is the same as the theoretical value, there is a difference in amplitude. This is because SCBF-SE processing depends on the intensity of the scattered sound field. The intensity of the scattered signals received by each array element in the frequency range of 37~50 Hz is weaker than that in the frequency range of 30~37 Hz (see the results in Figure 13b). Even so, the enhancement results of SCBF-SE still show an intensity fluctuation periodicity that is basically consistent with the real interference structure, which indicates that the extraction results have well preserved the interference structure information related to the target position and environment (as discussed in References [33,34,35], where changes in target position and environment can be embodied in the periodicity of interference intensity fluctuations).
6. Discussion
To address the issue of enhancing the interference structure of target–receiver path in deep-water active sonar scenarios, this study primarily conducts work in the following three aspects:
- (1)
- Joint analysis of theoretical modeling and numerical simulation on the cutting effect of interference striations in deep-water active sonar scattered sound fields. Compared with Ref. [24], this paper further analyzes the influence of the source–target path interference structure on the interference striations of the target–receiver path. By applying the Kirchhoff approximation and assuming the scattering function corresponds to a regular-shaped object, an expression for the active sonar scattered sound field applicable to deep-water conditions is derived under ray theory (Equation (3)). Based on this mathematical expression, the influence of the source–target path interference structure on the target–receiver path interference striations is analogous to amplitude modulation (Figure 3). The fluctuations in amplitude within the source–target path interference structure visually produce a “cutting” effect on the target–receiver path interference striations (Figure 2). These reasons lead to the destruction of the target–receiver path interference structure, which contains information on target position and sound field environmental parameters.
- (2)
- Extension of the SCBF-SE algorithm (proposed for shallow-water passive scenarios) to deep-water active sonar. This paper conducts a comparative analysis of the phase relationships of array signals processed by the SCBF-SE algorithm in shallow-water passive scenarios and those in deep-water active sonar scenarios (Equations (22) and (24)). The analysis shows that the phase relationships of the two types of array signals have a similar form. Furthermore, the influences of the scattering function and the Green’s function of the source–target path on the array signal phase relationship in deep-water active scenarios are analogous to the influence of the source spectrum in shallow-water passive scenarios (Section 3.2). Based on this finding, the SCBF-SE algorithm is further extended to applications in deep-water active sonar scenarios.
- (3)
- Performance advantages of the SCBF-SE algorithm over traditional SBF processing in active sonar scenarios. As discussed in Ref. [24], the traditional method of using SBF to enhance the interference structure of target–receiver path in active sonar scenarios has proven that the SBF algorithm offers better output fidelity than the CBF algorithm. However, the application of the SBF algorithm requires the knowledge of source waveform and iterative phase compensation (or prior information on source range) to correct the source azimuth estimation results. By applying a cross-correlation processing procedure, the SCBF-SE algorithm can effectively eliminate the limitations of the SBF algorithm in active sonar applications, directly obtain source azimuth estimates (Figure 5, Figure 8 and Figure 14), and simultaneously maintain high output fidelity for the interference structure (Figure 6, Figure 9 and Figure 15). In addition, compared with the discussions in Ref. [24], this study further considers the influence of the scattering function (Section 4.1.2) and verifies the effectiveness of the SCBF-SE algorithm for regular scatterers such as rigid spheres.
- (4)
- Performance advantages of the SCBF-SE algorithm over traditional incoherent energy-accumulation processing. For coherent processing methods, the fidelity advantage of SBF over CBF has been sufficiently demonstrated (e.g., Refs. [15,24]). From the performance analysis of SCBF-SE, this paper focuses on the performance advantages of the striation-based algorithm that employs joint energy–phase processing over conventional image-based incoherent energy-accumulation processing (using the IASE algorithm as an example). The results within the SNR scope of −30 dB to 30 dB indicate that when the sum of SNR and array gain exceeds 0 dB, the fidelity of the interference striation structure output by the SCBF-SE algorithm is significantly superior to that of the IASE processing method. Moreover, as SNR increases, the performance of the SCBF-SE algorithm improves more rapidly (Figure 10). With the SNR set to −10 dB, the array element spacing held constant, and the number of array elements configured as [51, 71, 101, 151, 201, 301] (with the array aperture increasing gradually); the fidelity of the SCBF-SE algorithm remains superior to that of the IASE method (Figure 11). These results further confirm that the SCBF-SE method features a lower array aperture requirement.
The limitations of the current method and prospects for future work are outlined as follows. The beam output result in Equation (34) corresponds to the Green’s function of the target–receiver path. This indicates that, under the theoretical modeling scenario of this paper, the two-way problem of active sonar can theoretically be simplified to a one-way problem. This characteristic is conducive to the integration of active and passive detection methods and warrants further research in the future. This study analyzes omnidirectional targets and the rigid sphere model in the far-field condition. Simplified models facilitate the derivation of explicit formulaic expressions, and the far-field condition aligns with most existing array signal processing theories. However, this also imposes certain constraints on the practical application of the work presented in this paper. In the future, more complex object shapes can be considered, and the performance of the algorithm in more complex deep-water environmental scenarios also deserves further investigations. For near-field research, the striation-based beamforming algorithm can be further considered for integration with near-field focused beamforming theory, which represents a worthwhile direction for improvement.
7. Conclusions
The SCBF-SE algorithm is applied to enhance the interference structure of target–receiver paths in deep-water active sonar scenarios. Through theoretical and numerical analyses, the cutting effect of interference striations in the element–frequency domain of deep-water active sonar is investigated, and the SCBF-SE algorithm is extended to deep-water active sonar.
By applying cross-correlation processing of array element signals, the SCBF-SE algorithm, compared with existing SBF method for enhancing the interference structure of target–receiver path, requires no additional phase compensation process to correct the source azimuth and no prior knowledge of the source waveform. In addition, compared with existing image-based incoherent energy-accumulation methods, the SCBF-SE algorithm can utilize the consistency of striation signals and joint amplitude–phase processing to effectively improve the accuracy of interference structure enhancement, exhibiting better background noise suppression capability and lower aperture requirements.
This study focuses on far-field scenarios and assumes that scatterers have a certain degree of regularity. In the future, the performance of the method under more complex sound field conditions (e.g., near-field scenarios, complex hydrological environments, and irregular scatterers) deserves further exploration.
Author Contributions
Conceptualization, J.D. and C.L.; methodology, J.D., C.L. and S.Z.; software, J.D. and C.L.; validation, J.D. and C.L.; formal analysis, J.D. and C.L.; investigation, J.D., C.L., S.Z., Y.Q. and S.L.; resources, C.L., S.Z. and Y.Q.; data curation, J.D., C.L. and S.L.; writing—original draft preparation, J.D.; writing—review and editing, C.L., S.Z., Y.Q. and S.L.; visualization, J.D.; supervision, C.L., S.Z. and Y.Q.; project administration, C.L., S.Z. and Y.Q.; funding acquisition, C.L., S.Z. and Y.Q. All authors have read and agreed to the published version of the manuscript.
Funding
This research was funded by the Young Scientists Fund of the National Natural Science Foundation of China, Grant No. 12404519, China Postdoctoral Science Foundation, Grant No. GZC20232903, the Special Research Assistant Program of the Chinese Academy of Sciences and National Natural Science Foundation of China, Grant No. 12174419.
Data Availability Statement
The data that support the findings of this study are available from the Institute of Acoustics of the Chinese Academy of Sciences. Restrictions apply to the availability of these data, which were used under license for this study. Data are available from the authors upon reasonable request and with the permission of the Institute of Acoustics of the Chinese Academy of Sciences.
Acknowledgments
The author would like to thank the reviewers for their comments on improving the quality of this paper.
Conflicts of Interest
The authors declare no conflicts of interest.
Nomenclature
| HLA | Horizontal line array |
| SE | Single-element |
| SCBF-SE | Striation–correlation-based beamforming with single element |
| IASE | Incoherent accumulation of the striation energy |
| SBF | Striation-based beamforming |
| SNR | Signal-to-noise ratio |
| CBF | Conventional beamforming |
| GF | Green’s function |
References
- Chuprov, S. Interference structure of a sound field in a layered ocean. In Ocean Acoustics, Current State; Brekhovskikh, L.M., Andreevoi, I.B., Eds.; Nauka: Moscow, Russia, 1982; pp. 71–91. [Google Scholar]
- Kuperman, W.A.; D’Spain, G.L. 2002 Ocean Acoustic Interference Phenomena and Signal Processing; AIP Conference Proceedings: New York, NY, USA, 2002; Volume 621. [Google Scholar]
- Turgut, A.; Orr, M.; Rouseff, D. Broadband source localization using horizontal-beam acoustic intensity striations. J. Acoust. Soc. Am. 2010, 127, 73–83. [Google Scholar] [CrossRef] [PubMed]
- Qi, Y.B.; Zhou, S.H.; Zhang, R.H.; Ren, Y. A Waveguide-Invariant-Based Warping Operator and Its Application to Passive Source Range Estimation. J. Comput. Acoust. 2015, 23, 1550003. [Google Scholar] [CrossRef]
- Qi, Y.-B.; Zhou, S.-H.; Zhang, R.-H.; Zhang, B.; Ren, Y. Modal characteristic frequency in a range-dependent shallow-water waveguide and its application to passive source range estimation. Acta Phys. Sin. 2014, 63, 044303. [Google Scholar] [CrossRef]
- Goldhahn, R.; Hickman, G.; Krolik, J. A waveguide invariant adaptive matched filter for active sonar target depth classification. J. Acoust. Soc. Am. 2011, 129, 1813–1824. [Google Scholar] [CrossRef]
- Guo, X.-L.; Yang, K.-D.; Ma, Y.-L.; Yang, Q.-L. A source range and depth estimation method based on modal dedispersion transform. Acta Phys. Sin. 2016, 65, 214302. [Google Scholar] [CrossRef]
- Liu, Z.; Guo, L.; Yan, C. Source depth discrimination in negative thermocline using waveguide invariant. ACTA Acust. 2019, 44, 925–933. [Google Scholar] [CrossRef]
- Tao, H.L.; Krolik, J.L. Waveguide invariant focusing for broadband beamforming in an oceanic waveguide. J. Acoust. Soc. Am. 2008, 123, 1338–1346. [Google Scholar] [CrossRef] [PubMed]
- Rouseff, D.; Zurk, L.M. Striation-based beamforming for estimating the waveguide invariant with passive sonar. J. Acoust. Soc. Am. 2011, 130, EL76–EL81. [Google Scholar] [CrossRef]
- Liu, C.P.; Zhou, S.H.; Qi, Y.B.; Zhang, X.D.; Zhang, D.; Yang, X.S. The Striation-Correlation-Based Beamforming for Estimating the Green’s Function in a Shallow Water Waveguide. J. Theor. Comput. Acous. 2022, 30, 2240008. [Google Scholar] [CrossRef]
- Liu, W.; Yang, Y.; Lü, L.; Shi, Y.; Liu, Z. Source localization by matching sound intensity with a vertical array in the deep ocean. J. Acoust. Soc. Am. 2019, 146, EL477–EL481. [Google Scholar] [CrossRef]
- Xu, Z.; Li, H.; Duan, R.; Yang, K. Passive broadband source localization using asynchronous vertically distributed hydrophones in deep water. Appl. Acoust. 2023, 211, 109487. [Google Scholar] [CrossRef]
- Zhang, R.-H.; Su, X.-X.; Li, F.-H. Improvement of low-frequency acoustic spatial correlation by frequency-shift compensation. Chin. Phys. Lett. 2006, 23, 1838–1841. [Google Scholar]
- Liu, C.P.; Zhou, S.H.; Hui, J.; Ren, Y.; Qi, Y.B. Performance Metrics for Striation-based Beamforming and Application Requirements with the Horizontal Line Array in Shallow Water. J. Theor. Comput. Acous. 2020, 29, 2050028. [Google Scholar] [CrossRef]
- Liu, C.; Zhou, S.; Qi, Y. Performance comparison of conventional and striation-based beamformers for underwater bearing detection of pulse sources. J. Acoust. Soc. Am. 2023, 154, 3955–3972. [Google Scholar] [CrossRef]
- Liu, C.; Zhou, S.; Qi, Y. Beam Converging and Slope Search Processing by Striation-Correlation-Based Beamforming in Shallow Water. IEEE J. Ocean. Eng. 2025, 50, 1718–1739. [Google Scholar] [CrossRef]
- Quijano, J.E.; Zurk, L.M.; Rouseff, D. Demonstration of the invariance principle for active sonar. J. Acoust. Soc. Am. 2008, 123, 1329–1337. [Google Scholar] [CrossRef] [PubMed]
- Quijano, J.E.; Campbell, R.L.; Oesterlein, T.G.; Zurk, L.M. Experimental observations of active invariance striations in a tank environment. J. Acoust. Soc. Am. 2010, 128, 611–618. [Google Scholar] [CrossRef] [PubMed]
- He, C.; Quijano, J.E.; Zurk, L.M. Enhanced Kalman Filter Algorithm Using the Invariance Principle. IEEE J. Ocean. Eng. 2009, 34, 575–585. [Google Scholar] [CrossRef]
- Zhao, Z.-D.; Wang, N.; Gao, D.-Z.; Wang, H.-Z. Broadband Source Ranging in Shallow Water Using the Ømega-Interference Spectrum. Chin. Phys. Lett. 2010, 27, 064301. [Google Scholar] [CrossRef]
- Schecklman, S.; Zurk, L.M. Striation processing of continuously active sonar data. J. Acoust. Soc. Am. 2015, 137, 2438. [Google Scholar] [CrossRef]
- Hummel, H.I.; van der Mei, R.; Bhulai, S. A survey on machine learning in ship radiated noise. Ocean. Eng. 2024, 298, 117252. [Google Scholar] [CrossRef]
- Zurk, L.M.; Rouseff, D. Striation-based beamforming for active sonar with a horizontal line array. J. Acoust. Soc. Am. 2012, 132, EL264–EL270. [Google Scholar] [CrossRef]
- Gu, Y.; Gong, Z.; Li, Z. Interference patterns of the bistatic scattered field on a horizontal array in shallow water waveguide. In Proceedings of the Global Oceans 2020: Singapore—U.S. Gulf Coast, Biloxi, MS, USA, 5–30 October 2020; pp. 1–4. [Google Scholar] [CrossRef]
- Munk, W.H. Sound channel in an exponentially stratified ocean, with application to SOFAR. J. Acoust. Soc. Am. 1974, 55, 220–226. [Google Scholar] [CrossRef]
- Dun, J.; Zhou, S.; Qi, Y.; Liu, C. Simulation Study on Detection and Localization of a Moving Target Under Reverberation in Deep Water. J. Mar. Sci. Eng. 2024, 12, 2360. [Google Scholar] [CrossRef]
- Hough, P.V.C. Method and Means for Recognizing Complex Patterns. US3069654A, 18 December 1962. [Google Scholar]
- Le Gall, Y.; Bonnel, J. Separation of moving ship striation patterns using physics-based filtering. In Proceedings of the ICA 2013 Montreal, Montreal, QC, Canada, 2–7 June 2013; p. 070073. [Google Scholar] [CrossRef]
- Liu, C.; Zhou, S.; Qi, Y.; Wang, Q.; Peng, Z. Application of striation-based beamforming in deep water for multi-path power convergence and azimuth estimation of pulse sources. Appl. Acoust. 2025, 238, 110797. [Google Scholar] [CrossRef]
- Sabra, K.G.; Dowling, D.R. Blind deconvolution in ocean waveguides using artificial time reversal. J. Acoust. Soc. Am. 2004, 116, 262–271. [Google Scholar] [CrossRef]
- Wang, Q.; Peng, Z.; Zhang, B.; Zhu, F.; Luo, W.; Wang, T.; Zhang, L.; Mao, J. Horizontal-Transverse Coherence of Bottom-Received Acoustic Field in Deep Water with an Incomplete Sound Channel. J. Mar. Sci. Eng. 2024, 12, 2354. [Google Scholar] [CrossRef]
- Rouseff, D. Effect of shallow water internal waves on ocean acoustic striation patterns. Waves Random Media 2001, 11, 377–393. [Google Scholar] [CrossRef]
- Kniffin, G.P.; Boyle, J.K.; Zurk, L.M.; Siderius, M. Performance metrics for depth-based signal separation using deep vertical line arrays. J. Acoust. Soc. Am. 2016, 139, 418–425. [Google Scholar] [CrossRef] [PubMed]
- Pereselkov, S.A.; Kuz’kin, V.M. Interferometric processing of hydroacoustic signals for the purpose of source localization. J. Acoust. Soc. Am. 2022, 151, 666–676. [Google Scholar] [CrossRef]
Disclaimer/Publisher’s Note: The statements, opinions and data contained in all publications are solely those of the individual author(s) and contributor(s) and not of MDPI and/or the editor(s). MDPI and/or the editor(s) disclaim responsibility for any injury to people or property resulting from any ideas, methods, instructions or products referred to in the content. |
© 2025 by the authors. Licensee MDPI, Basel, Switzerland. This article is an open access article distributed under the terms and conditions of the Creative Commons Attribution (CC BY) license (https://creativecommons.org/licenses/by/4.0/).

