Abstract
T-bar penetrometers have been widely used to measure strength parameters of marine clay in laboratory and in situ tests. However, using the deep resistance factor derived from full-flow conditions to evaluate the undrained shear strength of shallow clay layers may lead to significant underestimation. Furthermore, the deep resistance factor is inherently influenced by the strain-softening behavior of clay rather than maintaining the constant value (typically 10.5) as conventionally assumed in practice. To address this issue, large-deformation finite element (LDFE) simulations incorporating an advanced exponential strain-softening constitutive model were performed to replicate the full T-bar penetration process—from shallow embedment to deeper depths below the mudline. A series of parametric studies were conducted to examine the influence of key parameters on the resistance factor and the associated failure mechanisms during penetration. Based on numerical results, empirical formulas were derived to predict critical penetration depths for both trapped cavity formation and full-flow mechanism initiation. For penetration depths shallower than the full-flow depth, an expression for the softening correction factor was developed to calibrate the shallow resistance factor. Finally, combined with global optimization algorithms, a computer-aided back-analysis procedure was established to estimate strain-softening parameters using resistance-penetration curves from initial penetration tests in marine clay. The reliability of the back-analysis procedure was validated through extensive comparisons with a series of numerical simulation results. This procedure can be applied to the interpretation of T-bar in situ test results in soft marine clay, enabling the evaluation of its strain-softening behavior.
1. Introduction
In recent years, the advancement of subsea infrastructure—such as pipelines, anchoring systems, and other installations—into deep-sea environments has brought large-deformation behavior of marine clay to the forefront as a critical concern in geotechnical engineering. During the large deformation process, the elements of soil significantly change their relative positions, such that the soil strength decreases progressively with increasing accumulated plastic strain until reaching its residual strength (i.e., fully remolded strength). The strain-softening behavior of clay exerts considerable influences on the interaction between submarine structures and their surrounding soil. To capture the strain-softening behavior of clay strength, several special strain-softening models have been developed and implemented into finite element packages to analyze large deformation problems, in which the plastic strain in soil may exceed 100%. The earliest and most widely adopted strain-softening model for clay was introduced in the seminal work reported by the author [1]. This strain-softening model is given by
where su0 is the intact undrained shear strength prior to any disturbance, su is the current strength considering strain softening, ξ is the accumulated absolute plastic shear strain, and ξ95 represents the specific value of ξ for the soil to undergo 95% remolding, which reflects the rate of strength softening and is also termed as the ductility parameter. The typical values of ξ95 are within the range of 10–50 (i.e., 1000–5000%). δrem is the strength ratio of soil between the fully remolded and intact state (i.e., inverse of the soil sensitivity, St), which reflects the final amount of strength reduction.
However, recent studies have highlighted its oversimplified formulation and limited capability to capture the initial brittleness characteristics of clay strength. To address this limitation, An enhanced exponential strain-softening model was developed by introducing an additional parameter λ that regulates the slope of strength degradation [2], and the modified function is given by
The values of λ were found in the range of 0.5–1.0, with λ = 2/3 recommended [2]. To balance the soil’s initial brittleness and the fully remolded state more effectively, the model was further refined by establishing a calibration formula for this slope parameter using data from T-bar cyclic penetration tests [3]:
where qin and qext are the net resistance of the full-flow penetrometer during initial penetration and first extraction, respectively, and qrem corresponds to the resistance in the fully remolded state. The model’s effectiveness has been demonstrated through comprehensive validation against 20 independent cyclic experimental datasets [3]. It is also worth noting that when λ = 1, the enhanced model reduces to the conventional strain-softening model [1]. The additional degree of freedom introduced by the slope parameter λ enables better agreement with field test observations. Consequently, this model can be regarded as an extension of the conventional strain-softening model [1], thereby ensuring compatibility with the existing theoretical framework.
T-bar penetrometers have been widely used to determine strength parameters for the strain-softening model of marine clay. The T-bar penetrometer was originally developed to determine the initial undrained shear strength of clay soils, with the bearing factor derived based on the assumption of a full-flow mechanism around the penetrometer while neglecting strain-softening effects [4,5]. However, this bearing factor requires adjustment when applied to shallow and transitional penetration depths where the full-flow mechanism is not achieved [6,7,8]. The conventional strain-softening model was employed in finite element analyses [9,10,11], revealing significant reductions in T-bar bearing factors due to clay’s strain-softening characteristics. In these studies, the T-bars were wished-in-place at specified embedment depths, which were deep enough to induce full-flow mechanisms during penetration. A quantitative formulation for the softening correction factor applied to deep bearing capacity coefficients was developed by the author [12] based on systematic large-deformation finite element (LDFE) analyses. The authors of the article [13] simulated the complete penetration process from mudline to deep penetration and proposed an inverse analysis framework for estimating soil strength and softening parameters using initial penetration curves. However, this framework maintained the conventional strain-softening model without incorporating the influence of the slope parameter λ.
Cyclic T-bar testing has emerged as a recommended methodology for evaluating strain-softening parameters (e.g., St and ξ95 in Equation (1)). The empirical correlations between clay sensitivity St and cyclic resistance were established in [14] based on field cyclic penetration tests. The resistance degradation during cyclic T-bar penetration and extraction using LDFE analyses was investigated under the assumption of the full-flow mechanism [15]. Cyclic penetration processes at varying depths were systematically simulated in [16], with an interpretation method based on resistance decay curves developed therein. The necessity of maintaining full-flow conditions during cyclic penetration/extraction operations was also emphasized [16]. These findings cautioned against the use of shallow cyclic test data for estimating strain-softening parameters. This limitation arises from the formation of a trapped cavity during the T-bar extraction phase, which induces a progressive reduction in subsequent penetration resistance. The problem potentially constrains practical applications of T-bar cyclic tests in offshore engineering scenarios where near-surface soil behavior dominates, such as pipeline and cable installations.
To address this technical gap, the present study conducts large-deformation finite element (LDFE) analyses incorporating an enhanced strain-softening model to simulate the behavior of marine clay throughout the full initial penetration process—from shallow embedment to deeper depths. Based on the simulation results, the study aims to derive empirical expressions for the softening correction factor to calibrate shallow penetration resistance and to develop a computer-aided back-analysis framework for quantifying strain-softening parameters within the enhanced constitutive model.
2. Finite Element Analyses Details
The large soil deformation problem of T-bar penetration in this study was solved using the coupled Eulerian–Lagrangian (CEL) approach in the commercial finite element package ABAQUS. More details associated with the finite element model are given below.
2.1. Constitutive Model and Interface Properties
As mentioned in most published papers, the penetration of T-bar in soft marine clay is under undrained conditions [4,5,6,7,8,9,10,11,12,13,14,15,16]. Therefore, the clay was modeled as an elasto-perfectly plastic material obeying the Tresca yield criterion but extending to capture the strain-softening effect. A constant stiffness ratio of E/su = 300 (where E is the Young’s modulus) and Poisson’s ratio v = 0.495 were taken throughout the clay profile. These two values are consistent with those used in [16,17,18,19]. The undrained shear strength at each integration point was updated at the beginning of each time increment, following the enhanced strain-softening model (i.e., Equation (2)). In the present study, the model is implemented in ABAQUS 6.14 using the user-defined subroutine VUSDFLD written in Fortran. In each increment, the strength of soil is modified by calling the VUSDFLD subroutine.
The general contact algorithm in ABAQUS was employed to simulate the penetrometer–soil interaction. The interface was modeled as a frictional contact, incorporating both the Coulomb friction law and a limiting shear stress criterion (τmax) at the T-bar/soil interface. To ensure soil failure would be governed by the limiting shear stress rather than friction resistance, an artificially high Coulomb friction coefficient of μ = 1000 was adopted [16]. In ABAQUS software, the interfacial mechanical behavior follows Coulomb’s friction law, where the interfacial shear stress increases with the rise of normal stress acting on the interface until a limiting shear stress is reached. However, under undrained conditions, the interfacial shear stress between clay and structures is generally considered to be governed by the undrained shear strength of clay, independent of the normal stress applied on the interface. Therefore, to reasonably simulate this adhesive friction characteristic in ABAQUS, a relatively high friction coefficient is typically adopted to ensure that the interfacial shear stress reaches its limit even under low normal stress levels. The same friction setting method was also employed by other researchers [20,21,22,23]. The limiting shear stress was defined as τmax = αsu0, where the roughness factor α was assigned as α = δrem to account for the strain-softening behavior of soil.
2.2. Geometric Model and Boundary Conditions
This study involved only one half of the T-bar and soil domain for all analyses, accounting for the symmetry of the characteristic of the model, as illustrated in Figure 1. The T-bar was modeled as a Lagrangian rigid body, while the soil was discretized using Eulerian elements of type EC3D8R. To minimize boundary effects, the Eulerian domain was extended to 5D laterally and 20D vertically, where D denotes the diameter of the T-bar. The Eulerian mesh encompassed the original soil domain and an overlying void layer with a thickness of 2D, facilitating soil flow into the empty Eulerian elements. A uniform mesh, spanning 16D in depth and 3D horizontally, was refined to D/20. Validation in [16] confirmed that mesh sizes smaller than D/20 yield negligible effects on simulation results. The remaining domains were meshed progressively coarser, with the maximum element size near the boundary being approximately D/4.
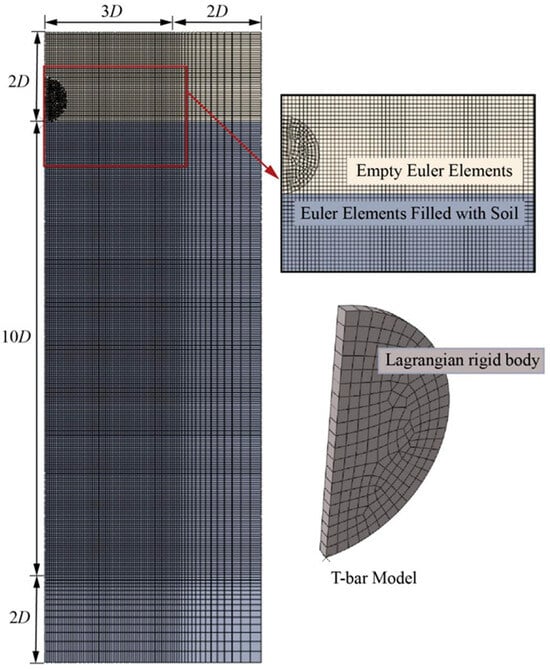
Figure 1.
Finite element model.
In field tests, the length L and diameter D of the T-bar are 25 cm and 4 cm, respectively. Given that the end effect on the bearing factor becomes minimal when the aspect ratio L/D of the T-bar exceeds 6 [13], a plane strain hypothesis was adopted to simulate T-bar penetration, thereby reducing computation costs. However, only three-dimensional elements are supported in CEL analyses. To approximate plane strain conditions, the model was assigned a single element in the out-of-plane (thickness) direction, with a thickness of D/20. The two in-plane faces were constrained to prevent displacement in the thickness direction. The upper soil surface was left free, while the remaining boundaries were restrained in the normal direction and permitted to move tangentially.
2.3. Analysis Procedure
In the first step, the initial geostatic stress field was applied to the soil domain with coefficient of lateral earth pressure K0 = 1, as the stable penetration resistance was found to be nearly unaffected by the coefficient [15]. For this study, a typical submerged unit weight of marine clay γ′ = 6 kN/m3 was used. A downward velocity boundary condition was subsequently imposed at the reference point of the T-bar to facilitate its insertion into the soil at a prescribed penetration depth. The reaction force F was monitored throughout the penetration process. It should be noted that the primary objective of this study is to evaluate the influence of strain softening on T-bar penetration test results. Accordingly, a penetration velocity of 0.004 m/s (equivalent to 0.1D) was adopted, representing only one-fifth of the velocity typically recommended for field testing, to effectively minimize the effects of strain rate on the measured response [16].
The T-bar bearing factor, NT-bar, can be calculated by Equation (4):
where Fnet is the net penetration resistance, A is the cross-sectional area of the T-bar, qnet is the penetration pressure per unit area (=Fnet/A), F is the total penetration resistance measured by the T-bar, and Fb is the buoyant force. The buoyant force Fb can be calculated using the formula in [16].
2.4. Verification
To validate the reliability of the proposed numerical model, the LDFE results obtained in this study were systematically compared with those reported in the work of the author [16]. Figure 2 presents the normalized resistance–depth profiles obtained under identical parameters (λ = 1, St = 3, ξ95 = 15, and su0/γ′D = 3). It can be observed that the numerical predictions exhibit excellent agreement with the data reported by the author [16].
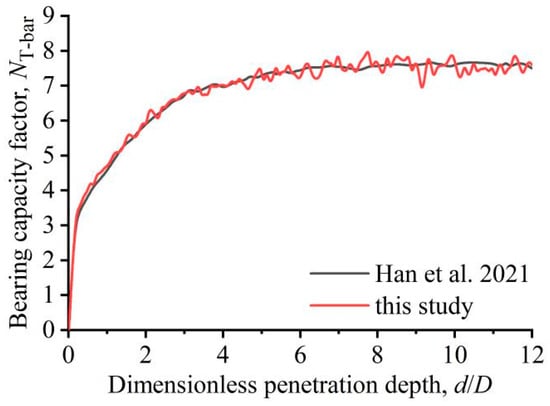
Figure 2.
Results comparison between this study and from another work [16].
LDFE analyses were conducted using the established model in this study to determine the deep bearing factors without considering strain softening. The computed results under different interface roughness coefficients were compared with the upper-bound solutions [1] as well as the LDFE results from the author work [12]. As shown in Figure 3, the NT,deep values obtained in this study, although slightly lower than those from the upper-bound solutions [1] and numerical calculations [12], exhibit a maximum discrepancy of only 3.5%, which validates the numerical model in this study. The minor discrepancies might be attributed to the following: (1) the interface friction between T-bar and clay in this model was implemented through predefined maximum shear stress, whereas the thin element approach was employed for modeling in [12]; (2) the current simulations modeled the continuous penetration process from shallow to deep depths below the mudline, whereas a pre-embedded T-bar in deep soil layers was assumed in [1,12].
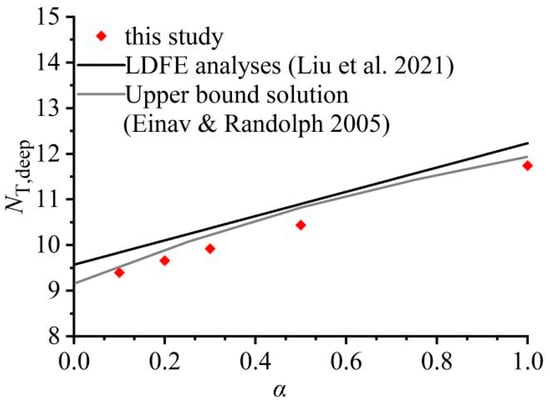
Figure 3.
Comparison of the deep bearing capacity factors obtained in this study with those reported in [1,12].
Through regression analysis of the present computational results, the empirical formula for calculating deep bearing factors without considering strain softening can be expressed as follows:
3. Analyses of Numerical Results
In this section, detailed parametric analyses were conducted to investigate the effects of dimensionless strength su0/γ′D, slope parameter λ, ductility parameter ξ95, and sensitivity St on the variation of the bearing factor and failure mechanisms during the initial penetration of the T-bar from shallow to deep embedment. The parameters considered are listed in Table 1. The present study focuses on soft clay with the dimensionless strength su0/γ′D varying from 0.3 to 9.6. Four values of λ, namely λ = 0.5, 0.667, 0.8, and 1.0, were examined to assess the effect of the slope parameter on the bearing factor. The sensitivity St was varied within the range of 1.0 to 20.

Table 1.
Selected parameters in numerical analyses.
3.1. Evolution of Soil Failure Mechanisms
To elucidate the evolution of soil failure mechanisms during the entire process of T-bar penetration from the mudline into the deeper soil strata, this section presents the soil flow modes and associated cumulative plastic strain distributions at various characteristic penetration depths under the given condition (λ = 0.667, St = 5, ξ95 = 15, and su0/γ′D = 4.8). As shown in Figure 4, when the dimensionless penetration depth d/D = 1, the soil surface heaves to accommodate the T-bar, with the surrounding soil predominantly migrating towards the mudline. An open cavity forms above the T-bar. As the T-bar continues to penetrate, the soil at the crown of the T-bar undergoes backward flow accompanied by progressive collapse, leading to gradual narrowing of the lower portion of the open cavity. By the time d/D = 4, the walls of the open cavity close at a certain depth, thereby forming a trapped cavity above the penetrometer. This critical penetration depth where the trapped cavity is formed is therefore defined as the trapped cavity depth wcavity (= dcavity/D). With further increase in penetration depth, the trapped cavity above the penetrometer gradually contracts until it completely heals at d/D = 6.5, resulting in the formation of a localized full-flow mechanism around the T-bar. This critical depth is consequently designated as the full-flow depth wdeep (=ddeep/D). Beyond the critical depth wdeep, the bearing factor is maintained as constant with continued penetration.
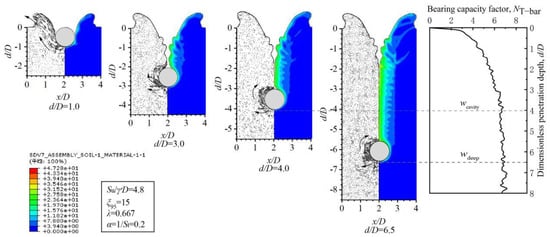
Figure 4.
Evolution of soil failure mechanisms during T-bar penetration.
Within the investigated parameter range in this study, the T-bar penetration process consistently exhibits the evolution of failure mechanisms as described above. As shown in Figure 5, when d/D < wcavity, the penetrometer operates under a shallow failure mechanism, characterized by the formation of an open cavity above the T-bar. During the transitional failure phase (also known as the trapped cavity mechanism) at wcavity < d/D < wdeep, two distinct cavity configurations are observed: a trapped cavity at the penetrometer’s crown and an open cavity left in the shallow soil layer. When d/D is beyond wdeep, the trapped cavity is completely closed, whereas the residual open cavity in the shallow soil persists. It is noteworthy that the residual cavity remains stable with continued penetration and has no discernible effect on the bearing resistance profile of the T-bar.
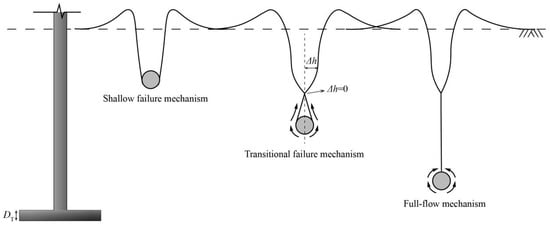
Figure 5.
Schematic of various failure mechanisms.
3.2. Effect of Dimensionless Strength su0/γ′D on Bearing Factor and Critical Depths
Figure 6 presents the relationship between the bearing capacity factor and penetration depth under different values of the dimensionless undrained strength su0/γ′D. The critical penetration depths, namely dcavity/D and ddeep/D, corresponding to each parameter value are also marked with triangles and circles, respectively. These markers identify the penetration depths at which the trapped cavity above the T-bar forms and fully closes, as described in the preceding section. It can be seen that su0/γ′D significantly influences the critical penetration depths dcavity/D and ddeep/D. Specifically, higher values of su0/γ′D correspond to greater critical depths, with the difference between dcavity/D and ddeep/D also increasing correspondingly. Figure 6 also shows that although the deep bearing factor converges to a consistent value upon reaching the full-flow depth in each soil strength scenario (i.e., for different su0/γ′D values), the penetration depth required to achieve this condition increases with higher su0/γ′D. This indicates that soil strength substantially affects the shape of the bearing factor profile.
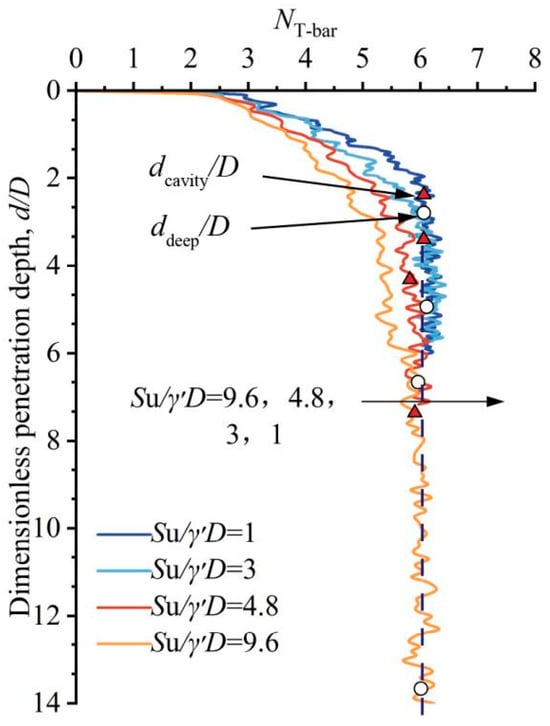
Figure 6.
The bearing factors under different Su/γ′D.
Figure 7 illustrates the soil flow mechanisms and cumulative plastic strain distributions at a penetration depth of 3D (three times the probe diameter) in soils of different strengths. Notably, soils with lower strength exhibit more pronounced flow deformation characteristics and more significant soil backflow phenomena. This behavior is attributed to enhanced soil resistance against backflow with increasing su0/γ′D, which prolongs the persistence of the open cavity above the penetrometer. This phenomenon explains the observed rise in both critical penetration depths with increasing values of the normalized undrained shear strength su0/γ′D.
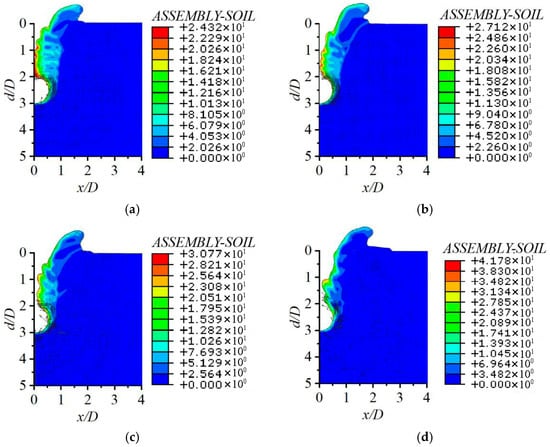
Figure 7.
Soil deformation mechanisms and cumulative plastic strain distributions under the same penetration depth d/D = 3 with different values of Su/γ′D. (a) Su/γ′D = 1; (b) Su/γ′D = 3; (c) Su/γ′D = 4.8; (d) Su/γ′D = 9.6.
3.3. Effect of Slope Parameter λ on Bearing Factor and Critical Depths
An equation to predict the full-flow penetration depth ddeep/D of T-bar penetrometers was proposed in [16], yet this equation did not account for the influence of ductility parameter ξ95. The effects of su0/γ′D, ξ95, and St on the variation of the bearing factor and critical depths were examined in [13]. However, these studies were based on the conventional strain-softening model, which does not consider the influence of the slope parameter λ. To investigate the effect of λ on the initial penetration characteristics of T-bar, LDFE analyses were performed under conditions of λ = 0.5, 0.667, 0.8, and 1.0. Figure 8 presents the bearing factor profiles across varying λ values (excluding λ = 0.8 for clarity), alongside the non-softening baseline case. As shown in Figure 8, both the bearing factor and the critical penetration depth increase with the slope parameter λ. For instance, when λ increases from 0.5 to 1, the deep bearing factor of the T-bar increases by approximately 10%, while the critical depths dcavity/D and ddeep/D increase by about 13% and 17%, respectively.
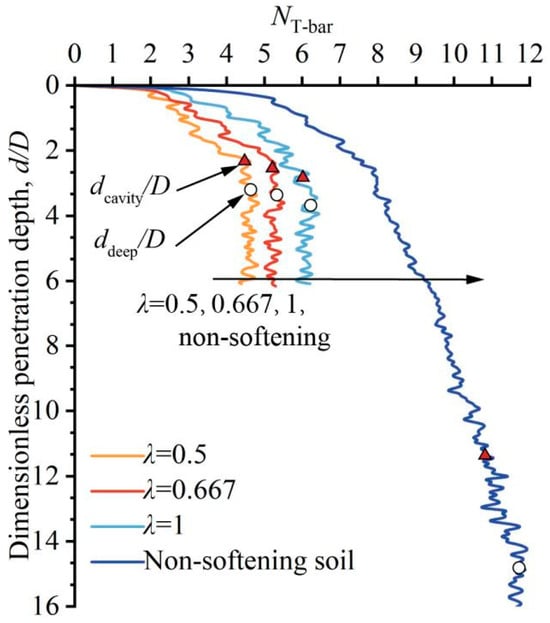
Figure 8.
The bearing factors under different slope parameters.
Figure 9 shows the soil strength distribution at a penetration depth of 3D under different slope parameters. It can be seen that as λ decreases, the disturbed zone of the soil significantly expands, with a more pronounced backward flow of soil at the crown of the T-bar, and correspondingly, the resistance encountered by the T-bar during penetration is reduced. Therefore, the estimation of critical depths and the calculation of bearing factors need to consider the influence of λ.
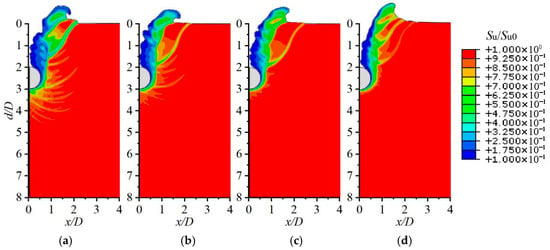
Figure 9.
Soil strength distribution at a penetration depth of 3D under different slope parameters. (a) λ = 0.5; (b) λ = 0.667; (c) λ = 0.8; (d) λ = 1.
3.4. Effect of Sensitivity St on Bearing Factor and Critical Depths
Figure 10 presents the relationship between the bearing factor and penetration depth under different sensitivities. It can be seen that as soil sensitivity increases, the deep bearing factor decreases significantly. Concurrently, both the critical penetration depth values, namely dcavity/D and ddeep/D, diminish with increasing soil sensitivity. For instance, when sensitivity St rises from 2 to 10, ddeep/D decreases from 9.0 to 4.3, while dcavity/D reduces from 6.2 to 3.3.
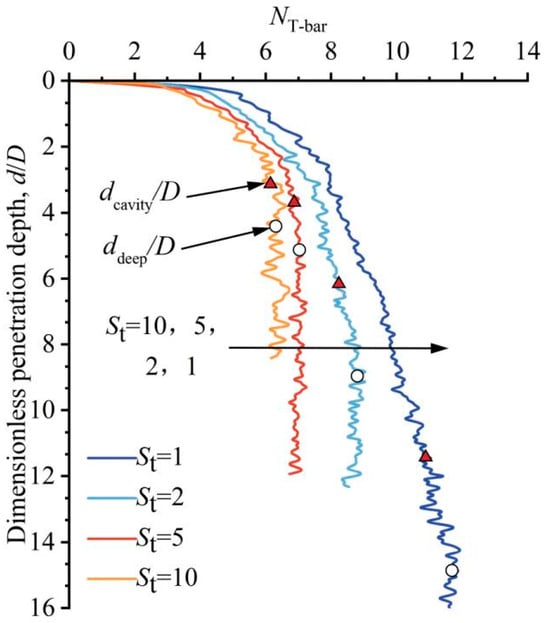
Figure 10.
The bearing factors under different soil sensitivities.
To clarify the influence of soil sensitivity St on T-bar penetration mechanisms, the distributions of accumulated plastic strain and undrained shear strength at a penetration depth of 4D are illustrated in Figure 11 and Figure 12, respectively. A comparison of the accumulated plastic strain distributions in Figure 11 shows that in highly sensitive soils, the plastic strain distribution region is more extensive, and the flow deformation characteristics are more pronounced, which obviously leads to considerable differences in critical penetration depths under varying sensitivity levels.
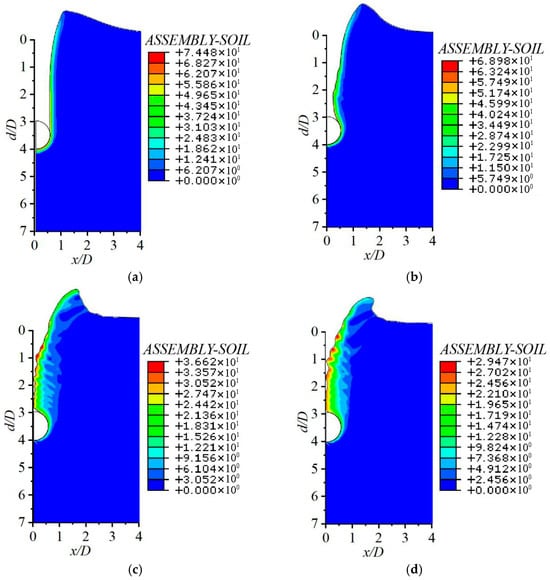
Figure 11.
Accumulated plastic strain distributions under the same penetration depth d/D = 4 with different sensitivities. (a) St = 1; (b) St = 2; (c) St = 5; (d) St = 10.
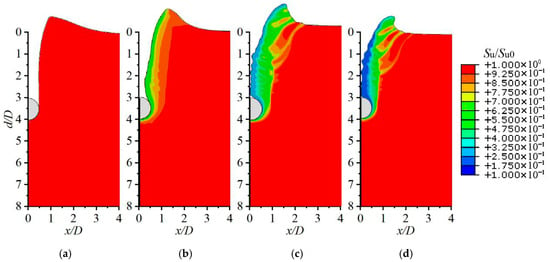
Figure 12.
Soil strength distribution at a penetration depth of 4D under different sensitivities. (a) St = 1; (b) St = 2; (c) St = 5; (d) St = 10.
Figure 12 further demonstrates that the extent of the disturbed zone enlarges progressively with increasing St, accompanied by more severe strength degradation in the soil surrounding the penetrometer. The resulting strength degradation accounts for the reduced bearing capacity factor observed at higher soil sensitivities.
3.5. Effect of Ductility Parameter ξ95 on Bearing Factor and Critical Depths
To investigate the influence of the ductility parameter ξ95 on the T-bar bearing factor, cases with ξ95 = 10, 15, 20, and 30 were analyzed. Figure 13 presents the variation of the bearing factor with penetration depth for different ξ95 values. Results for ξ95 = 20 are omitted from Figure 13 for clarity. Figure 13 shows that higher values of the ductility parameter ξ95 correspond to a consequent increase in the bearing factor. For instance, when ξ95 increases from 10 to 30, the deep bearing factor at full-flow conditions increases by approximately 16.6%. Furthermore, both the cavity depth dcavity/D and the full-flow depth ddeep/D increase with higher ξ95 values. This indicates that the ductility parameter ξ95 also exerts a discernible influence on the penetration mechanisms of the T-bar in soil.
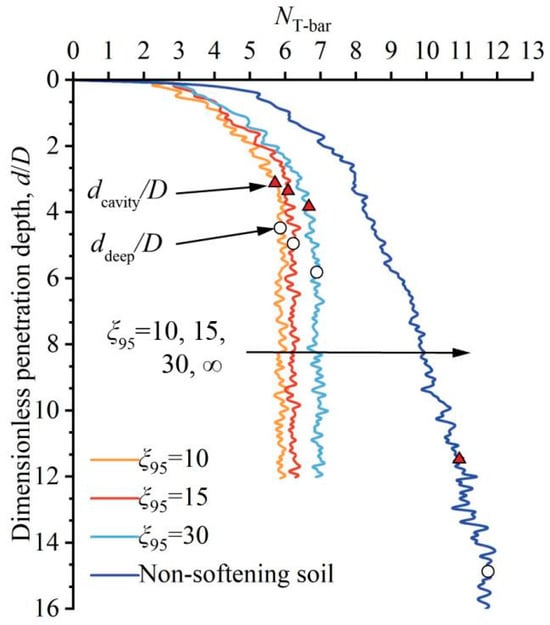
Figure 13.
The bearing factors under different ductility parameters.
3.6. Estimation of the Critical Penetration Depths
In this study, a total of 91 cases with varying su0/γ′D, λ, ξ95, and St were simulated, with specific values summarized in Table 1. The critical penetration depths, namely wcavity and wdeep as defined in Figure 5, of the T-bar were extracted from the calculated results. By performing regression analyses on the data, best-fits can be obtained by Equation (6) for wcavity and Equation (7) for wdeep, as shown in Figure 14.
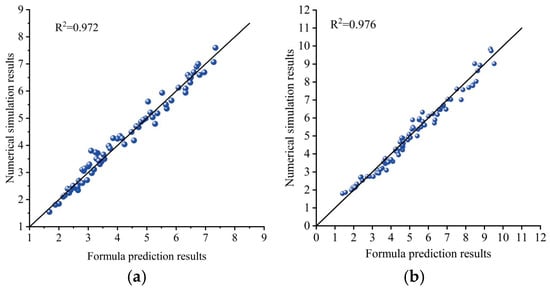
Figure 14.
Formula prediction results versus numerical simulation results. (a) wcavity; (b) wdeep.
3.7. Estimation of the Softening Correction Factor βsT
The intact undrained strength su0 obtained from T-bar tests is usually calculated as the ratio of the net penetration resistance qnet to the deep bearing factor NT,deep, as shown in Equation (8):
where NT,deep is deep bearing factor of non-softening soil, which can be calculated by Equation (5) and normally taken as 10.5.
After incorporating the soil strain-softening effect, a strain-softening correction factor βsT is adopted to quantify the degree of strain-softening during the first penetration process of the T-bar. su0 herein needs to be estimated by Equation (9):
where NT,deep,s is deep bearing factor of strain-softening soil; βsT is the softening correction factor during the first penetration. In accordance with the recommendations of the authors [1,12] and incorporating the enhanced strain-softening model adopted in the present study, the softening correction factor can be expressed as
where ξT-bar is accumulated plastic strain during the first penetration of the T-bar.
The deep penetration resistances, Fs, for various softening parameter combinations (Group V, Table 1) were determined using CEL large deformation finite element analyses. Based on Equation (11), the corresponding softening correction factors were calculated and are illustrated in Figure 15.
where F0 is the deep penetration resistance of non-softening soil.
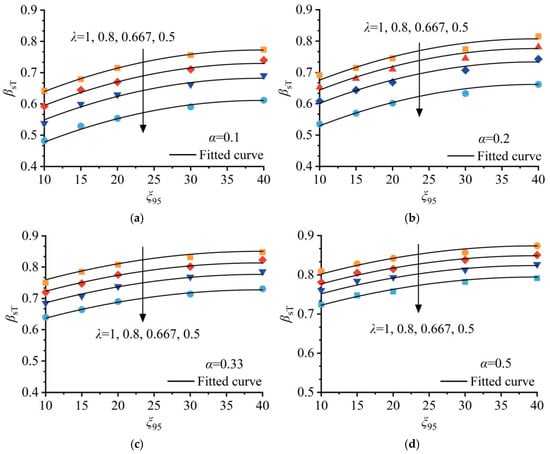
Figure 15.
Calculated βsT with different strain softening parameters. (a) α = 0.1; (b) α = 0.2; (c) α = 0.33; (d) α = 0.5.
It can be seen from Figure 15 that βsT decreases with the decrease in λ and ξ95, which signifies the increase in the strain-softening effect. For soil with high sensitivity, such as δrem = 0.1 (i.e., St = 10) and ξ95 = 10, shown in Figure 15b, the values of βsT for λ = 0.5 and 0.667 are 0.48 and 0.54, respectively, which implies the net penetration resistance is only about fifty percent of that in non-softening soil. Therefore, the strain-softening effect that occurs during the first penetration process should be considered when interpreting the undrained shear strength of clay.
The softening correction factor βsT can be characterized by Equation (10). The fitted values of average accumulated plastic strain ξT-bar for different α (= δrem) and λ are listed in Table 2 and plotted in Figure 16.

Table 2.
Average accumulated plastic strain ξT-bar.
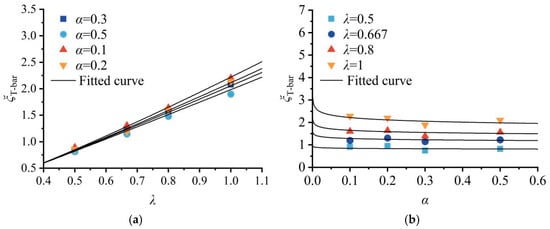
Figure 16.
Effect of α and λ on the average accumulative plastic strain. (a) ξT-bar versus λ; (b) ξT-bar versus α.
By substituting Equation (12) into Equation (10), the relationship of the softening correction factor βsT with respect to δrem, λ, and the ductility parameter ξ95 can be obtained, as given in Equation (13).
It can be observed from Figure 15 that the fitted curves from Equation (13) give a reasonably accurate estimation for βsT. Therefore, the strain softening effect during the initial penetration of the T-bar in clay can be determined through Equation (13).
3.8. Estimation of the Shallow Bearing Factor
Following the recommendation of the author [13], both the bearing factor NT,shallow and the penetration depth w were normalized by their respective reference values, i.e., NT,shallow by the deep bearing factor NT,deep,s and w by the full-flow depth wdeep. This yields the NT,shallow/NT,deep,s∼w/wdeep relationships presented in Figure 17.
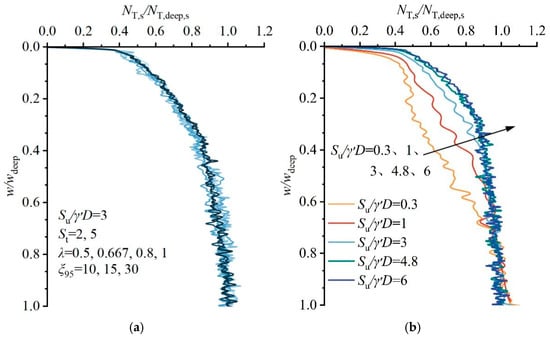
Figure 17.
Normalized bearing factors versus normalized penetration depths. (a) Effect of strain-softening parameters; (b) effect of dimensionless strengths.
It is seen from Figure 17a that when su/γ′D remains constant, the NT,shallow/NT,deep,s∼w/wdeep curves essentially coincide under different strain-softening parameters. The normalized bearing factor progressively increases to unity with normalized penetration depth w/wdeep. In contrast, Figure 17b demonstrates that the normalized bearing factor NT,shallow/NT,deep,s is associated with the dimensionless strength su/γ′D and the normalized depth w/wdeep, which can be expressed by Equation (14).
where n is a fitting parameter, and n = 0.63(su/γ′D)0.28.
The predictions from Equation (14) were compared with numerical simulation results under various conditions, as shown in Figure 18. Figure 18 demonstrates good agreement between the predicted values and the simulation results. This confirms that Equation (14) can be used to predict the shallow bearing factor NT,shallow.
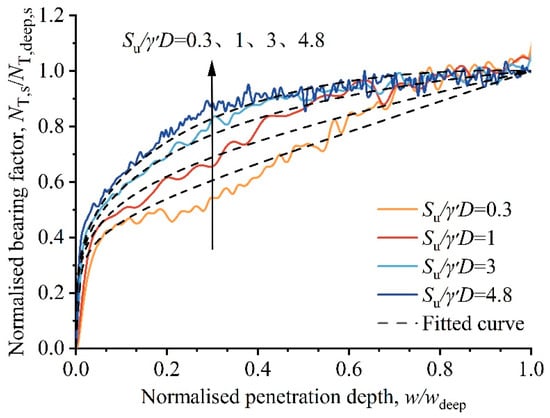
Figure 18.
Comparison of formula prediction results and numerical simulation results.
4. Back-Analysis Procedure for Estimating Soil Strength Parameters
In this section, a back-analysis procedure is developed for determining the undrained shear strength and strain-softening parameters of soils from shallow to deep embedment depths. The reliability of this procedure is subsequently validated through interpreting the numerical test results presented in this study.
4.1. Framework for Back-Analysis Procedure
Based on the back-analysis framework [13], the intact undrained strength and strain- softening parameters can be determined using the proposed formulations from preceding sections. The framework operates through an iterative procedure: Initial soil parameters (i.e., su0, ξ95, St, and λ) are assumed, and the T-bar penetration resistance profile versus depth is calculated using these formulations. If the deviation between the calculated profile and the experimental/field-measured curve exceeds a user-defined tolerance threshold, soil parameters are updated via a global optimization process using a genetic algorithm. This iterative scheme continues until convergence is achieved, at which point the optimized parameters represent the actual soil properties. The workflow of this back-analysis procedure is schematically depicted in Figure 19.
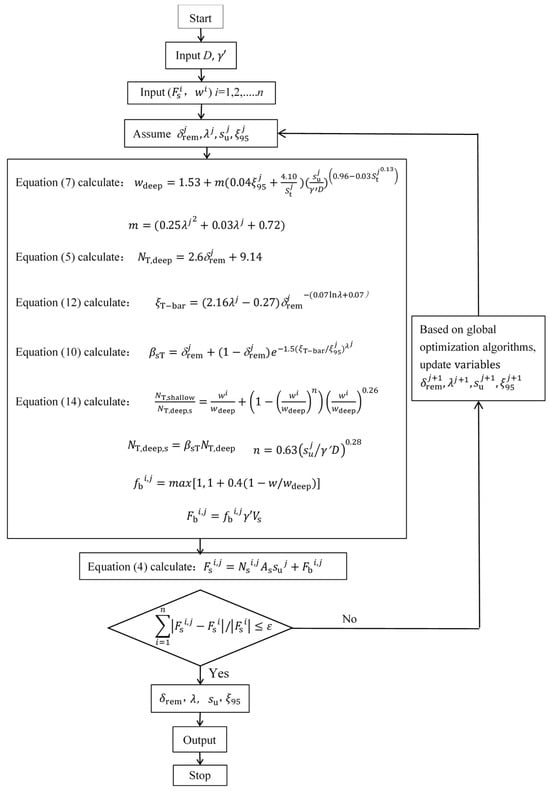
Figure 19.
Back-analysis procedure of estimating strength parameters from measurements of T-bar.
4.2. Validation of the Back-Analysis Procedure
In this section, two sets of numerical tests conducted in this study are employed to verify the reliability of the back-analysis procedure. Following the framework of the back analysis procedure outlined in Figure 19, the Fs ~ d/D curve obtained from the numerical tests is discretized and input into the back analysis program. Subsequently, the optimal soil parameters are identified using a global optimization algorithm. The back-analyzed soil parameters (i.e., su0, ξ95, St, and λ) are compared with those initially input into the numerical tests, as summarized in Table 3. In Table 3, the bracketed values correspond to the original input parameters specified in the numerical test cases. The comparison reveals reasonable agreement between the back-analyzed strength parameters and the input values used in the numerical analyses, which validates the reliability of the proposed back analysis framework.

Table 3.
Example validation of the back-analysis procedure.
Figure 20 compares the Fs ~ d/D curves obtained from the numerical tests with those derived using the optimal parameters identified by the back analysis procedure. It can be seen that the Fs ~ d/D curves generated based on the back-analyzed results exhibit considerable consistency with the numerical test results. This further demonstrates the effectiveness of the back analysis framework in reproducing the penetration resistance profile captured by the numerical tests.
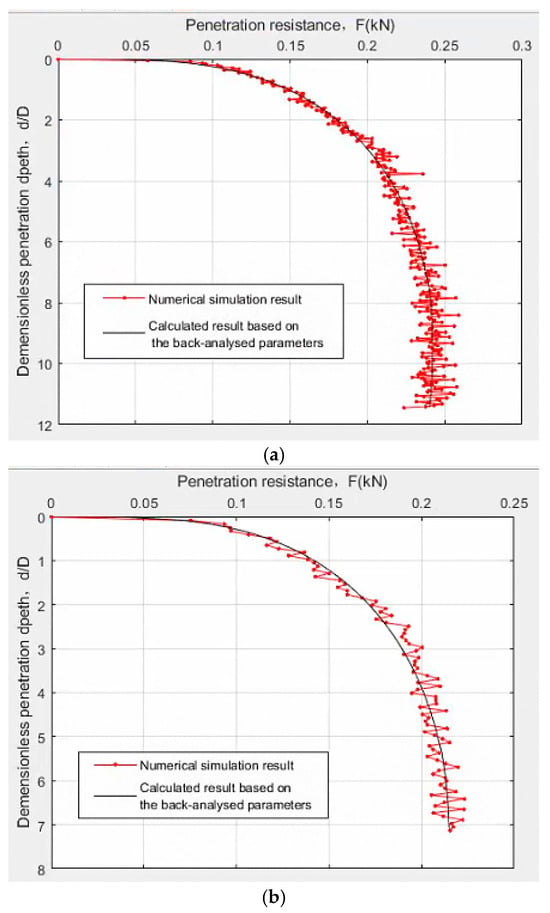
Figure 20.
Comparison of CEL analyses results and back-analyzed results of T-bar. (a) Case 1; (b) case 2.
To demonstrate the necessity of accounting for shallow penetration correction for bearing factors and strain-softening effects in soil parameter estimation, the back-analyzed soil parameters were used to determine the T-bar bearing factors and undrained shear strengths under various scenarios, as illustrated in Figure 21 and Figure 22. In the figures, NT,correct and NT,s represent the bearing factors both incorporating shallow penetration correction but without and with strain softening, respectively. Here, NT,correct is derived by assuming that the shallow bearing factor (without strain softening) also follows Equation (14), expressed as
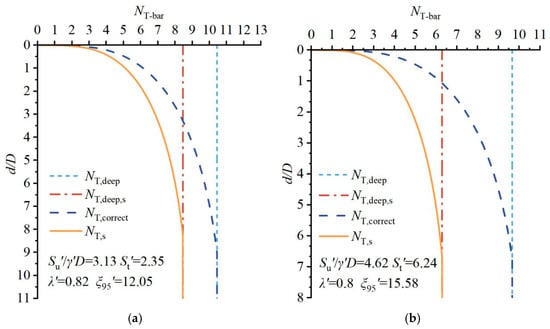
Figure 21.
Bearing factor versus dimensionless penetration depth. (a) Case 1; (b) case 2.
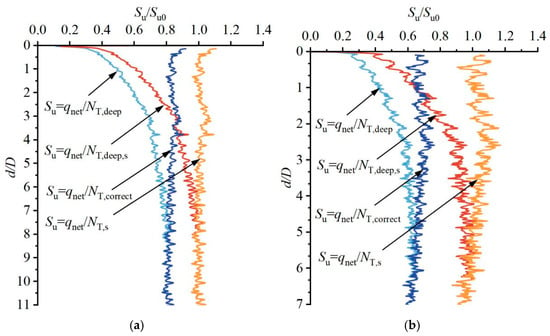
Figure 22.
Estimated undrained shear strength versus dimensionless penetration depth. (a) Case 1; (b) case 2.
Figure 21 presents the bearing factors for each case, while Figure 22 shows the corresponding back-calculated undrained shear strengths. The analysis reveals that (1) conventional practice, which estimates the initial undrained strength using a constant NT,deep (ignoring both strain softening and shallow penetration correction), severely underestimates the initial soil strength; (2) the method using constant NT,deep,s (i.e., incorporating strain softening but omitting shallow penetration correction) underestimates the initial undrained strength in shallow zones, but at penetration depths w > wdeep, the interpreted strength closely matches the actual value (i.e., the input strength of the numerical test); (3) when applying shallow penetration correction without strain softening, the interpretation via the NT,correct ∼ w relationship yields a nearly constant interpreted undrained strength with depth, and while this distribution aligns with the homogeneous clay assumption in the numerical test, it exhibits an error of 20–30% relative to the actual value; and (4) when both strain softening and shallow penetration correction are considered using the proposed back analysis program, the interpreted initial undrained strength remains essentially constant with depth. Moreover, the ratio su/su0, where su is the interpreted strength and su0 the input value of the numerical test, is close to unity. This confirms that the procedure can accurately predict soil strength parameters and serve as a reliable reference for preliminary design in offshore geotechnical engineering.
4.3. Application of the Back-Analysis Procedure
The back-analysis procedure developed in this study was applied to interpret the soil parameters corresponding to the numerical test cases presented in Table 4. The input parameters for each numerical test case are listed in the second column of Table 4 in the order of su/γ′D-St-λ-ξ95. The back-analyzed parameters su/γ′D, St, λ, and ξ95 are also shown in Table 4 for comparison. The comparison reveals generally good agreement between interpreted and input values. Specifically, the dimensionless strength su/γ′D shows minor discrepancies, with a maximum error of 8%. For other parameters, larger errors occur in specific cases but remain within acceptable limits: St reaches 25% error in Test Case 8, λ exhibits 26% error in Test Case 13, and ξ95 shows 31% error in Test Case 9. These errors may be attributed to significant oscillations in the penetration resistance curve derived from numerical experiments under those specific conditions. These oscillations adversely reduced the accuracy of the optimization algorithm. However, generally, the accuracy of the back-analysis procedure satisfies preliminary engineering design requirements.

Table 4.
Comparison of input and back-analyzed parameters.
5. Conclusions
This study employed large-deformation finite element (LDFE) analysis to simulate the entire penetration process of a T-bar from shallow to deep embedment below the mudline. The innovation of the analysis lies in implementing an enhanced exponential strain-softening model, which is an extension of the widely adopted conventional model, to characterize clay behavior. Parametric studies were undertaken to investigate the effects of key factors on the resistance factor and failure mechanism during T-bar penetration. These factors include the dimensionless strength, sensitivity, ductility parameter, and slope parameter. The findings are summarized as follows.
- (1)
- The slope parameter λ exerts considerable influence on the T-bar resistance factors and failure mechanisms. As λ decreases, the disturbed zone of the soil during T-bar penetration expands significantly, and correspondingly, the penetration resistance decreases;
- (2)
- Empirical formulas are established to estimate the critical penetration depths, accounting for the effects of the dimensionless strength and strain-softening parameters;
- (3)
- A back-analysis procedure is developed to estimate strength parameters by using resistance profiles from initial T-bar penetration tests in marine clay. The reliability of this procedure is validated through a series of numerical tests.
The back-analysis procedure developed in this study can be applied to interpret T-bar in situ test results in soft marine clay, thereby deriving the strength and strain-softening parameters of the clay. These parameters can be used to evaluate the bearing capacity of subsea foundations. Moreover, they also enable the determination of critical penetration depths, which in turn identify suitable depth ranges for cyclic T-bar testing.
Author Contributions
Conceptualization, Q.F. and Z.L.; methodology, Q.F.; validation, Q.F., Z.L. and M.S.; investigation, Q.F. and R.Y.; resources, Y.H.; writing—original draft preparation, Q.F., Z.L. and M.S.; writing—review and editing, Q.F.; visualization, R.Y. All authors have read and agreed to the published version of the manuscript.
Funding
This research was funded by the Natural Science Foundation of Shandong Province (grant number ZR2019MEE010); Yantai Science and Technology Innovation Development Plan (grant number 2021XDHZ071); and the Innovation Project for Graduate Students of Ludong University (grant number IPGS2025-070).
Data Availability Statement
Data are contained within the article.
Conflicts of Interest
The authors declare no conflicts of interest.
Nomenclature
| su0, su | Intact and current undrained shear strength of clay |
| ξ | Accumulated plastic shear strain |
| ξ95 | The specific value of ξ for the clay to undergo 95% remolding |
| ξT-bar | Accumulated plastic strain during the first penetration of T-bar |
| δrem | Strength ratio of clay between the fully remolded and intact state |
| St | Soil sensitivity |
| λ | Slope parameter of the enhanced strain-softening model |
| qin, qext | Net resistance in the initial penetration and first extraction phase |
| qrem | Net resistance in the fully remolded state |
| E | Young’s modulus |
| v | Poisson’s ratio |
| μ | Coulomb friction coefficient |
| α | Roughness factor |
| τmax | Limiting shear stress on the interface |
| K0 | Coefficient of lateral earth pressure |
| γ′ | Submerged unit weight of clay |
| D, L | Diameter and length of the T-bar |
| A | Cross-sectional area of the T-bar |
| F, Fnet | Total and net penetration resistance of T-bar |
| Fb | Buoyant force |
| F0, Fs | Deep penetration resistance without and with effects of strain softening |
| d, w | Penetration depth and normalized penetration depth |
| dcavity, wcavity | Trapped cavity depth and normalized trapped cavity depth |
| ddeep, wdeep | Full-flow depth and normalized full-flow depth |
| NT-bar | T-bar bearing factor |
| NT,deep, NT,deep,s | Deep bearing factor without and with effects of strain softening |
| NT,shallow | Shallow bearing factor considering strain softening |
| NT,correct | Shallow bearing factor of non-softening clay |
| NT,s | T-bar bearing factor of strain-softening soil |
| βsT | Softening correction factor |
| n | Fitting parameter |
References
- Einav, I.; Randolph, M.F. Combining upper bound and strain path methods for evaluating penetration resistance. Int. J. Numer. Methods Eng. 2005, 63, 1991–2016. [Google Scholar] [CrossRef]
- Pinkert, S.; Klar, A. Enhanced Strain-Softening Model from Cyclic Full-Flow Penetration Tests. J. Geotech. Geoenviron. Eng. 2016, 142, 04015087. [Google Scholar] [CrossRef]
- Han, Y.; Yang, Q.; Yu, L.; Ren, Y. Optimized strain softening model for marine clay from cyclic full-flow penetration and extraction tests. Ocean Eng. 2020, 218, 108255. [Google Scholar] [CrossRef]
- Randolph, M.F.; Houlsby, G.T. The limiting pressure on a circular pile loaded laterally in cohesive soil. Géotechnique 1984, 34, 613–623. [Google Scholar] [CrossRef]
- Martin, C.M.; Randolph, M.F. Upper-bound analysis of lateral pile capacity in cohesive soil. Géotechnique 2006, 56, 141–145. [Google Scholar] [CrossRef]
- White, D.J.; Gaudin, C.; Boylan, N.; Zhou, H. Interpretation of T-bar penetrometer tests at shallow embedment and in very soft soils. Can. Geotech. J. 2010, 47, 218–229. [Google Scholar] [CrossRef]
- Tho, K.K.; Leung, C.F.; Chow, Y.K.; Palmer, A.C. Deep cavity flow mechanism of pipe penetration in clay. Can. Geotech. J. 2012, 49, 59–69. [Google Scholar] [CrossRef]
- Wang, Y.; Hu, Y.; Hossain, M.S.; Zhou, M. Effect of trapped cavity mechanism on interpretation of T-bar penetrometer data in uniform clay. J. Geotech. Geoenviron. Eng. 2020, 146, 04020078. [Google Scholar] [CrossRef]
- Randolph, M.F.; Andersen, K.H. Numerical Analysis of T-Bar Penetration in Soft Clay. Int. J. Geomech. 2006, 6, 411–420. [Google Scholar] [CrossRef]
- Fan, Q.; Luan, M.; Liu, Z. Numerical simulation of penetration resistance of T-bar penetrometer in soft clay. Rock Soil Mech. 2009, 30, 2850–2854. [Google Scholar] [CrossRef]
- Zhou, H.; Randolph, M.F. Resistance of full-flow penetrometers in rate-dependent and strain-softening clay. Géotechnique 2009, 59, 79–86. [Google Scholar] [CrossRef]
- Liu, J.; Chen, X.; Han, C.; Wang, X. Estimation of intact undrained shear strength of clay using full-flow penetrometers. Comput. Geotech. 2019, 115, 103161. [Google Scholar] [CrossRef]
- Chen, X.; Han, C.; Liu, J.; Hu, Y. Interpreting strength parameters of strain-softening clay from shallow to deep embedment using ball and T-bar penetrometers. Comput. Geotech. 2021, 138, 104331. [Google Scholar] [CrossRef]
- Yafrate, N.J.; DeJong, J.T.; DeGroot, D.J.; Randolph, M.F. Evaluation of remolded shear strength and sensitivity of soft clay using full-flow penetrometers. J. Geotech. Geoenviron. Eng. 2009, 135, 1179–1189. [Google Scholar] [CrossRef]
- Zhou, H.; Randolph, M.F. Numerical investigations into cycling of full-flow penetrometers in soft clay. Géotechnique 2009, 59, 801–812. [Google Scholar] [CrossRef]
- Han, Y.; Yu, L.; Yang, Q. Strain softening parameters estimation of soft clay by T-bar penetrometers. Appl. Ocean Res. 2020, 97, 102094. [Google Scholar] [CrossRef]
- Han, Y.; Yu, L.; Wang, Z.; Yang, Q.; Hu, Y. A novel T-bar test method ensuring full-flow mechanism in stiffer clay. Géotechnique 2024, 74, 1460–1474. [Google Scholar] [CrossRef]
- Han, Y.; Cheng, L.; Yu, L.; Yang, Q.; Ren, Y. Boundary effect on the soil strength estimation from T-bar penetration tests. Appl. Ocean Res. 2024, 150, 104107. [Google Scholar] [CrossRef]
- Tho, K.K.; Leung, C.F.; Chow, Y.K.; Swaddiwudhipong, S. Eulerian Finite-Element Technique for Analysis of Jack-Up Spudcan Penetration. Int. J. Geomech. 2012, 12, 64–73. [Google Scholar] [CrossRef]
- Ke, L.; Gao, Y.; Fei, K.; Gu, Y.; Ji, J. Determination of depth-dependent undrained shear strength of structured marine clays based on large deformation finite element analysis of T-bar penetrations. Comput. Geotech. 2024, 176, 106758. [Google Scholar] [CrossRef]
- Liu, F.; Cheng, P.; Luo, Y.; Yi, J.; Chen, X.; Peng, Y.; Hu, J.; Chu, Y. Large-deformation study of T-bar penetration in spatially variable sediments. Appl. Ocean Res. 2024, 150, 104105. [Google Scholar] [CrossRef]
- Ullah, S.N.; Noor, E.; Khuda, S.; Fook Hou, L.; Suntharavadivel, T.; Albermani, F. Deep Undrained Bearing Capacity of Rectangular Foundations in Uniform Strength Clay. J. Geotech. Geoenviron. Eng. 2020, 146, 04020105. [Google Scholar] [CrossRef]
- Wang, Y.; Hossain, M.S.; Hu, Y. Interpretation of T-Bar Penetration Data in Two-Layer Clays. Int. J. Geomech. 2023, 23, 04023195. [Google Scholar] [CrossRef]
Disclaimer/Publisher’s Note: The statements, opinions and data contained in all publications are solely those of the individual author(s) and contributor(s) and not of MDPI and/or the editor(s). MDPI and/or the editor(s) disclaim responsibility for any injury to people or property resulting from any ideas, methods, instructions or products referred to in the content. |
© 2025 by the authors. Licensee MDPI, Basel, Switzerland. This article is an open access article distributed under the terms and conditions of the Creative Commons Attribution (CC BY) license (https://creativecommons.org/licenses/by/4.0/).