Abstract
Marine risers, critical structures connecting underwater production systems and surface floating platforms, stand freely in water and endure extremely complex marine environmental loads. To meet the multi-parameter observation demand for their overall state, a fiber-optic sensing-based marine riser buoy observation system was developed. Unlike traditional point-type and offline monitoring systems, it integrates marine buoys with sensing submarine cables to achieve long-term real-time online monitoring of risers’ overall state via fiber-optic sensing technology. Comprising two main modules (buoy monitoring module and fiber-optic sensing module), the buoy’s stability was verified through theoretical derivation, simulation, and stability curve plotting. Frequency domain analysis of buoy loads and motion responses, along with calculation of motion response amplitude operators (RAOs) at various incident angles, showed the system avoids wave periods in the South China Sea (no resonance), ensuring structural safety for offshore operations. A 7-day marine test of the prototype was conducted in Yazhou Bay, Hainan Province, to monitor real-time temperature and strain data of the riser in the test sea area. The sensing submarine cable accurately responded to temperature changes at different depths with high stability and precision; using the Frenet-based 3D curve reconstruction algorithm, pipeline shape was inverted from the monitored strain data, enabling real-time pipeline monitoring. During the test, the buoy and fiber-optic sensing module operated stably. This marine test confirms the buoy observation system’s reasonable design parameters and feasible scheme, applicable to temperature and deformation monitoring of marine risers.
1. Introduction
Marine monitoring is critical to understanding the ocean, exploiting marine resources, developing the marine economy, and protecting the marine environment. Substantial advances in physical oceanography depend on innovations in monitoring instruments and detection technologies [1]. Fiber-optic sensing technology, with its unique advantages such as distributed measurement, multi-parameter sensing, and easy installation, has gradually expanded its application in the marine field [2].
China’s marine areas are key bases for oil and gas production and exploration. As essential transport equipment in offshore oil and gas development, marine risers are prone to structural damage and fatigue failure due to complex and variable marine environments and various external loads [3]. Traditional pipeline monitoring technologies are limited by harsh operating conditions, narrow monitoring ranges, and the inability to achieve long-distance online monitoring. Distributed fiber optic sensing (DFOS) [2] overcomes these limitations, with advantages including low loss, long transmission distance, anti-electromagnetic interference, easy installation and maintenance, and operability in harsh environments, enabling effective long-distance distributed monitoring [4]. Fan Xueman proposed using M-Z distributed sensing-based submarine cables for online monitoring of external disturbances, verifying the cable’s early warning function through theoretical calculations [5]; such methods can monitor multiple physical quantities (temperature, vibration, deformation, etc.) via optical signals transmitted in fibers. In pipeline safety monitoring, real-time monitoring of oil and gas pipelines is achieved by deploying optical cables along pipelines to sense strain or vibration signals. Borda C proposed a pipeline monitoring method based on Brillouin optical time domain analysis, which obtained surface strain by attaching three fibers to the outer wall of oil pipelines, then analyzed strain data to complete pipeline deformation monitoring and 3D positioning [6]. Ren Peng simulated marine risers with pipelines, attached four fibers at 90° intervals around the outer wall, extracted surface strain using a 0.5 m resolution distributed fiber demodulator, and achieved pipeline attitude reconstruction with curve reconstruction technology, with relative errors ≤5% [7]. This is critical for pipeline monitoring, providing strong technical support for marine exploration, resource development, and environmental protection.
However, fiber optic sensing technology remains immature in marine environment applications, with multiple issues to address in system design, deployment, and implementation. Developing fiber optic sensors for marine riser monitoring, using marine meteorological and hydrological buoys as carriers for demonstration applications, and integrating fiber optic sensing to achieve multi-parameter high-precision measurement [8] are of great significance for the application of fiber optic sensing in marine environmental monitoring and facility health monitoring.
To meet the application needs of fiber optic sensing technology in marine riser monitoring, designing a marine riser buoy observation system with good stability based on marine data, specifications, and buoy principles is key to conducting long-term continuous fiber optic sensing marine application demonstrations and acquiring riser strain data. On marine buoys, effective fiber optic sensing-based marine pipeline monitoring technologies are lacking, and floating platforms for online real-time pipeline detection with distributed sensors are insufficient. Thus, research on the system design of fiber optic sensing systems in buoy environments is necessary, which must fully consider the uniqueness of buoy environments.
As a key carrier for marine monitoring, buoy stability directly affects the measurement accuracy and reliability of the onboard fiber optic sensing system, thereby influencing the quality of acquired monitoring data. The main methods for buoy stability research include theoretical calculation, numerical simulation, and harbor basin testing [9,10,11], and many scholars have conducted stability studies on ships, platforms, and buoys in the ocean. Le Cunff et al. [9] derived a frequency-domain calculation method to compute the motion amplitude response of CALM (Catenary Anchor Leg Mooring) buoys and verified it through experiments. Venkatesan et al. [12] obtained the stability of cylindrical buoys for Indian Ocean tsunami monitoring via theoretical calculations and validated the reasonable design of the cylindrical buoy and the accuracy of stability theoretical calculations through tests on a scaled-down buoy model in a water tank. Cao [13] used 3D linear potential flow theory, wave diffraction and radiation theory, combined with the hydrodynamic calculation software SESAM, to study buoy motion and mooring system response under different water depths and wave directions, and conducted a series of experimental studies in the ship model test tank of Tianjin University to verify the effectiveness of numerical simulation results.
To address the demand for overall distributed real-time monitoring of marine risers, a marine riser buoy observation system based on fiber optic sensing is proposed. The system consists of two main modules: a buoy monitoring module and a fiber optic sensing module. Based on hydrostatics, referring to ship statics principles [14] and wave theory [15], the buoy’s stability and wave-following performance were calculated to meet the requirements of module integration and offshore buoy monitoring. The calculated stability parameters served as a basis for adjusting the buoy’s center of gravity, center of buoyancy, draft, and other parameters during design. The structural safety of the buoy was verified through hydrodynamic wave-following calculations. In response to the power supply and communication requirements of the fiber-optic sensing system, the power supply, storage, and signal transmission modules were designed and developed. The fiber-optic sensing submarine cable enables real-time monitoring of pipeline strain, temperature, and shape, as well as collection and storage of submarine cable wavelength variation data. Marine tests verified the system’s effectiveness and feasibility for riser monitoring.
2. System Design
The fiber optic sensing submarine cable pipeline intelligent monitoring system design includes two main components: a buoy monitoring system and a fiber optic sensing module (Figure 1). It integrates marine observation equipment and enables dynamic riser dynamic monitoring. The buoy system is equipped with sea surface parameter measuring instruments, has real-time communication functions, and carries a fiber optic demodulation module for demodulating submarine cable data. The fiber optic sensing module uses a self-designed marine optical cable to monitor riser temperature and stress, connected to the riser via clamps and to the buoy’s demodulation equipment through watertight connectors, forming a complete signal transmission link. This configuration establishes a multidisciplinary real-time online system for continuous marine riser monitoring. It is designed to operate at water depths up to 50 m.
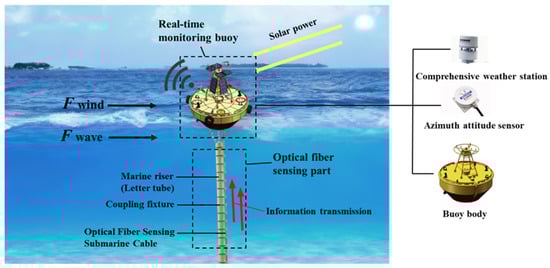
Figure 1.
Schematic Diagram of Marine Riser Buoy Observation System Based on Fiber Optic Sensing.
2.1. Real-Time Monitoring Buoy
The observation buoy is the core component of the marine riser buoy observation system. Serving as the system’s basic operational platform, it supplies power to the equipment and is equipped with instruments for measuring sea surface-related parameters.
The buoy design includes mechanical structures, power supply control devices, and other electrical components. The mechanical structures protect against harsh sea conditions and ensure buoy stability.
Deck outfitting supports components: bollards, lifting lugs, and a cable box linking underwater cables to the cabin. Deck equipment includes meteorological instruments, AIS lights, AIRMAR-220WX weather station, and solar panels (Figure 2). Two symmetric bilge mooring plates serve dual anchoring, with a spare on the bottom plate. The bottom is coated with eco-friendly anti-biofouling paint for corrosion resistance and durability. An anode below the waterline slows corrosion. The interior has an equipment compartment. Its robust structure with upper/lower steel fenders protects against impacts. Four circumferential buoyancy chambers (each rib-reinforced) enhance strength. Counterweights at the compartment bottom adjust buoy weight, keeping the center of gravity stably below the center of buoyancy [16] for stability.
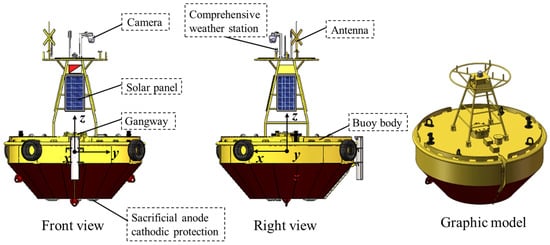
Figure 2.
Schematic Diagram of Real-time Monitoring Buoy Structural Details.
The communication and control system monitors the operational status of various instruments and equipment. Equipped with a 700 M marine CPE device and an RDT300B BeiDou-3 module (Beijing Qixing Weitong Technology Co., Ltd., Beijing, China), it supports 4G/5G network transmission in coastal waters. The buoy, featuring sensor interfaces, can be equipped with instruments for continuous monitoring of sea surface environmental parameters (e.g., wind speed, wind direction, air temperature, and humidity). Additionally, this module has an internal storage capacity of 512 GB, enabling it to capture and store monitoring data and video clips, which are then transmitted to the onshore control center via the buoy’s control box. Data transmission is implemented through the TCP/IP protocol, with an uplink data rate of up to 5 megabits per second (Mbps).
Table 1 presents the buoy’s design parameters. The design ensures a reasonable metacentric height, with its initial metacentric height calculated as follows [17,18]:

Table 1.
Main Design Parameters of the Buoy.
In the formula, is the distance between the buoy’s center of gravity and center of buoyancy [19], is the vertical coordinate of the center of gravity, is the vertical coordinate of the center of buoyancy, and BM is the initial metacentric radius.
and are derived from the above design. Substituting them into the calculation of initial metacentric radius (BM = I/V), where I is the transverse moment of inertia of the submerged wedge volume about the longitudinal axis and V is the buoy’s displacement volume, the buoy’s metacentric radius is obtained as 2.838 m. Substituting this into Equation (1) yields an initial metacentric height of 2.618 m. According to the Classification Code for Offshore Mobile Platforms [20], the initial metacentric height requirement for marine floating structures’ initial stability is no less than 0.15 m, and the designed buoy’s value is far greater than this specification [17,21].
Stability criterion verification is crucial for ensuring the safe and stable operation of the buoy, with restoring moment and wind-heeling moment playing core roles in this process. In ship design and navigation, the balance between restoring moment and wind-heeling moment must be considered [22].
Restoring moment refers to the moment that enables floating bodies such as ships to return to their initial equilibrium position when tilted by external forces. For floating bodies like ships, the restoring moment can usually be calculated using the moment formed by gravity and buoyancy. Assuming the distance between the center of buoyancy and the center of gravity is d, the magnitudes of gravity and buoyancy are W and F, respectively, and the heel angle is , under the condition of small-angle tilt:
Here, is the drainage volume, is the initial stability height and represents the angle at which the buoy is tilted in the horizontal direction.
Wind-heeling moment refers to the moment caused by wind force on a floating body that tends to tilt the body. The wind-heeling moment is usually determined by factors such as wind pressure, wind-receiving area, and moment arm. Its calculation formula is:
where is the wind pressure, is the wind area, is the force arm, and represents the angle at which the buoy is tilted in the horizontal direction. The wind pressure can be calculated by specific formula or empirical formula according to parameters such as wind speed.
The intact stability of the buoy is determined by calculating parameters such as the area between different intersection points of the restoring moment and wind-heeling moment curves, and the integral of the restoring moment from the origin to a specific point (as shown in Figure 3a), following the criterion (A + B)/(B + C) > 1.4. Here, A is the area between the first and second intersection points of the two curves; B is the integral of the restoring moment from the origin to the second intersection point minus A; C is the area between the origin and the first intersection point of the two curves. Figure 3b presents the simulated moment curves of the 3.8 m buoy, with calculated values: A = 10,288.86 , B = 16,457.91 , C = 133.63 . Substituting these gives (A + B)/(B + C) = 1.612 > 1.4. Combined with other stability verification items for the buoy in Table 2, the 3.8 m buoy meets the intact stability criterion (Figure 4).
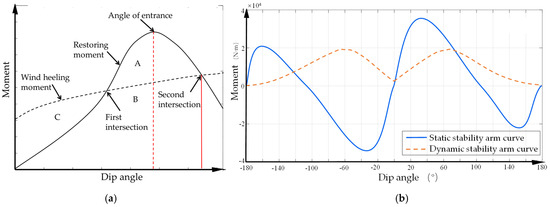
Figure 3.
(a) Schematic Diagram of Stability Criterion (b) Simulated Curves of Restoring Moment and Wind-heeling Moment.
Table 2.
Other stability check contents.
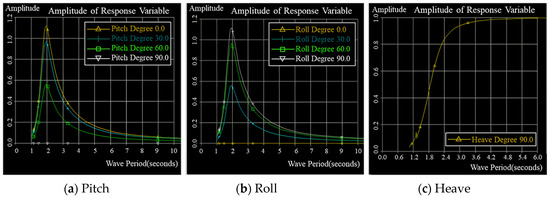
Figure 4.
Wave Periods Corresponding to Various Incident Angles for RAO Peaks of Buoy’s Pitch, Roll and Heave.
Following the structural design and stability analysis of the buoy, hydrodynamic analysis is required. When operating at sea, the buoy is primarily affected by six degrees of freedom: surge, sway, heave, roll, pitch, and yaw. Among these, roll and heave have the most significant impacts on stability and safety and thus require focused analysis [16]. Considering only wave action, calculations can determine the motion frequency response of the buoy in linear regular waves, revealing its motion performance [23]. Based on the three-dimensional potential flow theory, the DeepC module of SESAM (version 2018) software was used to calculate the wave loads on the buoy under random waves. First, a scaled model of the 3.8 m buoy was constructed, and a wet surface model was established according to the waterline, center of mass, and center of buoyancy. The center of gravity coordinates are X = 0 m, Y = 0 m, Z = −0.11 m (below the waterline), with a metacentric height of 2.618 m. The model was then meshed with a grid size of 0.1 mm and imported into the HydroD module for hydrodynamic analysis. Due to the symmetric structure of the disk-shaped buoy, wave directions were set from 0° to 90° at 30° intervals, and wave frequencies from 0 rad/s to 4 rad/s at 0.2 rad/s intervals. Within the frequency domain, the motion response amplitude operator (RAO) curves of the buoy under regular wave loads with different directions and frequencies were obtained.
From the calculation results, the pitch motion of the buoy shows the maximum amplitude change at 1.904 s when RAO is calculated for various incident angles, so the pitch period of the 3.8 m buoy can be considered as 1.904 s. The heave, roll, and pitch periods of the 3.8 m buoy are all within 3 s, avoiding the wave period range of 3–12 s in the South China Sea, so resonance between waves and the buoy will not occur. In conclusion, the structural simulation results confirm that the designed buoy structure meets the strength design requirements for marine structures.
2.2. Fiber Optic Sensing Module
Figure 5 shows the schematic diagram of the optical setup for the proposed monitoring system. The optical path connection includes fiber optic sensing submarine cables, watertight connectors, fiber Bragg grating (FBG) demodulators, and distributed temperature sensing (DTS). The submarine cable is connected to the pipeline via coupling clamps, and one end of the optical cable is installed in the cable trough reserved on the upper side of the buoy. It is then connected to the connector through an optical fiber adapter, which is placed on the deck. The connector is further connected to the FBG array demodulator and DTS in the equipment cabin through the slot designed on the deck, forming a complete sensing and monitoring optical path.
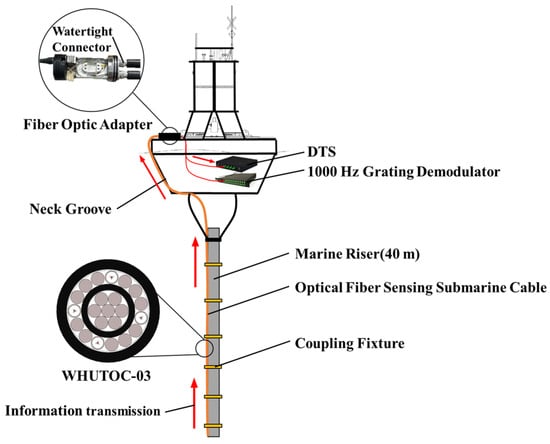
Figure 5.
Schematic Diagram of the Optical Setup of the Monitoring System.
The connector used in this test is a customized 16-core watertight model, which enables the connection of the 16-core sensing optical cable required for the sea trial platform’s instrument cabin (both internal and external). A transfer cabin is designed on the floating platform to link the on-site sensing optical cable with the connector, whose structural schematic is shown in Figure 6. After integrated laboratory testing, the connector allows quick connection between the equipment cabin and the on-site sensing optical cable. It also features longitudinal water-blocking capability to ensure the instrument cabin’s safety during long-term testing. The connector’s performance parameters are presented in Table 3.
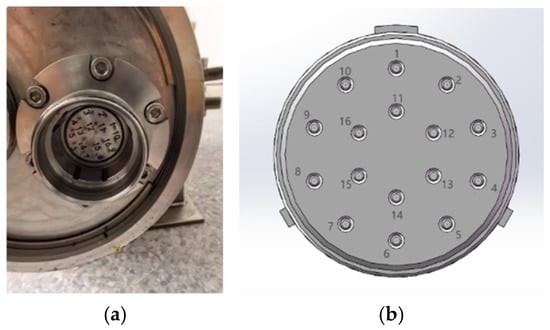
Figure 6.
Connector (a) Physical Diagram (b) Structural Schematic Diagram.
Table 3.
Performance Parameters of the Connector.
The sensing submarine cable uses the WHUTOC-03 model (Changfei (Jiangsu) Marine Technology Co., Ltd., Yangzhou, China), with a total length of 70 m. The cross-sectional layout of the cable is shown in Figure 7. It consists of two sheaths: the inner sheath is made of High-Density Polyethylene (HDPE) with a thickness of 1.1 mm, and the outer sheath is made of TPU with a thickness of 1.8 mm. The inner core is a galvanized steel wire, providing core support and mechanical strength for the cable. In the middle interlayer, 12 galvanized steel wires (outer diameter: 2.1 mm) and 4 micro-strain optical units (outer diameter: 2.0 mm) are spirally stranded to enhance the overall mechanical performance of the cable. The entire submarine cable comprises 4 optical units. Each unit uses one single-mode fiber and three FBG arrays—fabricated on the single-mode fiber—with 10 gratings per array and 1.5 m inter-grating spacing. Each FBG array has a 15 m sensing segment, which is separately arranged via submarine cable processing technology, resulting in a total of 4 × 3 × 10 = 120 FBGs and an overall sensing length of 45 m for the cable. The single-mode fiber serves as the temperature sensing unit for the DTS system, and the FBG arrays act as strain and temperature sensing units.
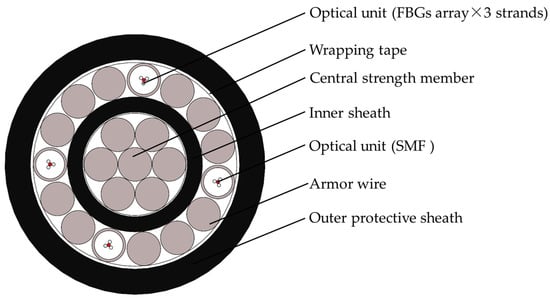
Figure 7.
Cross-Sectional Structure of WHUTOC-03 Sensing Submarine Cable.
A steel tube is used as optical unit casing, and fiber paste is filled inside to improve water-blocking and hydrogen damage resistance. The total outer diameter of this structured cable is 17.1 mm. The performance parameters of the cable are shown in Table 4.
Table 4.
Properties of the Fiber Optic Sensing Submarine Cable.
The FBG demodulator is a 16-channel, 1000 Hz device with a wavelength range of 40 nm (1525~1565 nm) and a resolution of 1 pm, meeting the demodulation requirements for 120 sensors and 1000 Hz in marine environments.
The DTS uses the DSC-DTS3K-8C model, which has 4 channels with a maximum monitoring distance of 3 km per channel, a resolution of 0.1 °C, and a temperature measurement range of −40 °C to 120 °C. To meet the requirement of long-term operation of the equipment in marine environments, the original 220 V power module of the device has been modified to use 12 V DC power supply.
2.3. Power Consumption of the Buoy Intelligent Monitoring System
The marine riser buoy observation system based on fiber optic sensing integrates a buoy subsystem and a series of components, with a total daily power consumption of 1457 Wh for these components. The main power-consuming devices in the buoy include azimuth sensors, AIS navigation lights, integrated weather stations, wave sensors, data loggers, alarm systems, data transmission modules, and fiber optic demodulation modules. For detailed power consumption of each component, refer to Table 5.
Table 5.
Summary of Power Consumption of Hardware/Instruments.
The internal power supply system of the buoy consists of solar panels, a battery pack, and a charging control module. The battery adopts a large-capacity maintenance-free battery, which supplies power to buoy equipment with a 12 V output voltage; the solar panels charge the battery, ensuring the buoy’s power system can continuously supply power to the buoy equipment for a long time; the charge controller is mainly used to control the charging and discharging of the battery, preventing severe battery depletion or overcharging, and also has voltage and current abnormality protection functions.
The total sunshine hours are obtained from test data. According to the China Solar Energy Resource Distribution Table [24] and combined with the meteorological data of the deployment area, the deployment area belongs to the third category, with an average annual total sunshine hours of approximately T = 2400 h, i.e., the daily sunshine duration is calculated as: H = 2400/365 ≈ 6.03 (h/d). Based on the power consumption of the buoy system and the sunshine duration in the sea area where the buoy is deployed, the required battery capacity and total output power of solar panels for the buoy system are calculated under the condition of 10 consecutive cloudy and rainy days. The calculation uses 8 pieces of 200 AH, 12 VDC storage batteries and 4 pieces of 150 W solar panels. The storage batteries are used in series. Typically, they can only be discharged to 70% (to avoid damage from over-discharging), so the available capacity is 200 AH × 12 V × 8 × 0.7 = 13,440 Wh. For the solar panels (each with an area of 0.5 square meters), their power generation efficiency on cloudy/rainy days is calculated at 20% of standard illumination, with 5 h of daily effective illumination. Thus, the daily power generation is approximately 2 × 4 × 150 W × 5 h × 0.2 = 1200 Wh. The power supply system can sustain the operation of equipment on the buoy for 52 days.
3. Experimental Research
This buoy is deployed in the South China Sea, at the coordinates (18.1° N, 108.7° E), in an area with a water depth of approximately 50 m. It is an observation buoy designed to collect marine meteorological and hydrological data, capable of regularly providing parameters such as air temperature, air pressure, relative humidity, wind speed, wind direction, wave height, wave direction, wave period, ocean current speed, and ocean current direction. These data enhance the monitoring and early warning capabilities for sea conditions and climate changes in the South China Sea. The environmental conditions are as follows: seawater temperature ranges from 15 °C to 30 °C; seawater depth ranges from 50 m to 60 m; during the test period, the maximum tidal fluctuation does not exceed 2 m, and the maximum wind force does not exceed Beaufort Scale 8. The distance to the deployment site is approximately 25 nautical miles, and the expected towing speed of the buoy is 5 knots, resulting in a travel time of about 5 h to the sea test location (Figure 8).
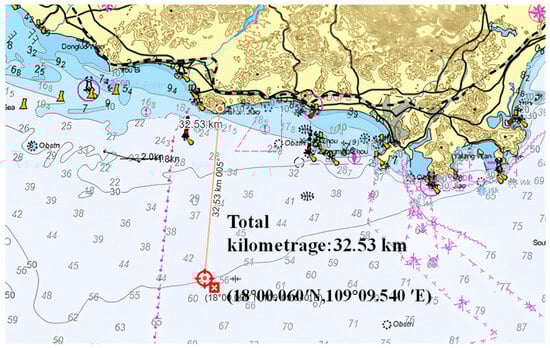
Figure 8.
Sea Test Deployment Location.
In June 2025, pre-voyage preparations and riser hoisting were conducted at Sanya Nanshan Port. The system was installed on the test vessel, and commissioning of the sensing submarine cable-riser system was completed. On 22 June, the vessel arrived at the target sea area, and the buoy system was deployed the next day. From 23 June to 30 June 2025, the marine riser buoy observation system recorded environmental data at the sea trial location and marine riser data over a period of approximately 7 days.
During the deployment process, the installation and commissioning of the buoy monitoring system were first completed at the dock. The catenary riser was manufactured in sections, connected via flanges and bolts, and assembled at the dock. One end was linked to the lifting lugs at the bottom of the buoy through steel catenaries. The submarine cable and riser were installed and prepared using clamps according to the aforementioned steps, with the cable connected to the buoy. The riser was positioned on one side of the vessel using mechanical devices. Considering the limited lifting capacity of the vessel, the buoy was placed on the sea surface behind the vessel using a dock tower crane, then towed to the target sea area via the stern lifting frame (A-frame). During this process, the vessel’s speed needed to be controlled to prevent the buoy from capsizing into the sea. Upon reaching the target sea area, the first winch at the bow end slowly lowered the cable. After a period of lowering, the adjacent second winch began lowering its cable, with subsequent winches following in sequence according to their arrangement. During this process, the riser was monitored in real-time using the submarine cable, and the stress on the riser was closely observed to prevent damage caused by combined external loads. Once the riser was fully submerged in the sea, the buoy was hoisted onto the sea surface, and the mooring buoys were also deployed, completing the system deployment. The system deployment is shown in Figure 9.
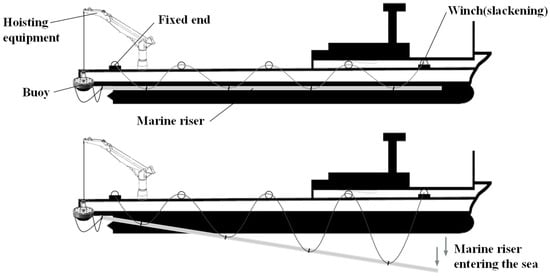
Figure 9.
Schematic Diagram of System Deployment.
All system components operated stably during deployment. After deployment, the fiber-optic submarine cable buoy monitoring system continued on-site operation, and no failures or data anomalies occurred over 168 h of monitoring. In summary, the system underwent rigorous testing under complex marine conditions, successfully recording the buoy’s response to wave-induced motion and the riser’s temperature-depth changes (Figure 10). The relevant results will be elaborated in detail in the next chapter.
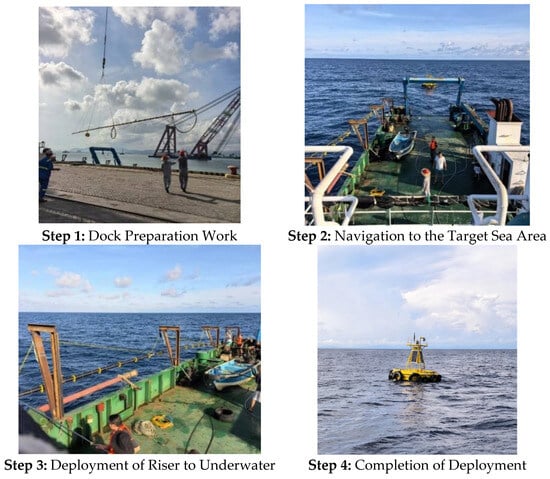
Figure 10.
System Deployment Process.
4. Analysis of Riser Monitoring Test Data via Fiber-Optic Sensing Submarine Cable
A sensing submarine cable-riser monitoring system was deployed in the waters near Yazhou Bay, Hainan Province. Based on a strain sensing submarine cable integrated with a DTS system and FBGs arrays, a 3D comprehensive observation platform for marine risers was constructed to achieve real-time monitoring of riser temperature, strain, and shape. The establishment of this system enables real-time full-domain and multi-parameter monitoring capability for marine risers, providing real-time data support for process monitoring in offshore oil and gas extraction.
4.1. Experimental Sea Area Environment
The water depth in the test sea area for the riser and sensing submarine cable coupling monitoring system is approximately 50 m. Specifically, under sea states 2~3, the dominant waves are swells with a significant wave height of 0.2~0.4 m and a period of around 5 s; under sea states 3~4, the main swells have a significant wave height of 0.7~1.1 m and a period of 5~6 s; under sea states 5~6, the primary swells feature a significant wave height of 1.2~2.5 m and a period of 6~8 s. Sea conditions from 22 June to 30 June were observed via buoy weather. According to the data provided in Figure 11, it is evident that sea state 3 prevailed from 22 June to 23 June, sea state 2 from 24 June to 25 June. Overall, the sea conditions met the requirements for the sea trial, being favorable enough to satisfy the conditions for deployment and long-term testing.
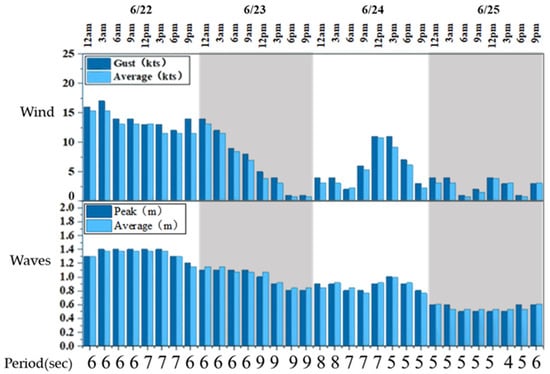
Figure 11.
Sea Condition Information During the Sea Trial.
The vertical velocity profile along the water depth in the test area during the sea trial is shown in Figure 12. The measured current velocity near the sea surface is relatively small, mainly ranging from 0.1 m/s to 0.5 m/s. The Reynolds number corresponding to the riser model in this sea area is close to that in the numerical simulation of this study, which can meet the required marine wave and current environmental conditions for the sea trial.
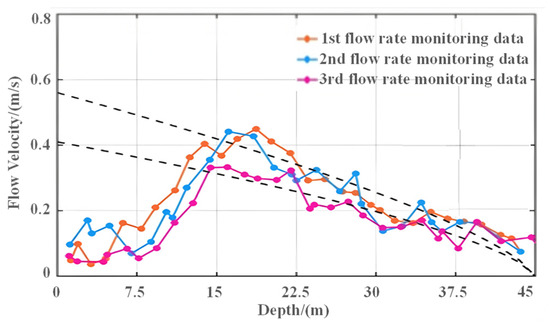
Figure 12.
Current Velocity Distribution in the Test Sea Area.
4.2. Temperature Variations Monitored by the System at Different Ocean Depths
In this section, the temperature gradient and change rate of the temperature sensing in the submarine cable at different ocean depths are studied, verifying its feasibility and accuracy in the engineering environment. To investigate these variations, single-mode fibers in the optical unit of the submarine cable are used in conjunction with the DTS temperature measurement system to measure the temperature at different positions of the submarine cable.
Figure 13 shows the variation in riser temperature with time and distance monitored by the DTS system in the riser and sensing submarine cable monitoring system. It is a waterfall plot generated by accumulating DTS-measured temperature data in chronological order and taking the average value. During the sea trial, the maximum daily ambient temperature was 31~34 °C. The temperature of the underwater section at approximately 40 m depth was recorded, ranging from 20 °C to 30 °C. The distance coordinate refers to the axial distance of the pipeline, and the X-coordinate data represents the distance from the riser end. As can be seen from the figure, the temperature is generally negatively correlated with the depth below the sea surface, decreasing as the depth increases, which is consistent with the characteristics of the vertical temperature gradient. Some temperature data distortion occurs in the figure, caused by the riser being in a suspended state under the sea surface and subject to alternating loads such as waves. However, the overall temperature-depth error is within the experimentally acceptable range. Through debugging, it can be observed that the DTS system operates normally and can effectively capture the diurnal temperature changes in the underwater section.
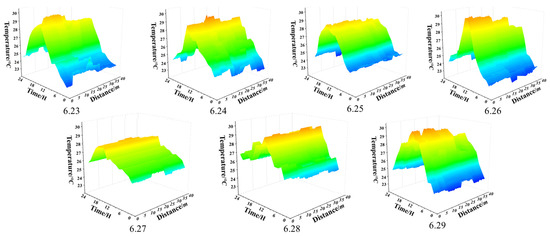
Figure 13.
Temperature Variation in the DTS System at Different Monitoring Time Intervals.
To reflect the accurate variation characteristics of the actual ambient temperature and verify the reliability and effectiveness of the measured signals, data from the second-channel sensor was continuously collected for 1000 s starting at 7:00 on 27 June. Figure 14a shows the temperature variation in the riser during the collection period, calculated from continuously acquired data at a position approximately 4.5 m below the water surface. Within the observation period, the temperature measured by this sensor ranged from 27.6 °C to 28.7 °C, with an overall variation trend highly consistent with that of the ambient temperature during the same period. Figure 14b presents the relationship between riser temperature and depth, calculated from data collected from three channels at the same moment when the sea surface temperature was 28.1 °C. As it can be seen from the figure, the temperature changed gently within the water depth range of 0–25 m, with a small overall fluctuation amplitude. When the water depth exceeded 25 m, the temperature showed an obvious downward trend with increasing depth, with a variation rate of approximately 0.1 °C/m. At a water depth of 40 m, the temperature was about 2 °C lower than the sea surface temperature, reflecting significant characteristics of the vertical temperature gradient.
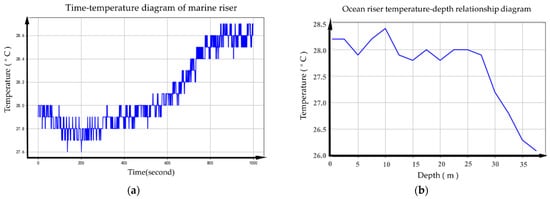
Figure 14.
(a) Riser Temperature-Time Diagram (b) Riser Temperature-Depth Relationship Diagram.
In the aforementioned sea trial, the relationship between riser temperature, depth, and time monitored by the DTS system was verified. The trend of temperature variation with water depth is consistent with the theoretical law of temperature distribution in the marine environment; particularly in the transition zone between the sea surface and subsurface, the variation rate aligns with the typical temperature-depth relationship described in existing studies.
4.3. The Changes in the Shape of the Risers Monitored by the System at Different Times
Steel catenary risers are subjected to various random loads in actual marine conditions. To verify the shape monitoring effect of FBG array optical cables under complex 3D deformation, a 3D curve reconstruction algorithm based on the Frenet frame [25,26] is used to calculate curvature and torsion information for obtaining the 3D coordinates of the sensing optical cable. Real-time mapping enables the completion of pipeline shape monitoring.
Given a 3D space curve and a point p on the curve, the curvature k of p is defined according to the unit tangent vector. The unit principal normal vector n and binormal vector b of the space curve are derived from the curvature, and the torsion is defined. From the derivation of the Frenet frame, Equation (4) is invalid when k(s) = 0. Here, the principal normal vector of the 3D curve cannot be determined, leading to errors in the reconstruction algorithm at curve inflection points. Thus, the Frenet frame needs modification: orthogonal decomposition of curvature k yields the improved Frenet frame as follows:
After measuring strain Via optical fibers inside the sensing cable, discrete curvature and torsion information is obtained through strain compensation and calculation. Numerical solutions to the above equations yield the principal normal vector n(s), binormal vector b(s), and tangent vector t(s), along with the arc-length parameter expression of the spatial curve. Once the spatial shape of the sensing cable is determined, pipeline shape reconstruction is achieved using the spatial position mapping the relationship between the sensing cable and the pipeline.
Here, denotes the coordinates of the curve’s starting point.
Each optical unit of the sensing submarine cable contains three grating arrays, with each array having 10 grating zones at 1.5 m intervals, forming a 15 m sensing segment. The three arrays collectively cover a 45 m sensing distance. The four optical units use 12 channels of the grating demodulator, labeled sequentially as CH1 to CH12.
At 9:00 on 27 June, wavelength data were collected three times at 60 min intervals across 12 channels. Using the wavelength data from the optical unit grating arrays and temperature compensation via DTS data at each monitoring point, the average axial strain at each point was calculated with the calibrated submarine cable strain sensitivity coefficient. Corresponding discrete curvature and torsion were derived based on the Frenet frame. After interpolating the discrete curvature and torsion data, the pipeline curve was reconstructed using the reconstruction algorithm, and the 3D deformation inversion curve of the pipeline was plotted (Figure 15a). The figure reflects the changes in the pipeline’s 3D shape under alternating marine loads at different times. The Z-axis represents the vertical direction of the riser, with its coordinate values indicating the distance from the pipeline end (taken as the coordinate). Figure 15b,c are the projections of the pipeline on the YZ and XZ planes, clearly showing the horizontal offset of the marine riser in the vertical direction.
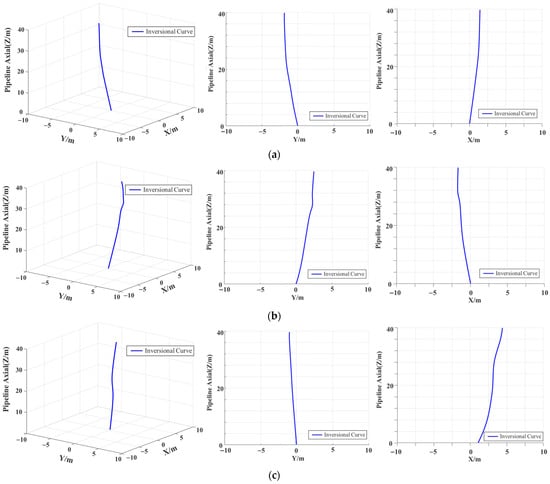
Figure 15.
(a) 3D Pipeline Inversion Curve (b) Projection on YZ Plane (c) Projection on XZ Plane.
The inversion curve cannot fully accurately represent the pipeline shape, mainly due to two factors: system errors from the reconstruction algorithm (3D coordinate accumulation causes error buildup); and 3D coordinate deviations from manufacturing constraints, which prevent strictly 90° optical unit distribution under the study’s submarine cable diameter. However, this method is verified to achieve linear reconstruction of complex 3D pipeline deformation to a certain extent.
5. Conclusions
This paper investigates the deployment of a fiber-optic sensing system on a buoy platform and proposes a corresponding design scheme. A marine floating platform monitoring system suitable for pipeline monitoring is designed by integrating fiber-optic sensing technology. Through the design of the buoy’s main body and the layout of its modular systems, hydrodynamic analysis and stability calculations are conducted to meet the specifications for offshore trials. Real-time measurements of marine risers are performed using fiber-optic sensing submarine cables, enabling research on the relationship between riser temperature and depth as well as real-time monitoring of riser shape. This verifies the effectiveness and feasibility of the system in riser monitoring.
First, the design and commissioning of the intelligent submarine cable and pipeline monitoring system are elaborated. The buoy is equipped with a robust mechanical frame capable of withstanding harsh marine conditions. Its design accommodates the installation and arrangement of instruments, enabling autonomous marine data collection by the buoy, while the power supply system meets the requirements for long-term offshore monitoring. Based on the operational marine environmental parameters and the buoy’s buoyancy parameters, calculations of the system’s stability and hydrodynamic wave response are conducted for the buoy’s structure. The designed buoy has an initial metacentric height of 2.61 m and a metacentric radius of 2.83 m, with the moment balance relationship from stability verification complying with the specifications in the Code of Stability for Sea-Going Ships [20]. Through simulation calculations of the buoy’s Response Amplitude Operators (RAOs), its heave period is 1.257 s, and the roll and pitch periods are 1.904 s—avoiding the wave period range of 3–12 s in the South China Sea. Thus, resonance between waves and the buoy is prevented.
Second, the monitoring system based on the fiber-optic sensing submarine cable is introduced. The optical configuration of the monitoring system is designed to establish the optical path. A submarine cable integrating strain and temperature monitoring is adopted, where each of its four optical units consists of one single-mode fiber and three fiber Bragg grating arrays. Meanwhile, galvanized steel wires are stranded with the optical units—this design ensures the submarine cable meets the mechanical strength requirements under marine conditions while maintaining excellent sensing performance. The collected signals are demodulated and analyzed by a DTS and a fiber Bragg grating demodulator, respectively, enabling the presentation of the relationship between riser temperature and depth as well as the inversion monitoring of the riser shape.
Third, the buoy monitoring system in this paper was deployed in the waters near Yazhou Bay, Sanya, Hainan Province. Prior to deployment, sea condition assessment and wind-wave forecasting were conducted to ensure the marine environment met the requirements for navigation, deployment, and monitoring. The buoy was towed to the target sea area for deployment. To enhance its stability, counterweights were added to lower the buoy’s center of gravity—these adjustments were expected to increase the buoy’s restoring moment and improve its capsizing resistance. A detailed deployment plan and process were documented. After 168 h of monitoring operation, the system exhibited no failures or data anomalies.
Finally, based on the data recorded by the intelligent buoy monitoring system during the sea trial, key monitoring parameters of marine risers—such as temperature and stress at different depths—were analyzed. A DTS distributed fiber-optic system was used for temperature measurement. Through 24/7 monitoring over 7 days, it accurately responded to temperature changes at different depths, verifying the relationship between riser temperature, depth, and time via the DTS system. The trend of temperature variation with water depth is consistent with the theoretical law of temperature distribution in the marine environment; particularly in the transition zone between the sea surface and subsurface, the rate of change aligns with the typical temperature-depth relationship described in existing studies. By combining grating arrays with DTS-based temperature compensation, the stress values at monitoring points along the riser axis were accurately measured. Using the 3D curve reconstruction algorithm based on the Frenet frame, 3D coordinates were derived, and real-time mapping enabled pipeline shape reconstruction.
Overall, to address the demand for integrated distributed real-time monitoring of marine risers, a fiber-optic sensing-based marine riser buoy observation system is proposed. While the system demonstrates significant potential for riser monitoring applications, further development and testing are required. Its effectiveness needs to be validated through application in real deep-sea riser projects to ensure applicability and reliability in more challenging offshore environments, aligning with the requirements of interdisciplinary scientific observation.
Author Contributions
Data curation, X.L., Y.C. and J.G.; funding acquisition, L.L.; formal analysis, S.L., J.G. and X.L.; investigation, S.L. and X.L.; supervision, X.L. and J.G.; validation, S.L. and Y.C.; writing—original draft, S.L.; writing—review and editing, L.L.; Methodology S.L., X.L. and Y.C.; Resources L.L.; Project administration L.L. All authors have read and agreed to the published version of the manuscript.
Funding
The Research Project of Sanya Yazhou Bay Science and Technology City (SKJC-2020-01-016).
Data Availability Statement
Data underlying the results presented in this paper are not publicly available at this time but may be obtained from the authors upon reasonable request.
Acknowledgments
The authors sincerely thank the research project and all the participants for their support.
Conflicts of Interest
Author Jian Gu was employed by the company Wuxi Haiying-Cal Tec Marine Technology Co., Ltd. The remaining authors declare that the research was conducted in the absence of any commercial or financial relationships that could be construed as a potential conflict of interest.
Correction Statement
This article has been republished with a minor correction to the existing affiliation information. This change does not affect the scientific content of the article.
References
- Wang, L.; Wang, Y.J.; Song, S.M.; Li, F. Overview of Fibre Optic Sensing Technology in the Field of Physical Ocean Observation. Front. Phys. 2021, 9, 745487. [Google Scholar] [CrossRef]
- Qin, H.; Xu, Z.N.; Yuan, B.Q.; Gan, Y.Q. Study on the Application of Distributed Fiber Sensing Technology in Weizhou Island Sea-crossing Power System Connection Project. Sci. Technol. Ind. 2020, 20, 161–167. [Google Scholar]
- Wang, B.; Li, M.; Liu, S.X.; Chen, S.Z.; Zhu, Q.L.; Wang, H.G. Current status and trend of ocean data buoy observation technology applications. Yi Qi Yi Biao Xue Bao/Chin. J. Sci. Instrum. 2014, 35, 2401–2414. [Google Scholar]
- Li, H.Z.; Jia, W.J.; Ren, W.; Wang, Y.; Gao, Y.B.; Zhao, Y.M. Ocean Observation with Physical Oceanographie Sensors: Status and Development Trend. J. Ocean. Technol. 2015, 34, 43–47. [Google Scholar]
- Fan, X.M.; Wang, Y.J.; Wang, Z.Y. Study on distributed SOFC monitoring systems and their appliceations. Study Opt. Commun. 2014, 57, 40–42. [Google Scholar]
- Borda, C.; Niklès, M.; Rochat, E. Continuous real-time pipeline deformation, 3D positioning and ground movement monitoring along the Sakhalin-Khabarovsk-Vladivostok pipeline. In Proceedings of the 2012 9th International Pipeline Conference, Calgary, AB, Canada, 24–28 September 2012; ASME: New York, NY, USA, 2012; Volume 45134, pp. 179–187. [Google Scholar]
- Ren, P.; Shen, Y.; Li, X.; Zhou, Z. A Distributed Fiber Optic Sensing Technology for Shape Monitoring of Deepwater Riser. China Offshore Platf. 2014, 29, 26–32. [Google Scholar]
- Zhao, X.F.; Zhang, X.W. Application of Distributed Optical Fiber Sensing Technology Based on Active Thermometry in Monitoring of Scor and Free Span of Subsea Pipeline. China Offshore Platf. 2018, 33, 22–29. [Google Scholar]
- Le Cunff, C.; Ryu, S.; Duggal, A. Derivation of CALM Buoy Coupled Motion RAOs in Frequency Domain and Experimental Validati. In Proceedings of the Seventeenth International Offshore and Polar Engineering Conference ISOPE, Lisbon, Portugal, 1–6 July 2007. [Google Scholar]
- Ryu, S.; Duggal, A.S.; Heyl, C.N.; Liu, Y.H. Prediction of Deepwater Oil Offloading Buoy Response and Experimental Validation. Int. J. Offshore Polar Eng. 2006, 16, 290–296. [Google Scholar]
- Thorburn, K.; Karlsson, K.-E.; Wolfbrandt, A.; Eriksson, M.; Leijon, M. Time stepping finite element analysis of a variable speed synchronous generator with rectifier. Appl. Energy 2006, 83, 371–386. [Google Scholar] [CrossRef]
- Venkatesan, R.; Sannasiraj, S.A.; Ramanamurthy, M.V.; Senthilkumar, P.; Dhinesh, G. Development and Performance Validation of a Cylindrical Buoy for Deep-Ocean Tsunami Monitoring. IEEE J. Ocean. Eng. 2019, 44, 415–423. [Google Scholar] [CrossRef]
- Cao, H.Y. Study on the Resistance and Motion Characteristics of A Marine Pillar Buoy. Master’s Thesis, Tianjin University, Tianjin, China, 2012. [Google Scholar]
- Zhao, R.J.; Xie, X.L.; Zhang, S.C.; Zhao, J.B. Size optimization of multi-functional buoyancy tanks of semi-submersible repair vessels in floating conditions (Article). Harbin Gongcheng Daxue Xuebao/J. Harbin Eng. Univ. 2019, 40, 555–561. [Google Scholar]
- Tang, Y.G.; Kuang, Y.X.; Li, H.X. The Influence of Matecentric Height Fluctuations on Roll Motion. Shipbuild. China 2008, 49, 22–28. [Google Scholar]
- Berteaux, H.O. Buoy Engineering; Wiley: New York, NY, USA, 1976. [Google Scholar]
- Lu, Y.; Gu, X.K.; Zong, Z. Intact stability assessment of very large floating structures in waves. Ship Build. China 2015, 56, 138–145. [Google Scholar]
- Li, C.; Li, Y.H.; Yi, H. Study on the initial stability of canted strut SWATH. Ship Eng. 2009, 31, 6–8. [Google Scholar]
- Wang, X.F.; Liu, J.K.; Wang, K. Stability calculation of deformable ship. Navig. China 2015, 38, 58–62. [Google Scholar]
- Maritime Safety Administration of the People’s Republic of China. Technical Rules for Statutory Inspection of Domestic Navigating Marine Vessels; China Communication Press: Beijing, China, 2011; pp. 212–216. [Google Scholar]
- Jia, J.B.; Zong, Z.; Shi, H.Q. Study on the initial stability of asymmetric catamaran. Chin. J. Ship Res. 2008, 3, 13–17. [Google Scholar]
- Taylan, M. Overall stability performance of alternative hull forms. Ocean. Eng. 2002, 29, 1663. [Google Scholar] [CrossRef]
- Liu, H.X.; Xiao, X. The wave load calculation in the analysis of structural strength of a semisubmesible. China Offshore Platf. 2003, 18, 1–4. [Google Scholar]
- Li, K.; He, F.N. Analysis on mainland China’s solar energy distribution and potential to utilize solar energy as an alternative energy source. Prog. Geogr. 2010, 29, 27–32. [Google Scholar]
- Moore, J.P.; Rogge, M.D. Shape sensing using multi-core fiber optic cable and parametric curve solutions. Opt. Express 2012, 20, 2967–2973. [Google Scholar] [CrossRef] [PubMed]
- Xu, Q.W. Research on Pipeline Shape Monitoring Method Based on Weak Fiber Grating Sensing Optical Cable. Master’s Thesis, Wuhan University of Technology, Wuhan, China, 2023. [Google Scholar]
Disclaimer/Publisher’s Note: The statements, opinions and data contained in all publications are solely those of the individual author(s) and contributor(s) and not of MDPI and/or the editor(s). MDPI and/or the editor(s) disclaim responsibility for any injury to people or property resulting from any ideas, methods, instructions or products referred to in the content. |
© 2025 by the authors. Licensee MDPI, Basel, Switzerland. This article is an open access article distributed under the terms and conditions of the Creative Commons Attribution (CC BY) license (https://creativecommons.org/licenses/by/4.0/).