Abstract
Offshore wind turbines (OWTs) operate under harsh marine conditions involving strong winds, waves, and salt-laden air, which increase the risk of excessive vibrations and structural failures such as tower collapse. To ensure structural safety and achieve effective vibration control, accurate modal parameter identification is essential. In this study, a vibration monitoring system was developed, and the Bayesian Spectral Decomposition (BSD) method was applied for the operational modal analysis of a 5.5 MW monopile OWT. The monitoring system consisted of ten uniaxial accelerometers mounted at five elevations along the tower, with two orthogonally oriented sensors at each level to capture horizontal vibrations. Due to continuous nacelle yawing, the measured accelerations were projected onto the structural fore–aft (FA) and side–side (SS) directions prior to modal analysis. Two days of vibration and SCADA data were collected: one under rated rotor speed and another including one hour of idle state. Data preprocessing involved outlier removal, low-pass filtering, and directional projection. The obtained data were divided into 20-min segments, and the BSD approach was applied to extract the primary modal parameters in both FA and SS directions. Comparison with results from the Stochastic Subspace Identification (SSI) technique showed strong consistency, verifying the reliability of the BSD method and its advantage in uncertainty quantification. The results indicate that the identified modal frequencies remain relatively stable under both rated and idle conditions, whereas the damping ratios increase with wind speed, with a more significant growth observed in the FA direction.
1. Introduction
Offshore wind turbines (OWTs) are increasingly deployed worldwide due to their high and stable wind resources. By the end of 2023, the global installed wind power capacity reached 1.335 billion kilowatts, with offshore wind contributing significantly to this growth [1]. However, OWTs operate in harsh marine environments characterized by strong winds, waves, and salt spray, which pose severe challenges to structural integrity. Excessive vibrations in the tower structure—resulting from environmental loads and rotor dynamics—can lead to fatigue damage or even catastrophic failures such as tower collapse [2]. Since operation and maintenance (O&M) costs can account for up to 35% of the lifecycle cost of an OWT [3], early detection and mitigation of structural issues are vital for ensuring safety and economic performance.
The tower, as the key structural member supporting the nacelle and rotor, is fundamental to the operational stability of a wind turbine. Precise determination of its modal characteristics, including natural frequencies, damping ratios, and vibration modes, is crucial for evaluating structural performance, identifying potential abnormalities, and formulating effective vibration control measures [4,5,6]. Modal properties also serve as references for optimizing tower design and avoiding resonance with rotor-induced excitations [7].
Various operational modal analysis (OMA) methods have been developed and applied to wind turbines [8], including time-domain approaches such as stochastic subspace identification (SSI) [9,10,11] and NExT-ERA [12], and frequency–domain approaches like frequency domain decomposition (FDD) [13] and enhanced FDD (EFDD) [14]. Frequency–domain methods are particularly advantageous in offering intuitive spectral interpretation and simplified model order selection. However, many OMA techniques assume Gaussian white noise excitation and linear time-invariant behavior—assumptions that may not hold under real-world wind turbine operations.
Field studies have implemented vibration monitoring systems on offshore turbines to support modal identification. For instance, Devriendt et al. [15] installed accelerometers on an OWT in the Belgian North Sea to track modal parameters under varying conditions. Hines et al. [16] and Song et al. [17] deployed a comprehensive sensor network—including inclinometers and wireless accelerometers—on turbines near Block Island, enabling remote structural health monitoring. Dai et al. [9] performed full-scale tests on a vertical-axis wind turbine in Shanghai, analyzing sensor duration effects on identification accuracy.
Moreover, OWT towers exhibit distinct dynamic behaviors between idling and operating states. In idle state, the structural response is mainly driven by environmental loads, with vibration frequencies dominated by the intrinsic modal characteristics. In the operating state, the tower experiences additional excitations from rotor rotation, blade-passing effects [18], and gyroscopic forces [19], leading to more complex response spectra. Accurate and state-specific modal identification is thus critical for comprehensive structural evaluation.
Bayesian methods have gained attention in recent years for their ability to provide both optimal modal estimates and uncertainty quantification. Techniques such as the Bayesian FFT [20], Bayesian spectral density approach (BSDA) [21], and fast Bayesian FFT [22] have demonstrated strong potential in OMA applications. However, these methods often suffer from high computational costs due to increasing parameter dimensionality with larger sensor networks.
In this work, a novel Bayesian Spectral Decomposition (BSD) approach was applied for the first time to identify the modal parameters of a 5.5 MW monopile offshore wind turbine equipped with a structural health monitoring system. The BSD method integrates the advantages of frequency–domain decomposition and Bayesian inference. This method employs a singular value analysis of the power spectral density matrix and formulates a likelihood model according to the probabilistic characteristics of the obtained singular components. This framework allows for efficient estimation of modal parameters together with their associated uncertainties. It provides optimal modal estimates under various uncertainties and reveals the damping characteristics and their evolution with wind speed, offering a reliable basis for structural health monitoring, response prediction, and vibration control design. The main aims of this article are: (1) to extract time-varying modal properties under realistic operating environments; (2) to compare structural dynamics between idle and operational conditions; and (3) to characterize the evolution trends of the identified modal parameters.
2. Monitoring of Offshore Wind Turbine and Data Preprocessing
2.1. Overview of Offshore Wind Turbines and Monitoring System
This study focuses on an offshore wind turbine installed at the Biqing Bay Offshore Wind Farm, located near Zhuhai in Guangdong Province, China. The wind farm lies roughly 10 km from the shoreline, where the local water depth varies between 11.9 m and 20.9 m. With a total capacity of 300 MW, the farm comprises 55 turbines—most rated at 5.5 MW, except for a single unit whose output is limited to 3 MW. The geographical location and the overall arrangement of the wind turbines are as shown in Figure 1.
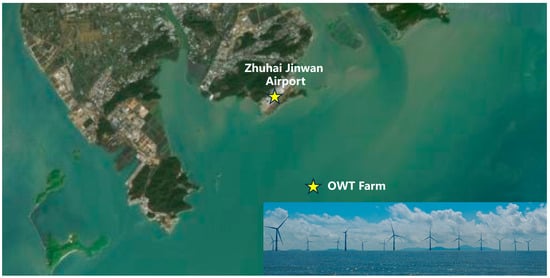
Figure 1.
The geographical location and the overall arrangement of the wind turbines.
The selected turbine model has a rotor diameter of 157.7 m. Its operational wind speed range spans from 3 m/s at cut-in to 25 m/s at cut-out, while the rated wind speed of 10.1 m/s corresponds to a rotor speed of 12 rpm. As illustrated in Figure 2, turbine No. 29 is instrumented with a comprehensive monitoring system. This turbine adopts a monopile foundation that is linked to the tower through a transition piece. The tower consists of four cylindrical segments joined by bolted flanges, and the cross-sections are designated as Sections A to E from bottom to top. The monitoring system deploys a total of 10 uniaxial accelerometers, labeled “A1” to “A10”. Among them, A1 and A2 are installed on the E platform, A3 and A4 are installed on the D platform, and the remaining accelerometers are installed sequentially in the same order. The installation configuration of the accelerometers is shown in Figure 3, where the sensors are deployed in mutually perpendicular orientations. Accelerometers A1, A3, A5, A7, and A9 are arranged along the primary wind direction (northeast by east, 67.5° from true north), while the other sensors are oriented perpendicularly. The heights of sections E, D, C, and B relative to section A are 81.43 m, 56.38 m, 32.08 m, and 16.18 m, respectively. Additionally, the length of the monopile foundation is 85.5 m.
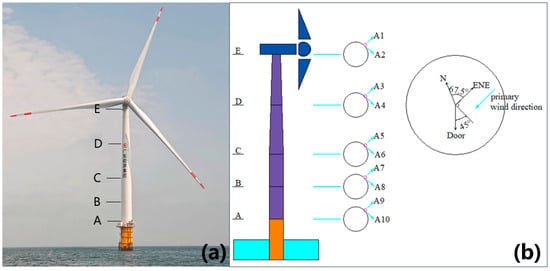
Figure 2.
(a) Photograph of offshore wind turbine No. 29; (b) Schematic diagram showing accelerometer installation positions and the primary wind direction.
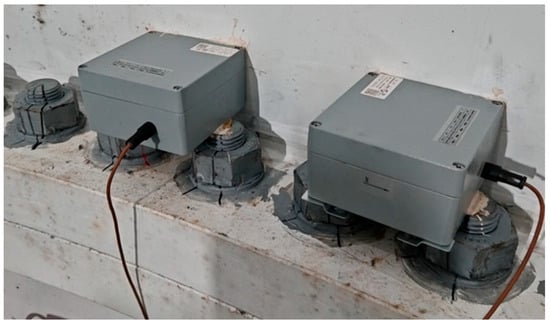
Figure 3.
The on-site layout diagram of the accelerometers.
Acceleration data were recorded at a sampling frequency of 50 Hz using accelerometers installed on the structure. The sensor outputs were first collected by a data acquisition system and then transmitted to a locally installed industrial computer. Through a wireless communication module, the data was subsequently uploaded to a cloud-based server, providing remote accessibility for data analysis. The established monitoring configuration ensures that the measured acceleration signals possess adequate fidelity for the extraction of modal characteristics. In parallel, the turbine’s Supervisory Control and Data Acquisition (SCADA) platform continuously logs operational variables—such as one-minute averages of nacelle orientation, rotor rotational speed, and local wind speed and direction—which are incorporated into the modal parameter identification procedures carried out in this study.
2.2. Data Preprocessing
The signal processing procedure for acceleration data comprised the following steps: initial outlier detection identified and removed data points exceeding 8 standard deviations from the mean, with subsequent interpolation for missing value replacement. Notably, shadowing effects [23] induce characteristic harmonic excitations at 1P (rotor rotational frequency), 3P, 6P, 9P and 12P frequencies. At the rated rotational speed of 12 rpm, the wind turbine generates a 12P harmonic at 2.4 Hz. To ensure that these essential harmonic components are maintained and that high-frequency noise is efficiently reduced, a 4 Hz cutoff Butterworth low-pass filter was utilized.
To maximize wind energy utilization, offshore wind turbine nacelles continuously adjust their nacelle orientation in response to wind direction changes. Since accelerometers are fixed installations whose orientations remain unchanged during yaw rotation, the acquired acceleration data must undergo coordinate transformation based on real-time nacelle orientation angle. As depicted in Figure 4, the relationship between the nacelle and sensor coordinate systems was established. According to the nacelle yaw angle data provided by SCADA, the acceleration measurements were converted into fore–aft (FA) and side–side (SS) vibration components to support the following modal parameter identification process. The specific formula is as follows:
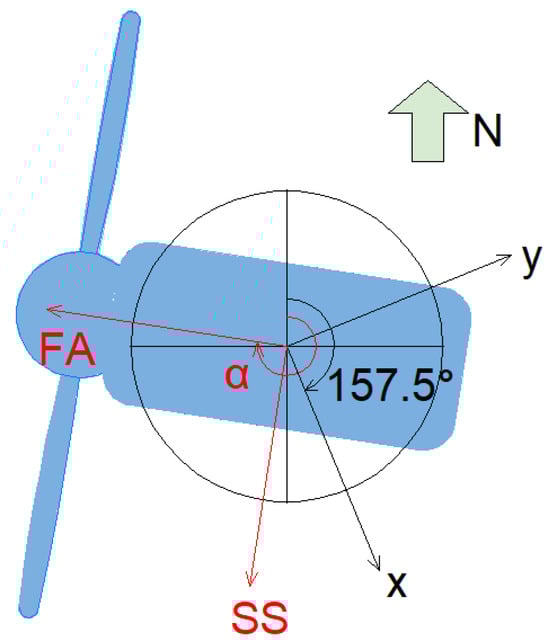
Figure 4.
The nacelle coordinate system and the sensor coordinate system.
Here, and represent the FA and SS directional vibration components of the acceleration signals, respectively; and are the acceleration signals collected by accelerometers in the x and y directions; denotes the nacelle orientation angle (time-varying), with 0° defined as true north and positive angles measured clockwise. The angle of 157.5° represents the deviation between the x-direction and true north.
3. Methodology of Modal Identification
The Bayesian Spectral Decomposition (BSD) method, recently introduced by Feng et al. [24,25], decomposes the response spectral matrices around each modal order through singular value decomposition. This process yields singular values that contain information about modal frequencies and damping, as well as singular vectors that characterize the mode shapes. Based on the statistical characteristics of these singular quantities, the BSD framework formulates the posterior probability distribution of the unknown modal parameters. Consequently, the task of modal parameter estimation is transformed into a search for the maximum a posteriori (MAP) solution. The posterior distribution is further approximated by a Gaussian model, allowing the uncertainty associated with the identified parameters to be quantitatively assessed. A detailed description of the procedure is presented below.
3.1. Frequency and Damping Identification by BSD Method
Consider a lightly damped MDOF linear system under ambient excitation, which is modeled as a zero-mean Gaussian white-noise process. When the system responses are collected from measurement channels providing sets of independent and identically distributed response time histories , each with a duration of N samples, then corresponding estimate of the response power spectral density (PSD) can be expressed as:
In the equation, represents the k-th physical frequency point, and denotes the frequency resolution. and denote transpose and conjugate transpose, respectively; represents the frequency–domain response obtained through Fourier transform at frequency . follows a central complex Wishart distribution with dimension and degrees of freedom , whose probability density function (PDF) is given by:
where and denote the determinant and trace of matrix A, respectively. Furthermore, it can be mathematically proven that when and , the spectral estimates and follow independent Wishart distributions:
On the other hand, assuming that the linear viscous damping dynamic model has modes, when the sampling frequency is sufficiently high and the data duration is relatively long, in Equation (3) can be expressed as:
where is the mode shape matrix limited by the number of measurement channels , is the modal order; is the power spectral density matrix of the prediction error; is the power spectral density matrix of the modal responses. Each element of the matrix is given by the following expression:
where denotes the cross power spectral density between the i-th and j-th modal forces; is the frequency ratio; and are the natural frequency and damping ratio of the i-th mode, respectively.
The BSD method is inspired by the concept of frequency domain decomposition (FDD), in which a decomposition strategy is employed to simplify the optimization by reducing the number of parameters involved. Performing singular value decomposition (SVD) on yields:
‘H’ denotes the conjugate transpose. According to reference [26], Equation (7) can be expressed in the following form:
where is a real number; is the r-th order eigenvalue, and is the mode shape of the r-th order. At the position of the structural natural frequency, has a peak value. This peak value corresponds to the frequency which is the natural frequency of the r-th order. The first singular value in Equation (7) is , and the corresponding singular vector is the mode shape of the r-th order. Therefore, from Equations (7) and (8), it can be seen that among the output variables after singular value decomposition, is an orthogonal matrix containing the singular vectors of (, where is the identity matrix), which holds spatial parameter information of the mode shapes. Meanwhile, is a diagonal matrix storing the corresponding singular values, containing spectral parameter information such as frequency and damping ratios.
In a structural dynamic system with distinct modal separations, the response within a resonance frequency band can be approximated as being dominated by a single mode. Accordingly, only the spectral density data in this band are employed for modal identification. Let denote the neighborhood set of the j-th modal frequency, then, in Equation (5), can be expressed as:
The mode shape of the j-th mode (hereafter, the mode order j is omitted for brevity); represents the PSD corresponding to the dominant modal response, which can be expressed as:
where ; is the natural frequency and is the modal damping ratio; is the PSD of the modal force; is the modal dynamic amplification factor.
To further derive the statistical properties of singular values and singular vectors, we need to perform a deeper-level transformation and expansion of the expression for . This process is based on the following two assumptions: (1) is a Hermitian matrix and remains smooth within the frequency band ; (2) One of the singular vectors of lies in the modal space spanned by .
Next, define an orthogonal basis . Assume that , and is an orthonormal basis of the subspace spanned and formed by vectors orthogonal to . Based on this, can be written as:
where are the singular values of , and the corresponding singular vectors are . Substituting Equation (10) into Equation (8) gives:
The singular values of are , respectively, and the corresponding singular vectors are , respectively. The largest singular value is:
Since follows a central complex Wishart distribution with dimension and degree of freedom , and is a real covariance matrix. Define and as the singular values of and , respectively. When is large enough, follows an asymptotic Gaussian distribution. If is defined as the i-th singular value (arranged from largest to smallest) of , the mean and variance of can be written as:
The spectral parameters to be identified can be divided into two groups: and . Assuming a non-informative prior distribution, the PDF of the largest singular value can be expressed as:
For , its posterior PDF can also be written in the same form. By maximizing Equation (16), the optimal estimate can be obtained, and this process is equivalent to minimizing the negative log-likelihood function , as shown in Equation (17).
Next, a numerical optimization algorithm can be used to solve . After that, the Hessian matrix can be further calculated, and the covariance matrix is the inverse of the Hessian matrix of at .
3.2. Mode Shape Identification by BSD Method
According to Equation (8), the singular vector corresponding to the largest singular value is the optimal estimate of the mode shape , and it is unit-normalized. If are the singular vectors of . And and are the corresponding singular values and singular vectors of . Then, follows an asymptotic Gaussian distribution with a covariance matrix given by:
Then, the covariance matrix of the singular vector corresponding to can be written as:
It can be seen from Equation (19) that is a singular matrix with a rank of . The singular values of are , respectively, and the corresponding singular vectors are . Once the optimal estimate of the modal shape is obtained, the covariance matrix of the mode shape can be calculated through Equation (19).
4. Modal Parameter Identification Results
The identification of modal parameters is a key process for assessing the dynamic behavior and structural condition of wind turbines. Damage in a wind turbine (such as cracks, material degradation, or loose connections) typically leads to a local decrease in stiffness, which in turn causes a reduction in natural frequencies and changes in mode shapes. Precise estimation of natural frequencies, damping ratios, and mode shapes provides a quantitative foundation for condition assessment and vibration control. In this study, acceleration responses obtained from the field monitoring system are analyzed under two representative operating conditions—rated rotor speed (12 rpm) and idle state—to examine the modal characteristics of the wind turbine tower. Furthermore, when applying the BSD method, each dataset has a duration of 20 min. Abnormal measurements were observed from accelerometer A6 over the two days, most likely resulting from a sensor malfunction. As Equation (1) requires simultaneous data from A5 and A6, both sensors located on layer C were excluded from the subsequent analysis.
4.1. Modal Parameter Identification of the Wind Turbine at Rated Rotor Speed
Time series of the rotor rotational speed and the nacelle-top wind speed on 14 November 2024 were obtained from the SCADA system, as shown in Figure 5. The results indicate that the rotor operated at its rated speed of 12 rpm for almost the entire day, except for several short periods when the speed slightly decreased, as highlighted by the light gray areas in the figure. The reason for this phenomenon is that during this period, the wind speed was slightly lower than the rated wind speed of 10.1 m/s, which caused a slight fluctuation in the rotor speed. Consequently, the full dataset was retained for subsequent analysis. Each dataset corresponds to a 20-min interval, resulting in a total of 72 records for the day. After preprocessing the acceleration signals measured by sensors installed at layers E, D, B, and A, the response components in the fore–aft (FA) and side–side (SS) directions were calculated at each measurement point using Equation (1). The modal parameters of the tower were then identified from the processed acceleration data through the BSD method.
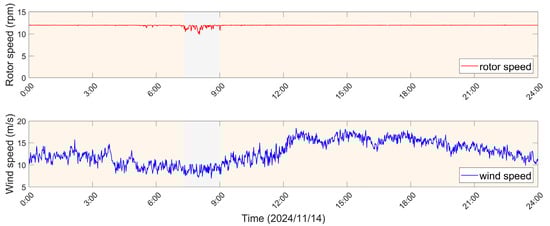
Figure 5.
The rotor speed and wind speed data from SCADA system on 14 November 2024. The gray shaded area indicates a period of slight variations in rotor speed when the wind speed is below the rated value.
The singular value spectrum of the FA and SS direction acceleration time histories from 00:00 to 00:20 is presented in Figure 6. The spectrum clearly reveal the presence of higher harmonics caused by the blade rotation, with the vertical axis shown in logarithmic scale for better visualization. Additionally, it can be observed that the first-order bending frequency of the tower lies between the 1P (0.2 Hz) and 3P frequencies, indicating that the wind turbine exhibits a typical “soft-stiff” design [27]. It is noteworthy that the peak to the left of the 6P frequency corresponds to the 5P frequency rather than the second bending frequency. The second bending frequency does not appear prominently in the figure, likely due to interference from higher-order harmonics. This pattern is consistently observed under rated rotor speed conditions.
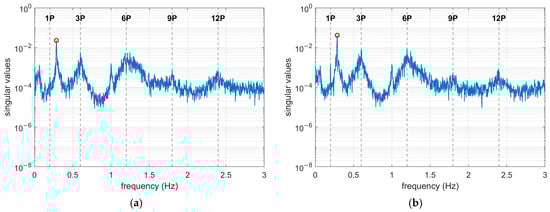
Figure 6.
The singular value spectrum results from 00:00 to 00:20: (a) the singular value spectrum in the FA direction; (b) The singular value spectrum in the SS direction.
The complete set of daily acceleration data was analyzed to determine the frequencies, damping ratios, and their coefficients of variation, which are presented in Figure 7 and Figure 8. As shown in Figure 7, regardless of the FA or SS direction, the identified frequency results show slight fluctuations and remain generally stable, with the average frequency value in both directions being 0.284 Hz. Further statistical data are provided in Table 1. Additionally, BSD performed uncertainty quantification on the identification results, revealing that the coefficient of variation (CV) stays below 0.002, indicating high precision in the identified frequencies. Figure 8 presents the identified damping ratios at the rated rotor speed. Although a certain degree of dispersion can be observed, the statistical analysis shows that the mean damping ratio reaches 1.253% in the FA direction and 1.120% in the SS direction. The slightly higher damping ratio in the FA direction is mainly due to the stronger aerodynamic damping acting on the windward side. Furthermore, the coefficient of variation for the damping ratio identification results also remains at a relatively low level, though it is somewhat larger than that obtained for the natural frequencies. This is consistent with the expected behavior of modal parameter identification. The CV provides a practical metric of the reliability of identification results; with the established threshold of 15–20% [25]. Identified results with a CV exceeding this threshold should be treated with caution or discarded.
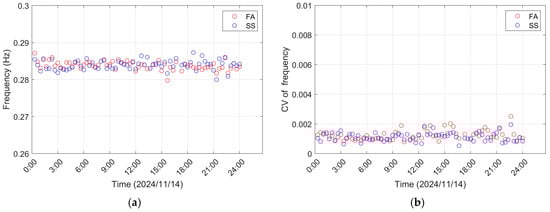
Figure 7.
Frequency estimation results with uncertainty quantification: (a) the frequency estimation results; (b) the coefficient of variation results.
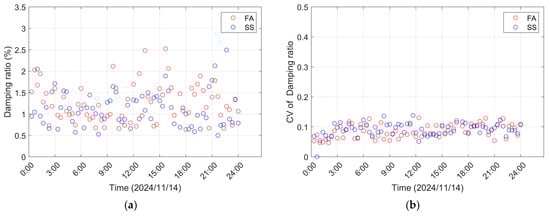
Figure 8.
Damping ratio estimation results with uncertainty quantification: (a) the damping ratio estimation results; (b) the coefficient of variation results.

Table 1.
Statistical values of frequency and damping ratio results.
The Modal Assurance Criterion (MAC) measures the similarity between two mode shapes [28]. Its value ranges from 0 to 1, with values near 1 indicating strong correlation and those near 0 showing little similarity. The MAC is calculated as:
where and are two mode shape vectors, and T denotes the transpose operation. Figure 9a shows the mode shapes identified using acceleration time histories from 00:00 to 00:20. This result served as the reference for computing MAC values of all identified mode shapes. Figure 9b illustrates that all MAC values exceed 0.98, indicating the high reliability of the identification results.
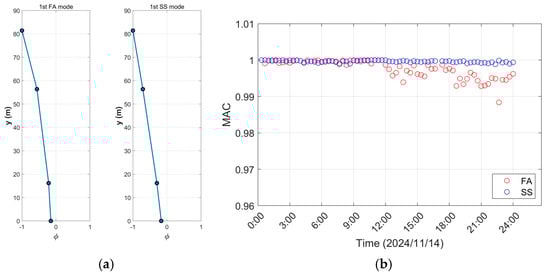
Figure 9.
Identified mode shapes and corresponding MAC values: (a) the mode shapes (data from 00:00 to 00:20); (b) the MAC results.
From the above analysis, it can be seen that the frequency results are relatively stable; therefore, only the influence of wind speed on the damping ratio is investigating. The identified damping ratios were sorted according to the average wind speed during the corresponding time intervals, and the results are shown in Figure 10. Least-squares regressions were independently conducted to characterize the relationships between wind speed and damping ratio in the FA and SS directions, with the fitted curves represented by solid lines in the figure. A distinct increasing trend of the damping ratio with wind speed is observed in the FA direction, while the SS direction exhibits little variation. For a monopile OWT, the total damping consists of four main components: aerodynamic damping, structural damping, hydrodynamic damping, and soil damping. Variations in wind speed have no direct influence on structural damping, and their effects on hydrodynamic and soil damping are generally secondary. Therefore, the observed increase in overall damping with rising wind speed can be primarily attributed to aerodynamic damping, indicating that the aerodynamic contribution is dominant in the FA direction. This finding is consistent with the conclusions reported in the literature [29].
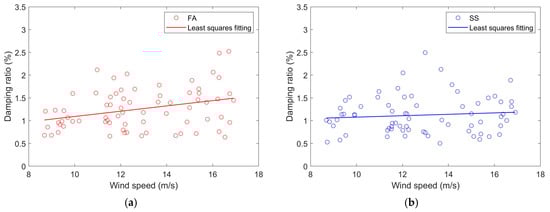
Figure 10.
Variation in damping ratio with wind speed: (a) the damping ratios in the FA direction; (b) the damping ratios in the SS direction.
4.2. Modal Parameter Identification of the Wind Turbine at Idel State
The recorded variations in rotor rotational speed and nacelle-top wind speed on 12 November 2024, are illustrated in Figure 11. The orange-shaded region marks the period when the wind turbine was in an idle mode, as the wind speed stayed below the cut-in value for nearly an hour. Consequently, the time history is partitioned into three sections (1#, 2#, 3#).
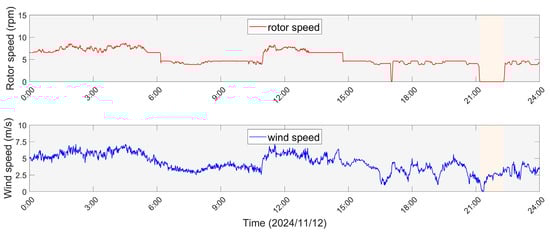
Figure 11.
The rotor speed and wind speed data from SCADA system on 12 November 2024. The orange shaded area indicates a one-hour idling state.
First, the singular value spectrum in the FA and SS directions were calculated. As shown in Figure 12, two distinct peaks can be observed, corresponding to the first two natural frequencies of the tower, unlike at rated rotor speed where only the first-order frequency of the tower can be identified. Moreover, since the wind turbine is in an idle state, the blade-passing frequency does not appear in the singular value spectrum. These characteristics differ significantly from the spectral features observed when the wind turbine operates at rated rotor speed.
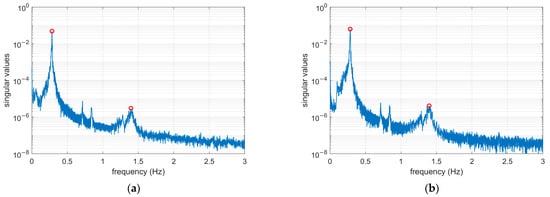
Figure 12.
The singular value spectrum results for the first 20-min segment: (a) the singular value spectrum in the FA direction; (b) the singular value spectrum in the SS direction.
Next, the BSD method was applied to the three segments of acceleration time histories mentioned above. The identified natural frequencies, damping ratios, and uncertainty quantification results of the tower are summarized in Table 2. It can be seen that, under the idle state, the average first-order natural frequencies of the wind turbine tower in the FA and SS directions are 0.283 Hz and 0.284 Hz, respectively, which are consistent with the statistical values at rated rotor speed. The average damping ratios in the FA and SS directions are 0.944% and 0.960%, respectively, which represent a certain decrease compared to 1.253% and 1.120% at rated rotor speed. Notably, the damping ratio variation in the FA direction is more pronounced, indicating that aerodynamic damping has a more significant influence in the FA direction. Furthermore, in the idle state, second-order modal parameter of the tower was also identified. The frequencies in the FA and SS directions were 1.395 Hz and 1.394 Hz, respectively, with corresponding structural damping ratios of 2.609% and 2.458%, which are significantly higher than those for the first-order modes. Additionally, the coefficient of variation for frequency identification was less than 0.002, and for damping ratio identification it was less than 0.085.
Table 2.
Identified frequency and damping ratio results.
Similarly, using the mode shape results from the first time interval (data segment 1#) as the benchmark, the identified modal mode shapes are shown in Figure 13. The MAC values for each mode shape are listed in Table 3. The MAC values for the first-order modes are closer to 1 compared to those of the second-order modes. However, the identified second-order modes also show strong correlation. This further confirms the reliability of the identification results. Nevertheless, the absence of measurement point C limits the smoothness of the identified mode shapes, particularly for the second-order mode shape.
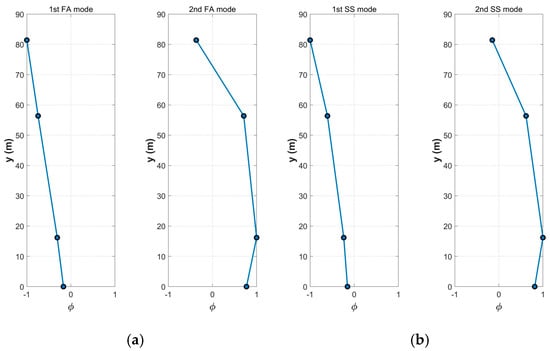
Figure 13.
Identified mode shapes for the first time interval: (a) The first two mode shapes in the FA direction; (b) The first two mode shapes in the SS direction.
Table 3.
The MAC values of identified mode shapes.
4.3. Modal Parameter Identification Results Comparison and Validation
To validate and enhance the credibility of the modal parameter identification results obtained through the BSD method, the widely used and well-established Stochastic Subspace Identification (SSI) method was also employed in this study. The results from both methods were compared. Table 4 presents the frequency and damping ratio results identified using the two methods for the aforementioned rated rotor speed condition (00:00–00:20) and idle state (data segment #1).
Table 4.
Frequency and damping ratio results identified by two methods.
According to the results presented in the table above, the identified frequencies from both methods are generally consistent, and the modal damping ratios obtained also exhibit good agreement, with a maximum deviation of less than 5%. Furthermore, the table shows that the CV of the damping ratios is consistently higher than that of the frequencies, indicating greater uncertainty in damping ratio identification. Nevertheless, all CV values remain below 0.09, which falls within an acceptable range. This further indicates that accurately identifying the damping ratio still involves certain technical difficulties. Therefore, it is essential to quantify the uncertainty in the identification results. Based on the identification results, while maintaining identification accuracy, the BSD method offers an additional advantage over the SSI method by providing uncertainty quantification for the results.
Furthermore, a comparison of the mode shapes identified by the two methods was also conducted. As shown in Figure 14, the mode shapes show good agreement as well. However, the first-order mode shapes identified by both methods exhibit better consistency than the second-order ones. The observed discrepancies are within acceptable limits, further confirming the effectiveness of the BSD method.
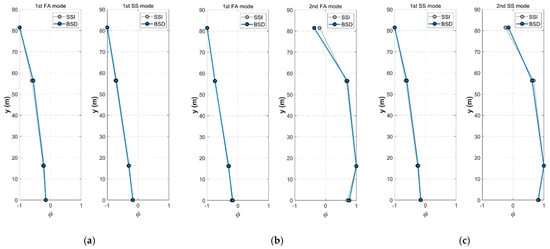
Figure 14.
Comparison of Identified Mode Shapes: (a) Mode shapes at rated rotor speed; (b) Mode shapes in the FA direction at idle state; (c) Mode shapes in the SS direction at idle state.
5. Conclusions
This study focuses on the modal parameter identification of a 5.5 MW monopile offshore wind turbine at the Biqing Bay Wind Farm in the South China Sea. Based on data collected from deployed accelerometers and the wind turbine’s SCADA system, after data preprocessing, modal parameter identification of the turbine tower was conducted under two typical conditions: rated rotor speed and idle state. The identification was carried out utilizing the advanced BSD method, resulting in the following findings:
- (1)
- The second bending mode is identifiable only under idle conditions, as rotor harmonics under rated speed mask its response. In contrast, the first bending mode and the blade-passing frequency are accurately identified. The first bending modal frequency lies between 1P and 3P, indicating that the wind turbine exhibits a typical “soft-stiff” design.
- (2)
- Under rated rotor speed conditions, the tower exhibits noticeably higher damping ratios in both the FA and SS directions compared with the idle state, with a more substantial increase observed in the FA direction. Nevertheless, the fundamental bending frequency of the tower remains largely unchanged across the two operating conditions.
- (3)
- At the rated rotor speed, the first damping ratio in the FA direction shows a clear increasing tendency with rising wind speed, whereas no evident dependence on wind speed is detected in the SS direction. This increase is primarily attributed to aerodynamic damping, indicating that it plays a dominant role in the FA response.
- (4)
- The MAC values calculated for the identified mode shapes are nearly unity under both the rated and idle states, confirming the high consistency and reliability of the identified modal shapes.
- (5)
- The BSD approach effectively and accurately identified the tower’s modal characteristics while quantifying the associated uncertainties. The analysis further reveals that the damping ratios exhibit larger uncertainty than the corresponding frequencies.
Within a Bayesian framework, this study quantifies the uncertainty associated with the identified modal parameters of wind turbines, providing a more objective basis for interpreting the results. The quantified uncertainties in frequency and damping enable reliability-informed tower design to avoid resonance, support the robust tuning of vibration control devices such as tuned mass dampers, and improve the confidence of response predictions under varying wind–wave conditions. They also provide a reliable basis for setting alarm thresholds and detecting structural damage through long-term monitoring. These outcomes enable wind farms to implement timely operation and maintenance strategies, ensuring the safe and stable operation of offshore wind turbines.
While the BSD method has demonstrated good performance for modal identification under the investigated conditions, several limitations should be acknowledged. Its accuracy may decrease when rotor-induced harmonic loads (e.g., 1P and 3P components) are close to the structural modal frequencies, or when wind speed, rotor speed, and yaw angle vary rapidly, violating the quasi-stationary assumption. In addition, the current formulation is not suitable for damping identification after a TMD is installed due to the occurrence of double peaks in the frequency domain. Future work will focus on improving the BSD framework to mitigate these limitations and enhance its applicability under more complex operating conditions.
Author Contributions
Conceptualization, M.R., Z.F.; methodology, X.H., Z.F., J.D.; software, F.D., Y.Z.; validation, J.D., F.D., Y.Z.; formal analysis, C.Y., Z.W., J.D.; investigation, M.R., X.H., C.Y., Z.F., Z.Y., Z.W.; resources, M.R., C.Y., Z.Y.; data curation, F.D., Y.Z., Z.Y.; writing—original draft preparation, Z.F., F.D., Y.Z.; writing—review and editing, X.H., Z.F.; visualization, F.D., Y.Z., Z.W.; supervision, X.H., Z.F.; project administration, M.R., C.Y.; funding acquisition, M.R. All authors have read and agreed to the published version of the manuscript.
Funding
This research was funded by Guangdong S&T Program (No. 2022B0101100001), Young Talent Support Project of Guangzhou Association for Science and Technology (QT-2005-028), Hunan Provincial Key R&D Program Project (No. 2025JK2081) and the General Program of the Chongqing Natural Science Foundation (No. CSTB2022NSCQ-MSX1465).
Data Availability Statement
The data presented in this study are available on request from the corresponding author.
Conflicts of Interest
Mumin Rao, Chi Yu, Jiayi Deng and Zhichao Wu were employed by Guangdong Energy Group Science and Technology Research Institute Co., Ltd. Zengru Yang was employed by Guangdong Yuedian Zhuhai Offshore Wind Power Co., Ltd. The remaining authors declare that the research was conducted in the absence of any commercial or financial relationships that could be construed as a potential conflict of interest.
References
- Renewables 2020: Analysis and Forecast to 2025; International Energy Agency: Washington, DC, USA, 2020.
- Chou, J.; Ou, Y.; Lin, K. Collapse Mechanism and Risk Management of Wind Turbine Tower in Strong Wind. J. Wind Eng. Ind. Aerodyn. 2019, 193, 103962. [Google Scholar] [CrossRef]
- Tchakoua, P.; Wamkeue, R.; Ouhrouche, M.; Slaoui-Hasnaoui, F.; Tameghe, T.A.; Ekemb, G. Wind Turbine Condition Monitoring: State-of-the-Art Review, New Trends, and Future Challenges. Energies 2014, 7, 2595–2630. [Google Scholar] [CrossRef]
- Kuang, R.; Zhao, J.; Zhang, T.; Li, C. Research on Parameter Influence of Offshore Wind Turbines Based on Measured Data Analysis. J. Mar. Sci. Eng. 2025, 13, 629. [Google Scholar] [CrossRef]
- Partovi-Mehr, N.; Branlard, E.; Song, M.; Moaveni, B.; Hines, E.M.; Robertson, A. Sensitivity Analysis of Modal Parameters of a Jacket Offshore Wind Turbine to Operational Conditions. J. Mar. Sci. Eng. 2023, 11, 1524. [Google Scholar] [CrossRef]
- Qu, C.-X.; Liu, C.-C.; Yang, X.-M.; Liu, H.-J.; Li, H.-N.; Zhang, Y.-F. Modal Identification of Structures by Eliminating the Effect of the High Ocean Wind. J. Mar. Sci. Eng. 2022, 10, 1509. [Google Scholar] [CrossRef]
- Tian, S.; Wang, Z.; Zhang, C. Nonlinear Resonance Characteristics of Offshore Wind Turbines with Large Diameter Monopile Foundation. Rock Soil Mech. 2025, 46, 156–164. [Google Scholar] [CrossRef]
- Bajric, A.; Hogsberg, J.; Rüdinger, F. Evaluation of Damping Estimates by Automated Operational Modal Analysis for Offshore Wind Turbine Tower Vibrations. Renew. Energy 2018, 116, 153–163. [Google Scholar] [CrossRef]
- Dai, K.; Wang, Y.; Lu, W.; Ren, X.; Huang, Z. Investigation of the Stochastic Subspace Identification Method for On-Line Wind Turbine Tower Monitoring; Wu, H., Gyekenyesi, A., Shull, P., Yu, T., Eds.; SPIE: Bellingham, WA, USA, 2017; Volume 10169. [Google Scholar]
- Zhang, P.; He, Z.; Cui, C.; Ren, L.; Yao, R. Operational Modal Analysis of Offshore Wind Turbine Tower under Ambient Excitation. J. Mar. Sci. Eng. 2022, 10, 1963. [Google Scholar] [CrossRef]
- Zhang, C.; Han, X.; Li, C.; Leira, B.J.; Sævik, S.; Lu, D.; Shi, W.; Li, X. Modal Parameter Identification of Jacket-Type Offshore Wind Turbines Under Operating Conditions. J. Mar. Sci. Eng. 2024, 12, 2083. [Google Scholar] [CrossRef]
- Oh, S.; Ishihara, T. On the Parameter Sensitivity in Structural Parameter Identification Using Eigensystem Realization Algorithm for a MW-Size Wind Turbine; IOP Publishing: Bristol, UK, 2018; Volume 1037. [Google Scholar]
- Mieloszyk, M.; Opoka, S.; Ostachowicz, W. Frequency Domain Decomposition Performed on the Strain Data Obtained from the Aluminium Model of an Offshore Support Structure; IOP Publishing: Bristol, UK, 2015; Volume 628. [Google Scholar]
- Koukoura, C.; Natarajan, A.; Vesth, A. Identification of Support Structure Damping of a Full Scale Offshore Wind Turbine in Normal Operation. Renew. Energy 2015, 81, 882–895. [Google Scholar] [CrossRef]
- Devriendt, C.; Magalhaes, F.; Weijtjens, W.; De Sitter, G.; Cunha, A.; Guillaume, P. Structural Health Monitoring of Offshore Wind Turbines Using Automated Operational Modal Analysis. Struct. Health Monit. 2014, 13, 644–659. [Google Scholar] [CrossRef]
- Hines, E.M.; Baxter, C.D.P.; Ciochetto, D.; Song, M.; Sparrevik, P.; Meland, H.J.; Strout, J.M.; Bradshaw, A.; Hu, S.-L.; Basurto, J.R.; et al. Structural Instrumentation and Monitoring of the Block Island Offshore Wind Farm. Renew. Energy 2023, 202, 1032–1045. [Google Scholar] [CrossRef]
- Song, M.; Partovi Mehr, N.; Moaveni, B.; Hines, E.; Ebrahimian, H.; Bajric, A. One Year Monitoring of an Offshore Wind Turbine: Variability of Modal Parameters to Ambient and Operational Conditions. Eng. Struct. 2023, 297, 117022. [Google Scholar] [CrossRef]
- Bayne, S.; Giesselmann, M. Effect of Blade Passing on a Wind Turbine Output. In Collection of Technical Papers. 35th Intersociety Energy Conversion Engineering Conference and Exhibit (IECEC) (Cat. No.00CH37022); IEEE: New York, NY, USA, 2000; pp. 775–781. [Google Scholar]
- Hamdi, H.; Mrad, C.; Hamdi, A.; Nasri, R. Dynamic Response of a Horizontal Axis Wind Turbine Blade under Aerodynamic, Gravity and Gyroscopic Effects. Appl. Acoust. 2014, 86, 154–164. [Google Scholar] [CrossRef]
- Zhang, F.; Kim, C.; Goi, Y. Efficient Bayesian FFT Method for Damage Detection Using Ambient Vibration Data with Consideration of Uncertainty. Struct. Control Health Monit. 2021, 28, e2659. [Google Scholar] [CrossRef]
- Yan, W.; Katafygiotis, L. A Two-Stage Fast Bayesian Spectral Density Approach for Ambient Modal Analysis. Part I: Posterior Most Probable Value and Uncertainty. Mech. Syst. Signal Process. 2015, 54–55, 139–155. [Google Scholar] [CrossRef]
- Zhang, F.; Au, S. Fast Bayesian FFT Method for Ambient Modal Identification with Separated Modes. J. Eng. Mech. 2011, 137, 214–226, Erratum in J. Eng. Mech. 2013, 139, 545. [Google Scholar] [CrossRef]
- Bhattacharya, S. Design of Foundations for Offshore Wind Turbines, 1st ed.; Wiley: Hoboken, NJ, USA, 2019; ISBN 978-1-119-12812-0. [Google Scholar]
- Feng, Z.; Zhang, J.; Wen, Q.; Shi, S. Bayesian Spectral Decomposition Method for Identifying Modal Parameters in Long-Span Cable-Stayed Bridges under Ambient Excitation. J. Vib. Eng. 2024, 1–10. Available online: https://link.cnki.net/urlid/32.1349.TB.20240830.1706.002 (accessed on 17 October 2025). (In Chinese).
- Feng, Z.; Zhang, J.; Katafygiotis, L.; Hua, X.; Chen, Z. Bayesian Spectral Decomposition for Efficient Modal Identification Using Ambient Vibration. Struct. Control Health Monit. 2024, 2024, 5137641. [Google Scholar] [CrossRef]
- Brincker, R.; Zhang, L.; Andersen, P. Modal Identification of Output-Only Systems Using Frequency Domain Decomposition. Smart Mater. Struct. 2001, 10, 441–445. [Google Scholar] [CrossRef]
- Guo, L.; Xu, Z.; Sun, Y.; Bai, Z.; Li, H.; Yao, S. Effect of Initial Shear Stress on Soft Clay around Monopile and Natural Frequency of Offshore Wind Turbine Structure. Soil Dyn. Earthq. Eng. 2025, 191, 109265. [Google Scholar] [CrossRef]
- Greś, S.; Döhler, M.; Mevel, L. Uncertainty Quantification of the Modal Assurance Criterion in Operational Modal Analysis. Mech. Syst. Signal Process. 2021, 152, 107457. [Google Scholar] [CrossRef]
- Jiang, J.; Lian, J.; Dong, X.; Zhou, H. Research on the Along-Wind Aerodynamic Damping and Its Effect on Vibration Control of Offshore Wind Turbine. Ocean Eng. 2023, 274, 113993. [Google Scholar] [CrossRef]
Disclaimer/Publisher’s Note: The statements, opinions and data contained in all publications are solely those of the individual author(s) and contributor(s) and not of MDPI and/or the editor(s). MDPI and/or the editor(s) disclaim responsibility for any injury to people or property resulting from any ideas, methods, instructions or products referred to in the content. |
© 2025 by the authors. Licensee MDPI, Basel, Switzerland. This article is an open access article distributed under the terms and conditions of the Creative Commons Attribution (CC BY) license (https://creativecommons.org/licenses/by/4.0/).