Abstract
Saltwater intrusion increasingly jeopardizes groundwater in low-lying coastal plains worldwide, where the combined effects of sea-level rise, land subsidence, and hydraulic regulation further exacerbate aquifer vulnerability and threaten the long-term sustainability of freshwater supplies. To move beyond sparse and fragmented piezometric observations, we propose “integrated coastal supersites”: wells equipped with multiparametric sensors and multilevel piezometers that couple high-resolution vertical conductivity–temperature–depth (CTD) profiling with continuous hydro-meteorological time series to monitor the hydrodynamic behavior of coastal aquifers and saltwater intrusion. This study describes the installation of two supersites and presents early insights from the first monitoring period, which, despite a short observation window limited to the summer season (July–September 2025), demonstrate the effectiveness of this approach. Two contrasting supersites were deployed in the coastal plain between the Brenta and Adige Rivers (Italy): Gorzone, characterized by a thick, laterally persistent aquitard, and Buoro, where the aquitard is thinner and discontinuous. Profiles and fixed sensors at both sites reveal a consistent fresh-to-saline transition in the phreatic aquifers and a secondary freshwater lens capping the confined systems. At Gorzone, the confining layer hydraulically isolates the deeper aquifer, preserving low salinity beneath a saline, tidally constrained phreatic zone. Groundwater heads oscillate by about 0.2 m, and rainfall events do not dilute salinity; instead, pressure transients—amplified by drainage regulation and inland-propagating tides—induce short-lived EC increases via upconing. Buoro shows smaller water-level variations, not always linked to rainfall, and, in contrast, exhibits partial vertical connectivity and faster dynamics: phreatic heads respond chiefly to internal drainage and local recharge, with rises rapidly damped by pumping, while salinity remains steady without episodic peaks. The confined aquifer shows buffered, delayed responses to surface forcings. Although the monitoring window is currently limited to 2025 through the summer season, these results offer compelling evidence that coastal supersites are reliable, scalable, and management-critical relevance platforms for groundwater calibration, forecasting, and long-term assessment.
1. Introduction
Saltwater intrusion in coastal aquifers is a complex process driven by interaction among multiple hydrological, hydrogeological, and human factors, including tidal oscillations, pumping from reclamation facilities, river discharges, precipitation, and drainage management [1,2]. Climatic and meteorological influences, such as precipitation patterns, temperature trends, and long-term sea-level rise, also affect groundwater recharge and aquifer sustainability [3,4]. Furthermore, the intrinsic hydrogeological properties of the aquifer, such as its stratigraphic configuration and permeability distribution, significantly influence the extent and dynamics of saltwater intrusion [5]. Additionally, extreme events such as storm surges or unusual tidal fluctuations can cause short-term pulses of saline intrusion, resulting in lasting impacts on groundwater quality [6,7]. A thorough understanding of these processes requires integrating hydrological, hydrogeological, geochemical, and climatic data to develop reliable predictive models and effective management strategies [8,9].
Monitoring networks are crucial for assessing and managing saltwater intrusion, but conventional approaches—dependent on large numbers of piezometers measured infrequently and at different times—are expensive to operate, difficult to maintain, and prone to bias and data gaps [10,11]. Over time, many wells become lost, clogged, or abandoned, and their scattered locations hinder the monitor system-wide processes and interactions among the main intrusion drivers. As a result, datasets frequently became fragmented, unevenly distributed, and inconsistent over time, which hampers long-term evaluations and predictive modeling [11]. Similar issues have been observed in international case studies, such as in Mekong delta [12], the coastal regions of North America (USA) [8], Everglades National Park (Florida, USA) [13], Niger and Utah (USA) [14] and the coastal plain south of the Venice Lagoon (Italy) [15] where extensive but poorly coordinated monitoring efforts limited the understanding of groundwater–seawater interactions.
To overcome these challenges, strategically placed “supersites” offer a more effective and interconnected monitoring framework. Equipped with multi-parametric and multi-level instruments, supersites are designed to capture key processes influencing groundwater dynamics and saltwater intrusion with high temporal resolution. Integrating groundwater, surface water, and climate measurements within each supersite enhances understanding of driver–response relationships, ensures data continuity, and reduces operational costs [16,17,18,19]. Compared to traditional monitoring wells [20,21], supersites are easier to manage, more resilient to system degradation, and deliver high-quality datasets for both scientific research and water management.
Within this framework, one of the main objectives of the SWAMrisk project is to establish an observational network dedicated to monitoring saltwater intrusion in the coastal plain between the Venice Lagoon and the Po Delta (Figure 1). In this network, supersites serve as strategic monitoring locations equipped with advanced instruments, including multi-level piezometers and sensors for measuring water level, electrical conductivity, and temperature. These sites are located in representative and critical areas where processes such as saltwater intrusion, groundwater-level changes, contaminant transport, and interactions between shallow and deep aquifers can be effectively studied. Supersites are designed to gather high-frequency, high-quality data, potentially in near real time, which are essential for early-warning systems, model calibration, and vulnerability assessment.
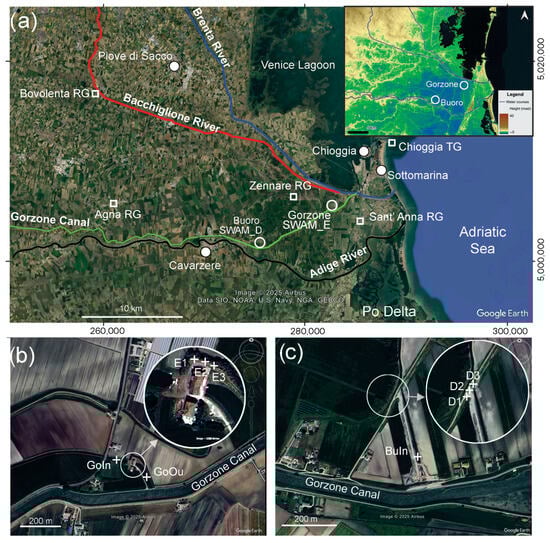
Figure 1.
(a) Map of the study area showing the locations of the Gorzone (SWAM_E) and Buoro (SWAM_D) supersites (white circles), the Chioggia tide gauge (TG), the drainage-system nodes—Gorzone outflow (GoOu), Gorzone intake (GoIn), and Buoro intake (BuIn)—and the rain-gauge stations of Sant’Anna (RG), Zennare (RG), Agna (RG), and Bovolenta (RG). The Gorzone Canal is shown in green, the Adige River in black, the Brenta River in blue, and the Bacchiglione River in red. Main urban centers are indicated with white dots. A digital elevation model (TanDEM-X 30m) of the study area is shown as an inset [22]. Projection: UTM Zone 33N (WGS84). Close-up maps of the Gorzone supersite (b) and Buoro supersite (c) show the locations of piezometers E1–E3 and D1–D3, respectively.
They serve as reference points for validating numerical models and assessing future groundwater use and climate-stress scenarios.
This paper aims to present the conceptual design, instrumentation, and siting rationale of two coastal supersites in the plain south of the Venice Lagoon. It also uses an initial short record collected during the summer season (July–September 2025) to demonstrate their added value as a novel, sustainable, and scientifically sound framework for monitoring and managing vulnerable coastal aquifers under climate and human pressures. This early analysis provides proof of concept for the supersite approach, while a comprehensive long-term assessment based on multi-year time series will be developed in future work. Compared with traditional regional networks in the Venice coastal plain—which rely on numerous single-screen wells measured at low frequency and often with incomplete vertical information—the proposed supersites introduce three main innovations. First, they shift from sparse, spatially extensive but temporally fragmented observations to a few strategically located sites providing high-frequency, multi-parameter time series and repeated CTD profiling. Second, they explicitly resolve vertical hydraulic and salinity gradients through multilevel installations rather than inferring them from distributed but shallow piezometers. Third, they co-locate groundwater, surface-water, and meteorological measurements to capture local driver–response relationships (tides, drainage, pumping, recharge) within a single integrated node. These features make the supersite concept fundamentally different from, and complementary to, existing regional monitoring networks, and provide a transferable blueprint for upgrading coastal groundwater observation systems elsewhere.
2. Study Area
The study area is along the northern Adriatic coast of Italy, between the Adige and Brenta rivers (Figure 1), covering low-lying coastal plains, lagoon systems, and reclaimed lands shaped by Holocene sedimentation and centuries of anthropogenic intervention [23]. The landscape features a flat deltaic morphology with elevations mainly 3–4 m below mean sea level (MSL) [22] and seldom more than a few meters above, making the area highly susceptible to flooding and saltwater intrusion [21].
The climate is humid and temperate, strongly influenced by the Adriatic Sea effect, which moderates temperature extremes and maintains high humidity throughout the year. Average annual air temperatures range from 13 to 14 °C, with seasonal averages of about 8.8 °C in winter and 28.7 °C in summer, reflecting hot, humid summers and relatively mild winters. Annual precipitation averages 800–1000 mm, mainly falling in spring and autumn [24,25]. At nearby monitoring stations in Sant’Anna and Agna (Figure 1), the average annual rainfall is about 1135 mm and 535 mm, respectively, consistent with the regional pattern. In recent decades, the area has experienced greater year-to-year rainfall variability and more frequent summer droughts [26], resulting in reduced groundwater recharge and an increased risk of aquifer salinization. Recent climate reports [27,28] indicate that 2023 was the warmest year on record, with average annual air temperatures of 12.7 °C across the Veneto region, while 2022 was among the driest years since 1993, with approximately 770 mm of annual rainfall, significantly below the long-term average of about 1120 mm.
These hydroclimatic pressures are exacerbated by relative sea-level rise (RSLR), representing one of the most critical threats to the stability of northern Adriatic coastal systems [29]. RSLR results from the combined effect of global eustatic sea-level rise—approximately 3.6 mm/yr, based on the Trieste tide-gauge data since the 1990s [30,31]—and local land subsidence. Land subsidence generally ranges from negligible to 5–6 mm/yr, with a typical increase in gradient from north to the Po Delta [32,33,34] due to natural sediment compaction, groundwater extraction, and peat oxidation [35]. Projections for the northern Adriatic indicate relative sea-level increases of +0.5–0.8 m by 2100, depending on the emission scenario [36].
From a hydrogeological perspective, the coastal plain contains a multilayer aquifer system composed of a shallow unconfined aquifer and several deeper confined units, separated by discontinuous silty–clayey aquitards [37]. Since the early twentieth century, extensive land reclamation has transformed the area, creating a dense network of drainage canals and pumping stations that control groundwater levels and protect farmland below sea level from flooding. Agriculture remains the primary land use and relies heavily on surface water for irrigation. Groundwater recharge mainly occurs through rainfall infiltration, river seepage, and irrigation return flows, but it is increasingly constrained by the artificial drainage network [18]. This altered hydrogeological setting, along with ongoing subsidence, sea-level rise, and climate variability, has altered the natural hydrological balance and greatly increased the vulnerability of the coastal aquifer system to saltwater intrusion [21,38].
Overall, this coastal plain is a critical hotspot where geomorphological, climatic, and anthropogenic factors converge to exacerbate aquifer salinization [39], underscoring the need for dedicated groundwater monitoring supersites for long-term observation and management.
3. Materials and Methods
3.1. Site Selection
Supersites are designed to identify and understand groundwater dynamics through continuous monitoring of key hydrogeological parameters such as groundwater level, salinity, and temperature, as well as related factors including interactions with surface water bodies (sea, lagoons, rivers, and drainage channels) and meteorological conditions. Therefore, coastal supersites should be equipped not only for groundwater monitoring but also for observing surface water, weather conditions, and, when possible, land subsidence. If full instrumentation is not feasible at the same location, nearby monitoring stations can provide the necessary data. This integrated approach ensures that the multiple drivers of saltwater intrusion and coastal vulnerability are jointly captured, increasing the scientific and management benefits of the supersite.
Additionally, supersites provide high-quality datasets for hydrogeological modeling, supporting the estimation of future groundwater availability, the assessment of aquifer vulnerability, and the development of sustainable water management strategies in coastal areas.
In June 2025, two new supersites were established at Punta Gorzone (SWAM_E) and Buoro (SWAM_D), within the management area of the Consorzio di Bonifica Adige Euganeo. Each supersite is located next to its respective pumping station, which also gives its name, ensuring direct hydraulic relevance to the local drainage and reclamation network (Figure 1). The supersites were selected for their hydrogeological representativeness, proximity to the channels hydraulically connected to the sea and subject to tidal oscillation, and documented vulnerability to saline intrusion. This configuration provides optimal conditions for long-term monitoring of groundwater and salinity dynamics in the coastal plain between the lower Brenta–Bacchiglione and Adige River systems.
The two monitoring sites are at different distances from the coastal boundary, which represents the main source of saltwater. Punta Gorzone is about 2 km from the Venice Lagoon, 6 km from the Po delta lagoons, and 7 km from the Adriatic Sea, while Buoro is farther inland, about 10 km from both the Venice and Po lagoons, and 15 km from the sea. The Gorzone Canal, an additional hydro-geomorphological control on groundwater, is about 150–300 m from both sites. It flows into the sea approximately 7 km downstream of Punta Gorzone and 15 km downstream of Buoro. As a result, the canal is affected by tidal oscillations, which propagate inland and transmit marine influence to the monitoring area, affecting both surface water levels and groundwater dynamics at the supersites.
In both supersites, the monitored aquifer system consists of an unconfined aquifer overlying a confined aquifer. These groundwater bodies are separated by aquitards of variable thickness, being relatively thick at Gorzone and thin at Buoro. At both sites, the confined aquifer is hosted in medium- to fine-grained sands, locally interbedded with thin layers of silt, clay, and peat, which are interpreted as Pleistocene alluvial deposits. The upper limit of this aquifer is marked by the pedogenic Caranto layer, located at approximately 20 m below the surface in Gorzone and 15 m depth in Buoro. The phreatic aquifer consists of a ~14 m-thick succession of fine- to coarse-grained sands, locally interbedded with thin layers of silt and clay, interpreted as Holocene fluvio-deltaic and lagoonal facies. Groundwater recharge to the phreatic aquifer is primarily supplied by direct precipitation over the study area and by infiltration from surface water bodies (rivers and channels). In contrast, recharge of the shallow confined aquifer occurs to the NW–W, between the study area and the Euganean Hills (e.g., [20,21,40]).
3.2. Characteristics of the Piezometers
After core recovery, standard PVC pipes with micro-screened sections were installed in the boreholes. The screened intervals were defined based on sediment cores collected during drilling, to intercept both the unconfined and confined aquifers across the intervening aquitard layers. Properly graded filter gravel was then placed around the screened interval to ensure good hydraulic connection while limiting the entry of fine sediment.
The elevations of the piezometer heads and the surrounding ground surface were measured using a Real-Time Kinematic Differential GPS (RTK-DGPS) system. This method provided vertical accuracy within a few millimeters, enabling the determination of absolute elevations with sub-centimeter precision, which is critical for accurate assessment of hydraulic heads and groundwater gradients [41]. The final configuration of the screened sections is summarized in Table 1.

Table 1.
Depth below ground surface (BGS) and above mean sea level (AMSL) of the top and bottom of the filters.
3.3. Groundwater Vertical Profiling
The freshwater–seawater interface was investigated through repeated vertical electrical conductivity (EC) profiling, using conductivity–temperature–depth (CTD) submersible dataloggers in properly screened piezometers.
Profiling campaigns were conducted in both unconfined and confined aquifers to initially characterize saltwater contamination. Data were collected at one-second intervals, enabling high-resolution detection of salinity gradients.
Multiple vertical profiles were collected frequently before installing fixed probes to identify optimal monitoring depths, and then at approximately monthly intervals after installation to continue the vertical characterization of groundwater dynamics.
To ensure comparability under consistent weather conditions, piezometers were measured within the same campaign for each survey.
3.4. Continuous and Real-Time Groundwater Monitoring
A continuous monitoring network was implemented to resolve saltwater-intrusion dynamics at high temporal resolution and relate them to hydrological, meteorological, and tidal forcings. CTD loggers were installed at fixed depths in both unconfined and confined aquifers, as well as in adjacent surface-water bodies where relevant. Each piezometer was equipped with at least one CTD sensor connected to a modem for near-real-time telemetry. Each modem is equipped with a barometric sensor that adjusts groundwater-pressure measurements for atmospheric pressure variations, thereby deriving groundwater levels.
Sensor placement was guided by pre-deployment vertical EC profiles, positioning each logger within the expected fresh–saline mixing zone. In long-screened piezometers tapping unconfined aquifers, where vertical salinity variability is high, two loggers were installed—one near the top and one near the bottom of the screened interval—to capture both stratification and upconing. Frequent follow-up profiling campaigns were carried out as needed to verify and, if necessary, adjust the installation depths.
Continuous measurements were collected every 10 min, a frequency adequate to resolve tidal signals and other low-frequency disturbances (e.g., pumping cycles, irrigation withdrawals). For near-real-time data acquisition, loggers were connected to cellular modems that transmitted data daily to a central server. Automated routines generated alerts whenever user-defined salinity (i.e., EC) thresholds were exceeded, enabling rapid assessment of short-term events and emerging risks.
This setup served two main purposes: (i) continuous monitoring of groundwater and salinity intrusion patterns, and (ii) an early-warning system for detecting deteriorating aquifer conditions. The combination of repeat profiling (to locate and track the mixing interface) and fixed-depth time series (to assess persistence and changes) underpinned all deployment and maintenance decisions.
3.5. Instrumentations
The probes consist of CTD-Diver® instruments (Van Essen Instruments, Delft, The Netherlands). According to the manufacturer, their technical specifications are as follows: water pressure: range 0–50 m H2O, accuracy ±2.5 cm H2O; temperature: range −20–80 °C, accuracy ± 0.1°C; electrical conductivity: range 0–120 mS/cm, accuracy ±1% of reading.
For all CTD Divers® (both those used during vertical profiling campaigns and those installed as fixed probes), EC calibration was performed at four calibration points (1.41, 5.00, 12.88, and 80.00 mS/cm) before deployment, with re-calibration scheduled every six months.
Barometric sensors used to compensate water pressure measurements for atmospheric pressure are Van Essen Instruments’ Divers® DI500, with a stated accuracy of ±0.5 cm H2O.
Telemetry systems consist of a Global Data Transmitter (GDT-S Prime) modem equipped with a SIM card and internal sensors for barometric pressure (±2 mbar) and temperature (±0.8 °C at 25 °C). Data acquired by CTD divers attached to each modem is transmitted via email every 15 min and made available on the manufacturer’s web portal (DataViewer).
3.6. Third-Party Meteorological Stations
Rain gauges operated by the Consorzio di Bonifica Adige Euganeo were integrated with meteorological and hydrological stations managed by ARPAV (https://www.ambienteveneto.it/datiorari (accessed on 15 October 2025)) and ISPRA (https://www.isprambiente.gov.it/it (accessed on 15 October 2025)) into the supersite monitoring system (Figure 1).
4. Results
4.1. Supersites Monitoring Implementation
Based on borehole cores and lithological logs, three adjacent piezometers were installed at each site to thoroughly characterize the vertical structure and salinity distribution of the aquifer system being monitored. The screened intervals were designed to intercept both the unconfined and confined aquifers across the intervening aquitard layers (Table 1). Specifically, piezometers SWAM_E1 (Gorzone) and SWAM_D1 (Buoro) monitor the phreatic aquifer, whereas SWAM_E2–E3 and SWAM_D2–D3 monitor the upper and deeper portions, respectively, of the underlying confined aquifer systems.
Several vertical CTD vertical profiling campaigns were carried out prior to probe installation to obtain an initial characterization of saltwater contamination and delineate the transition zones where salinity gradients develop.
The piezometers were equipped with fixed CTD sensors (E1up, E1bot, E2, E3, and D1up, D1bot, D2, D3) connected to near–real-time telemetry systems. In piezometers exhibiting a well-stratified water column and the characteristic knee-shaped EC profile associated with a saline interface, two sensors were installed—one in the upper part and one in the lower part of the aquifer—to resolve vertical variability in groundwater levels and salinity (Table 2 and Figure 2).
Table 2.
Depth below ground surface (BGS) and above mean sea level (AMSL) for the fixed probes installed in the piezometers.
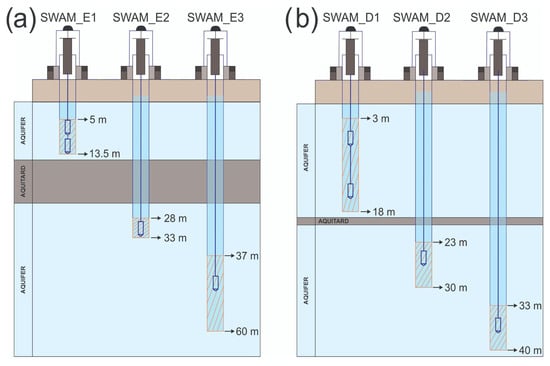
Figure 2.
Sketch of the main hydro-stratigraphic units, screened sections, and probe positions: (a) supersite Gorzone (SWAM_E piezometers) and (b) supersite Buoro (SWAM_D piezometers).
Monitoring at both supersites was supplemented by surface water and rainfall observations to provide an integrated understanding of hydrological dynamics. Surface-water levels are monitored within the drainage channel networks that convey flows toward the pumping station intakes (Gorzone and Buoro intakes), as well as in the receiving rivers and channels (Gorzone outflow) where the pumped water is discharged (Figure 1). Rain gauges operated by the Consorzio di Bonifica Adige Euganeo were integrated with meteorological and hydrological stations managed by ARPAV and ISPRA into the supersite monitoring system, providing additional climate data both adjacent to the supersites and across inland recharge areas. In this study, the rain-gauge stations of Sant’Anna, Zennare, Agna, and Bovolenta were selected (Figure 1). Their spatial distribution helps explain potential differences in groundwater response between the phreatic and confined systems: the former is more sensitive to local meteoric inputs, while the latter is primarily controlled by regional flow dynamics and boundary conditions.
4.2. Early Insights from Supersite Monitoring Observations
4.2.1. Structure and Dynamics of Groundwater Salinity
Analysis of electrical conductivity profiles at the Gorzone (SWAM_E piezometers) and Buoro (SWAM_D piezometers) sites provides an initial picture of saltwater contamination. It allows a preliminary inference on temporal variability within the coastal aquifer system.
At Gorzone, the phreatic piezometer E1 shows a large variability in EC values, ranging from 2 to 18 mS/cm in the upper part and reaching 28 mS/cm at the bottom of the phreatic aquifer, with seasonal oscillations (Figure 3a). The upper part of the confined aquifer (E2) displays low and nearly constant EC values, between 2 and 2.5 mS/cm, indicating the presence of a secondary fresh/brackish layer within the confined sequence (Figure 3a). Beneath this layer, the deeper part of the confined aquifer (detected by piezometer E3) (Figure 3a) is more saline, with EC ranging from 4 to 12 mS/cm, which remains relatively stable through time and depth.
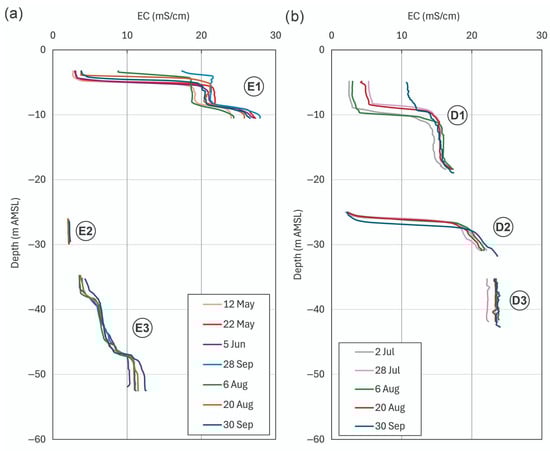
Figure 3.
EC vertical profiles at (a) Gorzone (SWAM_E) and (b) Buoro (SWAM_D) sites, measured from May to September 2025.
At Buoro, electrical conductivity profiles from the phreatic aquifer (D1) show a pronounced fresh-to-saline gradient at approximately 10 m AMSL (Figure 3b). A thick low-salinity layer, with EC between 2 and 10 mS/cm, is present in the upper fresh-to-brackish interval, increasing downward to nearly constant values of approximately 15 mS/cm at the base. In the confined aquifer D2 (Figure 3), a thin freshwater cap lies above saline water, consistent with effective confinement given the elevated salinity at the base of the phreatic zone. Downward, EC quickly exceeds 20 mS/cm. The deep confined aquifer D3 (Figure 3b) hosts the highest and most stable salinity levels, with EC between 22 and 24 mS/cm, indicating the persistence of a saline groundwater body. The combination of a thin freshwater lens and modest temporal variability in the upper confined aquifer implies limited saline leakage through the aquitard with mixing into the freshwater layer, whereas the nearly constant EC at depth points to a persistent input from deeper saline strata.
The four probes installed at each site overcome, at least in part, the limitations of monthly, irregular CTD deployments by providing continuous, better-resolved groundwater data. Fixed at distinct depths, the array shifts the monitoring approach from relying on high vertical resolution (CTD profiles) to providing high temporal resolution at four levels, thereby capturing the vertical and temporal dynamics of both the phreatic and confined aquifers. Although four probes are installed at each site, only two distinct groundwater levels are effectively measured—phreatic and confined—since E1up–E1bot and D1up–D1bot monitor the upper and lower sections of the phreatic aquifer, whereas E2–E3 and D2–D3 target the shallow and deeper zones of the confined system.
Groundwater levels are broadly comparable at the two sites. At the Gorzone site (Figure 4a), GWL in the phreatic aquifer (E1) fluctuates between −3.3 and −3.1 m AMSL, while smaller variations are observed in the confined aquifer (E2–E3), which remains at a higher level between −1.3 and −1.15 m AMSL. Similarly, at the Buoro site (Figure 4b), the phreatic groundwater level (GWL) (D1) ranges from −4.5 to −4.3 m AMSL, while the confined levels (D2–D3) show only minor fluctuations, from −3.8 to −3.7 m AMSL.
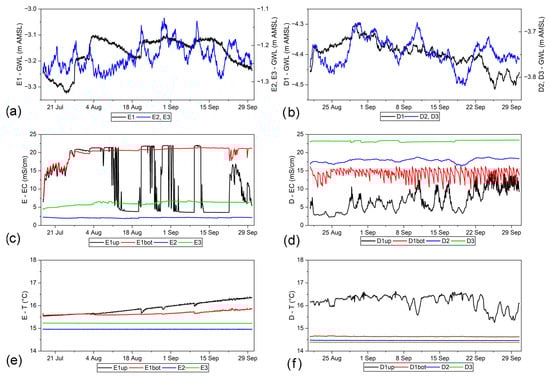
Figure 4.
Continuous time series of groundwater level (a,b), electrical conductivity (c,d), and temperature (e,f) recorded hourly at the Gorzone (SWAM_E, left panels) and Buoro (SWAM_D, right panels) supersites.
Regarding EC behavior at Gorzone (Figure 4c), E1up ranges from 3 to 20 mS/cm, reflecting alternating phases of saline upconing and freshwater recharge, whereas E1bot remains higher and more stable (~20 mS/cm), indicating persistent salinity at the base of the phreatic aquifer. Notably, the EC pattern in E1up is characterized by abrupt changes followed by relatively stable maximum and minimum values. This behaviour is likely driven by natural processes, such as rainfall events, that rapidly modify EC until a new equilibrium is reached. EC in E2 is low and nearly constant (~2 mS/cm), representing fresh, well-confined water, while EC in E3 is moderately higher (~6 mS/cm), consistent with slow salinization at depth and long residence times.
At the Buoro site (Figure 4d), EC also increases with depth, albeit more gradually. The upper part of the phreatic aquifer (D1up) ranges from 2 to 16 mS/cm and shows no systematic relationship with water-level changes. In comparison, EC in the bottom part (D1bot) is higher (10–17 mS/cm) and more stable, although it exhibits small high-frequency variations. The upper part of the confined aquifer (D2) displays intermediate values (16–19 mS/cm), and the bottom (D3) the highest (~23 mS/cm), consistent with progressive downward salinization.
Regarding temperature dynamics, at the Gorzone site (Figure 4e), in the phreatic aquifer E1 increases slightly over time (from 15.4 to 16.4 °C), indicating seasonal warming, whereas in the confined aquifer (E2–E3) it remains nearly constant (~15 °C). At the Buoro site (Figure 4f), temperature variability is greater in the upper part of the phreatic aquifer (D1up: 15.3–16.6 °C), with short-term oscillations and gradual cooling during late summer, while more stable conditions are observed at the bottom (D1bot: ~14.6 °C), and confined levels (D2–D3) remain stable at 14.4–14.5 °C.
4.2.2. Hydro-Meteorological Controls on Groundwater Behavior
A preliminary characterization is proposed to explore potential relationships among groundwater dynamics in coastal aquifers, tidal forcing, and drainage water levels regulated by pumping stations.
Because the Gorzone Canal is directly connected to the sea via the mouth of the Brenta River, the first step in the analysis was to assess the correlation between sea-level oscillations recorded at the Chioggia tide gauge and the water levels observed at the outflow section of the Gorzone pumping station. The time series show similar amplitudes and a consistent phase pattern (Figure 5). To identify the optimal phase shift between the two signals, a cross-correlation analysis was performed on 10 min water-level time series, with time lags of ±12 h. The results show a very strong correlation (r = 0.98) between the tidal signal at Chioggia and the Gorzone outflow water level, with an optimal lag of approximately −2.8 h, indicating that sea level variations at Chioggia precede those observed at the Gorzone outflow by nearly three hours.
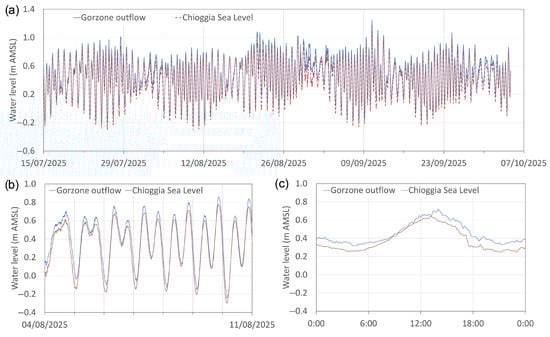
Figure 5.
Comparison between tidal fluctuations at Chioggia (used as a proxy for sea level) and water levels in the Gorzone Canal at the outflow of the Gorzone pumping station. (a) Time series from July to October 2025 shows the clear tidal modulation of canal water level; (b) detailed view (4–11 August 2025) highlights the semi-diurnal tidal signal; (c) zoomed-in hourly pattern illustrates the phase lag of tidal propagation between sea level and the water level at the Gorzone outflow station.
In contrast, drainage levels at the Gorzone and Buoro intakes (Figure 6) exhibit smaller fluctuations and remain generally stable (≈−3.8 to −4.3 m AMSL). Although they do not show a simple, direct imprint of the tidal signal, their dynamics are consistent with threshold-controlled pumping superimposed on mixed external forcing—including attenuated tidal influence transmitted inland, episodic rainfall/runoff inputs, and groundwater inflows. Consequently, intake levels rise toward a pump-start threshold and then fall toward a pump-stop threshold, with cycle durations determined by operations and local storage, which are modulated by these hydrometeorological and groundwater drivers rather than by tide alone (Figure 6).
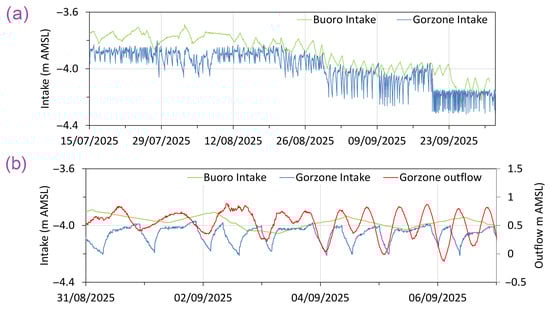
Figure 6.
Water levels at the Gorzone and Buoro pumping stations for July–September 2025 (a), and 1-week zoom (31 August–7 September 2025) showing intakes (left axis) and outflow (right axis) (b).
As rainfall is a primary source of freshwater recharge for the coastal aquifer system, its impact on groundwater dynamics was also examined. Precipitation data from the Sant’Anna and Zennare stations, near the Gorzone and Buoro supersites, respectively, are assumed to directly affect the shallow phreatic aquifers (E1up–E1bot, and D1up–D1bot) and may also enhance downward leakage and partial recharge toward the confined units (E2–E3, and D2–D3). Conversely, the Agna and Bovolenta stations are farther inland, where precipitation primarily supports recharge processes that sustain deeper groundwater flow toward the confined aquifer system in the coastal area. During the analyzed period, precipitation showed a markedly intermittent pattern, with short, high-intensity events separated by dry intervals (Figure 7). The coastal stations of Sant’Anna and Zennare recorded slightly higher rainfall amounts and event frequency than the inland stations of Agna and Bovolenta, indicating a spatial gradient of precipitation intensity from east to west.
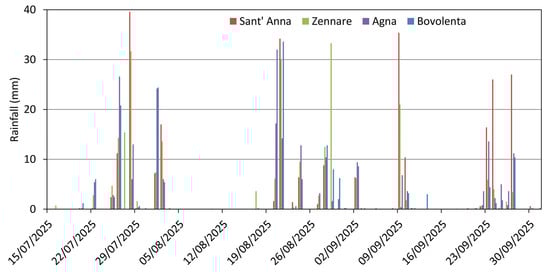
Figure 7.
Daily cumulative precipitation recorded at the Sant’Anna, Zennare, Agna, and Bovolenta meteorological stations.
The temporal evolution of GWL, EC, and T in both the phreatic and confined aquifers at Gorzone and Buoro supersites, along with daily rainfall data from nearby meteorological stations, offers valuable insights into the dynamic relationship between atmospheric forcing and subsurface response (Figure 8).
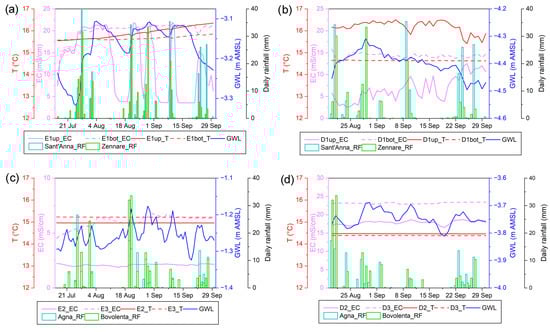
Figure 8.
Time-series comparison between the Gorzone (SWAM_E) and Buoro (SWAM_D) supersites (left and right panels, respectively) and daily rainfall recorded at the nearby Sant’Anna and Zennare stations (phreatic recharge) and the inland Agna and Bovolenta stations (confined recharge). Groundwater level (GWL), electrical conductivity (EC), and temperature (T) are shown for (a,b) phreatic aquifers and (c,d) confined aquifers.
In the phreatic aquifer at Gorzone (Figure 8a), GWL oscillates between −3.1 and −3.3 m AMSL, with brief variations following rainfall events recorded at Sant’Anna and Zennare. This pattern indicates a noticeable sensitivity of the shallow aquifer to local meteoric inputs, with recharge strongly controlled by the nearby pumping station. EC values in E1up exhibit a distinctive feature: they increase during or shortly after rainfall events, even when the GWL temporarily rises. Temperature shows only minor inflections associated with rainfall events.
At Buoro (Figure 8b), the phreatic GWL remains between −4.5 and −4.3 m AMSL, and EC (D1up–D1bot) ranges from 3 to 16 mS/cm, with the irregular post-rainfall GWL response indicating dominant drainage-system control. Short-term decreases in temperature in the upper phreatic aquifer are consistent with meteoric recharge, whereas the basal zone shows no thermal response. Despite these transient cooling events, the upper layer remains warmer than the deeper zone.
At Gorzone, the confined aquifer (E2–E3) exhibits non-unique GWL rises corresponding to rainfall recorded at Agna and Bovolenta (Figure 8c), suggesting that other processes also govern the observed variability, and that recharge from inland could be delayed and/or attenuated. EC in the upper confined level (E2) is consistently low, while the lower level (E3) exhibits a trend response that broadly tracks rainfall. Temperatures show no influence from rainfall and remain steady over the entire period.
The confined aquifer at Buoro (D2–D3) exhibits a modest groundwater-level increase associated with rainfall at Agna and Bovolenta (Figure 8d). Electrical conductivity reveals a persistent salinity gradient that intensifies slightly during wet periods, in alignment with the GWL rises. Temperatures remain largely stable during the entire analyzed period.
5. Discussion
A combined profiling–logging approach was crucial for a better understanding of the coastal aquifer system. By coupling CTD-based vertical profiling with a continuous fixed-depth logging array, it was possible to (a) comprehensively characterize, at high vertical resolution, the occurrence and layering of fresh–saltwater within the aquifers; (b) identify, at high temporal resolution, short-term dynamics driven by meteoclimatic forcing and human regulation; (c) separate changes caused by canal/pumping operations from those due to infiltration/recharge, clarifying the mechanisms controlling fresh–saltwater dynamics; and (d) detect and quantify response-time lags among interdependent parameters.
In both Gorzone and Buoro, vertical profiles and fixed-depth records consistently reveal a two-layer structure: a phreatic aquifer lies above a hydraulically separated confined aquifer. At each location, a thin freshwater layer overlies more saline water at depth. Deep temperatures remain nearly constant, indicating limited short-term advective exchange in the deeper zones (Figure 3a,b and Figure 4). Hydraulically, phreatic heads at both sites fluctuate within a narrow range, largely controlled by drainage-network management (pumping thresholds and canal-stage regulation). In contrast, confined heads are relatively steadier and more buffered than their phreatic counterparts (Figure 4). This head behavior is reflected in the salinity field: both sites show persistent vertical stratification, with fresher water in the upper phreatic zone and higher EC levels at depth. In the confined aquifer, a fresher upper layer sits above more saline water at greater depths. Over short time scales, EC fluctuations are less affected by rainfall impulses, highlighting the dominance of hydraulic controls over event-scale meteoric signals (Figure 4 and Figure 8). Consistent with this, neither site shows an immediate, strong freshening of the phreatic aquifer after rainfall; instead, canal levels and operational thresholds generate pressure transients that control short-term responses, sometimes mobilizing the fresh–saline interface rather than diluting it (Figure 5, Figure 6 and Figure 8).
These observations support a dual-forcing conceptual model in which fast, local “mechanical” controls (such as canal-stage changes and pumping thresholds) influence near-surface transients, while slow, regional “hydrological” controls (including inland recharge and density-driven adjustment) govern the confined units and their freshwater caps (Figure 5, Figure 6 and Figure 8). The main differences lie in the phreatic salinity structure and how confined aquifers respond. At Gorzone, the phreatic zone is more responsive to pressure transients; shallow EC can rise during or shortly after rain due to interface mobilization caused by canal operations, rather than dilution (Figure 5, Figure 6 and Figure 8a). At Buoro, the phreatic aquifer shows a sharper, more orderly transition from fresh to saline water, with a thick low-salinity layer (~2–8 mS/cm) grading to about 15 mS/cm at the base (Figure 3b). In the confined aquifers, Gorzone (E2–E3) displays strong hydraulic separation: E2 remains fresh and stable, while E3 is moderately saline with subdued variability and no obvious direct, event-scale rainfall signal (Figure 8c). Conversely, Buoro (D2–D3) shows slight rainfall-related increases in GWL during wetter inland periods, along with small EC rises—delayed and weaker compared to surface inputs (Figure 8d). These differences align with aquitard architecture: Gorzone has a thicker or more continuous aquitard that maintains isolation and stabilizes the confined freshwater cap, while Buoro likely has a thinner or more discontinuous aquitard, allowing partial vertical connectivity and imparting a subtle inland-recharge signal in the confined unit.
The monitoring results is sketched into a conceptual model (Figure 9) that summarizes the vertical salinity structure and dominant hydrological controls in the shallow phreatic (E1up/D1up), deep phreatic (E1bot/D1bot) and confined aquifers (E2–E3; D2–D3) at Gorzone and Buoro, highlighting the roles of recharge, tidal and drainage forcing, and aquitard continuity in shaping fresh–brackish–saline groundwater distributions. This model reflects preliminary results from a relatively short observation period and therefore does not yet provide a comprehensive description of groundwater dynamics.
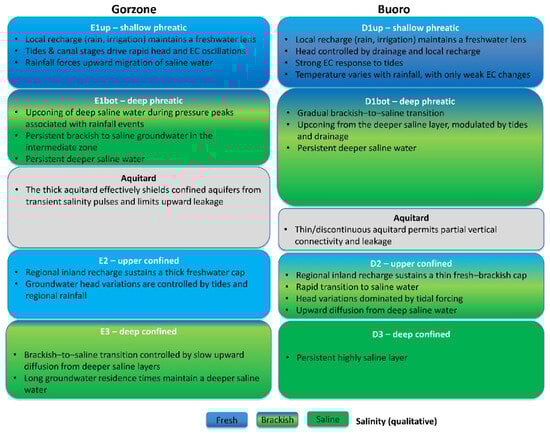
Figure 9.
Conceptual model of the vertical groundwater salinity structure and controlling processes at the Gorzone (left) and Buoro (right) sites. For each site, the shallow and deep phreatic (E1up/D1up, E1bot/D1bot) and upper and deep confined aquifers (E2–E3; D2–D3), separated by an aquitard of variable thickness and continuity, are summarized in terms of dominant recharge mechanisms, tidal and drainage forcing, vertical leakage, and the persistence of fresh, brackish and saline groundwater. Colors indicate qualitative salinity classes (fresh, brackish, saline).
This combined perspective recommends site-specific management strategies. At Gorzone, reducing operation-induced pressure swings is crucial to prevent interface mobilization in the phreatic zone. At Buoro, maintaining permeable areas of the inland floodplain (e.g., by limiting paving), keeping selected irrigation ditches unlined, and adding small recharge basins or winter-flooded fields would help sustain the thin freshwater cap in the confined aquifer. At the same time, routine canal and pumping operations manage short-term near-surface dynamics.
Although based on short time series, our observations are consistent with Lovrinović et al. (2021) [19]. Event-scale variability is predominantly mechanical (e.g., tides, canal stages, pump thresholds), while precipitation acts via low-frequency recharge; confined units are more buffered than phreatic ones, and EC transients largely reflect operation-driven pressure waves rather than direct rainfall dilution. The novelty is a supersite design that delivers a step-change in resolution and causal attribution, using an intrinsically consistent, co-located network that combines minute-scale fixed-depth logging with co-registered high-vertical-resolution CTD profiles across the transition zone, thereby resolving cm–dm-scale salinity structure and distinguishing interface motion from true dilution or mixing. This architecture quantifies the asymmetric buffering between phreatic and confined units, links site responses to aquitard architecture, and overcomes key limitations highlighted by Gaiolini et al. (2024) [42], such as heterogeneous timing, intra-well mixing, and correlation-only inference. Two limitations remain—records are still short and spatial coverage is currently restricted to two sites—but these will be progressively addressed as acquisition continues, and more supersites are installed.
Regarding future developments of the supersites, advances in coastal-aquifer management will depend on stronger monitoring—especially continuous measurements such as vertical profiles that resolve the freshwater–saline interface dynamics. Deploying systems for routine vertical-profile acquisition would be highly beneficial [43,44]. However, the high cost of commercial instruments remains a major barrier, even for well-funded programs. Additionally, monitoring techniques must be readily usable by stakeholders (water agencies, utilities, consortia), require minimal training and maintenance, support standardized workflows, and use interoperable data formats. A practical alternative is the Automatic Vertical Profile Monitoring System (A-VPMS) proposed by Jeon et al. (2018) [45], which uses low-cost microcontrollers to track salinity variations over time and at multiple depths within coastal aquifers, making it well-suited for supersite networks.
Overall, it is essential to emphasize that the design and installation of local monitoring supersites should be informed by, and follow, a comprehensive regional-scale mapping of seawater intrusion in coastal plains. Consequently, it is crucial to continue and extend such mapping efforts, which will provide the spatial framework needed to optimize the location and effectiveness of future supersites.
6. Conclusions
This work established two representative monitoring supersites—Gorzone and Buoro—within the coastal plain between the Brenta and Adige rivers to provide a durable observational backbone for science-based management. Each supersite integrates groundwater monitoring (multi-level piezometers with fixed-depth CTD loggers and repeated high-resolution vertical profiling), surface-water gauges along canals and ditches that control local hydraulics, and co-located meteorological stations. By delivering synchronized time series across compartments, the supersites capture both fast, operation-driven fluctuations and slower, seasonal-to-multiannual signals governing GWLs, salinity, and temperature.
Although the observation time window was short, the initial datasets—combining fixed-depth CTD logging with repeated high-resolution vertical profiling—were sufficient to test the appropriateness of establishing the supersites, which was our primary objective.
For the analyzed period, the acquired datasets also provide a consistent picture—though broader generalization is premature—of groundwater heads, salinity, and temperature across unconfined and confined aquifers, and clarify how natural and anthropogenic forcings interact over short- to seasonal-timescales.
Both sites exhibit a vertically layered system with a shallow phreatic aquifer and confined units separated by aquitards. A thin freshwater cap persistently overlies more saline water in the confined system, while deep temperatures remain nearly constant, indicating limited short-term advective exchange. Heads in the phreatic aquifer fluctuate within a narrow range primarily controlled by drainage-network management, whereas confined heads are more buffered.
At Gorzone, a thicker, laterally continuous aquitard hydraulically isolates the confined aquifer. The phreatic zone is saline and vertically stratified, with the upper confined level remaining fresh and stable (~2 mS/cm), while the deeper confined level is moderately saline with limited variability. Phreatic EC at the top sensor can transiently increase during or shortly after rainfall, consistent with pressure-driven interface mobilization rather than dilution. Tidal oscillations recorded at Chioggia propagate inland with a lag of about 3 h, modulating canal stage and near-site groundwater conditions.
At Buoro, a thinner, discontinuous aquitard allows partial vertical connectivity and faster near-surface dynamics: phreatic heads respond mainly to drainage operations and local recharge, with rises rapidly damped by pumping, and phreatic EC remains comparatively steady without episodic peaks. In the confined system, small increases in groundwater levels align with inland rainfall and a slight strengthening of the vertical salinity gradient during wet periods, consistent with a buffered recharge signature.
The observations support a dual-forcing conceptual model: (i) fast, local mechanical controls (canal-stage fluctuations, pumping thresholds, tidally induced pressure transmitted inland) govern short-term responses in the phreatic zone; and (ii) slower, regional hydrological controls (inland recharge, density-driven adjustment) sustain the longer-term stratification of the confined aquifers and their freshwater caps.
Management should aim to reduce operation-induced pressure swings in drainage-managed lowlands like Gorzone. This helps limit transient upconing and maintains or improves permeable recharge corridors inland of Buoro, such as unlined ditches, seasonal recharge basins, and winter-flooded fields. These measures support the confined freshwater lens, while routine operations address near-surface variability.
In conclusion, the supersite framework has proven robust, scalable, and management-relevant as a reference pillar for calibration, forecasting, and long-term assessment of saltwater intrusion. Following steps should extend temporal coverage, integrate satellite-based and numerical modeling for regional upscaling, and assess long-term risks under scenarios of relative sea-level rise, subsidence, and evolving drainage regimes.
Author Contributions
Conceptualization, L.T., M.C., P.A.Y., V.S. and S.D.; methodology, L.T., M.C., P.A.Y., V.S. and S.D.; validation, C.D.L., I.A. and J.Č.; formal analysis, L.T., M.C. and P.A.Y.; investigation, L.T., M.C., P.A.Y., A.A., L.F. and S.D.; data curation, M.C. and P.A.Y.; writing—original draft preparation, L.T.; writing—review and editing, L.T., M.C., P.A.Y., S.D., I.A., A.A., J.Č., C.D.L., L.F., V.S. and F.T.; supervision, V.S. and S.D.; project administration, L.T., L.F. and V.S.; funding acquisition, L.T., L.F. and V.S. All authors have read and agreed to the published version of the manuscript.
Funding
This research was funded by the Interreg Italy–Croatia 2021–2027 Programme, Project ID: ITHR0200479—SWAMrisk “Subsurface Water Monitoring and Management to Prevent Drought Risk in Coastal Systems”.
Data Availability Statement
The original contributions presented in the study are included in the article. Further inquiries can be directed to the corresponding author.
Acknowledgments
This research was conducted within the framework of the SWAMrisk Project—“Subsurface Water Monitoring and Management to Prevent Drought Risk in Coastal Systems” (Project ID: ITHR0200479), funded under the Interreg Italy–Croatia 2021–2027 Programme. We sincerely thank the Editor and the Referee for their insightful comments and suggestions, which have led to substantial improvements in the manuscript.
Conflicts of Interest
The authors declare no conflicts of interest.
References
- Werner, A.D.; Bakker, M.; Post, V.E.A.; Vandenbohede, A.; Lu, C.; Ataie-Ashtiani, B.; Simmons, C.T.; Barry, D.A. Seawater intrusion processes, investigation and management: Recent advances and future challenges. Adv. Water Resour. 2013, 51, 3–26. [Google Scholar] [CrossRef]
- Ferguson, G.; Gleeson, T. Vulnerability of coastal aquifers to groundwater use and climate change. Nat. Clim. Change 2012, 2, 342–345. [Google Scholar] [CrossRef]
- Dao, P.U.; Heuzard, A.G.; Le, T.X.H.; Zhao, J.; Yin, R.; Shang, C.; Fan, C. The impacts of climate change on groundwater quality: A review. Sci. Total Environ. 2024, 912, 169241. [Google Scholar] [CrossRef] [PubMed]
- Richardson, C.M.; Davis, K.L.; Ruiz-González, C.; Guimond, J.A.; Michael, H.A.; Paldor, A.; Moosdorf, N.; Paytan, A. The impacts of climate change on coastal groundwater. Nat. Rev. Earth Environ. 2024, 5, 100–119. [Google Scholar] [CrossRef]
- Etsias, G.; Hamill, G.A.; Águila, J.F.; Benner, E.M.; McDonell, M.C.; Ahmed, A.A.; Flynn, R. The impact of aquifer stratification on saltwater intrusion characteristics. Comprehensive laboratory and numerical study. Hydrol. Process. 2021, 35, e14120. [Google Scholar] [CrossRef]
- Guo, J.; Ma, Y.; Ding, C.; Zhao, H.; Cheng, Z.; Yan, G.; You, Z. Impacts of tidal oscillations on coastal groundwater system in reclaimed land. J. Mar. Sci. Eng. 2023, 11, 2019. [Google Scholar] [CrossRef]
- Cantelon, J.A.; Guimond, J.A.; Robinson, C.E.; Michael, H.A.; Kurylyk, B.L. Vertical saltwater intrusion in coastal aquifers driven by episodic flooding: A review. Water Resour. Res. 2022, 58, e2022WR032614. [Google Scholar] [CrossRef]
- Barlow, P.M.; Reichard, E.G. Saltwater intrusion in coastal regions of North America. Hydrogeol. J. 2010, 18, 247–260. [Google Scholar] [CrossRef]
- Oude Essink, G.H.P.; van Baaren, E.S.; de Louw, P.G.B. Effects of climate change on coastal groundwater systems: A modeling study in the Netherlands. Water Resour. Res. 2010, 46, W00F04. [Google Scholar] [CrossRef]
- Mastrocicco, M.; Giambastiani, B.M.S.; Severi, P.; Colombani, N. The importance of data acquisition techniques in saltwater intrusion monitoring. Water Resour. Manag. 2012, 26, 2851–2866. [Google Scholar] [CrossRef]
- Panthi, J.; Pradhanang, S.M.; Nolte, A.; Boving, T.B. Saltwater Intrusion into Coastal Aquifers in the Contiguous United States—A Systematic Review of Investigation Approaches and Monitoring Networks. Sci. Total Environ. 2022, 836, 155641. [Google Scholar] [CrossRef]
- Van, T.D.; Zhou, Y.; Stigter, T.Y.; Van Tuc, D.; Hai, D.H.; Vuong, B.T. Design of preliminary groundwater monitoring networks for the coastal Trà Vinh Province in the Mekong Delta, Vietnam. J. Hydrol. Reg. Stud. 2023, 47, 101425. [Google Scholar] [CrossRef]
- Prinos, S.T.; Dixon, J.F. Statistical Analysis and Mapping of Water Levels in the Biscayne Aquifer, Water Conservation Areas, and Everglades National Park, Miami-Dade County, Florida, 2000–2009; Scientific Investigations Report 2016-5005; U.S. Geological Survey: Tallahassee, FL, USA, 2016. [CrossRef]
- Nishimura, R.; Jones, N.L.; Williams, G.P.; Ames, D.P.; Mamane, B.; Begou, J. Methods for Characterizing Groundwater Resources with Sparse In Situ Data. Hydrology 2022, 9, 134. [Google Scholar] [CrossRef]
- Carbognin, L.; Tosi, L. Il Progetto ISES per l’Analisi dei Processi di Intrusione Salina e Subsidenza nei Territori Meridionali delle Provincie di Padova e Venezia; Istituto per lo Studio della Dinamica delle Grandi Masse: Venezia, Italy, 2003; Available online: https://www.earth-prints.org/handle/2122/9079 (accessed on 15 October 2025).
- Jiang, J.; Wang, L.; Liu, Y.; Xu, T. A comprehensive review on the design and optimization of surface water quality monitoring networks. Environ. Model. Softw. 2020, 132, 104792. [Google Scholar] [CrossRef]
- Lee, J.-Y.; Kwon, K.D. Current status of groundwater monitoring networks in Korea. Water 2016, 8, 168. [Google Scholar] [CrossRef]
- Zahid, A.; Hossain, A.F.M.A.; Ali, M.H.; Islam, K.; Abbassi, S.U. Monitoring the coastal groundwater of Bangladesh. In Groundwater of South Asia; Springer: Singapore, 2018; pp. 431–451. [Google Scholar] [CrossRef]
- Lovrinović, I.; Bergamasco, A.; Srzić, V.; Cavallina, C.; Holjević, D.; Donnici, S.; Erceg, J.; Zaggia, L.; Tosi, L. Groundwater monitoring systems to understand sea water intrusion dynamics in the Mediterranean: The Neretva Valley and the southern Venice coastal aquifers case studies. Water 2021, 13, 561. [Google Scholar] [CrossRef]
- Da Lio, C.; Tosi, L.; Zambon, G.; Vianello, A.; Baldin, G.; Lorenzetti, G.; Manfè, G.; Teatini, P. Long-term groundwater dynamics in the coastal confined aquifers of Venice (Italy). Estuar. Coast. Shelf Sci. 2013, 135, 248–259. [Google Scholar] [CrossRef]
- Da Lio, C.; Carol, E.; Kruse, E.; Teatini, P.; Tosi, L. Saltwater contamination in the managed low-lying farmland of the Venice coast, Italy: An assessment of vulnerability. Sci. Total Environ. 2015, 533, 356–369. [Google Scholar] [CrossRef]
- González, C.; Bachmann, M.; Bueso-Bello, J.; Rizzoli, P.; Zink, M. A Fully Automatic Algorithm for Editing the TanDEM-X Global DEM. Remote Sens. 2020, 12, 3961. [Google Scholar] [CrossRef]
- Mozzi, P.; Piovan, S.; Corrò, E. Long-term drivers and impacts of abrupt river changes in managed lowlands of the Adige River and northern Po delta (Northern Italy). Quat. Int. 2020, 538, 80–93. [Google Scholar] [CrossRef]
- ARPAV. Dati Meteorologici Orari. Available online: https://www.ambienteveneto.it/datiorari (accessed on 15 October 2025).
- ISPRA. La Rete Meteo-Mareografica della Laguna di Venezia (RMLV). Available online: https://www.isprambiente.gov.it/it (accessed on 15 October 2025).
- Xue, C.; Ghirardelli, A.; Chen, J.; Tarolli, P. Investigating agricultural drought in Northern Italy through explainable machine learning: Insights from the 2022 drought. Comput. Electron. Agric. 2024, 227, 109572. [Google Scholar] [CrossRef]
- ARPAV. Rapporto sul Clima del Veneto 2024; ARPAV: Padova, Italy, 2024; Available online: https://www.arpa.veneto.it/notizie/in-primo-piano/meteo-e-clima-in-veneto-il-rapporto-2024 (accessed on 15 October 2025).
- ISPRA. Annuario dei Dati Ambientali 2023; Istituto Superiore per la Protezione e la Ricerca Ambientale: Roma, Italy, 2023. Available online: https://www.isprambiente.gov.it/files2024/pubblicazioni/stato-ambiente (accessed on 15 October 2025).
- Ferrarin, C.; Bonaldo, D.; Bergamasco, A.; Ghezzo, M. Sea level and temperature extremes in a regulated Lagoon of Venice. Front. Clim. 2024, 5, 1330388. [Google Scholar] [CrossRef]
- Permanent Service for Mean Sea Level (PSMSL). Available online: https://www.psmsl.org (accessed on 25 November 2025).
- Zanchettin, D.; Bruni, S.; Raicich, F.; Lionello, P.; Adloff, F.; Androsov, A.; Antonioli, F.; Artale, V.; Carminati, E.; Ferrarin, C.; et al. Sea-level rise in Venice: Historic and future trends. Nat. Hazards Earth Syst. Sci. 2021, 21, 2643–2678. [Google Scholar] [CrossRef]
- European Ground Motion Service. Available online: https://egms.land.copernicus.eu/ (accessed on 25 November 2025).
- Cenni, N.; Fiaschi, S.; Fabris, M. Monitoring of Land Subsidence in the Po River Delta (Northern Italy) Using Geodetic Networks. Remote Sens. 2021, 13, 1488. [Google Scholar] [CrossRef]
- Corbau, C.; Simeoni, U.; Zoccarato, C.; Mantovani, G.; Teatini, P. Coupling land use evolution and subsidence in the Po Delta, Italy: Revising the past occurrence and prospecting the future management challenges. Sci. Total Environ. 2019, 654, 1196–1208. [Google Scholar] [CrossRef]
- Tosi, L.; Carbognin, L.; Teatini, P.; Rosselli, R.; Gasparetto Stori, G. The ISES Project subsidence monitoring of the catchment basin south of the Venice Lagoon (Italy). In Proceedings of the Sixth International Symposium on Land Subsidence, Ravenna, Italy, 24–29 September 2000; CNR, Gruppo Nazionale per la Difesa dalle Catastrofi Idrogeologiche: Venice, Italy, 2000; Volume 2, pp. 113–126. [Google Scholar]
- IPCC. AR6 Synthesis Report: Climate Change 2023; Intergovernmental Panel on Climate Change: Geneva, Switzerland, 2023; Available online: https://www.ipcc.ch/report/ar6/syr/ (accessed on 15 October 2025).
- Fabbri, P.; Zangheri, P.; Bassan, V.; Fagarazzi, E.; Mazzuccato, A.; Primon, S.; Zogno, C. Sistemi Idrogeologici della Provincia di Venezia—Acquiferi Superficiali; Cierre Grafica: Padova, Italy, 2013; p. 288. ISBN 978-88-95351-92-6. [Google Scholar]
- Tosi, L.; Da Lio, C.; Bergamasco, A.; Cosma, M.; Cavallina, C.; Fasson, A.; Viezzoli, A.; Zaggia, L.; Donnici, S. Sensitivity, Hazard, and Vulnerability of Farmlands to Saltwater Intrusion in Low-Lying Coastal Areas of Venice, Italy. Water 2022, 14, 64. [Google Scholar] [CrossRef]
- Zancanaro, E.; Teatini, P.; Scudiero, E.; Morari, F. Identification of the Origins of Vadose-Zone Salinity on an Agricultural Site in the Venice Coastland by Ionic Molar Ratio Analysis. Water 2020, 12, 3363. [Google Scholar] [CrossRef]
- Trevisani, S.; Fabbri, P.; Omodeo, P.D. Groundwater in the Venetian area. In Advances in Chemical Pollution, Environmental Management and Protection; Elsevier: Cambridge, UK, 2022; Volume 8, pp. 161–188. [Google Scholar] [CrossRef]
- USGS. Techniques and Methods 1–D1: Land Subsidence and Aquifer-System Compaction Measurement Using the Global Positioning System (GPS) and Other Positioning Techniques; U.S. Geological Survey: Reston, VA, USA, 2006; 101p.
- Gaiolini, M.; Rama, F.; Mastrocicco, M.; Cosma, M.; Donnici, S.; Tosi, L.; Colombani, N. Disentangling hydrodynamic drivers of the southern Venice (Italy) coastal aquifer via frequency decomposition analysis: Insights, challenges, and limitations. J. Hydrol. Reg. Stud. 2024, 56, 102039. [Google Scholar] [CrossRef]
- Tal, A.; Weinstein, Y.; Baïsset, M.; Golan, A.; Yechieli, Y. High Resolution Monitoring of Seawater Intrusion in a Multi-Aquifer System-Implementation of a New Downhole Geophysical Tool. Water 2019, 11, 1877. [Google Scholar] [CrossRef]
- Erbs Poulsen, S.; Rømer Rasmussen, K.; Bøie Christensen, N.; Christensen, S. Evaluating the salinity distribution of a shallow coastal aquifer by vertical multielectrode profiling (Denmark). Hydrogeol. J. 2010, 18, 161–171. [Google Scholar] [CrossRef]
- Jeon, W.-H.; Moon, H.S.; Choi, J.; Jung, B.; Kim, Y.; Hwang, S.; Lee, S.-H. An Automatic-Vertical Profile Monitoring System for Fresh–Saline Water Zones in Coastal Aquifer. Groundwater 2024, 62, 635–644. [Google Scholar] [CrossRef]
Disclaimer/Publisher’s Note: The statements, opinions and data contained in all publications are solely those of the individual author(s) and contributor(s) and not of MDPI and/or the editor(s). MDPI and/or the editor(s) disclaim responsibility for any injury to people or property resulting from any ideas, methods, instructions or products referred to in the content. |
© 2025 by the authors. Licensee MDPI, Basel, Switzerland. This article is an open access article distributed under the terms and conditions of the Creative Commons Attribution (CC BY) license (https://creativecommons.org/licenses/by/4.0/).