Abstract
The core of ocean thermal energy conversion (OTEC) is the transfer and conversion of heat energy, and the heat exchanger is a key component of the heat transfer between the surface warm seawater and the lower cold seawater. The working fluid has a significant impact on the efficiency of the entire cycle in the temperature difference cycle. This study aimed to improve heat exchange efficiency. The article studied heat exchangers, used R134a as the circulating medium, and applied ANSYS-FLUENT 2020R2 simulation software to analyze the variation in heat transfer coefficients. We obtained the trend in the heat transfer coefficient of the heat exchanger with the shape of an elliptical tube under the condition of ocean temperature difference cycles. Then we used a long short-term memory network and Adam optimization algorithm to establish the prediction model. The NSGA-II 11 algorithm was used to realize optimization objectives of the highest heat transfer efficiency and the smallest cross-sectional area of heat transfer tubes along the X and Y directions. Finally, the parameters of the evaporator and condenser ultimately resulted in three optimal solutions. The results of this study can provide a certain theoretical basis and reference value for the efficiency analysis, structure optimization, and experimental research of the subsequent ocean differential circulation heat transfer.
1. Introduction
With the rapid development of industry, the depletion of fossil energy sources and the damage to the environment have become increasingly significant. According to “Net Zero Emissions 2050”, 90% of the world’s electricity will be generated from renewable energy sources by 2050 [1,2], including wave energy, temperature difference energy, tidal energy, salinity difference energy, etc. Among them, ocean thermal energy conversion (OTEC) uses the surface warm seawater (25–30 °C) and deep cold seawater (4–6 °C) to drive the thermal cycle to generate power [3]; it is a non-polluting renewable energy with huge reserves. The ocean thermal energy reserves within 100 km of the coastline are 7.2–9.3 TW [4], and it is estimated that the global ocean thermal energy reserves are about 4.4 × 10¹⁶ kWh/a [5].
Because of the small temperature difference available in OTEC, its power generation efficiency is relatively low [6], so improving cycle efficiency is a major research interest. In the cycle, the heat exchanger plays an important role in the operation of many systems, such as power plants, nuclear reactors, process industries, and heat recovery devices [7]. Heat exchanger cost accounts for about 25% of the entire system [8], and energy consumption accounts for 13% to 15% of industrial energy. According to the heat transfer method and principle, heat exchangers can be divided into heat storage type [9], hybrid [10], inter-wall [11,12], heat pipe [13], rising film [14], falling film, etc., [15,16].
There is a variety of methods that can be used to enhance heat transfer of shell-and-tube heat exchangers: (1) changing the shape of the surface of the heat transfer element and the treatment, such as changing the rotational direction of the deflector plate [17]; (2) adding the insert [18] to enhance fluid perturbation, such as the addition of a spiral deflector plate [19,20]; (3) adjusting the tube bundle support form to optimize the flow distribution and make full use of the heat transfer area inside the heat exchanger; (4) using the internal and external surfaces of the heat exchanger tube’s threaded surface and other forms of processing so that the heat transfer causes fluid turbulence; and (5) increasing the number of bubble cores with a porous heat exchanger to increase the boiling heat transfer coefficient, etc. [21].
By changing the pipe type and the internal and external surface shapes of heat exchange pipes, to improve the efficiency of heat exchangers, scholars have conducted the following research: Zheng X. R. et al. [22] conducted experiments on the heat transfer performance of a plate heat exchanger by using carbon fiber-reinforced polymer (CFRP), and the study showed that increasing the surface thermal conductivity of CFRP plates could reduce the thermal resistance of the plates and increase the heat transfer rate of the plates. In addition, Nusselt empirical correlations for CFRP plate heat exchangers were established. Professor Uehara’s team [23] conducted the optimization of closed-cycle OTEC systems, focusing on the performance of plate heat exchangers (PHEs) and their impact on the net power output of the system. One conference paper presents research [24] on the improvement of shell-and-tube heat exchangers proposed by Japan, aiming to combine the sturdiness of shell-and-tdesigns with the high efficiency of plate designs. Saeed et al. [25] analyzed the plate heat exchangers through numerical and experimental methods, comparing efficiency under different operating conditions (such as flow rate and temperature). Alireza Zendehboudi [26] designed a plate heat exchanger applied in a CO2 heat pump system and evaluated the effect of different parameters on factors such as heat load. Chen Q. H. et al. [27] carried out a study on the flow boiling of R134a working fluids in a plate heat exchanger and analyzed the trend of heat transfer coefficient and pressure drop of the heat exchanger when the dryness coefficient varies within the plate. Chennu Ranganayakul et al. [28] studied the heat transfer and flow characteristics of serrated fin surfaces using inlet aspect ratio as a variable. Empirical formulas for the heat transfer factor and friction factor were established, and relevant experiments were conducted to verify their accuracy. Wang L. B. [29] et al. used the naphthalene sublimation method to study the effects of VG parameters such as vortex fan height and angle of attack on heat transfer and pressure drop, and gave the relationship between heat transfer performance, Nussle number, and friction factor. Yin X. M. et al. [30] illustrated the effect of the structure of the tube bundle on the flow heat transfer in a shell and tube heat exchanger. Chen B. Q. et al. [31] investigated the heat transfer efficiency of cross-grooved tubes and light tubes in shell and tube heat exchangers, and the results showed that the heat transfer efficiency of cross-grooved tubes was 60% to 70% higher. Cui H.T. et al. [32] studied the size, strength, structure, heat transfer phase change, convective heat transfer, thermal resistance, and other aspects of the spiral grooved tube, and proposed the fundamental theory for selecting the model of helical groove tubes according to different working conditions. Xiao G. F. et al. [33] added spiral convoluted fins on the heat exchanger tube, Ravindra Kumar Pasupuleti et al. [34] studied the logarithmic mean temperature difference and heat transfer efficiency of spiral-finned tubes and light tubes in shell-and-shell heat exchangers and numerically analyzed them by CFD. Yang L. et al. [35] experimental simulation of a twisted flat tube, which cross-section is elliptical, the integrated heat transfer performance is ordinary straight elliptical tube 1.5 to 2 times and can prevent fouling accumulation. Qi H. Y. et al. [36] pointed out that there are two trends in the overall enhancement of heat exchangers, one is to change the fin structure to improve the Reynolds number and reduce the role of the boundary layer thickness; the other is to achieve enhanced heat transfer by changing the tube bundles, such as twisted flat tube heat exchanger [37] and staggered flat tube heat exchanger [38].
In OTEC systems, shell-and-tube heat exchangers and plate heat exchangers are mainly used. Although plate heat exchangers are superior to shell-and-tube heat exchangers in terms of compact structure and amount of metal consumed per unit of heat transfer area, shell-and-tube heat exchangers have a wide range of applicable working conditions, relatively low manufacturing cost, high operational reliability, and extensive manufacturing and processing experience. Therefore, based on practicality and cost, shell-and-tube heat exchangers are often the preferred choice in engineering. In addition, they are more suitable for environments that require long operating times and high maintenance costs, such as OTEC. Thus, we choose shell-and-tube heat exchangers as the focus of our study.
In addition, with the development of artificial intelligence, machine learning algo-rhythms combined with agent models play an important role in the design and optimization of heat exchanger tube patterns. For example, the use of genetic algorithms to assist in the design of shell and tube heat exchangers from an economic point of view [39,40], particle swarm algorithms [41,42], simulated annealing algorithms, and other stochastic search algorithms [43,44] have also been applied to the design of shell and tube heat exchangers. Xie G.N. et al. [45] used artificial neural network (ANN) to analyze the heat transfer of shell and tube heat exchangers with segmented baffles and continuous spiral baffles. Lin G. T. et al. [46] reduced the mean percentage error to 11% based on a condensation prediction method of controlling the heat transfer mechanism for flooded heat exchangers.
In this study for the problem of small temperature difference of OTEC and low efficiency of thermal cycle, we combined with the effect of elliptical tube bundles on heat transfer efficiency in evaporator and condenser in OTEC. Then the effect of different elliptical tube types on heat transfer coefficient is analyzed with the help of ANSYS-FLUENT 2020R2 simulation software. Finally the training of long and short-term memory network and genetic algorithm is used to establish the heat transfer coefficient with the change of elliptical tube type. Prediction model, using NSGA-II algorithm for multi-objective optimization design of heat exchanger tube type, to derive the optimization scheme of the elliptical tube type of OTEC heat exchanger. Then further improve the heat exchange performance of the heat exchanger. This study improves the heat exchanger tube type, and it is expected to provide new ideas and theoretical support for the subsequent optimization design of the heat exchanger with small temperature difference.
2. Model Establishment
2.1. Geometric Model
Taking the infinitesimal element within a heat-conducting object as the subject and based on the law of energy conservation and Fourier’s law [47], the internal heat conduction differential equation is established. The net heat in the x, y, and z directions per unit time is: Expanding Fourier’s law into a Taylor series up to the second order, the net heat flux within a microelement per unit time can be obtained:
Expanding Fourier’s law into a Taylor series up to the second order, the net heat flux within a microelement per unit time can be obtained:
The amount of heat entering a microelement over a certain period of time can be expressed as:
Therefore, the net heat entering the microelement by conduction is:
Let the heat source intensity within a unit volume of an object per unit time be qv; then the heat generated by the heat source within a microelement of the body over a certain period of time is:
The increment of internal energy of the microelement over time dτ is:
According to the law of conservation of energy, it is known that q1 + q2 = q3, which can be rearranged as:
According to the geometric parameters of the evaporator and condenser, the working fluid mass flow rate is set to mr, the enthalpy difference between inlet and outlet is set as ∆h, and the enthalpy value of inlet and outlet can be calculated by using REFPROP, i.e.:
The heat transfer of the working fluids in the heat exchanger is:
Based on the law of conservation of energy, the required seawater flow rate of the heat exchanger can be obtained as:
where ∆Tw is the temperature difference between the heat exchanger inlet and outlet seawater, i.e.:
Heat transfer area is the most critical structural parameter in the design of a heat exchanger, and the set total parameter method is used in the calculation of heat transfer are
For the logarithmic mean temperature difference, and its calculation formula is:
The thermal resistance generated by fouling reduces the heat transfer efficiency of the heat exchanger [48], and also causes serious problems such as heat exchanger tube clogging. However, the existing foul prediction model and constant fouling factor (or constant fouling thermal resistance) have a large deviation in predicting the results of mixed fouling deposition, and have certain limitations in engineering applications. So in experimental set-up design calculations, the internal fouling thermal resistance of the piping was ignored, and U is calculated by the formula:
In the design and calculation process of the evaporator and condenser, the determination of exchanger tube’s structural parameters is also particularly important. According to the OTEC of heat transfer requirements in Table 1. Both heat exchanger and heat exchange pipeline need to be designed in accordance with national standards and industry standards. According to the size and specification requirements of the heat exchanger and the calculation of the heat exchange area in the national standard [49], the overall structural parameters of the heat exchanger are shown in Table 2.

Table 1.
Design conditions for OTEC heat exchangers.
Table 2.
Structural parameters of heat exchangers.
The evaporator is mainly composed of a shell, tube bundle, head, tube plate, gas package (gas-liquid separation tank), and so on. The structure is shown in Figure 1.
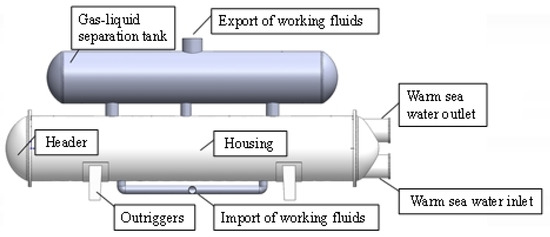
Figure 1.
Schematic diagram of evaporator structure.
When the evaporator works the seawater goes tube course. The warm seawater evaporates the working fluid inside the heat exchanger into a gaseous state. The working fluid then enters the gas separation device for gas-liquid separation to ensure that no liquid droplets are present in the working gas before it re-enters the cycle. Figure 2 is the heat exchanger working schematic diagram. On the right side, there is an inlet and outlet of seawater. When the seawater flows into the shell, the working fluid in the heat exchange tube is cooled, and the seawater finally flows out at the outlet. The lower right side is the inlet of the R134a working fluid, and the heated working fluid flows out above the right side, so far, the evaporator completes the heating of the working fluid.
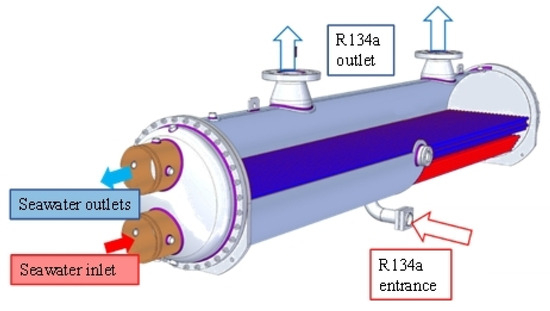
Figure 2.
Evaporator working diagram.
The condenser is similar to the evaporator, and the structure is shown in Figure 3. But since there is no need for gas-liquid separation, there is no gas bag on the upper part of the condenser, and the cold seawater flows into the inlet from the lower part of the tube bundle and out of the outlet at the upper part. And the working fluids enters from the lower part of the heat exchanger shell course, and condenses into liquid working fluids through the shell course.
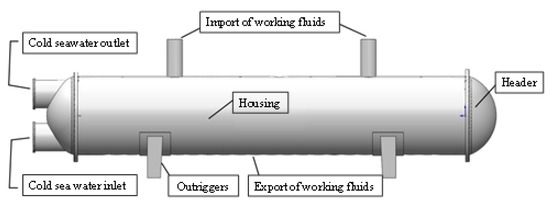
Figure 3.
Schematic diagram of condenser structure.
To meet the circulation conditions of the ocean temperature difference Rankine cycle, the volume of the heat exchanger and the number of heat exchanger tubes is large. So under the limited computational resources of the overall model, select the unit shown in Figure 4 for simulation experiments. Compared with other types of U-tubes, such as wound tube evaporators, elliptical tubular heat exchangers are low-cost, take up less space and are easy to maintain. During the research process, in order to ensure that the simulated data can match the actual situation, when simulating the real boundary conditions of the ocean thermal energy Rankine cycle, the tube spacing should be kept constant to avoid the influence of tube spacing on heat flux and heat transfer.
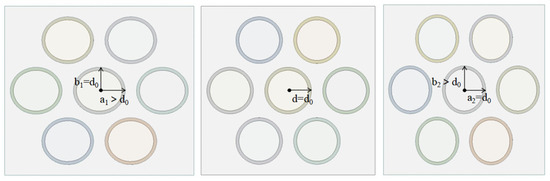
Figure 4.
Simulation unit area. Showing change in X-axis direction, the standard round tube and change in Y-axis direction respectively.
Figure 4 is the object of the simulation, showing the cross-section of the heat exchanger tubes in the evaporator and condenser. The picture in the middle is a standard round tube, and the parameters of the heat exchanger tube are in Table 2. The picture on the left shows the cross-section of the heat exchanger tube changing in the X-axis direction, and the picture on the right shows the cross-section of the heat exchanger tube changing in the Y-axis direction. The change in the X and Y axes will make the round tube become an elliptical tube.
2.2. Data Model
2.2.1. Mesh Generation and Quality Assessment
The heat exchanger tube in the heat exchanger bears the role of bridging the heat transfer between the hot fluid and the cold fluid, and the heat exchanger tube should be meshed more precisely in the mesh delineation. Compared with the tetrahedral mesh, the hexahedral mesh can control the spatial distribution of the mesh in the vicinity of the wall surface, which has better anti-distortion, improves the accuracy of the calculation, and makes better use of the arithmetic power to improve the calculation accuracy and convergence speed.
The heat transfer is involved in the heat exchanger simulation in this study, so mesh encryption of solid-vapor and solid-liquid contact surfaces is required. Mesh encryption [50,51] refers to the application of a boundary layer at the wall surface contact. Due to the relatively small thickness of the boundary layer, its effect can be neglected in the mainstream flow region. However, in the area near the wall, the fluid movement is intense and the temperature changes significantly. Therefore, to ensure the accuracy of heat transfer calculations, a certain number of boundary layers and the growth rate of the boundary layer are set in the flow and heat transfer near the wall. The mesh division of the heat exchanger tubes and the fluid domain is shown in Figure 5.
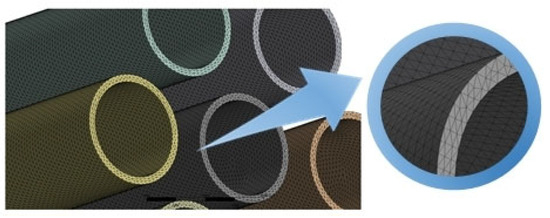
Figure 5.
Heat exchanger mesh delineation and boundary encryption.
There are many methods to evaluate mesh quality, including Aspect Radio, Element Quality, Jacobian Ratio, Parallel Deviation, Maximum Corner Angle, Wraping Factor, Skewness, Orthogonal Quality, etc. Element Quality is based on the total volume in the cell side length squared, cubed, and ratio of a comprehensive metrics. The value of which is between 0 and 1, when the coefficient is 1, the mesh quality is the best, and when the coefficient is 0, the mesh quality is the worst. Usually, when the average value of Element Quality is bigger than 0.7, its mesh quality reaches a more ideal situation. Jacobian Ratio is a more important coefficient in cell shape checking, which is calculated at the node of each mesh element. It uses the minimum determinant of the Jacobian matrix divided by the maximum determinant of the Jacobian matrix to obtain the Jacobian Ratio, which characterizes the reliability of finite element simulation to the actual situation, measuring the extent to which the computation deviates from the ideal cell. Jacobian Ratio ranges from −1 to 1, with 1 denoting perfectly regular mesh elements, 0 denoting elements degenerate in one or more edges, and negative values denoting reversed elements. In practice, a negative Jacobian Ratio represents a mesh with negative volume, which will not be accepted by the solver, so the Jacobian Ratio ranges from 0 to 1 in practice, with a ratio of 1 indicating a perfect mesh, and lower ratios indicating a worse mesh.
In this study, Element Quality is also used to judge the quality of the mesh. After simulation analysis, the results are shown in Figure 6. where the average value of Element Quality is 0.77173 and the average value of the Jacobian Ratio is 0.98327, the quality of the mesh is better and can be used for calculation.
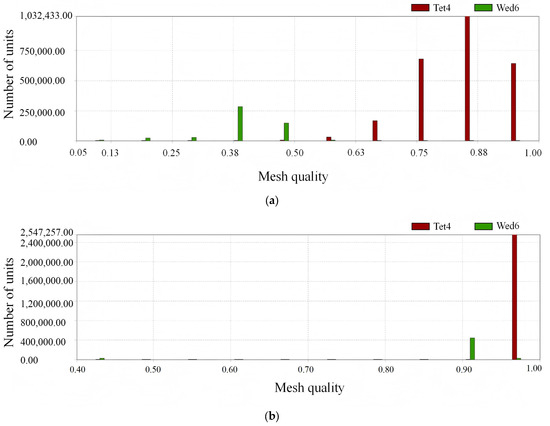
Figure 6.
(a) Grid quality factor indicator chart; (b) Jacobi ratio indicator chart.
2.2.2. Verification of Mesh Independence
In the condenser simulation experiment, the heat exchanger tube is in the shell, the inner heat exchanger tube is full of working fluids. The seawater is stored between the outer shell and the inner heat exchanger tube. There is a significant temperature difference between the working fluids and the seawater, that means the heat exchanger tube is in contact with the cold fluid and hot fluid at the same time. In the evaporator simulation experiment, the working fluids are heated by the warm seawater in the shell, and the temperature is increased from 6 °C to about 20 °C. Therefore, the temperature change gradient of the heat exchanger tube is large, and more meshes are expected to ensure the mesh quality when designing the computational model.
After the mesh reaches a certain density, the average value of its mesh quality coefficient does not change much. Continuing encryption can not obtain a higher precision solution, but resulting in slower computation and a waste of computational resources. After dividing the mesh and determining that the mesh quality meets the requirements, the independence of the mesh should be verified. The mesh should be divided into as few meshes as possible under the condition of not affecting the computational accuracy, and the parameters of the mesh independence verification are shown in Table 3.
Table 3.
Lattice independence validation model parameters.
Taking the fluid outlet temperature as the judgment basis, in the simulation process of the mesh number increased from 2.04511 × 10⁵ to 2.086116 × 10⁶, the outlet temperature increased by 5.93%, and in the process of the 2.086116 × 10⁶ increased to 6.557306 × 10⁶, the outlet temperature only changed by 1.25%. So under the comprehensive consideration, the number of meshes on the heat exchanger tube wall in this study was chosen as 2.5 × 10⁶, with the number of unrefined meshes being 1.8 × 10⁶. The number of meshes meets the calculation accuracy.
2.2.3. Calculating and Solving
The computational model used in this paper adopts the standard k-epsilon turbulence model, and the wall function uses the SWF standard wall function.
Solving in Fluent requires certain initial conditions and boundary conditions to be set for the model, the basic condition parameter settings are shown in Table 4. The Cold Fluid Inlet and Thermal Fluid Inlet are set as Mass-Flow-Inlet. The system mass flow rate is 570 m3/h. The condenser shell pressure is 270 kPa and the evaporator shell pressure is 500 kPa during the simulation. The cold fluid inlet temperature is 6 °C, and the hot fluid inlet temperature is 28 °C during the evaporator simulation. The cold fluid inlet temperature is 6 °C, and the hot fluid inlet temperature is 20 °C during the condenser simulation.
Table 4.
Boundary condition setting.
The heat exchanger shell is made of stainless steel. The heat exchanger tube is made of HAL77-2 material and its key physical parameters are shown in Table 5.
Table 5.
HAL77-2 Key physical parameters.
Heat transfer process in the tube of the fluid for water, shell of the working fluids for R134a, liquid water property parameters from the Fluent database call. Due to the R134a its physical properties with the change of the external conditions is large, is not a constant value, therefore it can not be set in the relationship between the arbitrarily simplify the use of fluent and refprop co-simulation. Through the TUI command statement to achieve the activation of the modified Benedict-Webb-Rubin equation of state, Helmholtz-energy equation of state. The extended corresponding states models are shown in Figure 7.
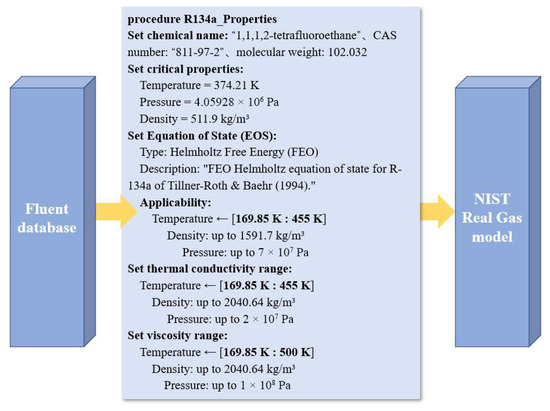
Figure 7.
R134a parameter calls in NIST Real Gas.
Although the NIST Real Gas model enables the fluid to adjust the simulation parameters in real-time as the parameters of the external conditions change, the model is more complex and more difficult to converge than the simple ideal gas model. So the Courant Number in the density-based solver and the sublaxity factor in the pressure-based solver should be adjusted to maintain the stability and ensure the convergence, without compromising the computational accuracy. In this study, the judgment standard of convergence is that the iteration error of the momentum equation curve and the continuity equation curve is less than 1 × 10⁻⁴, and the iteration error of the energy conservation curve is less than 1 × 10⁻⁶. Meanwhile, the model continues to iterate the calculation for 200 steps after reaching the condition of convergence, to ensure the accuracy and precision of the calculation.
2.3. LSTM-EVA Model
The heat exchange system is a dynamic and gradual process, and its current state may be influenced by the system’s operational status over a period of time in the past. This dependence reflects the dynamic characteristics of the system, and capturing this long-term temporal dependency is crucial for improving prediction accuracy.
Long short-term memory (LSTM) is a special kind of RNN (recurrent network neural), which solves the problem that RNN structure is sensitive to short-term inputs, and when the time sequence is too long, it is easy to forget the information of the previous more distant period. Compared with the traditional RNN structure, LSTM adds a gating mechanism and a long-term memory mechanism, through which short-term memory can be combined with long-term memory to better capture the long-term dependencies in the sequence data.
There is only one neural network in one cell of RNN, while there are four neural networks in one cell of LSTM. So the parameter of one LSTM cell is four times of the parameter of one RNN cell. At the same time, the LSTM also contains a Cell State which runs through the whole LSTM cell that is used for long-term memory storage, while in the original RNN the hidden layer has only one state. Therefore the LSTM model can predict the dynamic response of heat transfer efficiency more accurately by learning the historical sequence patterns of these parameters.
Figure 8 shows the schematic diagram of RNN. RNN using a single fully connected layer as the loop body A. Each of RNN’s Scenarios is the same, replicated multiple times in time series, and is called a body structure, also known as a loop.
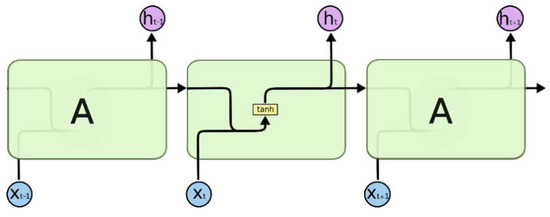
Figure 8.
RNN schematic.
Figure 9 shows the schematic diagram of LSTM, a typical LSTM unit consists of three key parts. Input Gate: The input information is judged whether to transmit it to the LSTM state or not, that means whether the information is selectively memorized and forgotten. Forget Gate: Determine whether to forget some information from the LSTM state. Output Gate: Determine whether to output the LSTM state to the next time step.
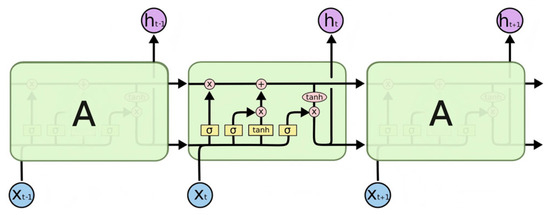
Figure 9.
LSTM schematic.
Forget Gate Ft, Input Gate It, Output Gate Ot, Updating the cell state Ct is calculated as follows:
where Wf, Wi, W0, Wc are the weight matrices, Wf, Wi, W0, Wc are the bias terms, [ht−1, xt] is the splicing of the hidden state ht−1 with the input in the horizontal direction xt, σ is the sigmoid function, tanh is the hyperbolic tangent function.
To eliminate the adverse effects of singular sample data, the normalization process of the data should be carried out before training. And the normalization processing formula and training parameters used in this chapter will be introduced in the following Section 3.2.
3. Simulation Results and Discussion
3.1. Heat Transfer Simulation of Tubular Structures
Different structural parameters of the heat exchanger tube [51] have a certain effect on the heat transfer performance. In order to investigate the effect of the heat exchanger tube type on the heat transfer performance, this study selected oval tubes with different lengths in the horizontal direction (X-axis) and the vertical direction (Y-axis). The spacing between tubes is certain to minimize the effect of the tube spacing on the heat transfer. At the same time to ensure that the rest of the parameters are the same. Under the above conditions, we calculate the heat transfer coefficient and the cold and hot fluid outlet temperature in the evaporator and condenser, and to study the structure of variables shown in Figure 10. The simulation calculation of evaporator and condenser inlet and outlet temperatures during the change of tube type. According to the heat transfer demand of the ocean temperature energy circulation system, the heat exchanger tube length change interval is selected between 10.6 mm and 14.1 mm, that is, the change range of X and Y axes is 10.6–14.1 mm.
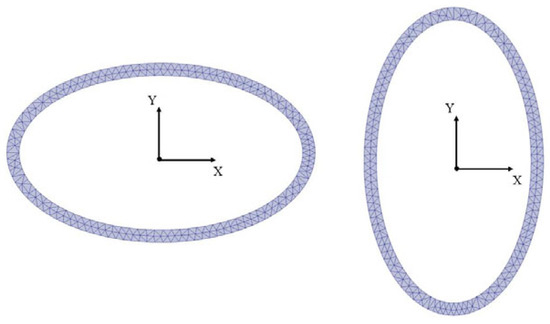
Figure 10.
Variable structure diagram.
In order to study the effect of parameter changes in the horizontal direction, the cold fluid inlet temperature is fixed at 6 °C, the hot fluid inlet temperature is fixed at 28 °C. The length of the evaporator in the Y-axis direction is kept unchanged while the length of the X-axis direction varies within the interval of 10.6 mm to 14.1 mm, and the same sample is taken every 0.5 mm within this interval to simulate the hot and cold fluid outlet temperatures. Fix the cold fluid inlet temperature as 6 °C and the hot fluid inlet temperature as 28 °C, keep the length of the evaporator in the X-axis direction unchanged while the length of the Y-axis direction varies within the interval of 10.6 mm to 14.1 mm, and take a sample every 0.5 mm within this interval to simulate the hot and cold fluid outlet temperatures, so as to analyze the influence of the parameters in the vertical direction.
Figure 11 shows a line graph drawn based on the simulation results about the cold fluid outlet temperature and the hot fluid outlet temperature when the cold fluid inlet temperature is 6 °C, the hot fluid inlet temperature is 28 °C and only the length of the X-axis or Y-axis changes.
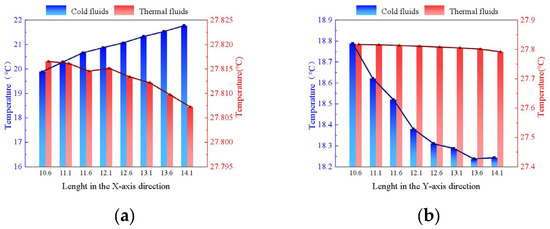
Figure 11.
The temperature changes of evaporator (°C). (a) Lenght in the X-axis direction; (b) Lenght in the Y-axis direction.
As can be seen from Figure 10, when the cold and hot fluid inlet temperatures are 6 °C and 28 °C, the Y-axis length of the evaporator is kept at 10.6 mm, the cold fluid outlet temperature shows an increasing trend with the increase of the X-axis direction, and the hot fluid outlet temperature shows a decreasing trend in general; the X-axis length of the evaporator is kept at 10.6 mm, and with the increase of the Y-axis length the cold fluid outlet temperature shows a decreasing trend. In the case of the Y-axis length changing from 10.6 mm to 13.6 mm, the temperature of cold fluid decreases faster, and when the length of Y-axis changes from 13.6 mm to 14.1 mm, the temperature of cold fluid decreases slowly; the temperature of hot fluid outlet has a decreasing trend in general.
Similarly, the simulation calculation of the condenser inlet and outlet temperatures during the change of tube type is carried out. Fix the cold fluid inlet temperature of 6 °C, hot fluid inlet temperature of 20 °C, keep the condenser Y-axis length unchanged, so that the X-axis length in the in the interval of 10.6 mm to 14.1 mm changes and every 0.5 mm to take a sample for the hot and cold fluid outlet temperature simulation.
Fix the cold fluid inlet temperature of 6 °C, hot fluid inlet temperature of 20 °C, keep the length of the condenser X-axis direction unchanged, so that the length of the Y-axis direction in the interval of 10.6 mm in 14.1 mm change and in the interval of every 0.5 mm to take a sample for the hot and cold fluid outlet temperature simulation. The simulation results are shown in Figure 12.
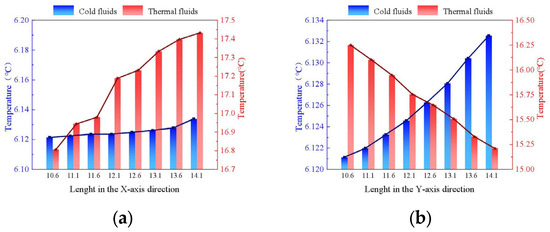
Figure 12.
The temperature changes of condenser (°C). (a) Lenght in the X-axis direction; (b) Lenght in the Y-axis direction.
As can be seen from Figure 12, when the cold and hot fluid inlet temperatures are 6 °C and 20 °C, the Y-axis length of the condenser is kept at 10.6 mm, and with the increase of the X-axis length, the cold fluid outlet temperature increases steadily within a small range from 6.12 °C to 6.14 °C, and the hot fluid outlet temperature is in an increasing trend. The X-axis length is kept unchanged, and with the increase of the Y-axis length, the cold fluid outlet temperature is in an increasing trend, and the hot fluid outlet temperature has a decreasing trend in the selected change interval.
Figure 13 and Figure 14 show evaporator simulation process, shell process with R134a working fluids in different elliptical tube under the temperature cloud distribution. CFD simulation is conducted under the assumption of steady-state. There can be seen in the image that R134a by the tube process heat warm seawater. High temperature working fluids first concentrated in the tube wall around, and then began to float upward by the viscous force and buoyancy by the wall of the tube, and gradually by the liquid working fluids into gaseous working fluids.
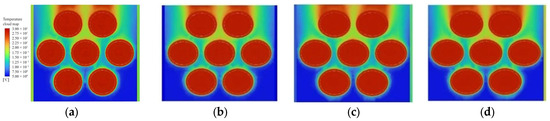
Figure 13.
Evaporator x-direction tube type change heat transfer diagram. (a) x = 1; (b) x = 2; (c) x = 3; (d) x = 4.
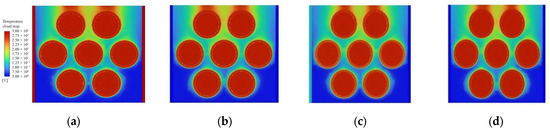
Figure 14.
Evaporator x-direction tube type change heat transfer diagram. (a) y = 0.5; (b) y = 1.5; (c) x = 2.5; (d) x = 3.5.
As can be seen in Figure 15 and Figure 16, the temperature cloud distribution of R134a working fluids in the shell course of elliptical tubes of different diameters during the simulation of heat transfer in the condenser. It is seen that in the condenser, the R134a working fluids are first cooled and condensed around the tube wall, and with the increase in the number of rows of the working fluids skimming over the low-temperature heat exchanger tubes, the condensation of the working fluids is gradually accomplished.
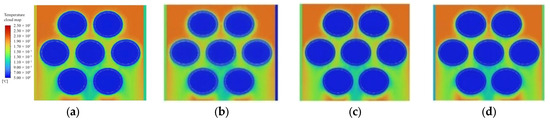
Figure 15.
Condensers x-direction tube type change heat transfer diagram. (a) x = 1; (b) x = 2; (c) x = 3; (d) x = 4.
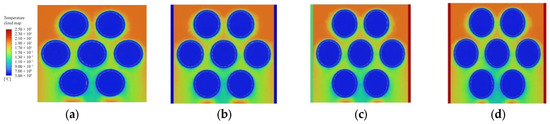
Figure 16.
Condensers x-direction tube type change heat transfer diagram. (a) y = 0.5; (b) y = 1.5; (c) y = 2.5; (d) y = 3.5.
3.2. Data Normalization Process and Model Training
Based on the heat exchanger simulation data, 40 sets of data from the evaporator and condenser are used for model training respectively. Before training, the data should be normalized. To eliminate the adverse effects of the singular sample data on the training, and improve the training efficiency and convergence speed, the preprocessed data should be restricted to between (0, 1). The normalization formula used in this study is:
In model training, the model is randomly divided into a training group and a test group. The data of the test group is not involved in model training but is used to test the accuracy of the model. To set the basic parameters of the model, while considering the way to adjust the model update weights and deviation parameters, and optimize the model to achieve better convergence, the training parameters used in this chapter are shown in Table 6.
Table 6.
LSTM training parameters.
The long short-term memory network model of this design is utilized to train the inlet and outlet parameters of the evaporator and condenser under OTEC conditions. At the same time, five sets of data that not put into the training set are taken out for the validation and prediction of the model’s accuracy, the training results are shown in Figure 17.
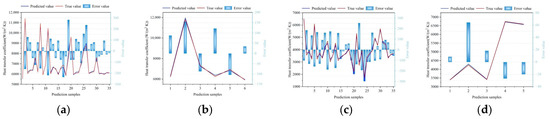
Figure 17.
Training results. (a) Evaporator training set; (b) Evaporator test set; (c) Condenser training set; (d) Condenser test set.
From the comparison of the test set prediction results with the real results, it can be seen that the error interval of the evaporator training set is −300 to 300 W/(m2·k), and the error interval of the evaporator test set is −150 to 200 W/(m2·k); the error interval of the condenser training set is −300 to 300 W/(m2·k), and the error interval of the condenser test set is −40 to 80 W/(m2·k). The maximum error of the evaporator training set is 3.414%, and the maximum error of the test set is 1.935%; the maximum error of the condenser training set is 1.523%, and the maximum error of the test set is 1.517%, which predicts this model good.
3.3. Parameter Sensitivity Analysis
The flowchart of the genetic algorithm is shown in Figure 18, and it can be regarded as a data training method similar to Darwinian evolution. Starting from an arbitrary initial population, individuals that are more adapted to the environment are bred through random selection, crossover, and mutation. By simulating the process of natural selection and reproduction, the population gradually evolves to better regions in the search space over generations, eventually converging to the population best suited to the environment In this section, based on the tube model trained by LSTM, the optimization study of the heat transfer model is carried out with the length of the elliptical tube in the horizontal and vertical directions as the design variables, and the heat transfer coefficient as the optimization objective. The heat transfer coefficient equation is:
where h is the convective heat transfer coefficient, A is the heat transfer area, ∆T is the temperature difference between the fluid and the solid surface.
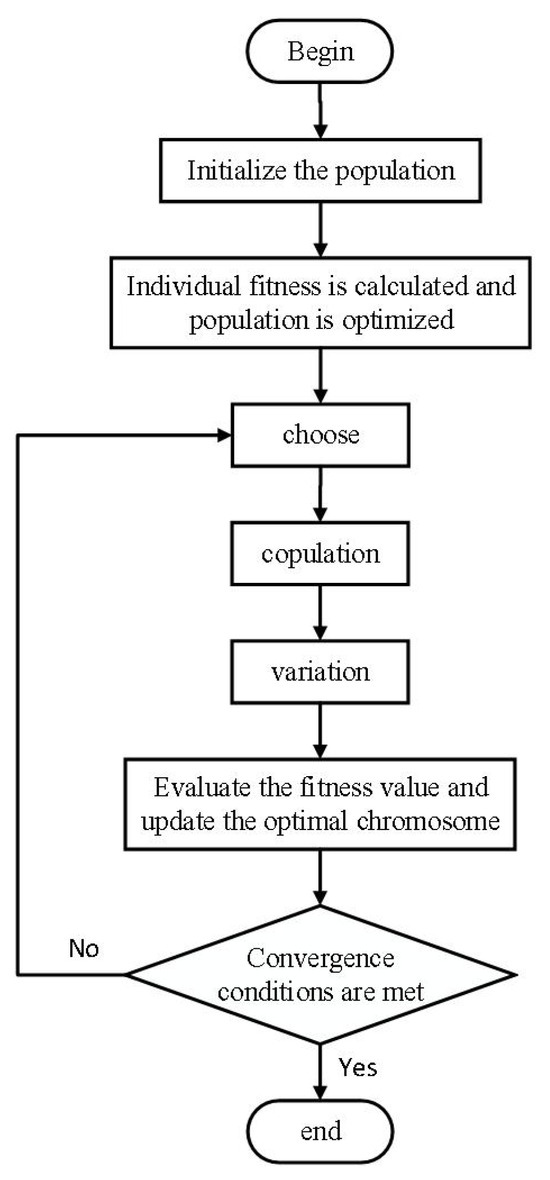
Figure 18.
Genetic algorithm flowchart.
The change rule of heat transfer coefficient with tube type is predicted by genetic algorithm, and the changing trend of heat transfer coefficient with the change of long axis of the elliptical tube is obtained as shown in Figure 19.
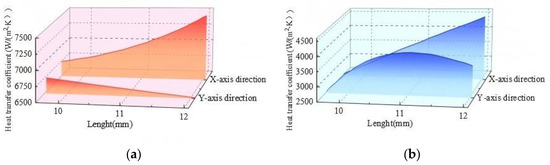
Figure 19.
Genetic algorithm prediction results. (a) The elliptical tube of the evaporator varies in the x\y direction; (b) The elliptical tube of the condenser changes in the x\y direction.
In the case of the given cold and hot inlet temperatures, fixed evaporator Y-axis length, the heat transfer coefficient shows an increasing trend with the increase in the length of the X-axis direction. Then fixed evaporator X-axis length, with the increase in the length of the Y-axis, the heat transfer coefficient shows a decreasing trend.
In the case of the given cold and hot inlet temperatures, the fixed condenser Y-axis length, with the increase of the X-axis length, the heat transfer coefficient tends to increase. Fixed condenser Y-axis length, with the increase of the Y-axis length, the heat transfer coefficient shows the trend of increasing first and then slowly decreasing. When fluid flows into a flatter elliptical tube, it experiences more intense streamlining and acceleration on the upper and lower walls of the pipe (in the Y-axis direction). According to Bernoulli’s principle, an increase in flow velocity leads to a decrease in static pressure, which enhancing the suction effect on the fluid, allowing the fluid in the core region to impact near the wall more effectively. When the ellipse is stretched in the Y direction (vertically) and the cross-sectional shape becomes closer to a circular pipe, the flow of fluid becomes smoother and more stable, with no intense zones of acceleration or deceleration. As it approaches a circular shape, its heat transfer performance declines. This phenomenon is consistent with the conclusions of A. Žukauskas’s review, numerical studies by Djeffal, Fares et al. [52].
3.4. Multi-Objective Optimization
After obtaining the relationship between heat transfer coefficient and tube shape change, the improved NSGA-II algorithm based on genetic algorithm is used to take the length change of tube shape along horizontal and vertical directions as the independent variable, and the maximum heat transfer coefficient corresponding to the change of tube shape along horizontal and vertical directions and the minimum cross-sectional area of tube shape as the optimization objectives. This optimization of the tube structure can improve the heat transfer efficiency, and avoid excessive encroachment on the shell space, so as to lay a foundation for the subsequent optimization of the shell space layout.
Compared with the traditional genetic algorithm, the NSGA-II algorithm introduces the non-dominated sorting mechanism, divides the individuals in the population into different levels, uses the crowding distance to maintain the diversity of the population, and combines the non-dominated sorting and crowding distance in the selection strategy. The NSGA-II algorithm can promote global convergence and provide better performance and more comprehensive solutions for multi-objective optimization problems.
There are multiple optimization objectives in this article. Conflicts between targets cannot be quantitatively compared. It is difficult to find a solution that makes all the objective functions optimal at the same time, i.e., to find the global optimal solution, from within the interval. Therefore, for multi-objective optimization problems, the result of the optimization is usually a set of solutions that are guaranteed not to weaken at least one of the other objective functions without changing the objective function, and at the same time are not comparable concerning all the objective functions. These solutions are often called non-dominated or Pareto optimal solutions.
In the setup of the NSGA-II optimization algorithm, the population size is set to 50, the number of iterations is set to 200, the crossover probability is set to 0.9, the variance probability is set to 0.1, and the resulting Pareto frontier is shown in Figure 20.
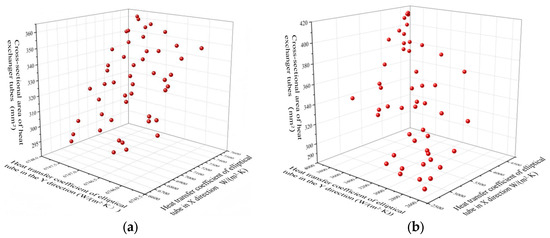
Figure 20.
Genetic algorithm prediction results. (a) The elliptical tube of the evaporator varies in the x\y direction; (b) The elliptical tube of the condenser changes in the x\y direction.
The Pareto solution set selected in the scheme largely ensures the heat transfer efficiency of the heat exchanger tube bundle while controlling the area of the heat exchanger tubes well, realizing the purpose of obtaining a higher heat transfer coefficient with a smaller heat transfer area, which can effectively control the material cost, optimize the layout of the shell process, and improve the efficiency of heat transfer.
Based on the three optimization objectives—the maximum heat transfer coefficient of the elliptical tube along the X-direction, the maximum heat transfer coefficient along the Y-direction, and the minimum cross-sectional area of the heat exchanger tubing, we set the heat transfer coefficients in the X and Y directions to be k1 and k2 respectively, and the cross-sectional area of the heat exchanger to be S. To improve heat transfer efficiency, we aim for larger heat transfer coefficients. However, higher coefficients are often accompanied by greater heat transfer areas. As the heat transfer area increases, the space for heat transfer between the hot and cold fluids is reduced. To achieve a balance between the “maximum possible heat transfer coefficient” and the “minimum possible heat transfer area,” the optimization difficulty is increased.
Theoretically, all Pareto solutions can be used for the design of heat exchanger tube configurations. However, solutions near the central region perform better in balancing these three optimization objectives. Specifically, we selected the solution closest to the ideal point and located in the central region of the Pareto front, which exhibits good balance across all objectives rather than pursuing extreme performance in any single objective. Table 7 and Table 8 show the three selected optimal Pareto solutions for the evaporator and condenser, respectively.
Table 7.
Evaporator tube type optimization results.
Table 8.
Condenser tube type optimization results.
4. Conclusions
In this study, for the problem of small temperature difference of ocean thermal energy conversion and low circulating thermal efficiency, combined with the influence of elliptical tube bundles on heat transfer efficiency in the evaporator and condenser in OTEC, the prediction model of heat transfer coefficient change with elliptical tube type is established, and the NSGA-II algorithm is used to carry out the multi-objective optimization design of the heat transfer tube type, and the following conclusions are obtained.
4.1. Effect of Axial Length on the Heat Transfer Coefficient of Tube Heat Exchanger
Heat transfer coefficient with the tube type in the horizontal and vertical length changes, evaporator and condenser show different trends: evaporator heat transfer coefficient with the increase in the length of the horizontal direction become larger, with the increase in the length of the vertical direction is reduced. Condenser heat transfer coefficient with the increase in the length of the horizontal direction is increased, and with the increase in the length of the vertical direction, condenser heat transfer coefficient shows the trend of increasing first and then slowly decreasing. The conclusions obtained lay the foundation for subsequent multi-objective optimization. The research in this paper is limited to the description of macroscopic phenomena (e.g., axial length affects heat transfer coefficient). However, since the topic of this paper is to improve the heat transfer efficiency of heat exchangers, there is no need for an in-depth theoretical model of the internal microscopic state of the heat exchanger tube.
4.2. Application of LSTM in Predicting Heat Transfer Coefficient in Elliptical Tubes
In this study, LSTM is applied to establish a prediction model linking the heat exchanger heat transfer coefficient with the X and Y axis of the elliptical tube, which reduces the prediction error caused by the sensitivity of RNN to short-term inputs, and better captures the long-term relationship in the sequence data to improve the accuracy of the prediction. The maximum error of the evaporator training set is 3.414%, and the maximum error of the test set is 1.935%. The maximum error of the condenser training set is 1.523%, and the maximum error of the test set is 1.517%, In the Section 4 of the experiment the error of the mathematical model is 5–10%, so the prediction effect is good. However, the amount of data in this study is relatively limited, although we have tried to control the risk of overfitting during model design and training. Nonetheless, validating the model’s generalization ability on a larger and more diverse dataset remains an important direction for future work.
4.3. Design pl
In this study, a multi-objective optimization method for OTEC heat exchangers is proposed based on the improved NSGA-II algorithm of the genetic algorithm, and a design scheme with better heat transfer performance is obtained to realize the coexistence of a larger heat transfer coefficient and a smaller tube area. The optimized evaporator heat exchanger tube with X-axis heat transfer coefficient of 6852 W/(mm2·k), Y-axis heat transfer coefficient of 6749 W/(mm2·k) and cross-sectional area of 289.5 mm was finally obtained; the condenser heat exchanger tube with X-axis heat transfer coefficient of 3160 W/(mm2·k), Y-axis heat transfer coefficient of 3528 W/(mm2·k) and cross-sectional area of 328.7 mm was obtained. It should be noted that this study employed an idealized heat exchanger model and did not consider the actual pinch point temperature difference. This simplification may overestimate system efficiency and underestimate the required heat exchange area. However, this does not affect the comparative conclusions regarding heat exchange efficiency and tube types presented in this paper. A detailed analysis of the impact of the pinch point on system performance and economic viability will be the core focus of our future research efforts.
4.4. Multi-Objective Opimization
The OTEC heat transfer model (LSTM-EVA) based on long and short-term memory network and efficiency improvement study proposed in this study explores the optimal heat transfer efficiency of ocean thermal energy heat transfer tubes, solves the problem of improving the heat transfer efficiency while avoiding excessive encroachment on the shell range space, and can provide ideas and references for the subsequent ocean thermal energy research. Because the article uses a simple oval pipe, the cost is low, and it is of great significance for large-scale production and application.
Author Contributions
Conceptualization, X.Y. and T.Z.; methodology, X.Y. and M.T.; software, Y.L. and X.Y.; validation, X.Y., M.T., Y.C. and Y.Y.; formal analysis, Y.C. and Y.Y.; investigation, Y.L.; resources, Y.L.; data curation, Y.L. and X.Y.; writing—original draft preparation, X.Y.; writing—review and editing, M.T. and Y.Y.; visualization, X.Y.; supervision, Y.C. and Y.Y.; project administration, Y.L.; funding acquisition, Y.L. All authors have read and agreed to the published version of the manuscript.
Funding
National Natural Science Foundation of China (Grant No. 42188102); Shandong Province Natural Science Foundation (Grant No. ZR2023QE345).
Data Availability Statement
Dataset available on request from the authors.
Conflicts of Interest
The authors declare no conflicts of interest.
Abbreviations
The following abbreviations are used in this manuscript:
| LSTM | Long Short-Term Memory |
| RNN | Recurrent Neural Network |
| OTEC | Ocean Thermal Energy Conversion |
References
- Feng, Y. Chian’s Energy Security under the International Energy Changes. Int. Econ. Rev. 2023, 1, 38–52. [Google Scholar]
- Zhou, S.; Cao, S. Co-ordinations of ocean energy supported energy sharing between zeroemission cross-harbour buildings in the Greater Bay Area. Appl. Energy 2024, 359, 122718. [Google Scholar] [CrossRef]
- Vera, D.; Baccioli, A.; Jurado, F.; Desideri, U. Modeling and optimization of an ocean thermal energy conversion system for remote islands electrification. Renew. Energy 2020, 162, 1399–1599. [Google Scholar] [CrossRef]
- Zhang, J.; Tang, Z.; Qian, F. A review of the current status of ocean thermal energy conversion development and research on key scientific and technological issues. J. Hohai Univ. Nat. Sci. Ed. 2019, 47, 55. [Google Scholar] [CrossRef]
- Feng, Y.; Zhang, Y.; Li, B.; Yang, J.; Shi, Y. Comparison between regenerative organic Rankine cycle (RORC) and basic organic Rankine cycle (BORC) based on thermoeconomic multi-objective optimization considering exergy efficiency and levelized energy cost (LEC). Energy Convers. Manag. 2015, 96, 58–71. [Google Scholar] [CrossRef]
- Chen, F.Y.; Peng, J.P.; Liu, L.; Ge, Y.; Wang, Q.; Liu, W. Theoretical and Experimental Study on Secondary Heat Recovery Cycle System of Mixed Working Fluid for Ocean Thermal Energy Conversion. Adv. Mar. Sci. 2024, 42, 185–195. [Google Scholar]
- Abou Elmaaty, T.M.; Kabeel, A.; Mahgoub, M. Corrugated plate heat exchanger review. Renew. Sustain. Energy Rev. 2017, 70, 852–860. [Google Scholar] [CrossRef]
- Han, X. Numerical Simulation of Finned Tube Heat Exchanger and Multi-Objective Optimization Design of Structural Parameters. Master’s Thesis, Donghua University of Science and Technology, Shanghai, China, 2021. [Google Scholar]
- Chen, W.; Luo, H. Numerical simulation of flow heat transfer in a regenerative heat exchanger. J. Huazhong Univ. Sci. Technol. 2005, 3, 17–19. [Google Scholar] [CrossRef]
- Wang, Y.; Li, Y.; Zhang, J. Study on heat transfer in direct contact annular heat exchangers. Chem. Eng. 2000, 4, 18–21. [Google Scholar]
- Wang, J.; Chen, L.; Feng, L. Temperature distribution equations of hot and cold fluids in parallel and countercurrent inter-wall heat exchangers. Petrochem. Equip. 2008, 3, 9–12. [Google Scholar]
- Zhang, Y.; Zhao, H.; Hou, Y. Performance analysis of inter-wall screen mesh heat exchanger. J. Xi’an Jiaotong Univ. 2012, 46, 24–29. [Google Scholar]
- Zhao, B.; Wang, Z. Application of heat pipe and its heat exchanger in waste heat recovery of iron and steel industry. Metall. Power 2005, 3, 34–36. [Google Scholar]
- Gao, L.; Zheng, Z.; Tao, L. Experimental study on evaporative heat transfer characteristics of plate-type rising film evaporator. Low Temp. Eng. 2011, 5, 42–45. [Google Scholar]
- Qiu, Q.G. Numerical simulation of liquid film outside the tube of a horizontal tube falling film evaporator. J. Power Eng. 2011, 31, 357–361+374. [Google Scholar]
- Liu, J. A review of research on the current status and future trend of heat exchanger development. China Equip. Eng. 2022, 21, 261–263. [Google Scholar]
- Ji, J.; Ni, X.; Zhang, J.; Li, F.; Chen, Q. Influence of deflector rotation on heat transfer performance of spiral copper tube heat exchanger. Vib. Shock 2023, 42, 151–158. [Google Scholar] [CrossRef]
- Gururatana, S.; Skullong, S. Experimental investigation of heat transfer in a tube heat exchanger with airfoil-shaped insert. Case Stud. Therm. Eng. 2019, 14, 100462. [Google Scholar] [CrossRef]
- Ji, J.; Zhang, J.; Li, F.; Chen, Q.; Ni, X.; Deng, X. Numerical research on vibration-enhanced heat transfer of improved elastic tube bundle heat exchanger. Case Stud. Therm. Eng. 2022, 33, 101936. [Google Scholar] [CrossRef]
- Sun, Y.; Li, D.; Ji, J.; Hua, Z. Analysis of heat transfer performance of double-layer copper tube heat exchanger with spiral deflector. J. Xi’an Jiaotong Univ. 2024, 58, 114–123. [Google Scholar]
- Fan, W. Study and Numerical Calculation of Condensation Heat Transfer Characteristics of Shell and Tube Heat Exchanger. Master’s Thesis, North China Electric Power University, Baoding, China, 2009. [Google Scholar]
- Zheng, X.; Kim, B.R.; Hong, S.J.; Lee, J.G.; Park, C.W. Heat transfer analysis of carbon fiber-reinforced corrugated polymer plate heat exchangers. Appl. Therm. Eng. 2024, 244, 122684. [Google Scholar] [CrossRef]
- Zendehboudi, A. Experimental analysis of a tri-partite brazed plate gas cooler for CO2 heat pump water heaters. Appl. Therm. Eng. 2024, 241, 122376. [Google Scholar] [CrossRef]
- Nakaoka, T.; Haruo, U. Performance test of a shell-and-plate-type condenser for OTEC. Exp. Therm. Fluid Sci. 1990, 1, 275–281. [Google Scholar] [CrossRef]
- Haruo, U.; Yasuyuki, I. Optimization of a closed-cycle OTEC system. J. Sol. Energy Eng. 1990, 112, 247–256. [Google Scholar]
- Saeed, R.M.; Schlegel, J.P.; Sawafta, R.; Kalra, V. Plate type heat exchanger for thermal energy storage and load shifting using phase change material. Energy Convers. Manag. 2019, 181, 120–132. [Google Scholar] [CrossRef]
- Chen, Q.; Fang, Y.; Lao, W. Experimental study of flow boiling of R134a in a vertical multi-corrugated plate heat exchanger. Chem. Eng. 2024, 52, 55–59+89. [Google Scholar] [CrossRef]
- Chennu, R.; Paturu, P. Development of heat transfer coefficient and friction factor correlations for offset fins using CFD. Int. J. Numer. Methods Heat Fluid Flow 2011, 21, 935–951. [Google Scholar] [CrossRef]
- Wang, L.B.; Ke, F.; Gao, S.D.; Mei, Y. Local and average characteristics of heat/mass transfer over flat tube bank fin with four vortex generators per tube. J. Heat Transf. 2002, 124, 546–552. [Google Scholar] [CrossRef]
- Yin, X.; Chen, Y.; Song, Y. Progress in the study of heat transfer characteristics of shell-and-tube heat exchanger tube flow and its influencing factors. Appl. Chem. Eng. 2022, 51, 229–232+237. [Google Scholar] [CrossRef]
- Chen, B.; Li, Q. Three-dimensional numerical simulation of flow and enhanced heat transfer in a cross-grooved tube. Chem. Eng. Equip. 2018, 11, 14–18. [Google Scholar] [CrossRef]
- Cui, H.; Yuan, X. Research on comprehensive performance of spiral grooved pipe. Petrochem. Equip. Technol. 2001, 22, 6–8+3. [Google Scholar]
- Xiao, G.; Chen, F.; Tan, B.; Gan, B.; He, Z.; Xian, X.; Liu, Y.; Chen, H.; Du, H. Numerical simulation study of heat transfer and flow characteristics of spiral curled fins. Nucl. Power Eng. 2023, 44, 39–43. [Google Scholar] [CrossRef]
- Pasupuleti, R.K.; Bedhapudi, M.; Jonnala, S.R.; Kandimalla, A.R. Computational Analysis of Conventional and Helical Finned Shell and Tube Heat Exchanger Using ANSYS-CFD. Int. J. Heat Technol. 2021, 39, 35. [Google Scholar] [CrossRef]
- Yang, L.; Song, D.; Zeng, L.; Zhang, Y.; Gao, L. Numerical simulation and experimental study of heat transfer performance of twisted tubes. Chem. Eng. 2010, 38, 26–29. [Google Scholar]
- Qi, H.; Gao, L.; Zhang, Y.; Liu, M. Overview of enhanced heat transfer technology for shell-and-tube heat exchangers. Press. Vessel 2012, 29, 73–78. [Google Scholar]
- Zhang, Y.; Jian, J.; Gao, L. A Kind of Flat Round Staggered Tube Heat Exchanger. CN201569349U, 2010. [Google Scholar]
- Gao, P.; Zhang, Y.; Gao, L. Dual Shell-and-Stroke Spiral Twisted Flat Tube Heat Exchanger. CN200820012364.1, 2009. [Google Scholar]
- Selbas, R.; Kızılkan, Ö.; Reppich, M. A new design approach for shell-and-tube heat exchangers using genetic algorithms from economic point of view. Chem. Eng. Process. Process Intensif. 2006, 45, 268–275. [Google Scholar] [CrossRef]
- Ponce-Ortega, J.M.; Serna-González, M.; Jiménez-Gutiérrez, A. Use of genetic algorithms for the optimal design of shell-and-tube heat exchangers. Appl. Therm. Eng. 2009, 29, 203–209. [Google Scholar] [CrossRef]
- Ravagnani, M.A.; Silva, A.P.; Biscaia, E.C., Jr.; Caballero, J.A. Optimal design of shell-and-tube heat exchangers using particle swarm optimization. Ind. Eng. Chem. Res. 2009, 48, 2927–2935. [Google Scholar] [CrossRef]
- Patel, V.; Rao, R. Design optimization of shell-and-tube heat exchanger using particle swarm optimization technique. Appl. Therm. Eng. 2010, 30, 1417–1425. [Google Scholar] [CrossRef]
- Lahiri, S.K.; Khalfe, N. Improve shell and tube heat exchangers design by hybrid differential evolution and ant colony optimization technique. Asia Pac. J. Chem. Eng. 2014, 9, 431–448. [Google Scholar] [CrossRef]
- Hadidi, A.; Hadidi, M.; Nazari, A. A new design approach for shell-and-tube heat exchangers using imperialist competitive algorithm (ICA) from economic point of view. Energy Convers. Manag. 2013, 67, 66–74. [Google Scholar] [CrossRef]
- Xie, G.N.; Wang, Q.W.; Zeng, M.; Luo, L.Q. Heat transfer analysis for shell-and-tube heat exchangers with experimental data by artificial neural networks approach. Appl. Therm. Eng. 2007, 27, 1096–1104. [Google Scholar] [CrossRef]
- Lin, G.; Huang, S.; Yi, T.; Chen, J.; Yang, N. Analysis and numerical simulation of fouling thermal resistance of shell-and-tube heat exchangers. J. Chongqing Univ. Technol. 2021, 35, 271–276. [Google Scholar]
- Zheng, X.; Zhang, J.; Kærn, M.R.; Haglind, F. Analysis of prediction methods for non-equilibrium internal flow condensation heat transfer. Appl. Therm. Eng. 2024, 239, 122063. [Google Scholar] [CrossRef]
- Sun, T.; Wang, Y. Uniformly convergent scheme for steady MHD duct flow problems with high Hartmann numbers on structured and unstructured grids. Math. Comput. Simul. 2023, 212, 336–359. [Google Scholar] [CrossRef]
- Zhou, L.; Zhao, Y. Improvement of unresolved CFD-DEM by velocity field reconstruction on unstructured grids. Powder Technol. 2022, 399, 117104. [Google Scholar] [CrossRef]
- Wang, S.; Jian, G.; Xiao, J.; Wen, J.; Zhang, Z.; Tu, J. Fluid-thermal-structural analysis and structural optimization of spiral-wound heat exchanger. Int. Commun. Heat Mass Transf. 2018, 95, 42–52. [Google Scholar] [CrossRef]
- Hartnett, J.P.; Thomas, F.; Irvine, J. Heat Transfer from Tubes in Crossflow. Adv. Heat Transf. 1972, 8, 93–160. [Google Scholar]
- Djeffal, F.; Bordja, L.; Rebhi, R.; Inc, M.; Ahmad, H.; Tahrour, F.; Ameur, H.; Menni, Y.; Lorenzini, G.; Elagan, S.K.; et al. Numerical Investigation of Thermal-Flow Characteristics in Heat Exchanger with Various Tube Shapes. Appl. Sci. 2021, 11, 9477. [Google Scholar] [CrossRef]
Disclaimer/Publisher’s Note: The statements, opinions and data contained in all publications are solely those of the individual author(s) and contributor(s) and not of MDPI and/or the editor(s). MDPI and/or the editor(s) disclaim responsibility for any injury to people or property resulting from any ideas, methods, instructions or products referred to in the content. |
© 2025 by the authors. Licensee MDPI, Basel, Switzerland. This article is an open access article distributed under the terms and conditions of the Creative Commons Attribution (CC BY) license (https://creativecommons.org/licenses/by/4.0/).