Abstract
This study investigates the effects of spume droplets on coherent vortical structures (CVSs) in turbulent airflow over a wavy water surface, focusing on the role of wave steepness and droplet injection velocity in modulating these interactions. Direct numerical simulations are performed using a droplet-laden Couette turbulent airflow over progressive surface waves as an idealized model. A Eulerian-Lagrangian approach is employed, considering low- and high-steepness wave conditions ( and , where is wave amplitude and is wavenumber) and two droplet injection velocities (surface and airflow velocities near wave crest). Results from droplet-free simulations reveal strong phase dependence in CVS formation, with forward and reversed horseshoe vortices near wave troughs and quasi-streamwise vortices aligning along the windward surface. Droplets injected at the surface velocity remain near wave crests, where CVS formation is weak, leading to minimal interaction. In contrast, droplets injected at the airflow velocity disperse broadly, increasing the likelihood of interactions with CVSs. For low-steepness waves, these droplets stay within the surface layer, attenuating CVSs and suppressing ejection and sweep events. However, as wave steepness increases, more droplets escape the near-surface layer, reducing their influence on CVSs.
1. Introduction
The small-scale processes in the marine atmospheric boundary layer (MABL) control the exchange of momentum, heat, and moisture between the ocean and the atmosphere. Coherent vortical structures (CVSs) are a characteristic feature of MABL flows, playing a crucial role in facilitating these exchanges. The formation and spatial distribution of CVSs in MABL are influenced by the undulating water surface created by surface waves. Additionally, spume droplets, typically injected near the wave crests, add further complexity to the flow field. Understanding the underlying physics of these interactions poses a significant challenge due to the difficulties of conducting controlled laboratory experiments, let alone reliable field observations. Nonetheless, such knowledge is essential for developing accurate parameterizations of small-scale processes in MABL for use in large-scale prognostic models.
Early numerical and theoretical investigations by Gent and Taylor [1], Chalikov [2], and Belcher and Hunt [3], pioneered the modeling of turbulent airflow over moving water waves and established much of the modern framework for wave-coupled boundary-layer dynamics.
The subsequent development of direct numerical simulation (DNS), offering high-resolution insights into complex flow fields, has emerged as a powerful tool for investigating small-scale dynamics and transport processes in turbulent airflow over progressive surface waves. In these simulations, turbulent Couette flow over a wavy water surface is often used as an idealized model of the MABL [4,5,6,7]. A key finding from such studies is that the phase-dependent distribution of CVSs over a wavy surface differs significantly from that over a flat surface [5,7,8]. Specifically, the wavy boundary dictates the phase distributions of CVSs with different topological geometries, influencing their contribution to Reynolds stress production. This dependency is further modulated by wave steepness and other properties, such as the presence of gravity-capillary ripples [8].
DNS studies on droplet-laden (or particle-laden) turbulent flows near flat walls have also been extensively conducted (see reviews by Balachandar and Eaton [9]; Elghobashi [10]; Brandt and Coletti [11]). These studies consistently demonstrate that droplets or particles can significantly alter near-wall CVSs, thereby modifying turbulent dynamics and transport processes [12,13,14,15,16]. When the dispersed phase has inertia comparable to the smallest turbulent time scales, strong feedback effects arise through the two-way coupling between particles and the carrier flow. For instance, Richter and Sullivan [13] investigated how inertial particles affect near-wall CVSs in a turbulent planar Couette flow. Their DNS results revealed that inertial particles with a Stokes number (based on the Kolmogorov time scale) of order unity substantially reduce Reynolds stresses and attenuate strong swirling CVSs near the wall. The interaction becomes even more complex when the surface is undulated and particles are injected locally, as in the case of spume droplets above wavy airflow.
Druzhinin et al. [6] performed the first DNS of droplet-laden, turbulent airflow, incorporating two-way coupling between the droplets and turbulence. Consistent with prior DNS studies, a turbulent Couette flow over a wavy water surface is adopted as an idealized model for the MABL. The droplet size is selected to represent typical spume droplets observed in MABL, approximately in diameter, allowing the assumption of negligible droplet deformation. A Eulerian-Lagrangian approach is employed, wherein the full, three-dimensional Navier–Stokes equations governing the carrier airflow are solved in a Eulerian frame, while the trajectories of individual droplets are tracked in a Lagrangian frame. Their simulation results showed that the velocity of the droplet at injection near the wave crest plays a crucial role in determining its impact on the carrier airflow. Droplets injected with the surrounding airflow velocity reduce the turbulent stresses and increase the mean air velocity compared to the droplet-free case. Conversely, droplets injected with the velocity of the wavy surface increase turbulent stresses and decrease the mean airflow velocity.
Druzhinin and Tsai [17] later reexamined these simulations to investigate in greater detail the modulation of turbulent vortex structures by spume droplets. Their analysis showed that droplets influence vortical structures in a manner similar to their effects on turbulent stresses, primarily through momentum exchange and two-way coupling within the near-surface airflow. Notably, these effects became less pronounced as surface wave steepness increased. However, they did not explain the underlying mechanism behind the differing impacts of droplets on CVSs over mild and steep wavy surfaces, leaving a gap that motivates the present study.
The present study aims to extend this line of inquiry by performing a systematic analysis of CVSs in a droplet-laden turbulent Couette flow over a wavy water surface, using ensembles of instantaneous flow fields obtained from direct numerical simulation (DNS). Specifically, the objectives are to examine the interaction between dispersed droplets and near-surface CVSs, to quantify how droplet feedback modifies vortex topology and turbulent transport, and to characterize how these interactions depend on both droplet-injection scenarios and wave-steepness conditions.
This paper is structured as follows. Section 2 introduces the DNS methodology employed in this study, including the computational setup and parameters for the airflow and droplet across different simulation scenarios. In Section 3, a detection criterion based on local analysis of the velocity-gradient tensor and the topological geometry of the criterion is employed to extract and classify various CVSs in turbulent airflow. Section 4 presents an analysis of vertical profiles for average droplet concentration, swirling strength of CVSs, and Reynolds stresses, highlighting their variations with different droplet-injection scenarios and wave steepness. In Section 5, the spatial distributions of CVSs and their correlation with droplet concentration are investigated to reveal the interactions between droplets and coherent structures in the turbulent airflow. Finally, in Section 6, the trajectories of droplets are examined to explain their varying impact on CVSs under different injection scenarios and wave steepness conditions.
2. Numerical Simulations
We analyze numerical simulations of three-dimensional droplet-laden turbulent airflow over a two-dimensional wavy surface. The model formulation, numerical method, and implementation details are thoroughly described in Druzhinin et al. [6] and Druzhinin and Tsai [17]. For clarity, we highlight only the key aspects relevant to the simulation scenarios, flow and droplet properties, and analyses of the simulation results.
2.1. Carrier Airflow
Figure 1 depicts the configuration of the simulation flow domain along with an example of the instantaneous droplet distribution from a representative simulation. A train of surface waves with wavelength propagates at celerity in the direction, with a mean position at . The flow domain spans , , and in the (streamwise), (spanwise) and (vertical) directions, respectively. Periodic boundary conditions are applied along the lateral boundaries. The flow is driven by a flat upper boundary at moving with a bulk velocity .
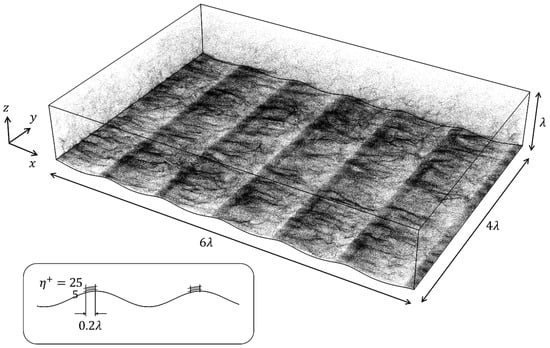
Figure 1.
Schematic of the flow configuration in the DNS. Airflow moves in the positive -direction, from the upper left to the lower right. The black dots represent the instantaneous droplet distribution for case AK02VS, with only half of the droplets plotted for clarity. The shaded grey regions (not to scale) in the schematic at the lower left corner indicate the areas where the droplets are re-injected.
The bulk Reynolds number of the airflow is , and the corresponding friction Reynolds number is , where , indicating sufficiently large to sustain a fully developed turbulent airflow. The wave celerity is set to , characteristic of slow, young waves under wind-forcing conditions. The simulation is performed in a reference frame moving with the wave celerity , rendering the lower wavy boundary stationary.
To accommodate the lower wavy boundary in numerical computation, the following coordinate transformation is used:
which maps the flow domain in coordinates to the computation domain in coordinates [4], where is the wavenumber. In this transformed domain, the surface at corresponds to the lower wavy surface in the flow domain. The actual elevation of the waves, obtained by setting and retaining up to the second order in , is
where characterizes wave steepness. At the wavy surface, the airflow velocities match the orbital velocities of the underlying surface water waves.
2.2. Discrete Droplets
The discrete droplets are modeled as monodisperse, nondeformable spheres. The droplet diameter considered, , falls within the range of spume droplet sizes typically observed in laboratory experiments [18]. The large droplet-to-air density ratio, , renders droplet motion primarily governed by the balance of inertia, drag force, and gravity. Other forces exerted by the surrounding carrier air, including pressure gradient, added mass, Basset, and lift forces, are considered negligible. Since the droplet diameter is smaller than the viscous wall length scale, the impact of the droplets on the airflow is modeled using a point-force approximation.
For spume droplets with diameters around , experimental observations [19] show that the ratio of the droplet terminal settling velocity to is approximately unity. Here, is the non-dimensional droplet response time to the variations in the surrounding airflow, and is the Kármán constant. To satisfy this condition, the nondimensional gravitational acceleration is prescribed as .
If a droplet exits the domain through either the lower wavy surface or the upper boundary, a new droplet is re-injected into the flow according to the scenarios described below. Observations from both natural environments and laboratory experiments indicate that spume droplets are typically injected near wave crests [18,19,20]. Therefore, consistent with the approach of Druzhinin et al. [6], the re-injection process is modeled by introducing new droplets at random locations within small regions above the upwind wave slope near the wave crests. Specifically, new droplets are introduced in areas defined by (corresponding to ) and , where , as illustrated in the schematic of Figure 1. The total number of droplets, , remain constant throughout the simulation, and the droplet volume fraction remains well below , justifying the neglect of hydrodynamic interactions between neighboring droplets.
Due to the absence of a well-established statistical distribution for spume droplet initial velocities, we consider two injection velocity scenarios to facilitate a comprehensive analysis. In the first scenario, the droplet injection velocity, , is set equal to the surrounding instantaneous airflow velocity, , following the approaches used in phenomenological models by Kudryavtsev and Makin [21] and Lagrangian stochastic models by Mueller and Veron [22]. In the second scenario, is prescribed as the instantaneous water surface velocity at the same -coordinate as the droplet, . This scenario represents conditions near the wave crest, where droplets are torn from the water surface by wind stress [23,24].
2.3. Simulation Implementation
To investigate the effect of wave steepness on the CVS distribution, two wave steepness values, and 0.2, are considered in the simulations. For comparison, additional simulations without droplets in the flow field are performed. Combining these with the two re-injection scenarios, and , a total of six simulation cases are examined, as summarized in Table 1.

Table 1.
The simulation scenarios considered.
The simulations begin with a spin-up period, , during which no droplets are present in the airflow. At , droplets are introduced into the flow, with a total number of . In the interval , the droplets are passively advected by the airflow without any feedback effect on the flow. During this transient stage, the droplet dynamics adjust to the airflow. At the later time, , the flow evolves under fully two-way-coupled conditions, allowing droplet feedback to the carrier airflow. A statistically stationary, droplet-laden, two-way coupled flow is established for analyses.
Tests with different random seeds for droplet injection confirmed that all statistically averaged quantities are insensitive to initial droplet conditions once the two-way-coupled stationary state is established.
2.4. Analysis Procedures
Similar to previous DNS studies of turbulent flows over wavy surfaces [4], phase averaging, equivalent to ensemble averaging over turbulent fluctuations, is employed in the post-processing analysis. Phase averaging is first performed over the spanwise coordinate and time , followed by an ensemble average over six wavelengths as:
where represents the field quantity, is the number of spanwise grid points. Time averaging is performed over realizations in the interval . In the following analyses, . The streamwise mean of , denoted by , is further obtained by averaging along the coordinate:
where is the total number of grids in the streamwise direction, spanning six wavelengths. denotes phase averaging, an ensemble average over time , spanwise coordinate , and six wave periods in , which removes turbulent fluctuations while retaining the phase dependence relative to the surface wave. denotes streamwise averaging of the phase-averaged quantity along , yielding a mean vertical profile that is independent of wave phase.
Since the simulated flow consists of a turbulent shear flow undulated by the wavy boundary associated with surface waves, the instantaneous velocity field, , is then decomposed into mean, wave-correlated, and fluctuation components [4]:
The fluctuation velocity field is analyzed to identify the vortical structures.
3. Coherent Vortical Structure Identification
A CVS in a turbulent flow is defined as a localized region with intense swirling strength. The swirling core can be identified from various criteria derived from the velocity-gradient tensor, , as proposed by, for example, Hunt et al. [25], Chong et al. [26], Jeong and Hussain [27], and Zhou et al. [28]. Despite differences in methodology, Chakraborty et al. [29] highlighted strong interconnections among these criteria in canonical turbulent flows, a conclusion later extended to undulated turbulent shear flows over surface waves by Chen et al. [8]. In this study, we adopt the criterion outlined by Zhou et al. [28], where CVSs are identified as regions with conjugate complex eigenvalues, , of the velocity-gradient tensor . The imaginary component quantifies the local swirling strength, enabling the visualization of CVSs through isosurfaces of at a chosen threshold. This approach provides a robust method for detecting and characterizing CVSs while facilitating the analysis of their topological attributes under varying flow conditions.
Using the detection criterion , CVSs are identified and visualized by plotting the isosurfaces corresponding to a chosen non-zero threshold value of . Figure 2 presents representative distributions of the isosurface for the three droplet-laden scenarios at wave steepnesses (left column) and (right column). The orange and blue colors on the isosurfaces represent positive and negative streamwise vorticities, respectively, allowing the spatial arrangement, polarity, and intensity of the CVSs to be clearly distinguished. This visualization enables direct comparison of how droplet feedback and wave steepness jointly influence the formation, organization, and strength of vortical structures in the near-surface airflow.
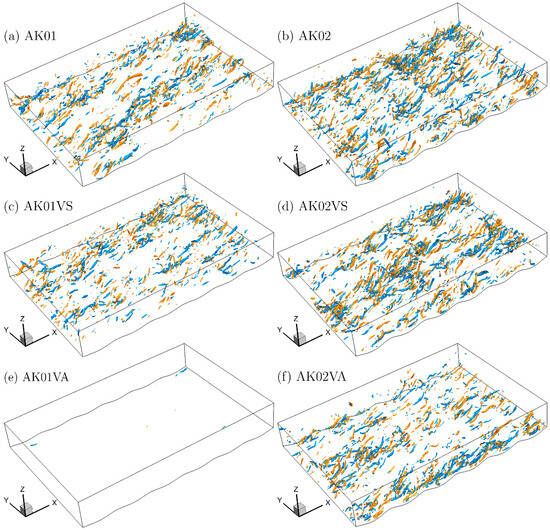
Figure 2.
The instantaneous distributions of isosurface in the airflows of six simulation scenarios. The isosurfaces are colored according to the signs of streamwise vorticity : orange color when and blue color when . The air flows in the positive x direction, from the lower left to the upper right.
The characteristics and appearance of the vortical structures are directly influenced by the threshold value of chosen, as they are derived from the isosurface of the eigenvalue distribution . Opting for a small threshold value will indiscriminately educe vortical structures, including those with both strong and weak swirling cores. As a result, the identified structures exhibit a chubby appearance and lack a distinct geometry. In contrast, a large threshold value renders strong swirling cores and breaks down the coherent structures into separate pieces. Chen et al. [8] conducted a thorough study to determine the best threshold value for identifying and categorizing CVSs in wavy turbulent shear flow. Based on the findings of Chen et al. [8], a threshold value of is used in the subsequent analyses.
Examining the distributions of isosurfaces across various flow scenarios in Figure 2 reveals some intriguing qualitative findings. As the surface wave becomes steeper, the number of CVS increases, as seen when comparing cases AK01 and AK02 in Figure 2a,b. The presence of droplets yields diverse effects on the CVS distribution. Surprisingly, droplets injected at the orbital velocity of the surface wave () have minimal impact on CVSs in the airflow above both low- and high-steep waves (cases AK01VS and AK02VS in Figure 2c and Figure 2d, respectively). In contrast, droplets injected at the surrounding airflow velocity () substantially impede CVS formation in the airflow over the low-steep wave (case AK01VA in Figure 2e) but show a noticeably weaker but still moderate attenuation in the airflow over the steep wave (case AK02VA in Figure 2f).
4. Vertical Variations in Average Swirling Strength and Reynolds Stresses
To examine the potential correlation between the distributions of CVSs and droplets, Figure 3 presents the vertical variations in the droplet population density , the average swirling strength , the average turbulent stress attributed to ejection events , and the average turbulent stress attributed to sweep events for the three droplet-laden scenarios over wavy surfaces with and 0.2. The average droplet population density at a grid height is defined as the number of droplets residing within the layer . The turbulent stresses due to sweep and ejection events, and , are calculated by conditional correlations of the fluctuation velocities and , where for and , and for and , respectively.
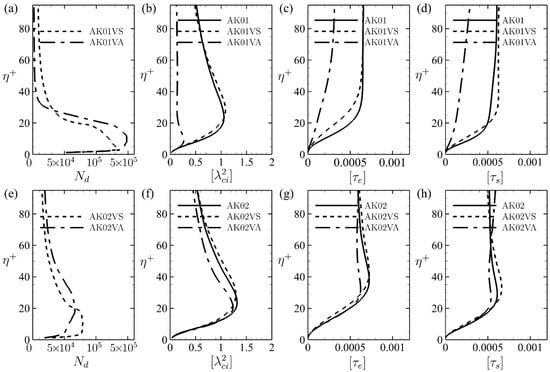
Figure 3.
Vertical variations in the accumulative number of droplets (a,e), the averaged swirling strength (b,f), the averaged turbulent stress attributed to ejection events (c,g), and the turbulent stress attributed to sweep events (d,h) obtained for droplet-free (solid lines) and laden flows (; dashed lines, and ; dashed-dotted lines) with wave steepness (top row) and 0.2 (bottom row). is the normalized distance to the water surface.
The vertical variations in the average droplet population density shown in Figure 3a,e indicate that most droplets accumulate near the wavy surface. In droplet-laden flows with , about of droplets are confined within the layer of . As the wave steepness increases to , the droplet distribution extends further upwards, with about of droplets within the range . These findings suggest that increasing the wavy surface steepness promotes greater upward dispersion of droplets.
The profiles of the average swirling strength, , depicted in Figure 3b,f, highlight the distinctive effects of droplets in case AK01VA compared to other scenarios. The swirling strength of CVS is significantly reduced in the droplet-laden flow with above low-steep waves () (dash-dotted line in Figure 3b). However, as the wave steepness increases to , this effect diminishes, resulting in only a mild attenuation of CVS swirling strength (dash-dotted line in Figure 3f). In contrast, droplets injected with exhibit minimal to no impact on CVS swirling strength in flows above wavy surfaces with both and 0.2 (dotted lines in Figure 3b,f).
The influence of droplets on turbulent stresses, and , mirrors their effect on CVS swirling strength (Figure 3c,g, and Figure 3d,h, respectively).
The observed correlations among vertical variations in average droplet population density, average CVS swirling strength, and average turbulent stresses suggest that the effect of droplets on CVS is influenced by both droplet injection velocity and wave steepness. However, these average distributions do not elucidate the underlying mechanisms driving this dependency. Notably, it remains unclear why only droplets injected at the surrounding airflow velocity can effectively reduce the swirling strength and turbulent stresses of CVSs in flows over wavy surfaces with low steepness. To investigate this further, we will analyze the spatial distributions of CVSs and examine their potential correlations with droplet distributions across different droplet-laden flow scenarios.
5. Spatial Distributions of Coherent Vortical Structure
Chen et al. [8] conducted a comprehensive investigation into the distribution of CVSs in turbulent airflow over a wavy surface, identifying three primary CVS types: quasi-streamwise vortices (QSVs), reversed horseshoe vortices (RHVs), and forward horseshoe vortices (FHVs), with their heads oriented upstream and downstream, respectively. The wavy boundary further modulates the spatial distributions of these CVSs. Figure 4 presents three close-up views of the isosurface in the airflow of case AK02VS (Figure 2d), illustrating RHV, FHV, and QSV structures. To quantify the population partition and spatial distribution of these vortices, the vortex extraction and classification method developed by Chen et al. [8] is applied across the six flow scenarios.

Figure 4.
Three representative CVSs in the flow of case AK02VS (close-up views of Figure 2d): (a) reversed horseshoe vortex (RHV), (b) forward horseshoe vortex (FHV), and (c) quasi-streamwise vortex (QSV). The isosurfaces are colored according to the signs of streamwise vorticity : orange color when and blue color when .
The procedure involves two main steps. First, individual spatial regions with values exceeding a specified threshold (here ) are identified as vortical structures, as shown in Figure 2. Next, these identified vortices are classified into three characteristic types based on their geometrical properties. The geometrical properties are determined by the topological skeleton of each vortical structure, defined by connecting grid points along the direction of minimal increment between neighboring grids. Further details of the classification schemes are reported in Chen et al. [8].
To visualize the streamwise and vertical distributions of the three types of CVSs, we calculate the cumulative occurrence counts of each CVS type at each spatial coordinate , representing the frequency with which each location is occupied by one of the three CVS types. These counts are denoted as , , and for RHVs, FHVs, and QSVs, respectively. This approach effectively projects the three-dimensional CVS distribution onto the plane, providing a clear and concise representation of spatial distributions across the flow field.
Figure 5 presents the phase-averaged distributions of swirling strength, , along with the cumulative occurrence counts of the three CVS types, , and , for the flow scenarios AK01, AK01VS, and AK01VA above the wavy surface. To emphasize variations across wave phase , corresponding histograms of , and , calculated by summing occurrence counts over , are also shown in Figure 5. Figure 6 presents the same phase-averaged distributions as in Figure 5, but for the flow scenarios AK02, AK02VS, and AK02VA over the wavy surface.
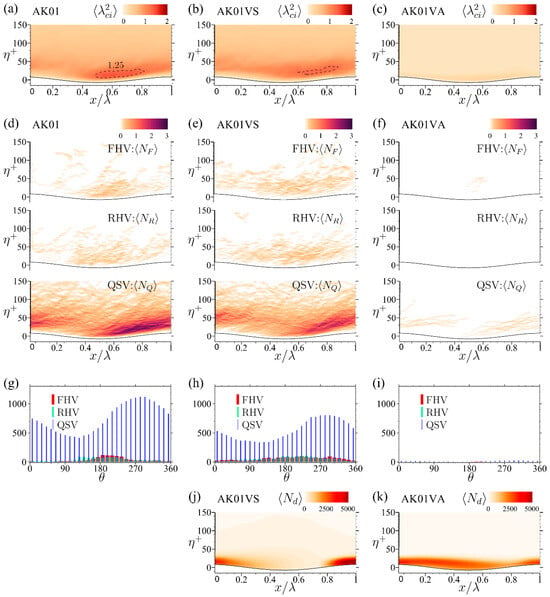
Figure 5.
The phase-averaged distributions of swirling strength (a–c), the cumulative occurrence counts of the three CVS types , , and (d–f), and the corresponding histograms by summing the occurrence counts along wave phase (g–i) of the three simulation scenarios above the wavy surface. The phase-averaged droplet population density distributions of cases AK01VS and AK01VA are shown in (j) and (k), respectively.
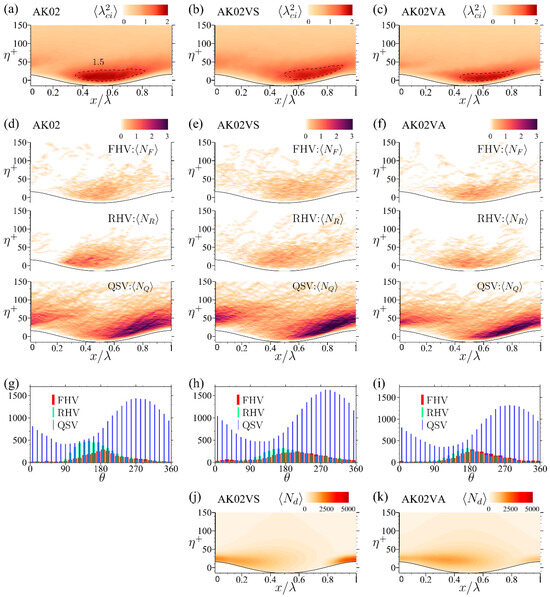
Figure 6.
The phase-averaged distributions of swirling strength (a–c), the cumulative occurrence counts of the three CVS types , , and (d–f), and the corresponding histograms by summing the occurrence counts along wave phase (g–i) of the three simulation scenarios above the wavy surface. The phase-averaged droplet population density distributions of cases AK02VS and AK02VA are shown in (j) and (k), respectively.
The results shown in Figure 5 and Figure 6 demonstrate that the wavy boundary significantly modulates the spatial distributions of CVS swirling strength and the three types of CVSs. In nearly all scenarios, both droplet-free and droplet-laden, apart from case AK01VA shown in Figure 5c,f,i, QSVs emerge as the dominant vortical structure. These QSVs initiate near the wave trough, extend downstream along the windward face, and rise to dissipate above the crest. By contrast, RHVs and FHVs cluster primarily above the wave trough region, with RHVs peaking slightly upwind of the trough and FHVs peaking slightly downwind.
A Comparison of panels (a) with (d) and (g) in Figure 5 and Figure 6 reveals that, while QSVs dominate the CVS population and occupy a substantial portion of the flow field, the peak cumulative occurrence counts of QSV, , does not coincide with the peak of swirling strength, . Instead, the peak of FHV distribution aligns with that of swirling strength, indicating that the least populated FHVs are the primary contributors to the CVS swirling strength.
Comparing the distributions in Figure 5 and Figure 6 for and 0.2 reveals that increasing the steepness of the wavy surface enhances the formation of CVSs, thereby further intensifying the swirling strength of the vortical structures. However, the influence of droplets on CVS formation differs significantly between low-steep and high-steep wavy surfaces.
6. Impact of Droplets on Coherent Vortical Structure Distributions
To evaluate the potential impact of droplets on CVS formation, the phase-averaged droplet population density distributions, , for droplet-laden flows AK01VS and AK01VA are shown in Figure 5j,k, while those for AK02VS and AK02VA are depicted in Figure 6j,k. The density is calculated by summing the droplet counts within the region and , normalized by the area of this region to provide a phase-consistent measure of droplet concentration.
A comparison of the droplet density distributions with the CVS distributions in Figure 5 and Figure 6 reveals that the impact of droplets on CVS formation is influenced by both the wavy surface steepness, , and the droplet injection velocity, . Whenever a droplet enters the water or exits through the upper boundary, a new droplet is injected from a randomly selected location near the wavy surface and tracked, with each trajectory color-coded for distinction. The trajectories are sampled at discrete time intervals of , such that the spacing between adjacent droplets along the trajectory reflects the velocity magnitude of the droplet. An instantaneous side view of all droplet locations is shown below the trajectory plot to highlight the overall movement trends of the droplets.
The distinctive features of these droplet trajectories, as observed in different flow scenarios depicted in Figure 7 and Figure 8, clearly illustrate the cumulative impact of droplets on the formation and distribution of CVSs.
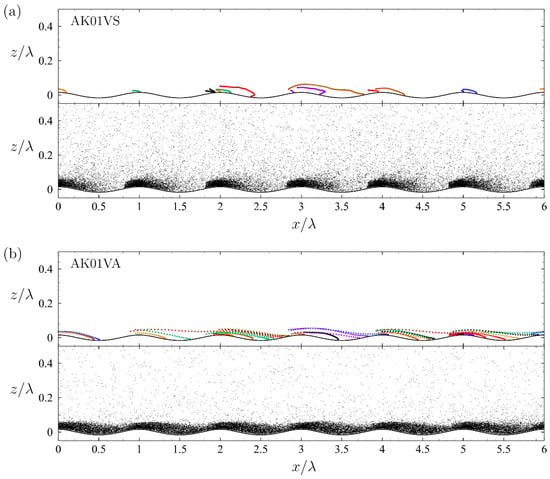
Figure 7.
The side view of the droplet trajectories sampled at discrete time moments with increment and the instantaneous droplet distribution for droplets injected with (a) wave orbital velocity, (case AK01VS) and (b) air velocity, (case AK01VA) in flows over wavy surface. Dots in the same color correspond to the time-evolving trajectory of an individual droplet.
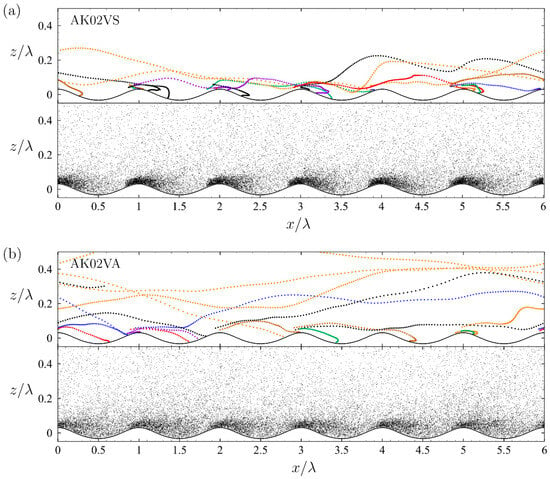
Figure 8.
The side view of the droplet trajectories sampled at discrete time moments with increment and the instantaneous droplet distribution for droplets injected with (a) wave orbital velocity, (case AK02VS) and (b) air velocity, (case AK02VA) in flows over wavy surface. Dots in the same color correspond to the time-evolving trajectory of an individual droplet.
6.1. Droplet-Laden Flows over Wavy Surface
The average droplet density profiles of vertical distributions , illustrated in Figure 3a, indicate that most droplets settle within a thin layer () during droplet-laden flows over a low-steepness wavy surface. However, different injection velocities of the droplets result in noticeable variations in their spatial distributions across the wave phases.
In scenarios where droplets are injected with the orbital velocity of the wavy surface ( in case AK01VS), they remain confined near the crest region. This phase-specific distribution indicates that an injection velocity aligned with surface motion limits the vertical and horizontal dispersion of droplets, concentrating them closer to the wave crest. The trajectories of these droplets (Figure 7a) are notably shorter than those in other droplet-laden scenarios (Figure 7b and Figure 8a,b), with most droplets moving slowly over a very short distance before entering the water surface near the crest region. The average droplet population density distribution (Figure 5j) and the side view of instantaneous droplet locations (Figure 7a) show that droplets accumulate in regions with minimal CVS formation, particularly near the crest. Consequently, only QSVs above the wave crest are mitigated by these droplets. The gathered droplets near the crest have insignificant effects on the FHVs and RHVs distributed closer to the trough.
In contrast, when droplets are injected with a velocity matching that of the surrounding air ( in case AK01VA), they disperse across the entire layer above the wavy surface, as illustrated by the droplet population density in Figure 5k and the side view of instantaneous droplet locations in Figure 7b. Droplets injected above the wave crest may travel over the leeward surface and return to the water near the wave trough, or they may cross the wave trough and enter the water on the next windward surface; both are the regions of active CVS formation. Consequently, the corresponding phase-averaged distributions of swirling strength, , and the cumulative occurrence counts of the three CVS types, , and , are nearly zero across the entire wave phase. This demonstrates a significant reduction in coherent vortex presence by the droplets.
The significant reduction in swirling strength and suppression of ejection and sweep events in case AK01VA (Figure 2e) imply a local decrease in Reynolds stress (Figure 3c,d) and, consequently, a reduction in momentum transfer from air to waves. This attenuation suggests a weakened form drag and potentially a reduced wind-wave growth rate. Although quantifying this effect lies beyond the present scope, such structural collapse in the airflow may contribute to the nonlinear saturation of wave growth under droplet-laden conditions.
6.2. Droplet-Laden Flows over Wavy Surface
In droplet-laden flows over a steeper wavy surface (), the average droplet population density , shown in Figure 3e, demonstrates that injected droplets accumulate within a thicker layer. This accumulation leads to a lower population density compared to flows over a less steep wavy surface. The mechanisms responsible for these differing average droplet population profiles can be realized by examining the droplet trajectories illustrated in Figure 8.
When droplets are injected with the water surface velocity (, as in case AK02VS), most droplets move slowly and remain confined to the lee side near the wave crest, with only a few rising and traveling at higher velocities, spanning several wavelengths, as illustrated in Figure 8a. Similar to the observations in case AK01VS, droplets do not accumulate in regions over the wave trough or along the windward surface, where CVS formation is most prominent. Consequently, droplets injected with the water surface velocity exert minimal influence on the airflow CVSs over the steeper wavy surface.
In contrast, when droplets are injected with the surrounding airflow velocity (, as in case AK02VA), some droplets travel within a wavelength before falling onto the water, while others escape the near-surface layer and become suspended in the higher airflow for a considerable duration. These suspended droplets are transported throughout the entire computational domain, resulting in a more dispersed droplet distribution pattern, as shown in Figure 8b. The diluted droplet population within the surface layer reduces the droplet-induced impact on the near-surface CVS, as evidenced in the right column of Figure 6.
7. Conclusions
This study explored the interaction between CVSs and spume droplets in a droplet-laden turbulent Couette flow over a wavy surface, simulating conditions relevant to the MABL. DNS provided detailed insights into the phase-dependent distribution of CVSs, the influence of wave steepness, and the effects of droplet injection velocity on turbulence dynamics. The following key conclusions and discussions summarize the findings and their broader implications.
The results of the droplet-free scenario reveal a phase-dependent distribution of CVSs. The FHVs and RHVs predominantly form near the wave trough, while the major distribution of QSVs occurs along the windward surface, extending from the trough to the crest. This distinct spatial variation in CVS distribution highlights the significant influence of wave phase on CVS topology in turbulent airflow over wavy surfaces. The phase dependence becomes increasingly pronounced as the wave steepness increases, further amplifying the modulation of turbulence by the wavy boundary. Due to this strong phase dependence, the impact of droplets on CVS formation is highly sensitive to the injection velocity, with different injection scenarios leading to varying degrees of interaction between the droplets and coherent vortices.
Droplet trajectories reveal that droplets injected at the surface velocity () exhibit shorter trajectories, remaining confined above the downwind surface near wave crests, where the formation of CVS is weak. This localized droplet behavior reduces the likelihood of interactions with CVSs, resulting in a minimal impact of droplets on attenuating swirling strength and Reynolds stresses. This limited influence of droplets on CVS remains consistent even as the wave steepness increases, reinforcing the negligible effect of droplets injected at the surface velocity.
Conversely, in the scenario where droplets are injected at the surrounding airflow velocity (), droplets disperse broadly throughout the flow, increasing the probability of interactions with coherent vortices across all wave phases. For low-steep waves, droplets injected above the wave crest exhibit elongated trajectories and remain within the surface layer where CVSs are active. They may return to the water near the wave trough or the next windward surface; both are the regions of active CVS formation. This leads to a substantial reduction in the swirling strength of CVSs and attenuates ejection and sweep events, which are responsible for turbulent momentum transport. In contrast, for steeper waves, many droplets escape the near-surface layer and become suspended in the higher airflow. This results in a more dispersed droplet distribution within the surface layer, thereby reducing the droplet-induced impact on the near-surface CVS.
The findings from this DNS study highlight the critical roles of wave steepness and droplet injection mechanisms in determining the extent of droplet-turbulence interactions. While this study focuses on idealized conditions, future work can expand upon these results by exploring more realistic scenarios, such as polydisperse droplet size distributions and wavefields with varying gravity-capillary properties.
It is worth emphasizing that airflow over short-crested or breaking waves is inherently more three-dimensional, featuring intense vertical jet-like ejections that likely dominate turbulent mixing in natural wind–wave environments. By contrast, the present simulations are limited to long-crested, non-breaking waves, allowing us to reveal the essential dynamics of droplet–vortex coupling without the added complexity of breaking-induced turbulence.
Author Contributions
Conceptualization, G.-H.L. and W.-T.T.; methodology, G.-H.L. and O.A.D.; software, G.-H.L.; validation, G.-H.L. and W.-T.T.; formal analysis, G.-H.L. and W.-T.T.; investigation, G.-H.L. and W.-T.T.; resources, W.-T.T.; data curation, G.-H.L. and O.A.D.; writing—original draft preparation, G.-H.L. and W.-T.T.; writing—review and editing, G.-H.L. and W.-T.T.; visualization, G.-H.L. and W.-T.T.; supervision, W.-T.T.; project administration, W.-T.T.; funding acquisition, W.-T.T. All authors have read and agreed to the published version of the manuscript.
Funding
This study was supported by the Taiwan National Science and Technology Council through grants 114-2611-M-002-018 and 113-2611-M-002-003. G.-H.L. was also supported by the Marine Sustainable Development and Research Project of NKUST under the 2024 Higher Education SPROUT Project of the Taiwan Ministry of Education and O.A.D. was supported by the Ministry of Education and Science of the Russian Federation (contract No. FFUF-2025-0005).
Data Availability Statement
The data presented in this study are available on request from the corresponding author. The data are not publicly available due to privacy or ethical restrictions.
Conflicts of Interest
The authors declare no conflict of interest.
References
- Gent, P.R.; Taylor, P.A. A numerical model of the air flow above water waves. J. Fluid Mech. 1976, 77, 105–128. [Google Scholar] [CrossRef]
- Chalikov, D.V. The numerical simulation of wind-wave interaction. J. Fluid Mech. 1978, 87, 561–582. [Google Scholar] [CrossRef]
- Belcher, S.E.; Hunt, J.C.R. Turbulent shear flow over slowly moving waves. J. Fluid Mech. 1993, 251, 109–148. [Google Scholar] [CrossRef]
- Sullivan, P.P.; McWilliams, J.C.; Moeng, C.H. Simulation of turbulent flow over idealized water waves. J. Fluid Mech. 2000, 404, 47–85. [Google Scholar] [CrossRef]
- Yang, D.; Shen, L. Characteristics of coherent vortical structures in turbulent flows over progressive surface waves. Phys. Fluids 2009, 21, 125106. [Google Scholar] [CrossRef]
- Druzhinin, O.A.; Troitskaya, Y.I.; Zilitinkevich, S.S. The study of droplet-laden turbulent air-flow over waved water surface by direct numerical simulation. J. Geophys. Res. 2017, 122, 1789–1807. [Google Scholar] [CrossRef]
- Druzhinin, O.A.; Troitskaya, Y.I.; Tsai, W.T.; Chen, P.C. The study of a turbulent air flow over capillary–gravity water surface waves by direct numerical simulation. Ocean Model. 2019, 140, 101407. [Google Scholar] [CrossRef]
- Chen, P.C.; Tsai, W.T.; Druzhinin, O.A.; Troitskaya, Y.I. The study of a turbulent air flow over capillary–gravity water surface waves: Characteristics of coherent vortical structures. Ocean Model. 2020, 150, 101621. [Google Scholar] [CrossRef]
- Balachandar, S.; Eaton, J.K. Turbulent dispersed multiphase flow. Annu. Rev. Fluid Mech. 2010, 42, 111–133. [Google Scholar] [CrossRef]
- Elghobashi, S. Direct numerical simulation of turbulent flows laden with droplets or bubbles. Annu. Rev. Fluid Mech. 2019, 51, 217–244. [Google Scholar] [CrossRef]
- Brandt, L.; Coletti, F. Particle-laden turbulence: Progress and perspectives. Annu. Rev. Fluid Mech. 2022, 54, 159–189. [Google Scholar] [CrossRef]
- Dritselis, C.D.; Vlachos, N.S. Numerical study of educed coherent structures in the near-wall region of a particle-laden channel flow. Phys. Fluids 2008, 20, 055103. [Google Scholar] [CrossRef]
- Richter, D.H.; Sullivan, P.P. Modification of near-wall coherent structures by inertial particles. Phys. Fluids 2014, 26, 103304. [Google Scholar] [CrossRef]
- Lee, J.; Lee, C. Modification of particle-laden near-wall turbulence: Effect of Stokes number. Phys. Fluids 2015, 27, 023303. [Google Scholar] [CrossRef]
- Gao, W.; Samtaney, R.; Richter, D.H. Direct numerical simulation of particle-laden flow in an open channel at . J. Fluid Mech. 2023, 957, A3. [Google Scholar] [CrossRef]
- Feng, Y.; Liu, H.; Zheng, X. The modulation of coherent structures by the near-wall motions of particles. J. Fluid Mech. 2024, 981, A26. [Google Scholar] [CrossRef]
- Druzhinin, O.A.; Tsai, W.T. Investigation of vortex structure modulation by spume droplets in the marine atmospheric boundary layer by numerical simulation. J. Mar. Sci. Eng. 2022, 10, 856. [Google Scholar] [CrossRef]
- Fairall, C.W.; Banner, M.L.; Peirson, W.L.; Asher, W.; Morrison, R.P. Investigation of the physical scaling of sea spray spume droplet production. J. Geophys. Res. 2009, 114, C10001. [Google Scholar] [CrossRef]
- Andreas, E.L.; Jones, K.F.; Fairall, C.W. Production velocity of sea spray droplets. J. Geophys. Res. 2010, 115, C12065. [Google Scholar] [CrossRef]
- Troitskaya, Y.I.; Kandaurov, A.; Ermakova, O.; Kozlov, D.; Sergeev, D.; Zilitinkevich, S. Bag-break-up fragmentation as the dominant mechanism of sea-spray production at high winds. Sci. Rep. 2017, 7, 1614. [Google Scholar] [CrossRef]
- Kudryavtsev, V.N.; Makin, V.K. Impact of ocean spray on the dynamics of the marine atmospheric boundary layer. Boundary-Layer Meteorol. 2011, 140, 383–410. [Google Scholar] [CrossRef]
- Mueller, J.A.; Veron, F. Impact of sea spray on air–sea fluxes. Part I: Results from stochastic simulations of sea spray drops over the ocean. J. Phys. Oceanogr. 2014, 44, 2817–2834. [Google Scholar] [CrossRef]
- Andreas, E.L. Spray stress revisited. J. Phys. Oceanogr. 2004, 34, 1429–1440. [Google Scholar] [CrossRef]
- Troitskaya, Y.I.; Ezhova, E.V.; Soustova, I.A.; Zilitinkevich, S.S. On the effect of sea spray on the aerodynamic surface drag under severe winds. Ocean Dyn. 2016, 66, 659–669. [Google Scholar] [CrossRef]
- Hunt, J.C.R.; Wray, A.A.; Moin, P. Eddies, streams, and convergence zones in turbulent flows. In Proceedings of the 1988 Summer Program in Its Studying Turbulence Using Numerical Simulation Databases; Center for Turbulence Research: Stanford, CA, USA, 1988; Volume 2, pp. 193–208. [Google Scholar]
- Chong, M.S.; Perry, A.E.; Cantwell, B.J. A general classification of three-dimensional flow fields. Phys. Fluids 1990, 2, 765–777. [Google Scholar] [CrossRef]
- Jeong, J.; Hussain, F. On the identification of a vortex. J. Fluid Mech. 1995, 285, 69–94. [Google Scholar] [CrossRef]
- Zhou, J.; Adrian, R.J.; Balachandar, S.; Kendall, T.M. Mechanisms for generating coherent packets of hairpin vortices in channel flow. J. Fluid Mech. 1999, 387, 353–396. [Google Scholar] [CrossRef]
- Chakraborty, P.; Balachandar, S.; Adrian, R.J. Local vortex identification criteria: Inter-relationships and a unified outlook. Fluid Mech. Appl. 2006, 79, 111–115. [Google Scholar]
Disclaimer/Publisher’s Note: The statements, opinions and data contained in all publications are solely those of the individual author(s) and contributor(s) and not of MDPI and/or the editor(s). MDPI and/or the editor(s) disclaim responsibility for any injury to people or property resulting from any ideas, methods, instructions or products referred to in the content. |
© 2025 by the authors. Licensee MDPI, Basel, Switzerland. This article is an open access article distributed under the terms and conditions of the Creative Commons Attribution (CC BY) license (https://creativecommons.org/licenses/by/4.0/).