Abstract
This study presents a comprehensive numerical and theoretical analysis comparing the aerodynamic performance of a racetrack trajectory vertical axis wind turbine with a baseline VAWT. The racetrack trajectory comprises two parallel straight segments connected by semicircular arcs. However, two critical research gaps remain: the aerodynamic performance of this non-axisymmetric rotor, especially its sensitivity to inflow direction, is not well understood, and a computationally efficient theoretical model for its rapid design is lacking. Using unsteady Reynolds-Averaged Navier–Stokes (URANS) simulations to systematically quantify this sensitivity, and developing an adapted double multiple streamtube (DMST) model, the performance of both turbines is evaluated across tip speed ratios (TSRs) of 1.5–4 and inflow angles β = 0–90°. Results indicate that the racetrack turbine achieves a peak power coefficient of 0.49 at TSR = 2.5 and β = 90°, 16.7% higher than the baseline VAWT. Its performance is highly sensitive to inflow direction, whereas the baseline operates more uniformly across angles. Flow field and wake analyses reveal that the racetrack turbine exhibits faster wake recovery and lower turbulence intensity downstream under optimal inflow. This study demonstrates the potential of racetrack turbines for enhanced directional efficiency in marine wind conditions and validates the adapted DMST model as a reliable tool for preliminary design.
1. Introduction
The global imperative to transition to sustainable, renewable energy has placed wind power at the forefront of technological innovation. According to the Global Wind Report 2025, global wind power capacity is projected to exhibit a compound annual growth rate of 8.8% over 2025–2030, underscoring its pivotal role in the future energy system []. Although Horizontal axis wind turbines (HAWTs) dominate utility-scale wind farms owing to their high peak efficiency, deployment in marine and other complex settings is constrained by excessive noise, visual impact, and sensitivity to turbulent, multi-directional winds [,].
Vertical axis wind turbines (VAWTs) offer a promising alternative in such settings. Their principal advantage is omni-directional operation, enabling energy capture from any wind direction without a yaw mechanism []. Furthermore, their drivetrain and generator are typically located at the base, thereby simplifying maintenance and reducing structural costs. The lower tip speed ratios (TSRs) of VAWTs also reduce noise emissions and visual intrusion, enhancing public acceptance []. However, the widespread adoption of VAWTs is constrained by their suboptimal aerodynamic efficiency, typical power coefficient (Cp) values of 0.2–0.35 are notably lower than the 0.35–0.45 achieved by modern HAWTs []. This performance gap largely arises from the complex, unsteady flow inherent to their operation.
The geometric configuration and design type of VAWTs govern their aerodynamic performance and operational limits. The Darrieus turbine, a lift-driven device, attains higher efficiency at optimal TSRs but is sensitive to dynamic stall. A key factor is the circular blade trajectory, which imposes an inherent motion constraint. The circular trajectory forces the blades to experience a periodic variation in angle of attack (AoA), frequently exceeding the static stall threshold. Consequently, extensive flow separation develops, precipitating dynamic stall, pronounced torque oscillations, and aerodynamic instabilities, as evidenced by PIV measurements [,]. The resulting cyclic loads induce pronounced structural vibrations and fatigue, accompanied by broadband aerodynamic noise [], which further impairs self-starting characteristics. The high starting torque requirement, intensified by flow separation and adverse near-wake vortices at moderate TSRs, also constrains performance in marine settings []. In contrast, the Savonius rotor, a drag-driven device, provides excellent self-starting torque and robust construction but is fundamentally limited by low aerodynamic efficiency, with a maximum Cp rarely exceeding 0.18 []. The efficiency loss arises from the negative torque generated in the downwind zone, which opposes the positive torque produced in the upwind zone []. Hybrid Darrieus-Savonius configurations have been developed to couple the high efficiency of the former with the self-starting capability of the latter. Although such hybrids broaden the operational range, they constitute a trade-off rather than a breakthrough, since the inherent dynamic stall of the Darrieus rotor persists, and additional structural complexity and drag penalties are typically introduced [].
Many studies have sought to mitigate these inherent limitations through aerodynamic and structural measures. Passive and active flow control techniques have been widely investigated [,]. For example, integrating vortex generators [] or leading-edge protuberances [] is intended to energize the boundary layer and delay boundary layer separation. Active methods, such as plasma actuators, have demonstrated performance gains by modulating flow attachment at high AoAs, experiments by Maleki et al. [] reported enhancements of up to 38%. Meanwhile, structural optimizations including variable pitch mechanisms [] and biomimetically inspired flexible blades [], have been explored to dynamically optimize the AoA throughout the rotation cycle. However, these techniques often need undesirable trade-offs, greater system complexity, higher manufacturing and maintenance costs, and additional mechanical losses, which can undermine the turbine’s economic feasibility and long-term reliability [].
The evolution of aerodynamic modelling for VAWTs has been instrumental in addressing these challenges. Early momentum theory models, such as the streamtube model and its refined variant, the Double Multiple Streamtube (DMST) model developed by Paraschivoiu [], provided computationally efficient tools for preliminary performance estimation by idealizing the rotor as a set of actuator discs. Although the DMST model remains valuable for parametric analysis, its steady-state assumptions limit its ability to capture transient phenomena, including dynamic stall and wake evolution. To address these shortcomings, higher-fidelity approaches have become necessary. Vortex methods, which track vorticity shed from the blades and its subsequent convection, offer a more physically accurate representation of wake dynamics and turbine interference at reasonable computational cost []. The most comprehensive insights, however, are provided by Computational Fluid Dynamics (CFD). Unsteady Reynolds-Averaged Navier–Stokes (URANS) simulations, often employing the k-ω Shear Stress Transport (SST) [] and k-ε turbulence model [] due to its superior performance in predicting adverse pressure gradient flows, have become the industry standard for resolving flow fields, dynamic stall vortices, and blade vortex interactions []. For capturing even more detailed turbulent energy cascades, Large Eddy Simulation (LES) has been increasingly employed, although at a highly computational expense for routine design analysis []. The application of CFD involves detailed mesh generation, often with inflation layers to resolve the viscous sublayer, and thorough independence studies for mesh, time step, and domain size to ensure the reliability of the results []. These computational tools have been instrumental for assessing blade geometry optimization and flow control techniques, contributing to verified performance gains in hybrid rotor systems.
Given the fundamental limitations imposed by the circular trajectory, non-circular blade paths have emerged to enhance performance []. Studies indicate that departing from conventional circular kinematics yields aerodynamic benefits by reshaping the temporal evolution of blade motion []. In particular, a racetrack trajectory (RT) has attracted considerable interest for redistributing the AoA and relative velocity throughout the cycle. The proposed design employs a racetrack composed of two parallel straight segments connected by semicircular arcs, inspired by innovative systems such as the Airloom [,]. Maintaining the blades near their optimal lift-producing AoA over an extended azimuthal sector suppresses dynamic stall and yields a more uniform torque profile [].
Building on this foundational concept, the present study investigates a VAWT with RT configuration. However, two key challenges remain. Firstly, the specific aerodynamic behavior and directional sensitivity of this non-axisymmetric rotor are incompletely understood. Its performance is highly dependent on the inflow direction, but this has not been systematically quantified. Secondly, the development of a robust computationally efficient aerodynamic model, such as an adapted DMST framework capable of capturing the unique physics of this non-circular trajectory, is crucial for preliminary design and optimization, and is currently lacking.
To address these gaps, this study aims to conduct a comprehensive numerical and theoretical investigation. The main contributions and novelty of this paper are as follows:
- Establish a high-fidelity, validated CFD model using Ansys Fluent 2022 R1 for the VAWT with RT and a baseline VAWT.
- Provide a systematic quantification of the VAWT with RT’s power characteristics and directional sensitivity across a wide range of TSRs and inflow angles β = 0–90°.
- Clarify the physical flow mechanisms responsible for this high directional sensitivity through detailed analysis of transient flow fields, vorticity, and wake development.
- Develop and validate an adapted DMST theoretical model for this VAWT with RT, providing an efficient and accessible tool for future design space exploration and optimization.
The remainder of this paper is organized as follows. Section 2 introduces the geometric configurations and numerical setup. Section 3 details the computational domain, mesh, time independence study and numerical validation. Section 4 outlines the theoretical framework of the adapted DMST model. Section 5 presents and discusses the comparative results of performance, flow fields, and wake development. Section 6 discusses the limitations and provides suggestions for future work. Finally, Section 7 summarizes the key conclusions.
2. Geometry and Case Setup
2.1. Geometric Models
This study compares a baseline VAWT and a VAWT with RT. The baseline VAWT features three blades with a NACA 0021 aerofoil, rotating along a circular trajectory. This configuration is widely studied and serves as a benchmark for performance comparison. The VAWT with RT uses a racetrack shaped configuration, it consists of two parallel straight segments connected by semicircular arcs. Here, R denotes the radius of the semicircular arcs at both ends, and L represents the length of each straight segment. Thus, the total length of a racetrack trajectory is 2L + 2πR. This geometry is expected to enhance wind energy capture under multidirectional inflow conditions.
For consistency in aerodynamic evaluation, both turbine models use the NACA 0021 aerofoil. Key geometric parameters include number of blades (N), chord length (c), swept area (A), etc. Three-dimensional schematic views of both turbines are shown in Figure 1. The detailed geometric parameters for both models are summarized in Table 1.
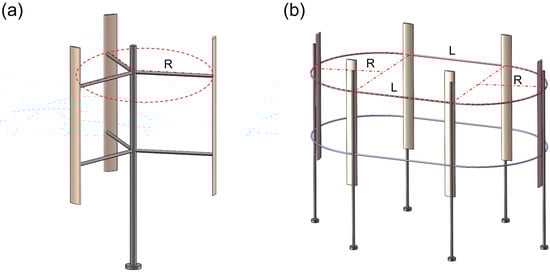
Figure 1.
Three-dimensional sketch of baseline VAWT (a) and VAWT with RT (b).

Table 1.
VAWT and VAWT with RT parameters.
2.2. Computational Domain and Mesh Generation
A two-dimensional computational domain was established to accurately simulate the aerodynamic performance and flow field, as shown in Figure 2. A large rectangular domain was defined to ensure that the boundary conditions did not influence the flow around the turbine and to allow for full development of the downstream wake. The inlet and outlet are located at distances Lin = 10D and Lout = 30D from the rotor center, respectively, while the top and bottom boundaries are placed at Lsym = 10D.
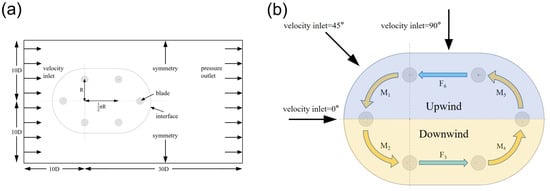
Figure 2.
Computational domain and boundary conditions of the VAWT with RT. (a) Overall layout; (b) Detailed view of the blade motion.
Figure 2 illustrates the computational domain and boundary conditions for the VAWT with RT. The left boundary is defined as a velocity inlet with U∞ = 9 m/s and inflow angle β = 0°, 30°, 45°, 60°, 90°. The right boundary is set as a pressure outlet with zero-gauge pressure. Symmetry boundaries are applied at the top and bottom. The rotating zone encompasses the VAWT with RT, and no-slip wall conditions are applied on the blade surfaces. The motion trajectory of the rotor is defined and controlled via a user defined function. The specific boundary conditions, including their types and dimensions, are summarized in Table 2 [].
Table 2.
Boundary conditions.
A hybrid meshing approach is adopted. The background domain is discretized using unstructured cells to enable smooth mesh coarsening away from the rotor, while structured mesh is applied around the blades to resolve the boundary layer region and capture near wall gradients. A small near-body overset subdomain moves with each blade. To minimize interpolation dissipation, the cell size across the interface is matched to the background mesh. Overset mesh technology is employed to couple the rotating and stationary domains through interpolation. The first layer mesh spacing normal to the wall is selected to ensure y+ < 1. Overset methods are widely used in VAWT and moving body simulations due to their robustness in handling complex relative motions. Mesh illustrations and local refinements are shown in Figure 3.
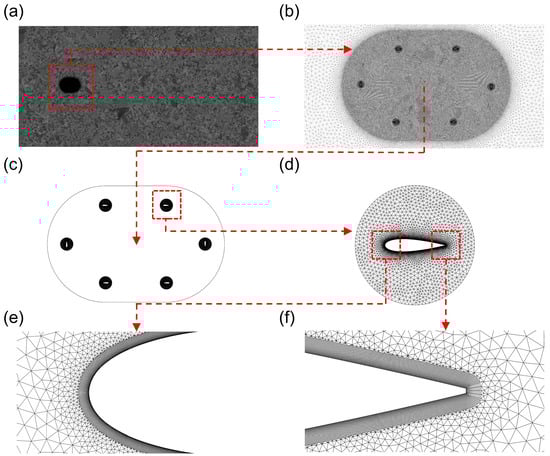
Figure 3.
The computational mesh distribution and local mesh refinement of the VAWT with RT. (a) Overall domain; (b) Rotor region; (c) Six aerofoils; (d) One aerofoil; (e) Leading-edge detail; (f) Trailing-edge detail.
A critical aspect of the mesh generation is the near wall treatment, which is essential for the chosen turbulence model. To ensure its accurate application, the first layer mesh spacing normal to the wall was set to 3 * 10−5 m, with 20 inflation layers and a growth rate of 1.1, to ensure that the non-dimensional wall distance y+ < 1. To validate this, the y+ distribution on the blade surfaces was analyzed. Figure 4 shows the wall y+ values for the VAWT with RT. It is clear that the y+ value is maintained below 1.0 across the blade surface, confirming the mesh’s suitability for accurately capturing boundary layer phenomena such as flow separation and dynamic stall.
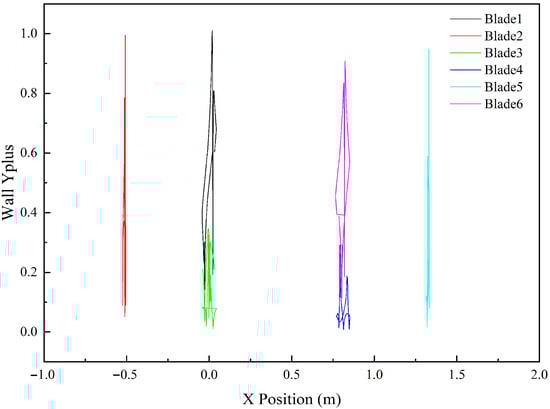
Figure 4.
y+ distribution on the blade surfaces for the VAWT with RT at TSR = 2.
2.3. Aerodynamic Parameters
The performance of the wind turbines is quantified using non-dimensional aerodynamic coefficients. The aerodynamic performance of the turbines is characterized by the lift coefficient (Cl), drag coefficient (Cd), and moment coefficient (Cm), which are calculated from the unsteady forces acting on the blades []. The coefficients are defined as follows:
where FL and FD are the lift and drag forces, respectively, ρ is the air density, U∞ is the freestream wind velocity, c is the chord length, and H is the blade height.
The tip speed ratio (TSR) is a key operational parameter, defined as the ratio of the blade tip speed to the freestream wind speed:
The primary performance metric is the power coefficient (Cp), which represents the turbine’s efficiency in converting the kinetic energy of the wind into mechanical power:
where P is the mechanical power extracted by the turbine. For a blade in rotational motion, P1 = M * ω, where M is the torque and ω is the angular velocity. For a blade in linear motion, P2 = F * v, where F is the force and v is the motion speed. Here, A is the rotor swept area.
The blade flow is characterized by the chord-based Reynolds number (Re), and the Reynolds number is calculated as:
where μ is the dynamic viscosity and ν is the kinematic viscosity. For the operating conditions in this study, the blade Reynolds number is approximately Re = 5.2 * 104.
At an azimuthal blade position θ, the effective relative velocity magnitude of the blade is:
Furthermore, the local Reynolds number is not constant. It varies significantly throughout the blade’s trajectory as the local effective velocity changes []. For a blade on a VAWT, the local Reynolds number at position θ is:
At the optimal TSR of 2.5, the local Reynolds number fluctuates over a wide range, from approximately Re = 8 * 104 during periods of low relative velocity to Re = 1.85 * 105 during the high velocity upwind pass.
2.4. Calculation Setup
Numerical simulations were conducted using ANSYS Fluent. The governing equations are the incompressible URANS equations.
The selection of the turbulence model is critical and is based on the blade and local Reynolds number regimes identified in Section 2.3. The operational range falls within the moderate Reynolds number regime, which is characterized by complex, unsteady flow phenomena, including dynamic stall, laminar to turbulent boundary layer transition, and massive flow separation.
Based on these physical phenomena, the k-ω SST model was employed. This model is recommended for such applications for two key reasons:
- It is a transitional model, designed to capture laminar to turbulent transition that is prevalent in this Reynolds number range.
- It combines the advantages of the k-ω model, which is superior for resolving the viscous sublayer, with the k-ε model, which is more robust in the far field. Crucially, compared to standard k-ε models, the k-ω SST model demonstrates superior performance in predicting flow separation under strong adverse pressure gradients []. It is a defining characteristic of dynamic stall on VAWT blades.
The k-ω SST model thus provides the necessary fidelity to capture unsteady separation and vortex dynamics across the local Reynolds number range. Second-order discretization schemes were applied to both spatial and temporal terms. The convergence criterion was set to require residuals to drop below 10−5, while the power coefficient was monitored until it reached a stable periodic solution.
3. Sensitivity Analysis and Validation
3.1. Computational Domain Sensitivity
The extent of the computational domain strongly affects the accuracy of wind turbine simulations, particularly the downstream wake development []. To assess domain independence, three domain sizes were tested: 10D × 20D, 20D × 40D, and 30D × 60D. The average Cp was calculated for each domain at TSR = 2.5. As shown in Figure 5, the instantaneous Cm curve of one blade for the small domain shows deviations, while the medium and large domains are nearly identical.
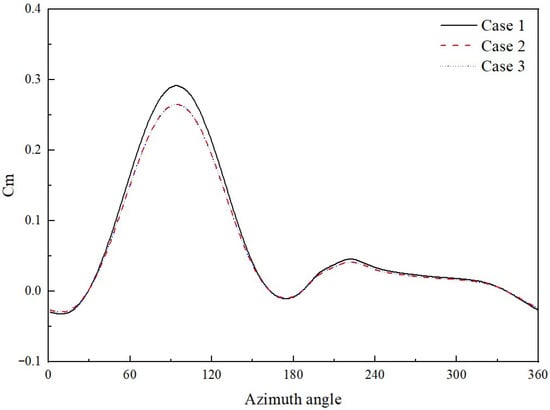
Figure 5.
Instantaneous moment coefficient vs. azimuth angle of one blade for computational domain independence at TSR = 2.5.
Quantitatively, the difference in the average Cp between the medium and large domains was less than 0.5%, while the small domain led to an 8.8% deviation due to blockage effects. This result indicates that the medium domain is sufficiently large to avoid blockage effects. The detailed results are summarized in Table 3.
Table 3.
Computational domain independence study.
A discussion of the blockage ratio further supports this []. The blockage ratio is defined as the ratio of the turbine’s frontal area to the computational domain’s cross-sectional area. For the baseline VAWT in the 20D wide domain, the blockage ratio is D/20D = 5%. As blockage ratios are below the generally accepted 5% threshold, the influence of domain boundaries on the turbine aerodynamics is considered negligible. This aligns with the findings of our domain independence study.
Therefore, the medium computational domain was used for all subsequent simulations to balance accuracy and computational cost.
3.2. Mesh Sensitivity
Mesh resolution is crucial for resolving boundary layer gradients and capturing unsteady aerodynamic stresses. Three mesh densities were evaluated: 170,000 cells, 255,000 cells, and 374,000 cells. The findings in Figure 6 demonstrate that the medium and fine meshes provide comparable Cm values, whereas the coarse mesh introduces a noticeable divergence.
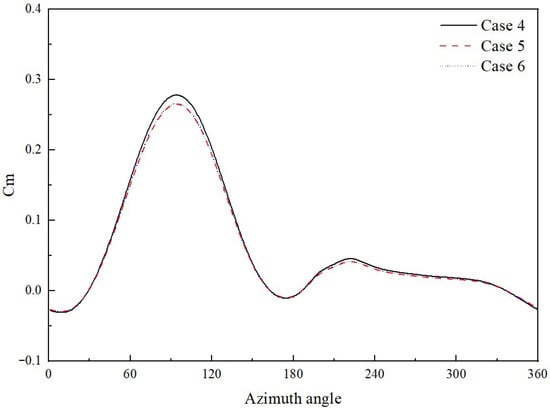
Figure 6.
Instantaneous moment coefficient vs. azimuth angle of one blade for mesh independence at TSR = 2.5.
In terms of the average Cp, the medium and fine meshes provide comparable Cp values, with a relative difference of less than 0.5%, but the coarse mesh introduces a divergence of 4.5%. The detailed results are summarized in Table 4. As a result, the medium mesh was chosen because it provides an optimal balance between numerical precision and computing efficiency.
Table 4.
Mesh independence study.
3.3. Time Step Sensitivity
In unsteady simulations of VAWTs, the selection of time step directly affects the accuracy of the predicted torque fluctuations and power output. To evaluate temporal convergence, three time steps were tested, corresponding to azimuthal increments of 0.5°, 1°, and 2° per step. Figure 7 illustrates the instantaneous moment coefficient over one full revolution. The results show that the 0.5° and 1° time steps yield nearly identical curves, whereas the 2° time step introduces visible discrepancies.
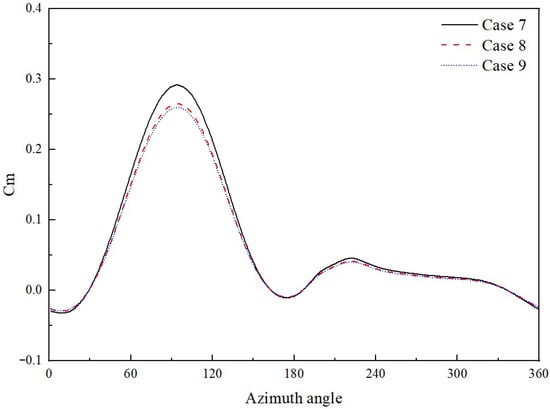
Figure 7.
Instantaneous moment coefficient vs. azimuth angle of one blade for time step independence at TSR = 2.5.
The relative difference in average Cp between the 0.5° and 1° cases was less than 1%, while the 2° step introduced a 9.3% discrepancy. The detailed results are summarized in Table 5. Thus, the 1° increment was chosen for all subsequent simulations, ensuring a robust compromise between accuracy and computational cost.
Table 5.
Time step independence study.
3.4. Validation Against Experimental and Numerical Results
To validate the current 2D CFD modeling approach and to properly estimate the impact of 3D effects, the simulation results were compared with experimental data reported by Castelli et al. [] and with other numerical results from the literature [,,,].
To account for this overprediction and to estimate the 3D performance, a proven 3D correction factor based on the work of McLaren [] was applied to our 2D results. This correction, shown in Equation (9), estimates the power reduction based on the rotor’s aspect ratio (height correction factor τ = 1.15 and wind speed factor k = 1.1).
Figure 8 shows the variation in Cp with TSR. The Baseline_2D simulation results clearly overpredict the power coefficient compared to the experimental data. This discrepancy is expected and is mainly due to the 2D simplification, which neglects 3D aerodynamic effects such as tip losses and spanwise vortex shedding. In Figure 8, Baseline_3D represents Baseline_2D results after the 3D correction was applied. This corrected curve shows good agreement with the 3D experimental measurements from Castelli et al. [], especially in reproducing the overall trend and the optimal TSR.
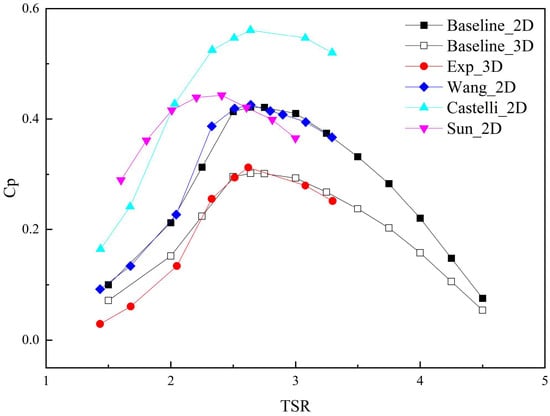
Figure 8.
Comparison of VAWT power coefficient between CFD results and experimental results.
The choice of turbulence model is critical in this case. Our findings align well with other studies, such as Wang et al. [], which also found the k-ω SST model to be accurate. In contrast, it is observed that simpler one-equation models, Spalart–Allmaras model used by Sun et al. [], can produce large discrepancies relative to experimental data, especially at low to medium TSRs. Other models, such as the two-equation realizable k-ε model used by Castelli et al. [], produce 50% discrepancies in low to medium TSRs. Our results demonstrate that the k-ω SST model effectively captures the fundamental physics. Therefore, this validation confirms that our 2D URANS approach, combined with the 3D correction factor, provides a valid and reliable methodology for the comparative analysis in this study.
4. Method
The adapted DMST model for the VAWT with RT is developed by separating the analysis into two geometric components: the curved sections and the straight sections. The model calculates the aerodynamic forces and power contributions from each section independently and then sums them to find the total turbine performance. The overall computational workflow is illustrated in the flowchart in Figure 9.
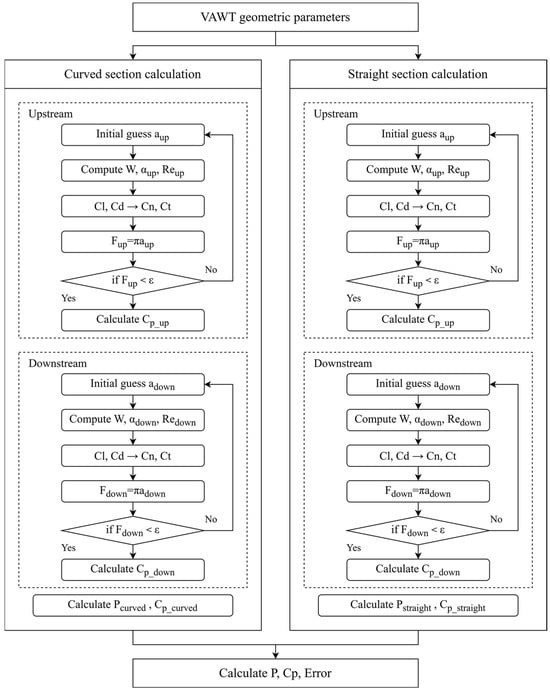
Figure 9.
Flowchart of the computational procedure for the adapted DMST model.
4.1. Upstream Region of the Curved Section
The curved section of the VAWT with RT is characterized by a radius (R), blade height (H), chord length (c), and number of blades (N). The curved length is calculated as:
The solidity, representing the ratio of blade area to the swept path, is:
The swept area is defined as:
The lift and drag coefficients, Cl and Cd, are modeled from XfoilP4 software. The normal and tangential force coefficients are computed as:
For the upstream region, the relative velocity normalized by the freestream velocity V∞ is:
where TSR is the tip speed ratio, and a is the upstream induction factor. The angle of attack is:
The induction factor a is determined by solving the momentum equation:
This is solved numerically with an initial guess of a = 0.2. The power coefficient for the upstream curved section is calculated as:
4.2. Downstream Region of the Curved Section
The downstream region accounts for the wake effect from the upstream region. The velocity is:
where a is the upstream induction factor. The relative velocity is:
where a′ is the downstream induction factor. The AoA is:
The downstream induction factor a′ is solved using:
The downstream power coefficient is:
The total power coefficient for the curved section is:
and the power output is:
4.3. Upstream Region of the Straight Section
The straight section uses a factor (Z) to define its effective length:
The solidity is:
The swept area is:
The aerodynamic coefficients Cl, Cd, Cn, and Ct are identical to those used for the curved section. The relative velocity and AoA are computed as in the upstream curved section, using σstraight instead of σcurved.
The upstream induction factor a for the straight section is solved using the same momentum equation as for the curved section, substituting σstraight. The power coefficient Cp_up is computed similarly, using σstraight.
4.4. Downstream Region of the Straight Section
The downstream region for the straight section uses the same equilibrium velocity, where a is the upstream induction factor for the straight section. The relative velocity and AoA are computed as in the downstream curved section, using σstraight.
The downstream induction factor a′ and power coefficient Cp_down are calculated using the same methodology as for the curved section. The total power coefficient is:
4.5. Total Power and Validation
The total power output is the sum of contributions from both sections:
As calculated before, so the total power coefficient is:
To validate the model, CFD simulations are conducted for the VAWT with RT under the same conditions. The CFD results are compared with the model predictions, and the error is calculated as:
5. Results and Analysis
5.1. Power Performance Analysis
The aerodynamic performance of the VAWT with RT and the baseline VAWT was systematically evaluated and compared across TSRs from 1.5 to 4 and under varying inflow angles β = 0°, 30°, 45°, 60°, 90°. The resulting Cp and power curves, depicted in Figure 10, reveal fundamental differences in their operational behavior and efficiency.
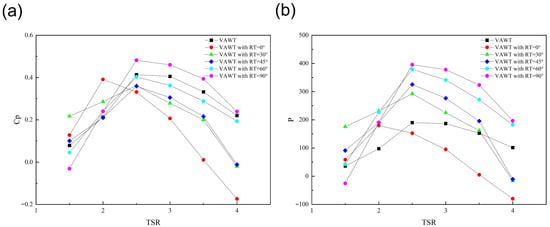
Figure 10.
Cp (a) and Power (b) comparison of VAWT and VAWT with RT at various inflow angles.
The baseline VAWT, due to its axisymmetric geometry, demonstrates nearly isotropic characteristics. Its Cp curves for different inflow angles cluster together, confirming its inherent ability to perform consistently regardless of wind direction. It achieves a peak Cp of 0.42 at its optimal TSR of 2.5.
In contrast, the performance of the VAWT with RT demonstrates a strong and systematic dependence on the inflow direction. The anisotropy is a direct consequence of its non-axisymmetric blade trajectory. The lowest performance is observed at β = 0°, where complex blade interference occurs on the parallel tracks. Performance improves progressively as the inflow angle increases, reaching a maximum at β = 90°. In this optimal orientation, the blades on the straight segments interact with undisturbed flow, maximizing lift generation. The VAWT with RT achieves a peak Cp of 0.49 at TSR = 2.5 and β = 90°, representing a significant 16.7% improvement over the baseline VAWT. However, at non-optimal angles, its performance can be lower than VAWT, but it also can generate more power than VAWT, highlighting a trade-off between peak performance and directional robustness.
5.2. Validation of the Aerodynamic Model
Given its superior performance, the 90° inflow condition was selected to validate the DMST mathematical model developed for the VAWT with RT. Figure 11 compares the Cp-TSR curve predicted by the DMST model against the CFD results at β = 90°.
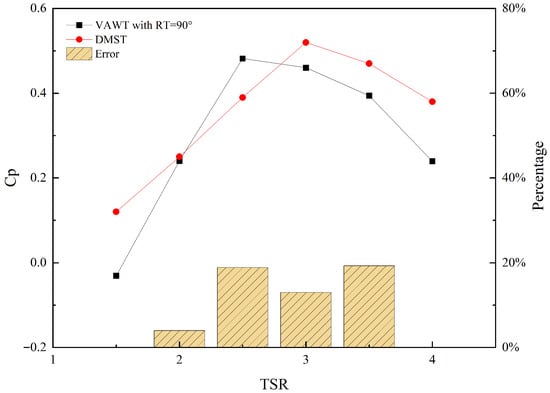
Figure 11.
Comparison of the Cp predicted by the DMST model and CFD simulations for the VAWT with RT at an inflow angle of 90°.
The comparison highlights three distinct behaviours. At low TSRs, the model does not reproduce the sign of Cp, predicting Cp = 0.12 while the CFD value is negative, reflecting strong dynamic stall effects beyond the scope of the steady momentum assumptions. In the optimal range, the model predicts a flatter peak at TSR = 3.0 (Cp = 0.52), whereas the CFD peak occurs at TSR = 2.5 (Cp = 0.48). At TSR = 2.5, the relative error is 19.0%. At high TSRs, the model tends to overpredict performance, as steady-state assumptions do not include the destructive vortex-blade interactions.
Therefore, the approach is validated as an efficient preliminary design tool, as it reproduces the overall shape of the performance curve and the approximate location of the peak.
5.3. Flow Field Characteristics
5.3.1. Flow Structures at Different TSRs
The operational aerodynamics of wind turbines are governed by the continuous formation, interaction, and shedding of vortices. This dynamic process is visualized in Figure 12 through vortex contours captured at TSRs of 1, 1.5, 2, 2.5, 3, 3.5 and 4 were analyzed and compared with the VAWT.
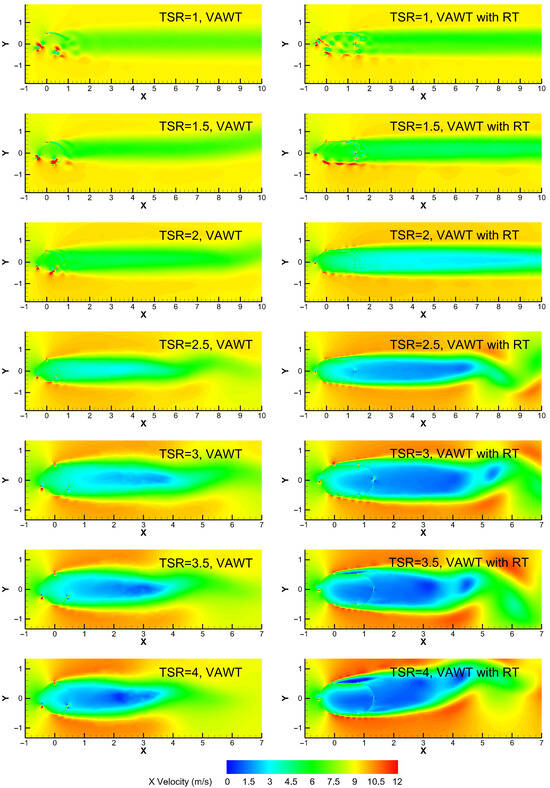
Figure 12.
X direction Velocity contour of the VAWT and the VAWT with RT at inflow angles of 0° with different TSRs.
At a low TSR of 1, both turbines exhibit large-scale flow separation and wide, highly turbulent wakes, indicative of inefficient operation dominated by dynamic stall and massive vortex shedding. As the TSR increases to the optimal range around 2.5, the flow becomes more attached. The baseline VAWT develops a more periodic and organized vortex shedding pattern. For the VAWT with RT at β = 0°, the flow field reveals a key performance-limiting mechanism, a significant momentum deficit and a complex vortex system persist in the gap between the two parallel tracks. This inefficient flow structure, characterized by strong blade-wake interactions where downwind blades pass through the turbulent wake of upwind blades, explains the lower power extraction efficiency compared to the VAWT at this angle. At a high TSR of 4, the wake of the VAWT with RT remains more disordered and wider than that of the VAWT, corroborating the performance decline observed in the Cp-TSR curves.
5.3.2. Directional Sensitivity at Various Inflow Angles
The profound influence of inflow angle on the VAWT with RT’s performance is further illustrated by examining the flow fields at a TSR of 2.5, as shown in Figure 13.
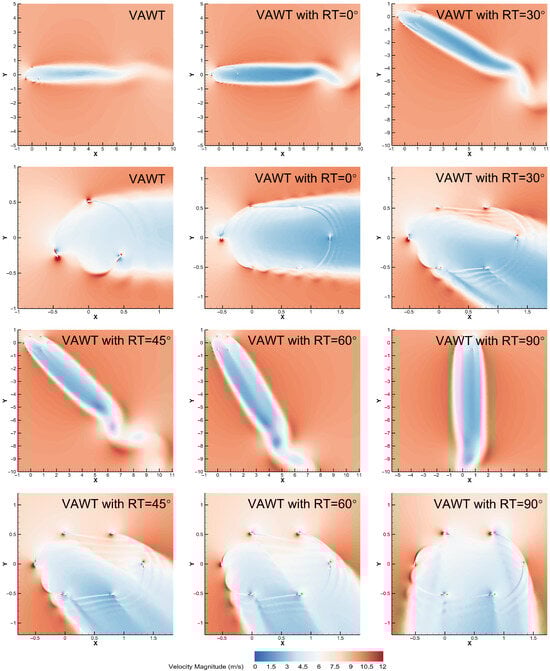
Figure 13.
Velocity contour of the VAWT and the VAWT with RT at various inflow angles with TSR = 2.5.
Figure 13 presents the velocity contour of the VAWT and the VAWT with RT at various inflow angles with TSR = 2.5. For the baseline VAWT, the wake structure and velocity distribution remain qualitatively consistent across all angles, reinforcing its directionally robust nature. In stark contrast, the flow topology of the VAWT with RT undergoes transformations. At β = 0°, where the flow is axial to the straight segments, a wide and chaotic low momentum region forms between the two parallel blade tracks. This indicates severe flow separation and extensive blade-blade interference, where downwind blades operate within the turbulent wake of upwind ones, leading to minimal effective energy extraction. As the angle increases to 30° and 60°, the flow becomes oblique, resulting in asymmetric blade loading. The wake becomes skewed, with patchy low-velocity zones, disrupting efficient energy capture. At the optimal β = 90°, the flow aligns perfectly with the rotor’s sweep plane. A symmetric, stable, and narrow band of low velocity forms directly behind the rotor, accompanied by a long and coherent downstream wake. This flow structure signifies an organized momentum extraction process, where blades on the windward side consistently interact with high energy, undisturbed flow, thereby maximizing energy capture.
5.3.3. Vortex Dynamics at Various Inflow Angles
The vorticity contours at TSR = 2.5 for β = 0° and 90° are presented in Figure 14, highlighting the vortex generation and shedding mechanisms.
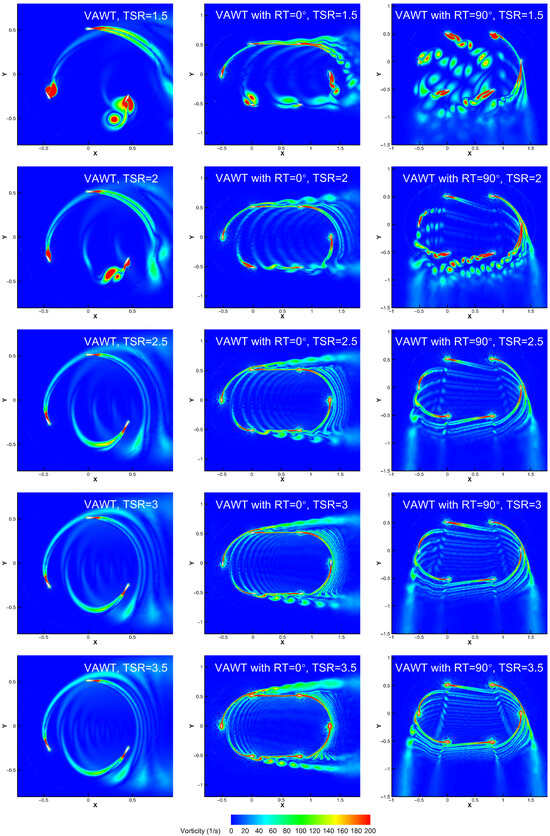
Figure 14.
Vorticity contour of the VAWT and the VAWT with RT at inflow angles of 0° and 90° with TSR = 1.5, 2, 2.5, 3, 3.5.
At the optimal β = 90° of in the right column of Figure 14, the vorticity field exhibits a well-organized, periodic shedding pattern. At lower TSRs, strong leading-edge vortices are shed from the blades, but they are convected downstream relatively quickly, minimizing negative interactions. As the TSR approaches the optimal TSR = 2.5, the blade timing and vortex shedding synchronize, allowing each blade to operate in a relatively clean inflow, which manifests as efficient momentum extraction and high Cp. This orderliness is the visual manifestation of efficient, lift-driven performance.
However, a critical transition occurs at high TSRs, the shed vortices become more intense and persistent. Crucially, the faster blade motion causes the following blade to run into the wake of the preceding blade. This premature vortex-blade interaction is evident at TSR = 3.5, where the blade is seen slicing through the vortex sheet shed by the previous blade. This interaction disturbs the local inflow, abruptly changes the effective AoA, and disrupts the formation of a stable lift-producing pressure differential, thereby inducing negative torque and causing the sharp performance drop off in the Cp-TSR curve.
In contrast, at inflow angle β = 0° in the middle column of Figure 14, the vorticity field is characterized by chaos and strong, disordered interactions. At TSR = 1.5, large scale, aperiodic vortices are shed into the central channel between the two tracks. As the TSR increases, this channel becomes filled with a persistent, highly turbulent field of trapped vorticity, as seen clearly from TSR = 2.0 to 3.5. The blades on the downwind track are forced to traverse this region of shed vortices. This continuous destructive vortex-blade interaction is the root cause of the severely decreased performance. Operating in this turbulent, low momentum wake field significantly increases parasitic drag and prevents the formation of coherent lift, which is reflected in the consistently low Cp values at this angle.
The vorticity evidence thus conclusively shows that the performance sensitivity to inflow direction is fundamentally governed by the nature of the vortex interactions: ordered, periodic, and constructive at β = 90° up to the optimal TSR versus disordered, trapped, and destructive at β = 0°.
5.4. Wake Characterization and Recovery
A quantitative analysis of the wake was conducted by measuring the normalized velocity deficit (U/U0) and turbulence intensity (TI) at several downstream locations (x/R = 2, 8, 16) for key TSRs, as shown in Figure 15.
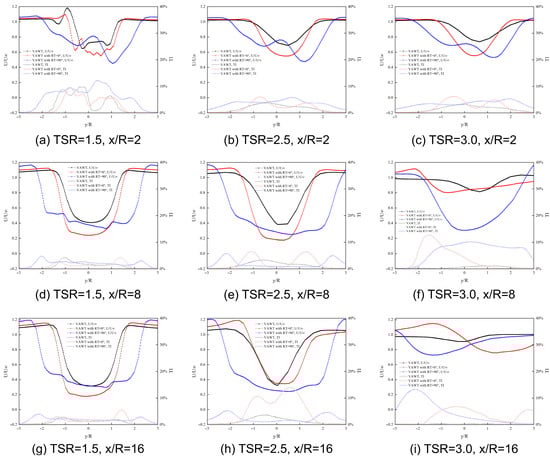
Figure 15.
Wake velocity and turbulent intensity at mid-section of VAWT and VAWT with RT for TSR = 1.5, 2.5 and 3.0.
Under all operating conditions, the VAWT with RT experienced the largest initial velocity loss at inflow angle = 90°, reaffirming its highest energy extraction capability. However, its wake also recovered relatively quickly, recovers to 90% of the freestream velocity at TSR = 3, x/R = 16. In comparison, baseline VAWTs exhibited intermediate wake losses. The turbine’s wake was narrowest, exhibiting the smallest loss, and exhibited the fastest recovery at inflow angle = 0°. This suggests that by adjusting the turbine’s orientation, it is possible to optimize wind farm layouts for maximizing single turbine power or array density.
At inflow angle = 0°, the VAWT with RT exhibited the highest turbulence intensity in its near-field wake, driven by intense vortex shedding. However, in the farfield region, the turbulence intensity rapidly decayed. Although the x/R = 2 turbulence intensity for the inflow angle = 90° is 10%, it decays rapidly downstream, falling below 5% by x/R = 16 at TSR = 1.5. This characteristic is crucial for protecting the structural safety of downstream wind turbines and reducing fatigue loads.
Comprehensive analysis shows that the VAWT with RT not only has higher single-machine power generation efficiency in a specific direction, but its wake characteristics also show adjustable potential, providing new ideas for the design of the next generation of wind farms.
6. Discussions and Future Work
To provide critical context for the findings, the study’s limitations and future research are discussed separately.
6.1. Discussion of Limitations
- (1)
- The primary parametric study relies on 2D URANS simulations. While this captures fundamental mechanisms, it omits 3D aerodynamic effects such as tip vortex formation and spanwise flow. Based on our validation, these effects could reduce the Cp by 14–16%. The reported Cp values should therefore be interpreted as 2D values.
- (2)
- The adapted DMST model, while computationally efficient, retains steady assumptions from momentum theory. It ignores complex unsteady effects and blade wake vortices, which explains its 8–15% error relative to CFD method.
- (3)
- The simulations assume uniform, steady inflow, neglecting the significant impact of real-world atmospheric turbulence (TI = 10–20%) and wind shear. These factors would reduce annual energy production and could alter the turbine’s directional sensitivity.
- (4)
- This study focuses on aerodynamics and neglects practical and structural realities. It does not account for structural deformation, mechanical power losses from the racetrack system, or the associated capital and maintenance costs. A thorough technology economic analysis is required to determine whether the 16.7% aerodynamic gain justifies the added complexity.
6.2. Future Work
Based on the limitations identified, future research should prioritize the following areas:
- (1)
- Conduct a detailed blade aerodynamic analysis by quantifying the lift, drag, and AoA variations over the full azimuthal angle. This will provide a deeper physical explanation for the reported performance gains.
- (2)
- Perform full 3D simulations and add pressure plots to quantify 3D losses and the impact of turbulence accurately.
- (3)
- Use the validated models to conduct a comprehensive parametric optimization study, varying key design factors such as the length to radius ratio, rotor solidity, and aerofoil selection to further enhance performance.
- (4)
- Complete a full technology economic analysis to assess the design’s commercial viability against its increased capital and maintenance costs.
7. Conclusions
To enhance the aerodynamic performance of VAWTs and expand their applicability in marine and complex wind environments, this study investigates a VAWT with RT. The aim is to provide a theoretical basis and technical support for high efficiency, directionally adaptive wind energy converters. This study addresses two critical gaps, the rotor’s directional sensitivity has not been systematically quantified, and there is no computationally efficient theoretical model to guide design. The main conclusions are as follows:
- (1)
- The VAWT with RT performs better than the baseline VAWT under specific inflow orientations, achieving a maximum power coefficient of 0.49 at inflow angle β = 90° and TSR = 2.5, which represents a 16.7% improvement over the VAWT.
- (2)
- The aerodynamic performance of the VAWT with RT is confirmed to be strongly dependent on inflow angle, with peak efficiency occurring at β = 90°. At low inflow angles, blade-blade interaction and wake interference lead to performance degradation, highlighting a critical performance trade-off that was not previously quantified.
- (3)
- Flow field analysis confirms that the VAWT with RT generates more organized vortical structures and a narrower, faster-recovering wake under optimal alignment compared to the VAWT. This contributes to higher efficiency and lower torque fluctuations, supporting stable power output.
- (4)
- The adapted DMST model developed for the VAWT with RT shows satisfactory agreement with CFD data, with errors below 19% at the peak TSR. This validates the model’s utility for rapid performance estimation and initial design optimization.
- (5)
- Wake characterization reveals that the VAWT with RT at β = 90° has a similar velocity recovery length and lower far-wake turbulence intensity than the VAWT, suggesting potential benefits for wind farm layout spacing and downstream turbine performance.
Author Contributions
S.G.: Conceptualization, methodology, software, validation, writing—original draft preparation. Y.Y.: Writing—review and editing, supervision, project administration, funding acquisition. Z.L.: Methodology, validation, investigation. J.X.: Validation, resources, data curation, visualization. Z.S.: Formal analysis, writing—review and editing. J.C.: Writing—review and editing, supervision, project administration, funding acquisition. All authors have read and agreed to the published version of the manuscript.
Funding
This research received no external funding.
Data Availability Statement
The data presented in this study are contained within the article.
Acknowledgments
The authors have reviewed and edited the output and take full responsibility for the content of this publication.
Conflicts of Interest
The authors declare that they have no known competing financial interests or personal relationships that could have appeared to influence the work reported in this paper.
Abbreviations
The following abbreviations are used in this manuscript:
| AoA | Angle of Attack |
| Cd | Drag Coefficient |
| Cl | Lift Coefficient |
| Cm | Moment Coefficient |
| Cp | Power Coefficient |
| CFD | Computational Fluid Dynamics |
| DMST | Double Multiple Streamtube |
| HAWT | Horizontal Axis Wind Turbines |
| LES | Large Eddy Simulation |
| RT | Racetrack Trajectory |
| TSR | Tip Speed Ratio |
| URANS | Unsteady Reynolds-Averaged Navier–Stokes |
| VAWT | Vertical Axis Wind Turbines |
References
- Global Wind Energy Council. Global Wind Report 2025; GWEC: Lisbon, Portugal, 2025; Available online: https://www.gwec.net/reports/globalwindreport (accessed on 1 May 2025).
- Ahmed, N.A.; Cameron, M. The Challenges and Possible Solutions of Horizontal Axis Wind Turbines as a Clean Energy Solution for the Future. Renew. Sustain. Energy Rev. 2014, 38, 439–460. [Google Scholar] [CrossRef]
- Elkodama, A.; Ismaiel, A.; Abdellatif, A.; Shaaban, S.; Yoshida, S.; Rushdi, M.A. Control Methods for Horizontal Axis Wind Turbines (HAWT): State-of-the-Art Review. Energies 2023, 16, 6394. [Google Scholar] [CrossRef]
- Redchyts, D.; Portal-Porras, K.; Tarasov, S.; Moiseienko, S.; Tuchyna, U.; Starun, N.; Fernandez-Gamiz, U. Aerodynamic Performance of Vertical-Axis Wind Turbines. J. Mar. Sci. Eng. 2023, 11, 1367. [Google Scholar] [CrossRef]
- Hansen, C.; Hansen, K. Recent Advances in Wind Turbine Noise Research. Acoustics 2020, 2, 171–206. [Google Scholar] [CrossRef]
- Tjiu, W.; Marnoto, T.; Mat, S.; Ruslan, M.H.; Sopian, K. Darrieus Vertical Axis Wind Turbine for Power Generation II: Challenges in HAWT and the Opportunity of Multi-Megawatt Darrieus VAWT Development. Renew. Energy 2015, 75, 560–571. [Google Scholar] [CrossRef]
- Tescione, G.; Ragni, D.; He, C.; Simão Ferreira, C.J.; Van Bussel, G.J.W. Near Wake Flow Analysis of a Vertical Axis Wind Turbine by Stereoscopic Particle Image Velocimetry. Renew. Energy 2014, 70, 47–61. [Google Scholar] [CrossRef]
- Li, Q.; Maeda, T.; Kamada, Y.; Hiromori, Y.; Nakai, A.; Kasuya, T. Study on Stall Behavior of a Straight-Bladed Vertical Axis Wind Turbine with Numerical and Experimental Investigations. J. Wind Eng. Ind. Aerodyn. 2017, 164, 1–12. [Google Scholar] [CrossRef]
- Yue, Q. Aerodynamic Noise Prediction and Reduction of H-Darrieus Vertical Axis Wind Turbine. Aust. J. Mech. Eng. 2023, 21, 1093–1102. [Google Scholar] [CrossRef]
- Keisar, D.; Arava, I.; Greenblatt, D. Dynamic-Stall-Driven Vertical Axis Wind Turbine: An Experimental Parametric Study. Appl. Energy 2024, 365, 123199. [Google Scholar] [CrossRef]
- Tian, W.; Song, B.; VanZwieten, J.; Pyakurel, P. Computational Fluid Dynamics Prediction of a Modified Savonius Wind Turbine with Novel Blade Shapes. Energies 2015, 8, 7915–7929. [Google Scholar] [CrossRef]
- Lee, J.-H.; Lee, Y.-T.; Lim, H.-C. Effect of Twist Angle on the Performance of Savonius Wind Turbine. Renew. Energy 2016, 89, 231–244. [Google Scholar] [CrossRef]
- Ghafoorian, F.; Mirmotahari, S.R.; Eydizadeh, M.; Mehrpooya, M. A Systematic Investigation on the Hybrid Darrieus-Savonius Vertical Axis Wind Turbine Aerodynamic Performance and Self-Starting Capability Improvement by Installing a Curtain. Next Energy 2025, 6, 100203. [Google Scholar] [CrossRef]
- Lin, J.C. Review of Research on Low-Profile Vortex Generators to Control Boundary-Layer Separation. Prog. Aerosp. Sci. 2002, 38, 389–420. [Google Scholar] [CrossRef]
- Wang, J.; Feng, L. Flow Control Techniques and Applications, 1st ed.; Cambridge University Press: Cambridge, UK, 2018; ISBN 978-1-316-67644-8. [Google Scholar]
- Yan, Y.; Avital, E.; Williams, J.; Cui, J. CFD Analysis for the Performance of Micro-Vortex Generator on Aerofoil and Vertical Axis Turbine. J. Renew. Sustain. Energy 2019, 11, 043302. [Google Scholar] [CrossRef]
- Yan, Y.; Avital, E.; Williams, J.; Cui, J. Aerodynamic Performance Improvements of a Vertical Axis Wind Turbine by Leading-Edge Protuberance. J. Wind Eng. Ind. Aerodyn. 2021, 211, 104535. [Google Scholar] [CrossRef]
- Maleki, G.; Davari, A.R.; Soltani, M.R. Experimental Investigation of the Effect of Active Flow Control on the Wake of a Wind Turbine Blade. Proc. Inst. Mech. Eng. Part C J. Mech. Eng. Sci. 2021, 235, 6122–6138. [Google Scholar] [CrossRef]
- Daraee, M.A.; Abbasi, S. A Novel Approach to Performance Improvement of a VAWT Using Plasma Actuators. J. Clean. Prod. 2023, 424, 138876. [Google Scholar] [CrossRef]
- Chu, Y.-J.; Lam, H.-F. Comparative Study of the Performances of a Bio-Inspired Flexible-Bladed Wind Turbine and a Rigid-Bladed Wind Turbine in Centimeter-Scale. Energy 2020, 213, 118835. [Google Scholar] [CrossRef]
- Gupta, A.; Abderrahmane, H.A.; Janajreh, I. Flow Analysis and Sensitivity Study of Vertical-Axis Wind Turbine under Variable Pitching. Appl. Energy 2024, 358, 122648. [Google Scholar] [CrossRef]
- Paraschivoiu, I. Wind Turbine Design: With Emphasis on Darrieus Concept; Reprinted; Presses Internationales Polytechnique: Montreal, QC, Canada, 2009; ISBN 978-2-553-00931-0. [Google Scholar]
- Naseem, A.; Uddin, E.; Ali, Z.; Aslam, J.; Shah, S.R.; Sajid, M.; Zaidi, A.A.; Javed, A.; Younis, M.Y. Effect of Vortices on Power Output of Vertical Axis Wind Turbine (VAWT). Sustain. Energy Technol. Assess. 2020, 37, 100586. [Google Scholar] [CrossRef]
- Balduzzi, F.; Bianchini, A.; Maleci, R.; Ferrara, G.; Ferrari, L. Critical Issues in the CFD Simulation of Darrieus Wind Turbines. Renew. Energy 2016, 85, 419–435. [Google Scholar] [CrossRef]
- Majidian, H.; Ahani, E.; Wang, L. Aerodynamic Study of Pyramid Stacking Configuration on Mega-Sized Container Ships Using CFD to Optimize Lateral Drag. Appl. Ocean Res. 2022, 124, 103209. [Google Scholar] [CrossRef]
- Torckler, R.; Majidiyan, H.; Enshaei, H. CFD-Based Design of Novel Drag-Reducing Appendages for Container Ships. Appl. Ocean Res. 2025, 158, 104605. [Google Scholar] [CrossRef]
- Sheidani, A.; Salavatidezfouli, S.; Stabile, G.; Rozza, G. Assessment of URANS and LES Methods in Predicting Wake Shed behind a Vertical Axis Wind Turbine. J. Wind Eng. Ind. Aerodyn. 2023, 232, 105285. [Google Scholar] [CrossRef]
- Rezaeiha, A.; Kalkman, I.; Blocken, B. CFD Simulation of a Vertical Axis Wind Turbine Operating at a Moderate Tip Speed Ratio: Guidelines for Minimum Domain Size and Azimuthal Increment. Renew. Energy 2017, 107, 373–385. [Google Scholar] [CrossRef]
- Ge, S.; Yan, Y.; Jiang, C.; Xu, J.; Cui, J. A Novel VAWT Design for Urban Wind Utilization. In Proceedings of the THMT-25 Turbulence, Heat and Mass Transfer 11, Tokyo, Japan, 21–25 July 2025; Begellhouse: Tokyo, Japan, 2025; p. 7. [Google Scholar] [CrossRef]
- Bouzaher, M.T.; Zereg, A. Performance Enhancement of Flapping Turbine in Reversed D Mode: Effect of No-Circular Trajectory. Arab. J. Sci. Eng. 2024, 49, 15509–15519. [Google Scholar] [CrossRef]
- Lumley, R. Apparatus for Extracting Power from Fluid Flow. U.S. Patent US12253062B2, 18 March 2025. [Google Scholar]
- Lumley, R. Tower Array. U.S. Patent US20230086811A1, 23 March 2023. [Google Scholar]
- Lee, C.H.; Min, S.Y.; Park, C.J.; Kim, S.J. Optimal Design and Verification Tests of Cycloidal Vertical Axis Wind Turbine. J. Renew. Sustain. Energy 2015, 7, 063116. [Google Scholar] [CrossRef]
- Amiri, M.; Mikielewicz, J.; Ziółkowski, P.; Mikielewicz, D. Optimizing CO2 Purification in a Negative CO2 Emission Power Plant. Chem. Eng. Technol. 2024, 47, e202300568. [Google Scholar] [CrossRef]
- Wang, T.; Zhong, W.; Qian, Y.; Zhu, C. Wind Turbine Aerodynamic Performance Calculation; Springer Nature: Singapore, 2023; ISBN 978-981-99-3508-6. [Google Scholar]
- Le Fouest, S.; Mulleners, K. Optimal Blade Pitch Control for Enhanced Vertical-Axis Wind Turbine Performance. Nat. Commun. 2024, 15, 2770. [Google Scholar] [CrossRef]
- Raciti Castelli, M.; Ardizzon, G.; Battisti, L.; Benini, E.; Pavesi, G. Modeling Strategy and Numerical Validation for a Darrieus Vertical Axis Micro-Wind Turbine. In Modeling Strategy and Numerical Validation for a Darrieus Vertical Axis Micro-Wind Turbine, Proceedings of the ASME 2010 International Mechanical Engineering Congress and Exposition, Vancouver, BC, Canada, 12–18 November 2010; Volume 7: Fluid Flow, Heat Transfer and Thermal Systems, Parts A and B; ASMEDC: Vancouver, BC, Canada, 2010; pp. 409–418. [Google Scholar] [CrossRef]
- McLaren, K.W. A Numerical and Experimental Study of Unsteady Loading of High-Solidity Vertical Axis Wind Turbines. Ph.D. Thesis, McMaster University, Hamilton, ON, Canada, 2011. Available online: http://hdl.handle.net/11375/11096 (accessed on 30 September 2025).
- Wang, Y.; Shen, S.; Li, G.; Huang, D.; Zheng, Z. Investigation on Aerodynamic Performance of Vertical Axis Wind Turbine with Different Series Airfoil Shapes. Renew. Energy 2018, 126, 801–818. [Google Scholar] [CrossRef]
- Sun, X.; Wang, Y.; An, Q.; Cao, Y.; Wu, G.; Huang, D. Aerodynamic Performance and Characteristic of Vortex Structures for Darrieus Wind Turbine. I. Numerical Method and Aerodynamic Performance. J. Renew. Sustain. Energy 2014, 6, 043134. [Google Scholar] [CrossRef]
- Raciti Castelli, M.; Englaro, A.; Benini, E. The Darrieus Wind Turbine: Proposal for a New Performance Prediction Model Based on CFD. Energy 2011, 36, 4919–4934. [Google Scholar] [CrossRef]
Disclaimer/Publisher’s Note: The statements, opinions and data contained in all publications are solely those of the individual author(s) and contributor(s) and not of MDPI and/or the editor(s). MDPI and/or the editor(s) disclaim responsibility for any injury to people or property resulting from any ideas, methods, instructions or products referred to in the content. |
© 2025 by the authors. Licensee MDPI, Basel, Switzerland. This article is an open access article distributed under the terms and conditions of the Creative Commons Attribution (CC BY) license (https://creativecommons.org/licenses/by/4.0/).