Article

Comparative Analysis of Design Standards for Floating Offshore Wind Turbine Mooring Systems: A Focus on Line Tension Safety Factors

1
First Marine Solutions, First Integrated House, Broadfold Road, Bridge of Don, Aberdeen AB23 8EE, UK
2
Department of Mechanical, Materials and Manufacturing Engineering, University of Nottingham, Nottingham NG7 2RD, UK
3
AAU Energy, Aalborg University, Niels Bohrs Vej 8, 6700 Esbjerg, Denmark
4
Department of Wind & Energy Systems, DTU, Risø Campus Frederiksborgvej 399, Building 101, 4000 Roskilde, Denmark
*
Authors to whom correspondence should be addressed.
J. Mar. Sci. Eng. 2025, 13(11), 2170; https://doi.org/10.3390/jmse13112170
Submission received: 25 October 2025 / Revised: 11 November 2025 / Accepted: 12 November 2025 / Published: 17 November 2025

Abstract

The present study aims to conduct a comprehensive comparative analysis of international standards (DNV, ABS, BV, etc.) that regulate the design of mooring systems for floating offshore wind turbines. The comparative analysis focuses on the safety factors applied to the line tension of mooring systems. Firstly, an extensive literature review of the most-used floating platforms in the offshore wind industry and their corresponding mooring configurations is presented. Afterwards, a case study is presented using the VolturnUS floating substructure as a reference for analyzing the coupled dynamic response of mooring analysis through OrcaFlex 11.4, where the numerical model used for the coupled dynamic response of moorings is validated by benchmarking against the OC3 Hywind platform model. Within the scope of the comparative analysis, all-chain and semi-taut hybrid systems under various operational and survival load conditions are considered. The results demonstrate the similarities and discrepancies in line tension utilization among the standards, highlighting the comparative conservatism in different environmental conditions. Furthermore, the study underscores the need for tailored safety factors in mooring designs, given the variability in assessment methods across design guidelines, thereby making the design more flexible and encouraging innovative mooring system solutions.

1. Introduction

In recent decades, the energy demand of consumers has continuously increased; for instance, the total global primary energy consumption was 361 TWh in 1990, 572 TWh in 2000, 1174 TWh in 2010, and 2414 TWh in 2022 [1]. Simultaneously, renewable energy technologies have been adopted quite rapidly in the energy sector in order to reduce environmental impacts caused by the traditional oil and gas industry (i.e., climate change and air pollution) and meet the demand for clean and sustainable energy [2].
In this regard, the European Union (EU) has expressed its ambition of achieving 42.5% to 45.0% renewable energy in its new binding target by 2030; the United Kingdom has committed to 60% renewables by 2030 and China has established a target of 28% non-fossil energy by 2030 [3]. Many other nations, such as the USA and India, have also set their green energy targets [4,5]. There are many forms of renewable energy, including solar, wind, geothermal, hydropower, bioenergy, and ocean energy. Offshore wind energy, in particular, plays an essential role in the production of renewable energy; for instance, global offshore wind energy devices produced 5.3 GW in 2012, 14.3 GW in 2016, 28.3 GW in 2019, and 63.2 GW in 2022 [6].
Along with the rapid growth of offshore wind turbine (OWT) installations, there is a significant interest in the floating offshore wind turbine (FOWT) as a sustainable energy solution designed to harvest more stable and powerful wind energy at deeper waters and further from shore [7]. The mooring systems of FOWTs ensure the stability and safety of FOWTs, especially in challenging marine environments; thus, the robust and reliable design of mooring systems is of the utmost importance [8,9]. However, one of the key issues is the lack of standardized criteria for mooring system design, particularly concerning line tension safety factors. This discrepancy poses significant challenges, as different international guidelines, including those from DNV (Det Norske Veritas), ABS (American Bureau of Shipping), and BV (Bureau Veritas), offer varying prescriptions for these safety factors. Such variations can lead to inconsistencies in design practices and the operational reliability of FOWTs.
Furthermore, the diverse environmental conditions and the unique dynamics of floating platforms further complicate the design of a one-size-fits-all mooring system. Therefore, a comprehensive comparative analysis involving various environmental conditions and mooring configurations is of timely relevance and relevant as it bridges the gaps in standardization. Moreover, the present study’s motivation goes beyond an academic pursuit, as there is a practical necessity to advance the field of offshore wind energy. Various regulatory bodies have simultaneously developed codes and standards to regulate the mooring system design.
In light of the motivation discussed above, the present work aims to contribute to the field of FOWT mooring systems by providing a comprehensive comparative analysis of line-tension safety factors across various international standards through an extensive literature review, methodical dynamic mooring analysis, and case studies, particularly for the VolturnUS platform. The study aims to highlight the variations and similarities in safety factor prescriptions of the international standards. By doing so, it not only bridges the gap in understanding different mooring guidelines but also offers valuable insights for optimizing mooring system design and enhancing safety in OWT deployments.
The present study is structured into distinct sections, beginning with an extensive literature review of floating platforms of OWT and corresponding mooring configurations. This is followed by a detailed methodology section that delineates the performance of mooring systems based on coupled dynamic response analysis. Afterwards, a comprehensive case study of the VolturnUS platform and a meticulous analysis incorporating both validation and additional case studies are presented. The following section offers a thorough discussion of the findings, drawing critical insights and implications. Finally, a summary of the key outcomes and their relevance to the field concludes the study.

2. Literature Review

There are three common types of floating platforms used to support offshore wind turbines: Spar, Semisubmersible, and Tensioned Leg Platform (TLP) [10,11]. Spar tends to have a very deep draft, with ballast water ensuring a lower center of gravity than the center of buoyancy, leading to great stability, whilst the downside is that the ultra-deep draft means they can only be deployed in sufficiently deep water. Semisubmersibles are widely used in both renewables and the oil and gas (O&G) industry; the towage and installation process has been well established and optimized [12]. Semisubmersibles can be deployed across a wide range of water depths. They are particularly more suitable than spars or TLPs when the wind farm is close to shore and the water depth is shallow [13].
TLP has multiple vertical tendons (tethers) connected to the anchors on the seabed, which means that the footprint of the installation is minimized compared to spars or semisubmersibles that need larger mooring ranges [14]. TLPs can also offer excellent heave motion control due to their tendons. However, the installation, maintenance, repair, and decommission process can be more cumbersome than for the other two types of FOWT platforms [15]. Among these floater types, semi-submersibles are often used in both the O&G and renewable energy sectors due to their flexibility during installation and cost-effectiveness.
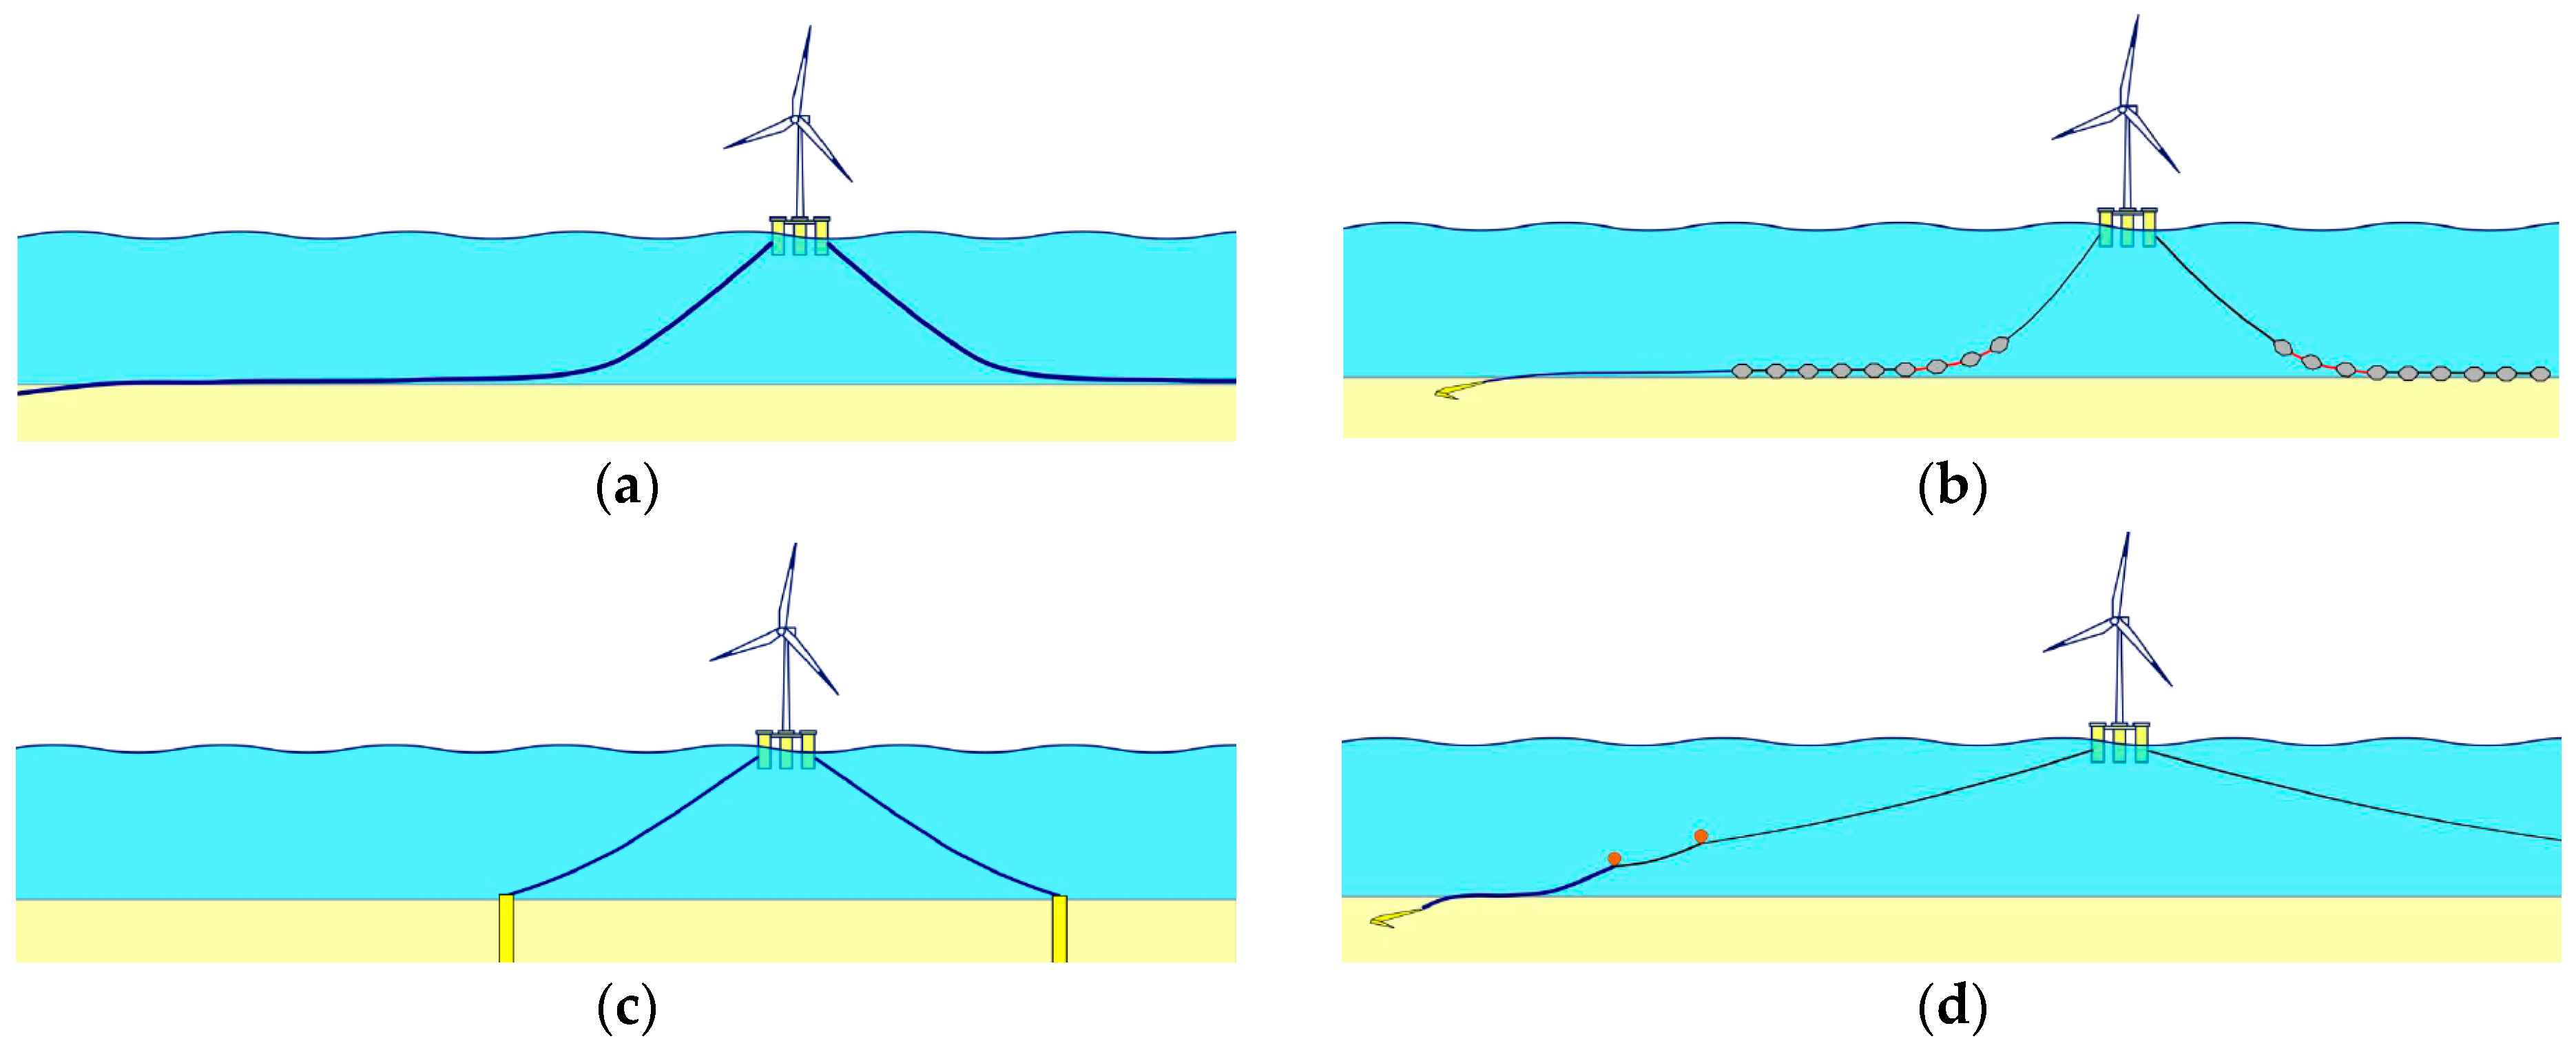
A series of the most typical mooring configurations for FOWT semi-submersibles is shown in Figure 1, and they can be summarized as follows:
  • A conventional catenary mooring spread has all mooring lines made of a single component on each line; for instance, an all-chain system. It is easy and quick to install, with a relatively large footprint. It typically utilizes a drag embedment anchor at the end of the mooring line. The mooring restoring force (mooring stiffness) is ensured by the weight of the suspended chain [16].
  • The multi-catenary spread is a modified solution to the conventional catenary, with clump weights attached at certain sections on the mooring line. Due to the increased line weight, the mooring system stiffness is improved, leading to an enhanced vessel offset/excursion [17].
  • Taut leg mooring is unsuitable for use with drag embedment anchors due to the undesirable vertical loading characteristics. A pile anchor or a vertical loading anchor can be deployed [18]. The anchor range is more compact than the conventional catenary mooring since it does not require a grounded chain length. It has minimal contact with the seabed, which is particularly beneficial when the subsea layout is congested.
  • Semi-taut mooring spread can be considered as a combination of a taut leg and a conventional catenary [19]. A synthetic fiber rope may be used in the middle section of the mooring line, with optional buoyancy at both ends. Such a configuration provides good vertical clearance, energy absorption (leading to an improved factor of safety), and the ability to deploy drag-embedment anchors. The downside is that due to the relatively low axial stiffness of the fiber rope, a larger offset/excursion may be expected.
In addition to the above, a hybrid taut leg mooring system can be suggested, involving segments of clump weights at the anchor side and/or sub-surface buoys near the water surface, with the aim of reducing the vessel excursion, anchor range, and potential anchor uplifts [20]. In this regard, the test presented in [20] has shown improvement in vessel offset without significantly increasing tension if a sub-surface buoy is deployed.
Figure 1. Mooring types (adapted from [21]): (a) conventional catenary, (b) multi-catenary, (c) taut leg, and (d) semi-taut.
Jmse 13 02170 g001
There are usually two approaches to conducting a dynamic response analysis of moorings: time-domain analysis [22] and frequency-domain analysis [23]. The two approaches each have their own merits; frequency-domain analysis is often used when cost-efficient and quick computation is required, while time-domain analysis offers a more accurate method due to its ability to accurately solve non-linear problems, such as load coupling, the vessel’s low-frequency motions, and large deformation of the mooring lines [24,25].
For a time-domain dynamic mooring analysis, it is critical to properly extract the most probable maximum (MPM) tensions or the extreme value (EV) tensions [26,27]. Some software packages have EV analysis features already built in, such as OrcaFlex [28,29,30]. It has three built-in methods for obtaining MPM from a line-tension time-history output: the Rayleigh distribution method, the Weibull distribution method, and the generalized Pareto distribution (GPD) method. The Rayleigh distribution shall be carefully used when extracting the line tensions, since the peak responses must follow a Gaussian process [31]. The Weibull distribution method is a general-purpose statistical model, whereas the GPD is mainly used in EV extractions. In practice, the GPD-fitted model in OrcaFlex appears to be more robust than the Weibull-fitted model, which occasionally results in convergence issues.
In the offshore industry, from a practical point of view, the guideline of the American Petroleum Institute, as API RP 2SK—Design and Analysis of Station Keeping Systems for Floating Structures [32]—summarizes three methods of determining the extreme response from a stochastic time history, as follows:
  • Probability density function (PDF) of a selected distribution model: API points out that this approach requires a considerable amount of simulation realizations, from which the extreme responses are to be extracted and fitted into a statistical distribution model, then the most probable maximum (MPM) is the maximum PDF of such a fitted model. To ensure the validity of the model, many realizations are required, which is time-consuming and not always practical [33,34].
  • Average of extreme responses: There are five to ten realizations often required for this approach. The extreme responses are then extracted from each realization, and the MPM is then taken from the average of such extreme responses. This approach is commonly used in the O&G industry, is easy to apply, and is considered acceptable by the class [35].
  • Fitted probability distribution model: In this method, a probability distribution model with peak probabilities, such as Rayleigh, Normal, Gumbel, Weibull, and Exponential, is chosen. The model parameters are then determined using available response time histories. Subsequently, the anticipated extreme response is calculated based on the adjusted model. Although this method might require fewer iterations than Method 2, in practice, the fitted parametric model often fails to accurately capture the true upper-tail behavior, leading to biased predictions of extreme responses. To enhance accuracy, some analysts employ specialized techniques, such as fitting the upper tail or averaging predictions from multiple iterations [36,37]. Such a description might appear somewhat vague, yet acceptable if the time domain analysis is conducted with one realization only, from which the MPM is to be determined using a statistical model such as Rayleigh, Weibull, and Exponential distributions. However, a single realization may lead to biased results, and therefore, multiple realizations are preferable with MPMs that are then fitted into, for example, a Gumbel distribution to eliminate the bias. Alternatively, take the average of the MPMs to improve accuracy.
There have been ongoing discussions about obtaining MPM/EV within the research community, and numerous publications have addressed this topic from various perspectives. The uncertainty in extreme mooring loads due to various statistical models has been assessed by Zhao and Dong [38], including average conditional exceedance rate, global maxima, peak-over-threshold methods with Gumbel distribution, generalized extreme value distribution, generalized Pareto distribution, and three-parameter Weibull distribution. The work concluded that the uncertainties/deviations introduced by different statistical models could be significant and recommended calibration for the line safety factors. A novel methodology was proposed in [39], attempting to give a robust distribution of extremes using the peaks over threshold (POT) method.
A detailed discussion was given in [40] to predict long-term mooring tensions with multiple statistical models, with the potential to reduce the number of realizations required in a time domain mooring analysis. The study demonstrated several common definitions of peaks in response time history and validated a two-parameter Weibull distribution for upper-tail behavior in mooring tension, which is appropriate for representing long-term structural response under extreme conditions [41]. In addition, the study also covered some approaches to conduct the estimation of the parameters for the Weibull distribution.
Furthermore, research has been undertaken to demonstrate the equations to calculate the line catenary based on the water depth and top tension. The complexity of solving the equation is increased when there are multiple components involved in the line, i.e., the combination of chain, wire, fiber rope [42,43], buoyancy module, and clump weight. A numerical mooring model was developed for an offshore floating platform [44] based on the vector form of the intrinsic finite elements method. Such a method of catenary calculation was validated against multiple validated codes and shows good accuracy.
A study on the mooring line dynamics response was conducted in [45], where research catenary equations were given for single and multi-component mooring lines/cables, with seabed slope considered. A validation was performed against the model test and OrcaFlex results, which showed agreement.
The vessel position is determined mainly by the environmental forces and the mooring system stiffness matrix. Usually, iterative simulations were undertaken to find the equilibrium vessel position and mooring stiffness with environmental forces as variables. For the mooring of an offshore floating structure, the literature is available [46,47] to give solutions to the vessel position and environmental loads.
The basic principles of conducting a time-domain mooring analysis are briefly discussed here. However, many other factors are involved in the calculation process. For instance, low-frequency and wave frequency motions, added mass and damping matrices, seabed frictions and geometries, and the riser system are not covered in this study.

3. Methodology

3.1. Standards’ Provisions for Mooring Line Design

Several class societies, such as DNV, BV, ABS, etc., have released their mooring guidelines in the offshore wind industry in recent years. It could be challenging for floating offshore wind farm stakeholders to decide which code to follow, as most FOWT platforms are unclassed, and major guidelines have recently been developed with similarities in certain aspects. Therefore, comparing the major mooring codes and standards in the FOWT industry is highly informative. However, there have been few recent benchmarking studies of mooring guidelines in the floating offshore wind turbine structure industry in the research community.
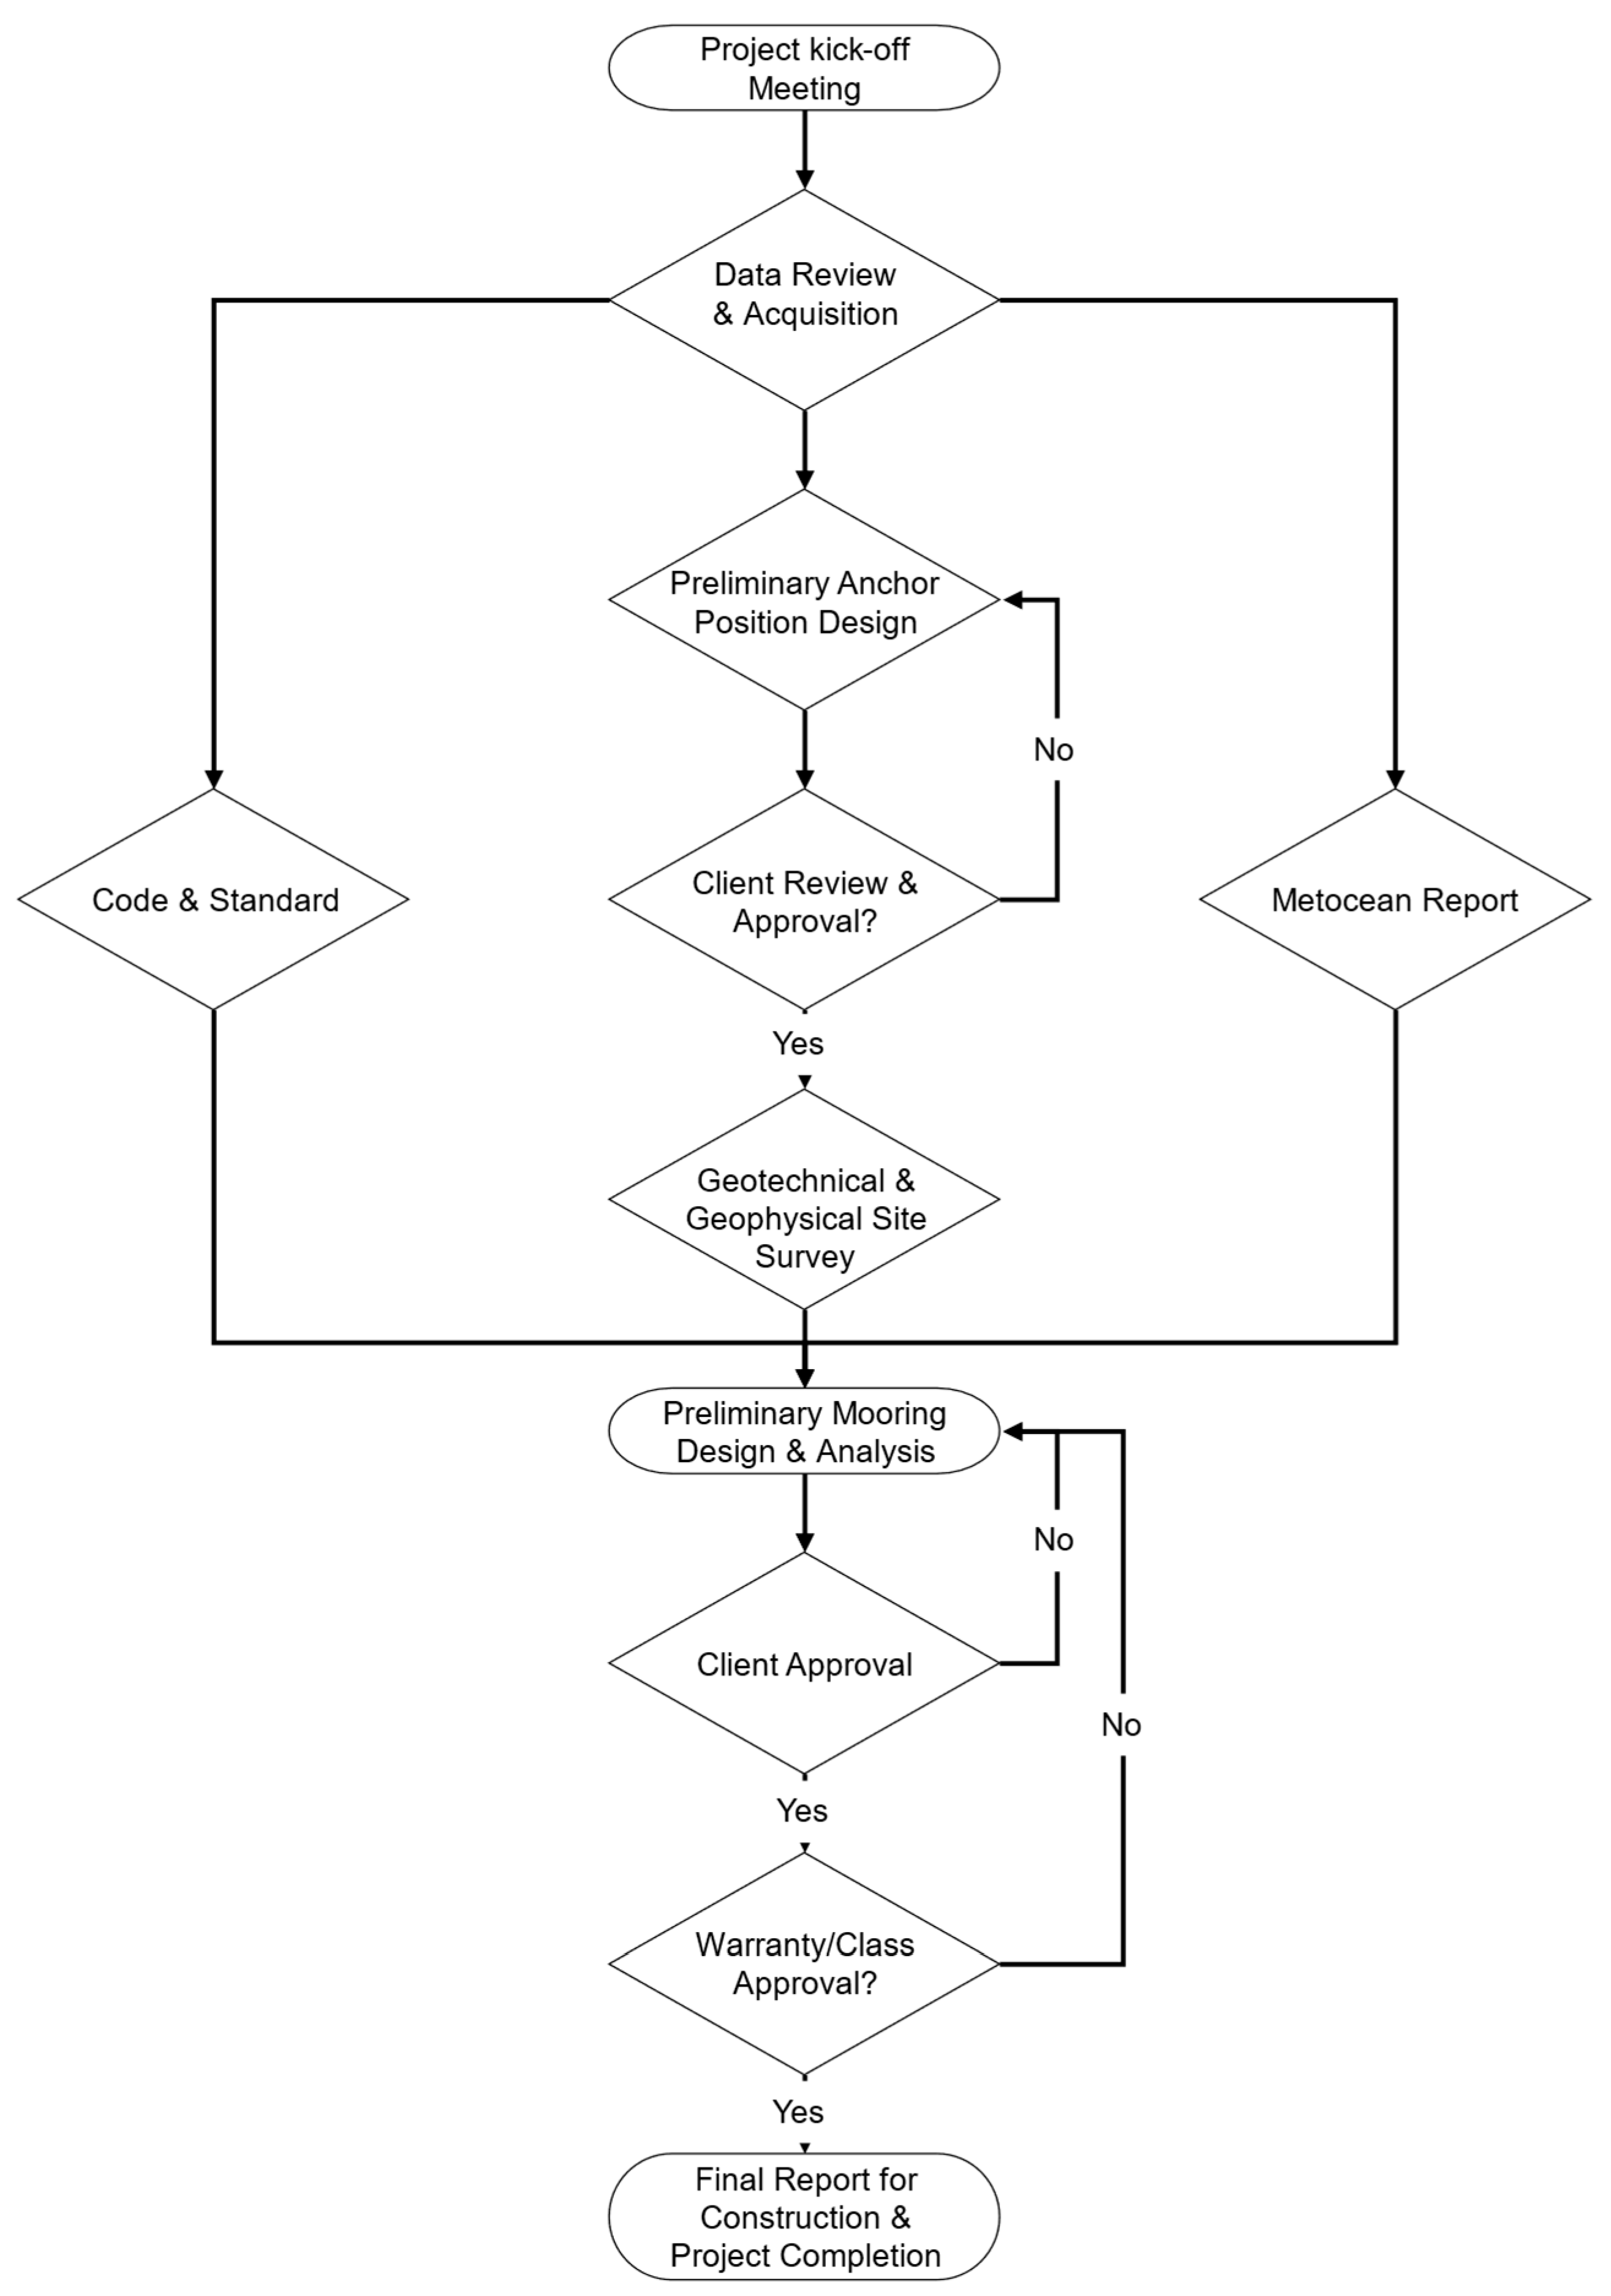
A review of mooring design for floating wave energy converters was conducted, where a brief summary of design criteria from major guidelines and standards from different classes [48], such as ISO (ISO 19901-7, ISO 14909, ISO 18692), IEC (IEC TS 62600-10), BV (NR 493, NI 572), API (API RP 2SK, API RP 2SM, API SPEC 9A), and DNV (DNV OS E301-5), was provided. The summarized codes and standards are mostly applicable to offshore wind turbines as well. For a typical mooring design, the process generally follows the flow chart, as shown in Figure 2.
General mooring design criteria are listed below, among which, the line tension criteria are usually the most critical [32,49,50]:
  • Line tension safety factors;
  • Vessel excursion due to the limitations of drilling riser, flexible riser/cable, gangway stroke, vessel to adjacent structures, etc.;
  • Vertical clearance to subsea assets in slack line scenario, horizontal clearance between touchdown point to subsea assets or cable hog-bend to vessel keel/sag-bend to seabed;
  • Mooring system design life (mooring/structural fatigue criterion).
A detailed summary of the mooring design and analysis criteria is contained in [51] as well. The objective of this study is to compare and benchmark the mooring line tension criterion among DNV, BV, and ABS guidelines.

3.2. Mooring Model Setup

This present study aims to provide insight into the common FOWT platform mooring configurations, including redundancy options (with or without redundancy), and a comparison between all-chain systems and semi-taut hybrid systems, as discussed in Section 2 of this current study. The assessment is performed for the VolturnUS platform, and the Multiphysics model is built in OrcaFlex (see Figure 3). The present study primarily focuses on the comparison of line-tension safety factors, i.e., other criteria (e.g., offsets and clearances) that are not considered in the comparative analysis.
The mooring analysis is conducted using the OrcaFlex software package. The VolturnUS offshore wind turbine platform has been widely used within the research community for case studies and is selected for this current mooring tension code comparison study [52,53,54].
The basic OrcaFlex model of VolturnUS was produced by Orcina and made publicly available on their website. In this model, a 15 MW wind turbine is installed on the VolturnUS platform, from which some adjustments were then made [55]:
  • There are four models developed from the base model: All-chain system with redundancy, all-chain system without redundancy, semi-taut hybrid system with redundancy, and semi-taut hybrid system without redundancy.
  • The mooring line length in the base model is 850 m; after a few preliminary analysis iterations with typical extreme weather in the North Sea, the mooring line length of 850 m is considered insufficient. Therefore, the line length in the analysis model is increased to 1050 m for the all-chain system.
  • The wind and current coefficients and load on the turbine are included in addition to the base model.

3.3. Load Cases

Each of the four analysis models has operational and survival conditions with down-line and between-line weather directions. In addition, for the hybrid systems, both new and old ropes have been considered due to their long-term elongation behavior. In total, 24 load cases are considered as seen in Table 1.

3.4. Mooring Line Setup

Several preliminary iterative analyses are conducted to size the mooring gear and optimize the configuration. The mooring chain and fiber are initially sized small, and the mooring analysis is conducted to determine the line safety factor, which is then found to be insufficient, and then larger sizes are introduced. The above practice is carried out for a few iterations until a potential “workable solution” is found, as per Table 2, Table 3, Table 4 and Table 5.
The pretension value is taken from “Definition of the UMaine VolturnUS-S Reference Platform Developed for the IEA Wind 15-MW Offshore Reference Wind Turbine Technical Report” [56]. The added mass and drag coefficient are kept at OrcaFlex default values.
There is a 15-ton buoyancy module fitted to the lower end of the fiber rope inserts to lift the lower end of the Dyneema rope so that it will not touch down when slackened by a storm. The line catenary and vertical seabed clearance is, however, not a part of the current study.
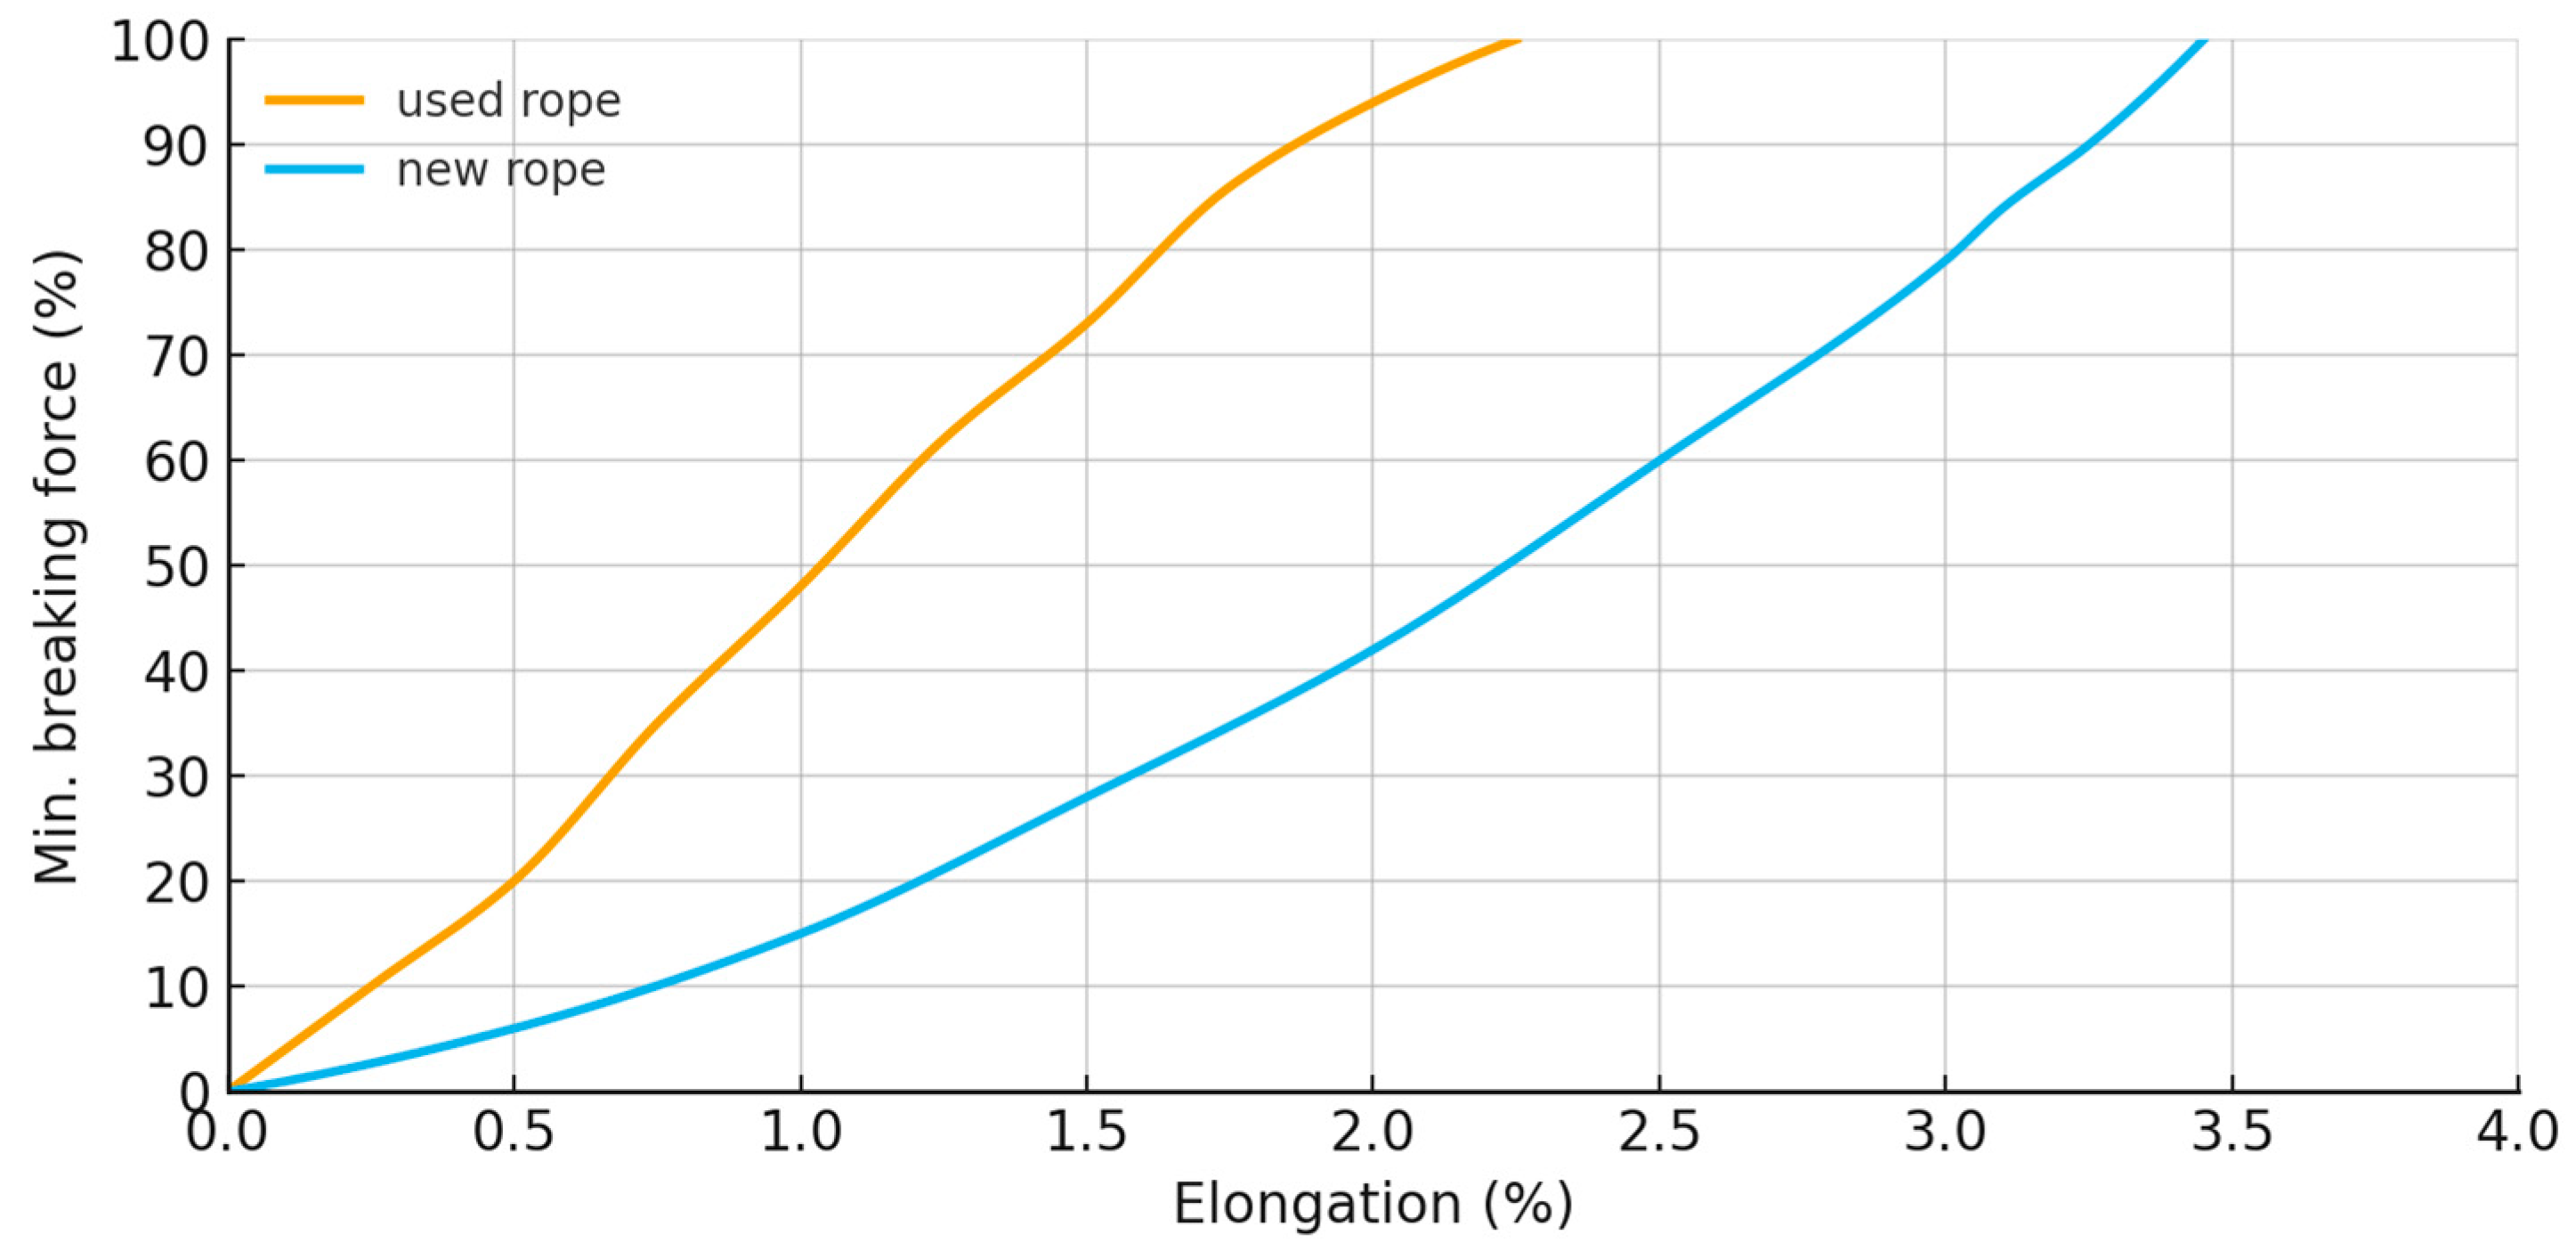
Line component axial stiffness plays an important role in mooring analysis; therefore, it is critical to apply the appropriate parameters. Normally, for chain and steel wire, the axial stiffness is considered linear within the Minimum Breaking Load (MBL). For most synthetic ropes, the axial stiffness changes over time due to creeping behavior. New rope and used rope have different load–elongation curves, as per the graph given below, based on [57]. Both new and used rope curves, as in Figure 4, are therefore included in this study.

3.5. Metocean and Site Information

The operating condition is considered the maximum production metocean criteria, whereas the survival condition is the extreme storm condition (typically a 50-year return period for FOWT platforms). The metocean data presented in Table 6 is used for the mooring analysis in this study and is extracted from First Marine Solutions Ltd.’s in-house metocean database for Gryphon Field in the North Sea.

3.6. Generalized Pareto Distribution

The final line-tension results are computed using extreme value analysis. A generalized Pareto distribution (GPD) is considered suitable for extracting extreme responses for mooring line tensions in time history, along with a peak-over-threshold (POT) approach [58,59,60,61]. The GPD can be expressed as [62]
F y = 1 1 + ξ × y σ 1 ξ 1 exp y σ , f o r   ξ 0   w h e r e 1 + ξ × y σ = m a x 1 + ξ × y σ , 0 , f o r   ξ = 0
where σ is the scale parameter, ξ is the shape parameter, and y is the peak value above the threshold. The determination of the threshold depends on the applications and typically requires sophisticated techniques and an analyst with experience. A sample size that is too high above the threshold may yield invalid and meaningless extreme value results, whereas a sample size that is too small may produce a biased extreme response. A discussion was given in [63] regarding applying the POT method for the extreme response of the mooring line, in which several empirical methods for selecting a threshold were summarized.

3.7. Other Considerations

The selection of DNV, ABS, and BV standards for this comparative analysis is driven by their widespread use and recognition in the offshore engineering industry. DNV provides a set of guidelines widely adopted for floating wind turbine structures, thanks to its comprehensive risk management and probabilistic load assessment approach. ABS standards, such as the ABS Guide for Building and Classing Floating Offshore Wind Turbines, are recognized for their prescriptive approach, offering clear criteria for different mooring configurations and environmental conditions. BV standards are known for their stringent requirements for synthetic mooring lines, which are increasingly used in modern offshore wind turbine installations due to their lightweight, high-strength properties. These standards represent a broad spectrum of design philosophies, making them ideal candidates for a comparative study aimed at understanding the variances in safety factor prescriptions and their implications for mooring system reliability.
The selection of load cases is critical to the robustness of the mooring analysis. The load cases considered in this study are chosen to reflect both operational and extreme survival conditions typical of offshore wind turbine environments. For operational conditions, moderate wind speeds of up to 27.4 m/s and wave heights of 6.64 m are selected to represent the maximum production conditions [64]. In contrast, survival conditions are based on extreme storm scenarios, with wind speeds reaching 52.8 m/s and wave heights of up to 13.5 m, which correspond to a 50-year return period event [38]. These environmental conditions are selected based on regional metocean data for the North Sea, a common location for offshore wind farms, and are intended to capture the range of forces the mooring system is expected to endure during its operational life. Alternatively the Inverse First-order Reliability Method can be employed in order to estimate the 25-, 50-, and 100-year return period events, as exemplified in [65].
The OrcaFlex model used in this study incorporates several assumptions to simplify the analysis without compromising accuracy. For instance, the mooring lines are assumed to have linear elastic properties up to their MBL, which is a common simplification in mooring system analysis [51,66]. Additionally, environmental loads are modeled as steady-state inputs, ignoring transient effects such as wave slamming or vortex-induced vibrations, which are generally considered secondary effects in the context of mooring line tension analysis [67]. These assumptions are necessary to manage the computational complexity of the model, yet are acknowledged as potential sources of error. The impact of these simplifications is mitigated using conservative safety factors and validation against empirical data.
The validation of the OrcaFlex mooring model was performed by benchmarking the simulation results against published data from the OC3 Hywind platform, a well-documented floating wind turbine model [68]. The validation process involved comparing the simulated line tensions and platform motions under identical environmental conditions, showing a close correlation with reported values [69]. This validation process provides confidence in the accuracy of the model and its applicability to the VolturnUS platform studied in this paper. Any discrepancies observed are within acceptable limits and are attributed to differences in the numerical methods used by different simulation tools.
The long-term environmental effects, such as fatigue and creep, are incorporated into the analysis using a time-domain simulation approach. Fatigue life estimation is performed based on cumulative damage models, which sum the damage from cyclic loads over the mooring system’s expected lifespan [39] deterministically. For a probabilistic fatigue life analysis, the structural reliability theory for components in series is required [70,71]. Creep in synthetic ropes, particularly in Dyneema, is modeled using time-dependent material properties that reflect the non-linear stress–strain behavior observed in laboratory tests [45]. These considerations are crucial for accurately predicting the long-term performance of mooring systems, ensuring that safety factors account not only for immediate loads but also for the degradation of material properties over time.

4. Mooring Analysis Case Study—Volturnus

4.1. Methodology Validation—OC3

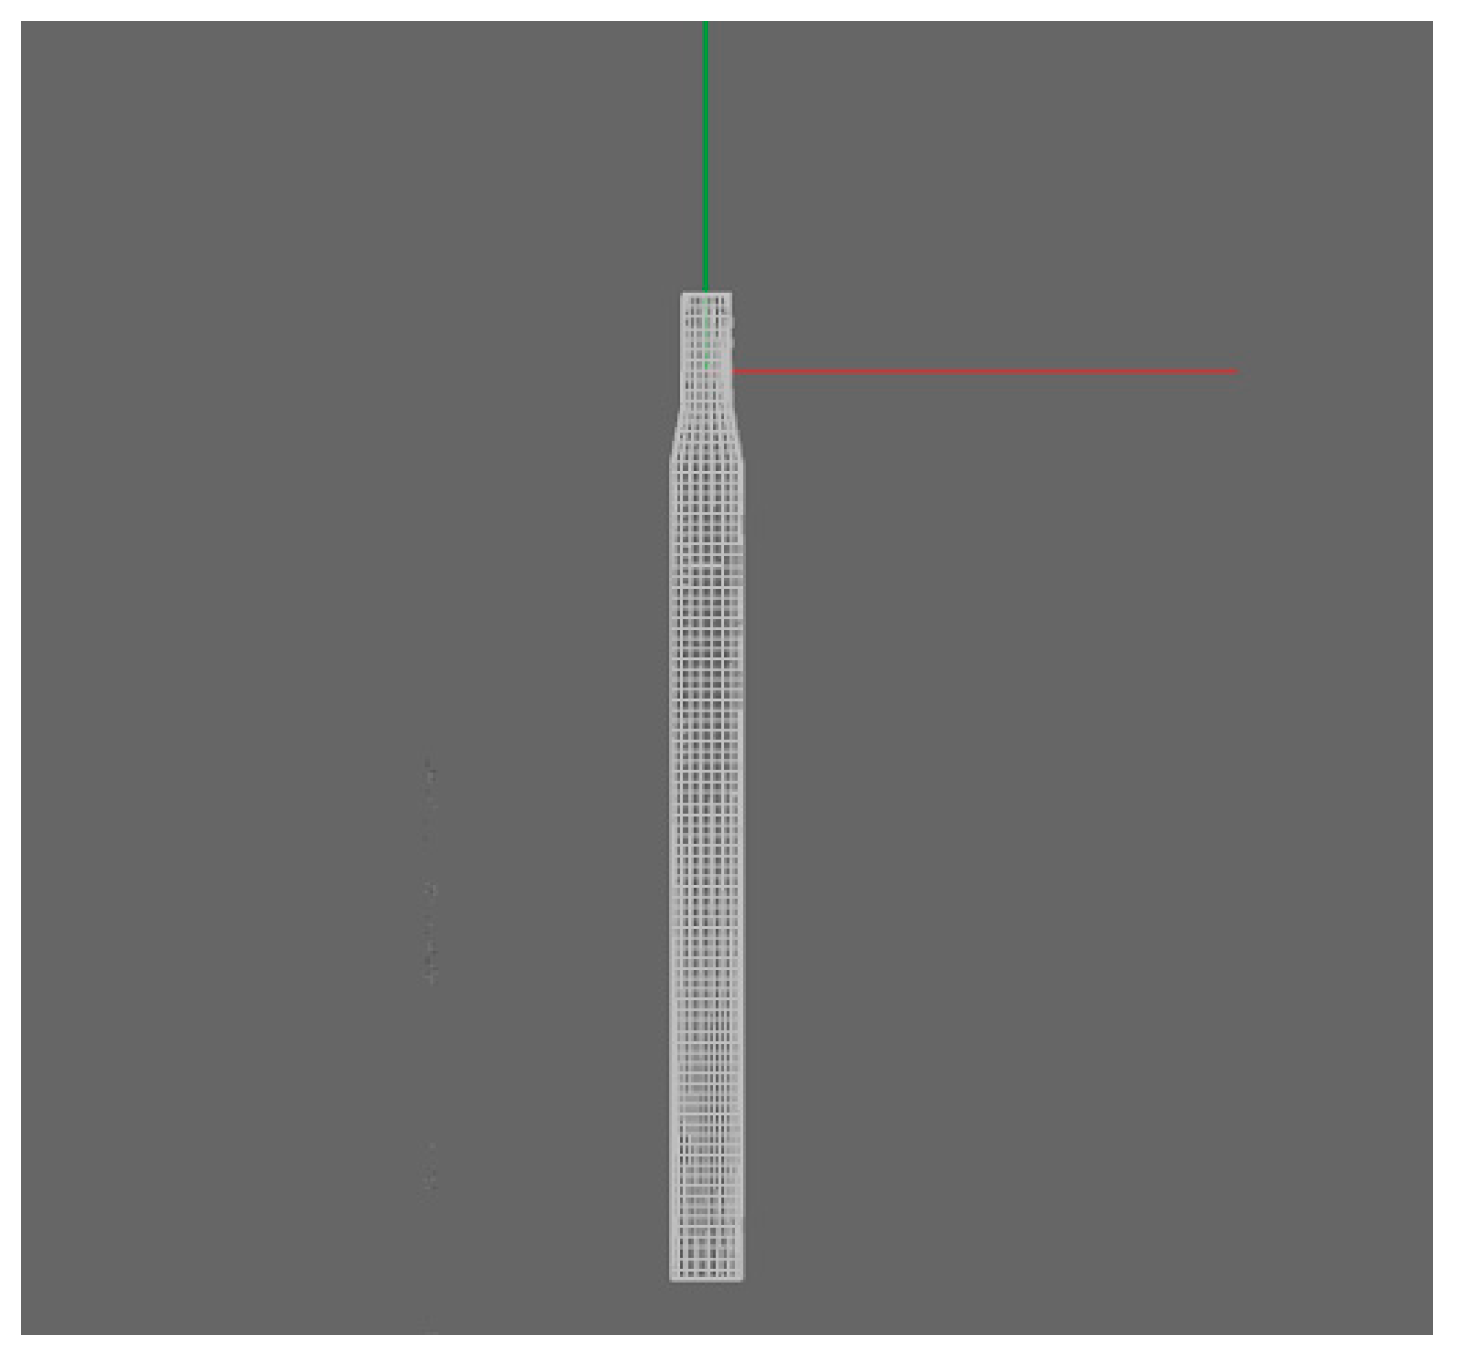
A methodology validation process is conducted using the OC3 Hywind platform model, and mesh details are illustrated in Figure 5 and Figure 6, respectively. Furthermore, the properties of the OC3 mooring system are presented in Table 7.
A hydrodynamic analysis has been performed using the above-shown parameters with linear damping, as presented in Table 8, and restoring the force matrix in Table 9 as follows [68].
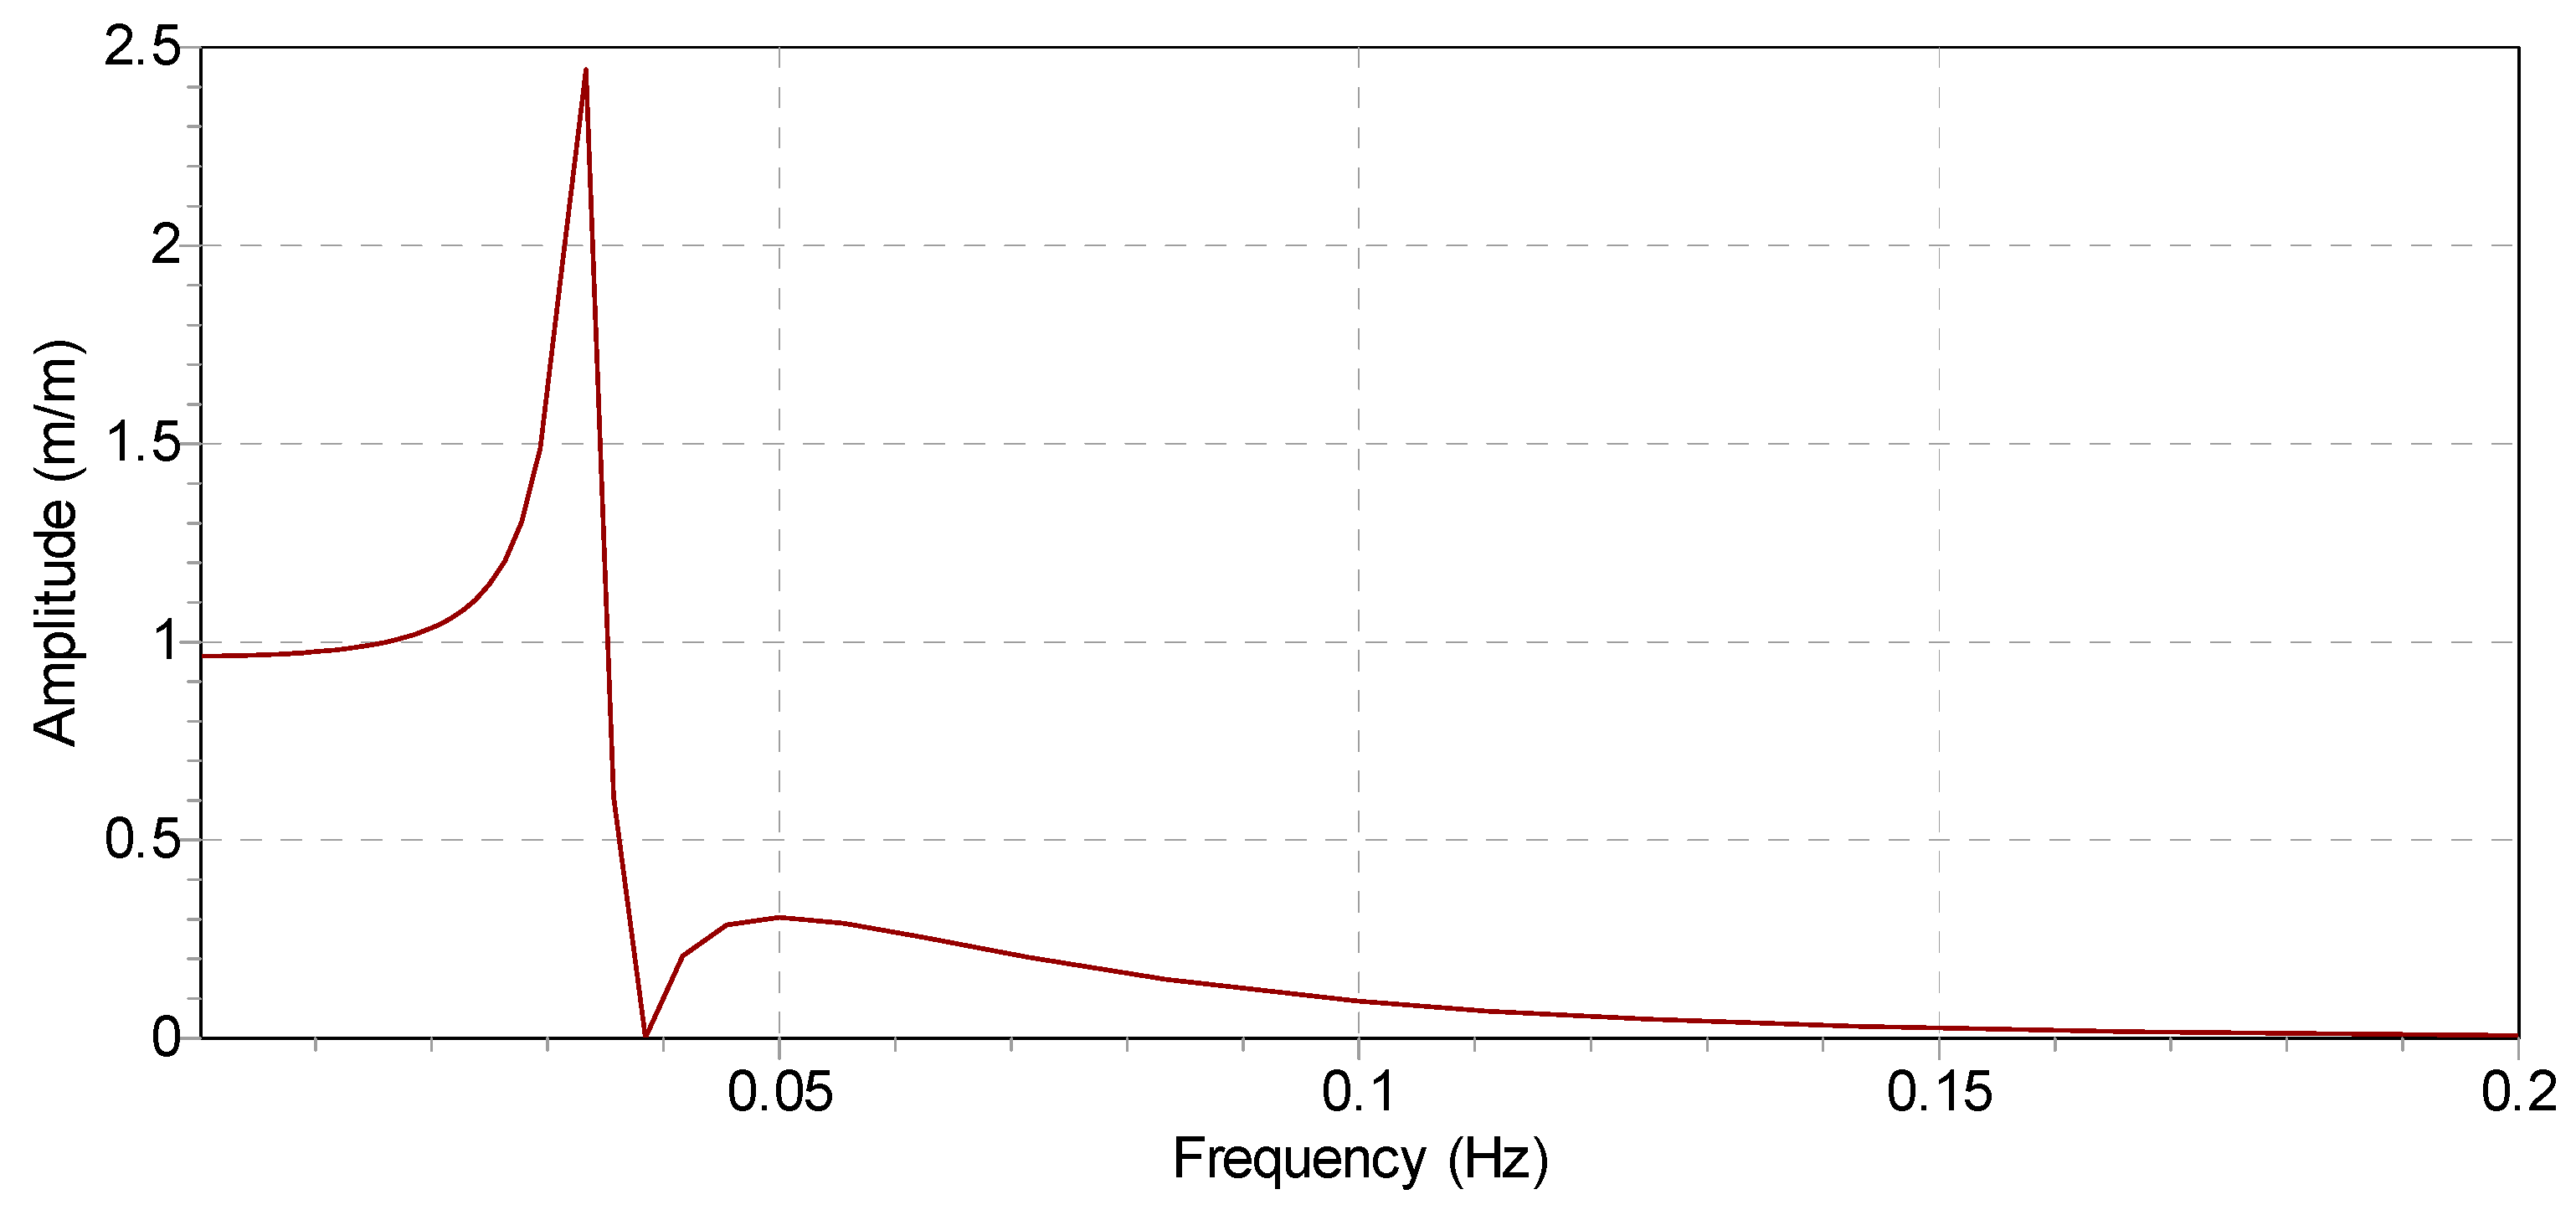
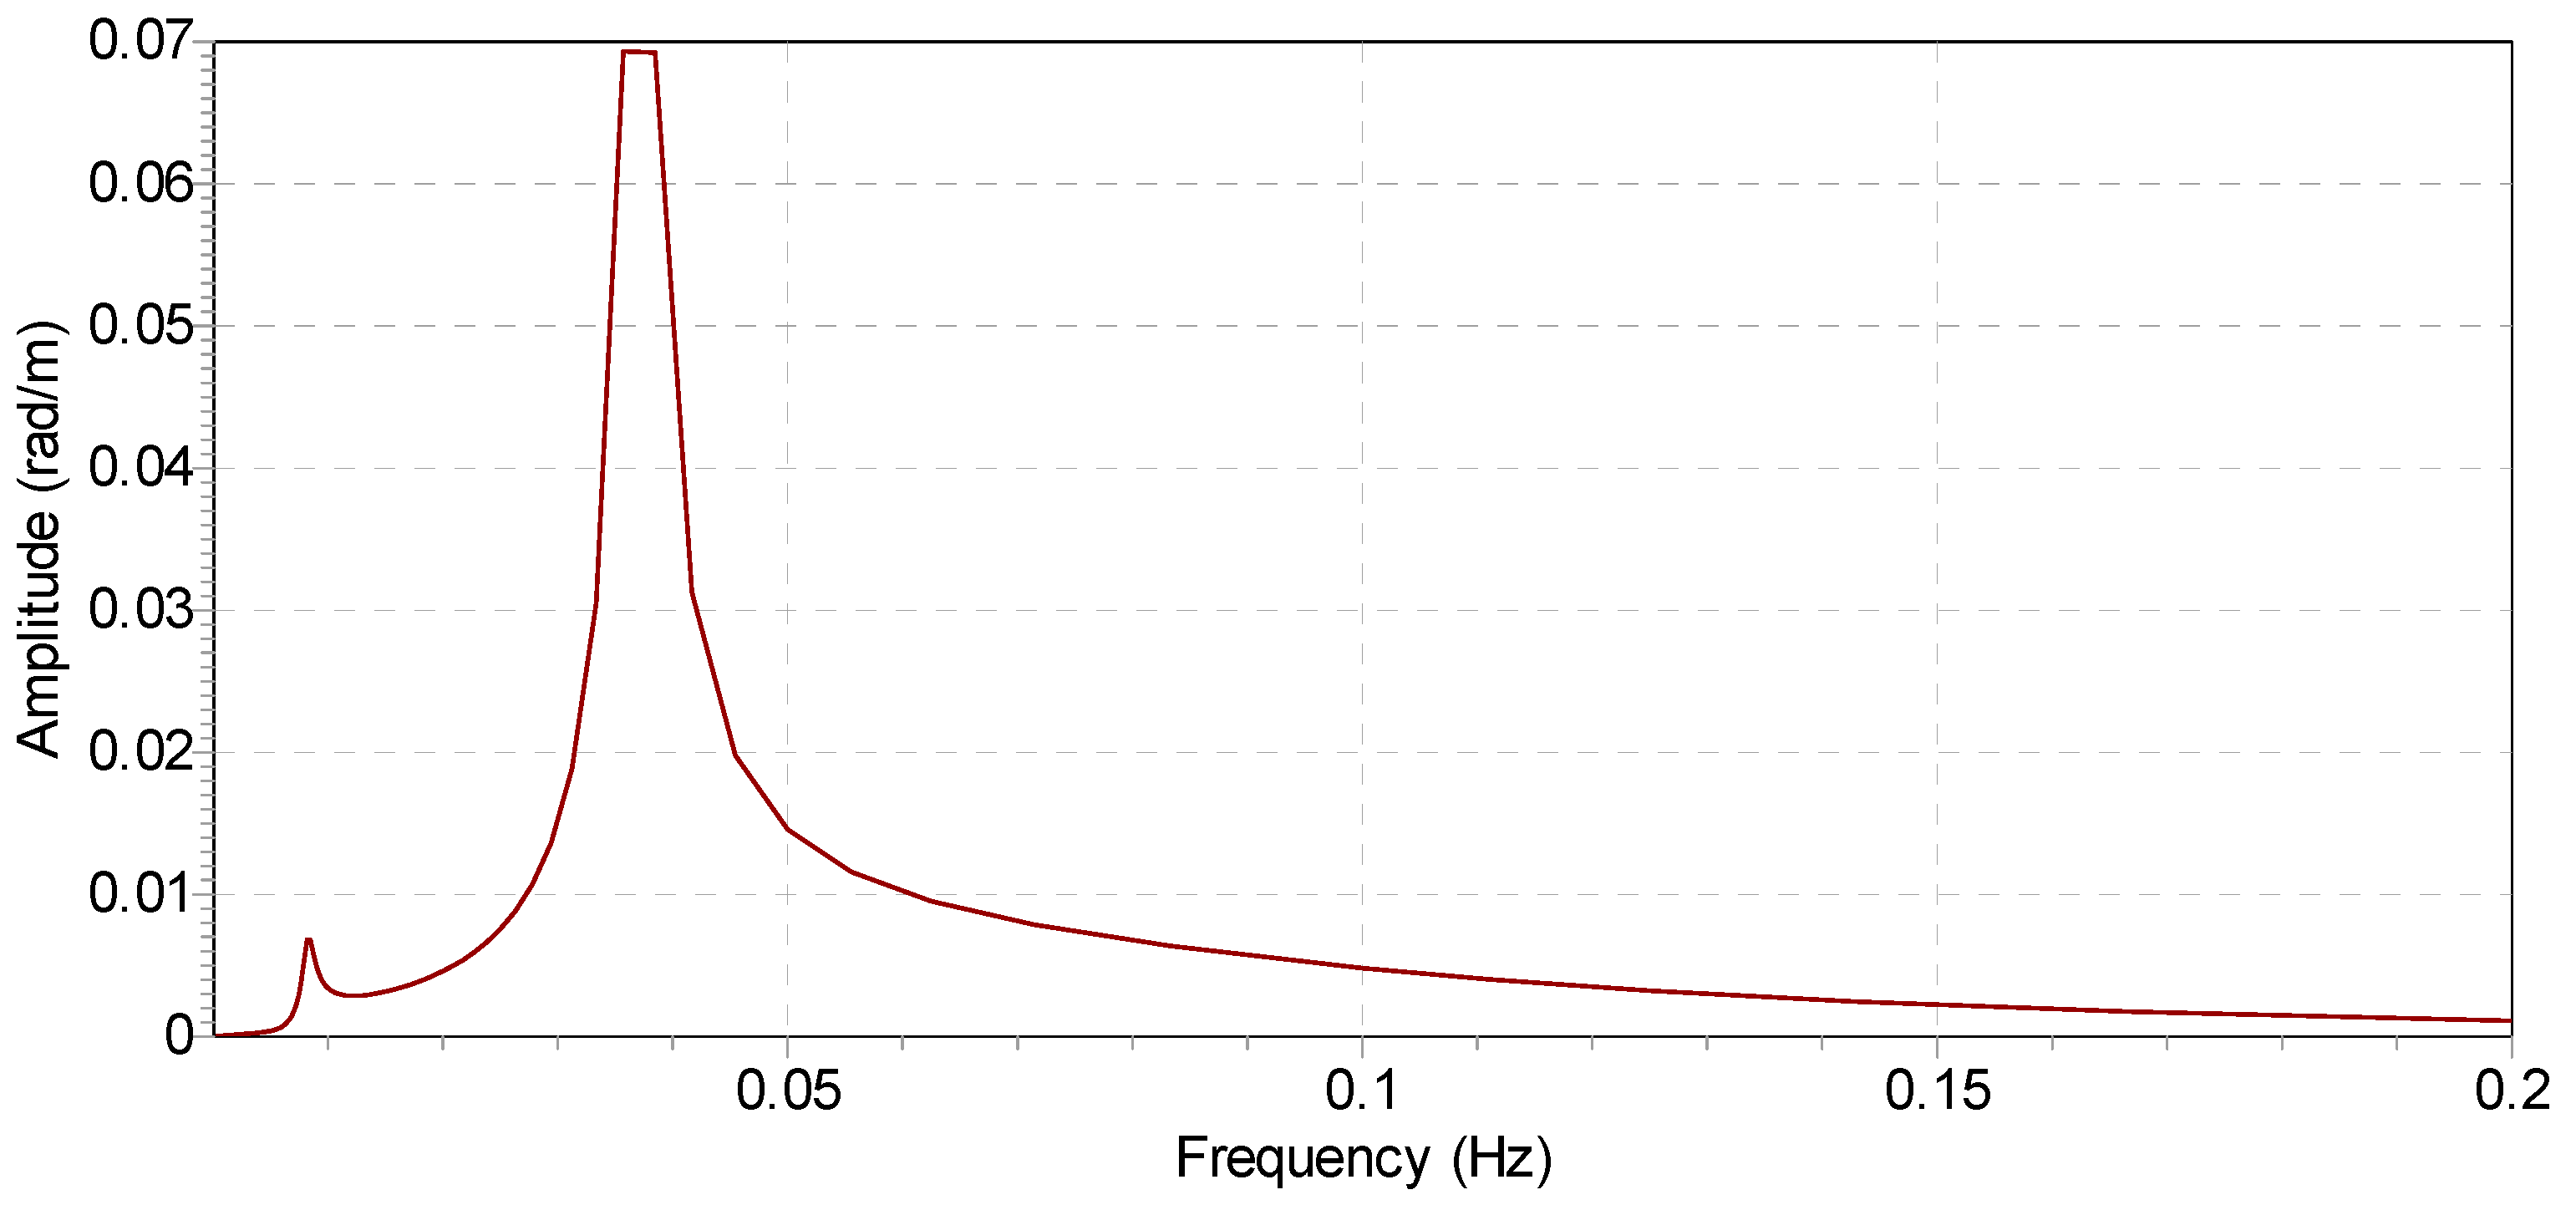
The diffraction analysis is performed using Orcawave 11.4 by Orcina, Ulverston, UK. The results are then verified against FAST and WAMIT analysis outcomes [72]. It shows good agreement with the FAST and WAMIT results, as shown in Figure 7, Figure 8, Figure 9, Figure 10, Figure 11 and Figure 12. There appears to be, however, a minor shift in frequency, which could be due to the variance in the mooring system stiffness across these models.
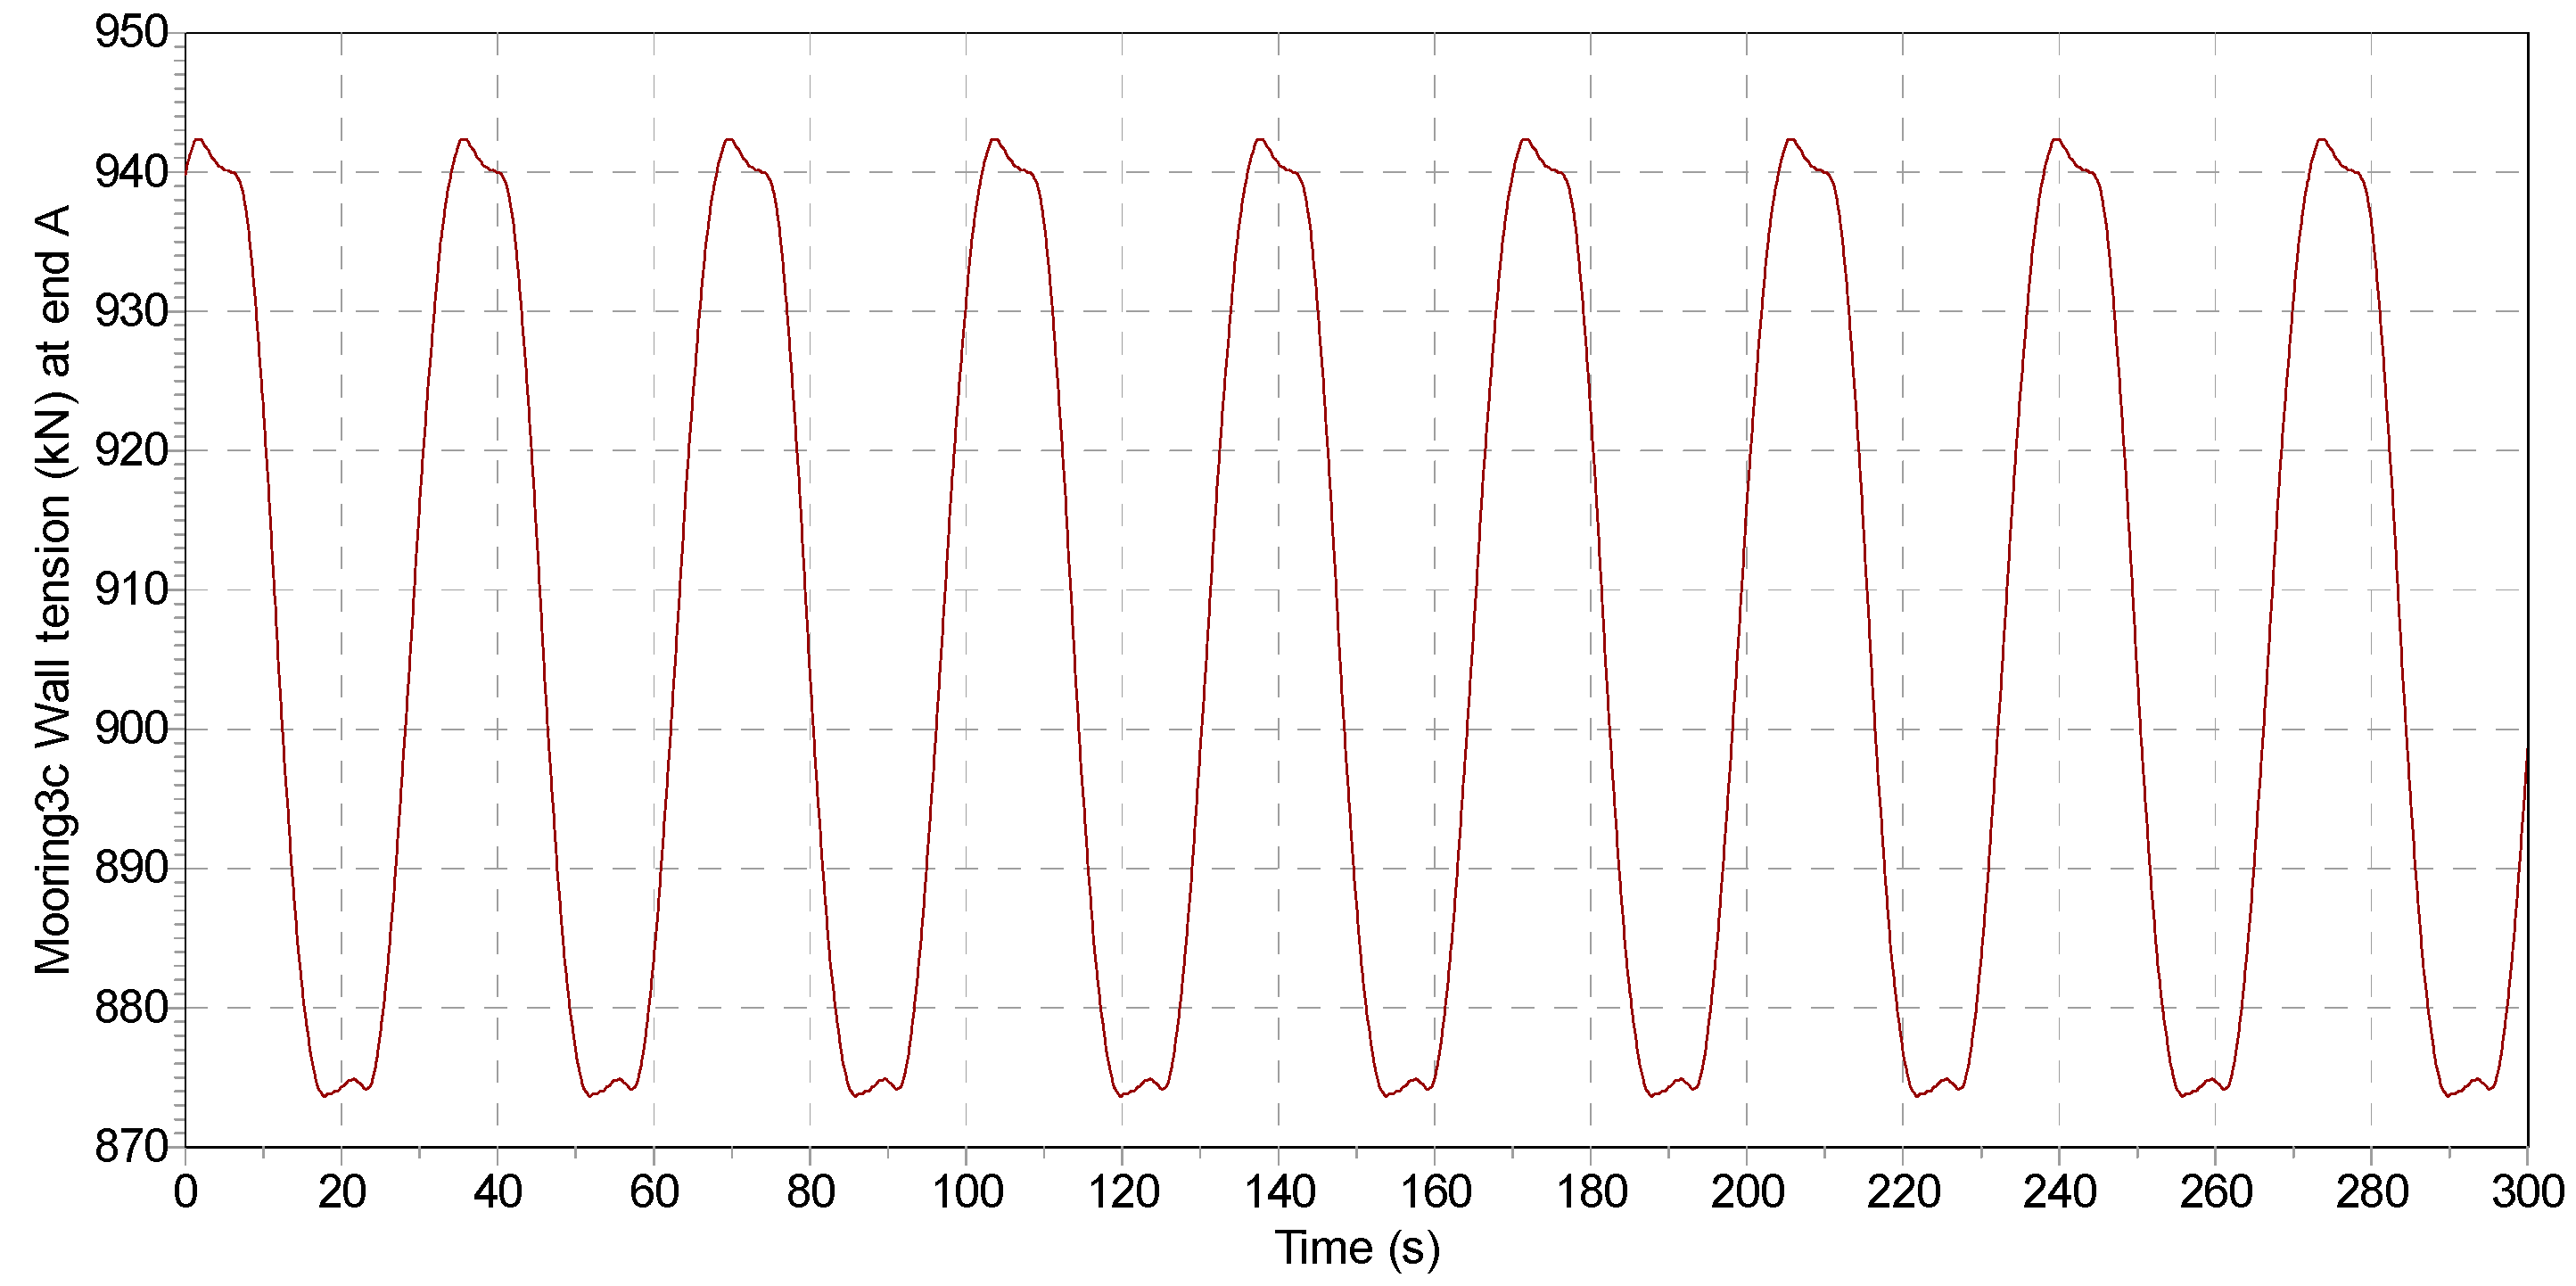
Further validation is conducted and compared with a mooring analysis of the OC3 spar by Xu and Srinil [73]. One case is analyzed where the wind and waves aligned collinearly from the between-the-line direction. A wind speed of 11.4 m/s and a regular wave height of 2.56 m with a period of 34 s are applied, and the results are shown in Figure 13.
The dynamic loads are both approximately 65 kN, which indicates that the wave loads are in good agreement with each other. In the OrcaFlex analysis, the mean line tension is found to be approximately 5% higher than the results reported by Xu and Srinil [73]. This could be because of the variance of air density used in the software program (0.00128 te/m3) considered in OrcaFlex analysis). The validation outcomes using the OC3 model show general consistency with other studies.

4.2. VolturnUS Mooring Setup

A benchmarking study has been performed to investigate the discrepancy and gap in the safety factors of the FOWT mooring system among DNV, BV, and ABS. An example of the VolturnUS platform with a 15 MW turbine has been selected for this study. The selection of the VolturnUS platform for this case study is motivated by its innovative design and its relevance to the offshore wind industry. As one of the few floating platforms that have been extensively tested in both academic and commercial settings, VolturnUS serves as a suitable model for evaluating the effectiveness of different mooring standards [56]. Also, the platform has been used in several benchmark studies, making it a well-established reference for comparing mooring system performance under various environmental conditions.
Moreover, the VolturnUS platform’s hybrid mooring system, which combines chain and synthetic rope segments, presents a unique opportunity to explore the implications of using different materials in mooring systems. This is particularly relevant given the increasing adoption of synthetic ropes in the offshore wind industry, which offers advantages in terms of weight reduction and flexibility but also presents challenges related to long-term durability and creep [45].
The VolturnUS platform model has been widely used in the research community in recent years, patented by the University of Maine, and is an offshore floating concrete hull semi-submersible, with the capability to accommodate wind turbines in water depths over 45 m. The key properties of the VolturnUS platform are listed below, in Table 10 and Table 11.
In comparison with [56], the design metocean data considered in this benchmarking study is more conservative, i.e., wind speed in this benchmarking is 52.8 m/s at hub height, whereas it is 47.5 m/s in [56]; significant wave height Hs is 13.5 m compared to 10.7 m in [56], and current speed and current load are also considered in this current study. Therefore, the anchor range has been extended by 200 m to accommodate this.

4.3. Criteria of Acceptance

The DNV definition of consequence class is as follows:
  • Consequence class 1, where failure is unlikely to lead to unacceptable consequences such as loss of life, collision with an adjacent structure, and environmental impacts;
  • Consequence class 2, where failure may well lead to unacceptable consequences of these types.
For floating wind turbine platforms with redundancy components, Consequence Class 1 is required, whereas for a floating wind turbine mooring system without redundancy, Consequence Class 2 shall be applied as per DNV (see Table 12).
The partial safety factors are applied in the following way:
S c = 0.95 × M B L
S c T m e a n × γ m e a n T d y n × γ d y n > 0
where MBL is the minimum breaking load, Sc is the characteristic strength, Tmean is the mean tension, and Tdyn is the dynamic tension. For the sake of code comparison, DNV utilization has been defined as
U t i l i z a t i o n D N V = T m e a n × γ m e a n T d y n × γ d y n S c
The BV baseline safety factor is 1.67 in the intact condition [75]. For a system without redundancy, the safety factor is required to be increased by 20%. In addition, for synthetic ropes, a 10% increase is required for polyester ropes, and a 20% increase is needed for other types of materials.
For the sake of code comparison, the BV utilization has been defined as
U t i l i z a t i o n B V = M a x i m u m F a c t o r e d   L o a d   o n   C h a i n C h a i n   M B L , F a c t o r e d   L o a d   o n   F i b r e   R o p e R o p e   M B L
Table 13 presents the ABS safety factors [76,77] for mooring lines in intact condition.
The ABS tension utilization is defined in the following way:
U t i l i z a t i o n A B S = M a x i m u m F a c t o r e d   L o a d   o n   C h a i n C h a i n   M B L , F a c t o r e d   L o a d   o n   F i b r e   R o p e R o p e   M B L
A simulation time of 3 h has been considered in the analysis, which aligns with the best industry practices. Both operating and survival conditions have been analyzed for the OC3 mooring analysis, including both all-chain and chain–fiber mooring systems. Mooring systems with and without line redundancy have also been investigated and compared. In summary, the following load cases have been assessed.

4.4. Implications of Findings

The findings from this case study have significant implications for the design and safety of floating offshore wind turbines. The analysis underscores the importance of selecting appropriate mooring materials and configurations based on the specific environmental conditions of the deployment site. For instance, the use of synthetic ropes in the VolturnUS platform, while advantageous in terms of weight and flexibility, requires careful consideration of long-term creep and fatigue characteristics to ensure the system’s reliability over its operational life. Furthermore, the comparison with the OC3 Hywind platform highlights the need for tailored mooring system designs that consider the unique challenges posed by different floating platform types. The results suggest that a one-size-fits-all approach may not be appropriate for FOWT mooring systems and that industry standards should evolve to reflect the specific needs of different platform designs. This study also points to the potential benefits of integrating more sophisticated modeling techniques, such as time-domain simulations that account for non-linear material behaviors and environmental interactions, into the design and analysis process. Such approaches could lead to more accurate predictions of mooring line tensions and, consequently, more reliable and cost-effective mooring system designs.

5. Analysis Results

5.1. Simulations Outcomes

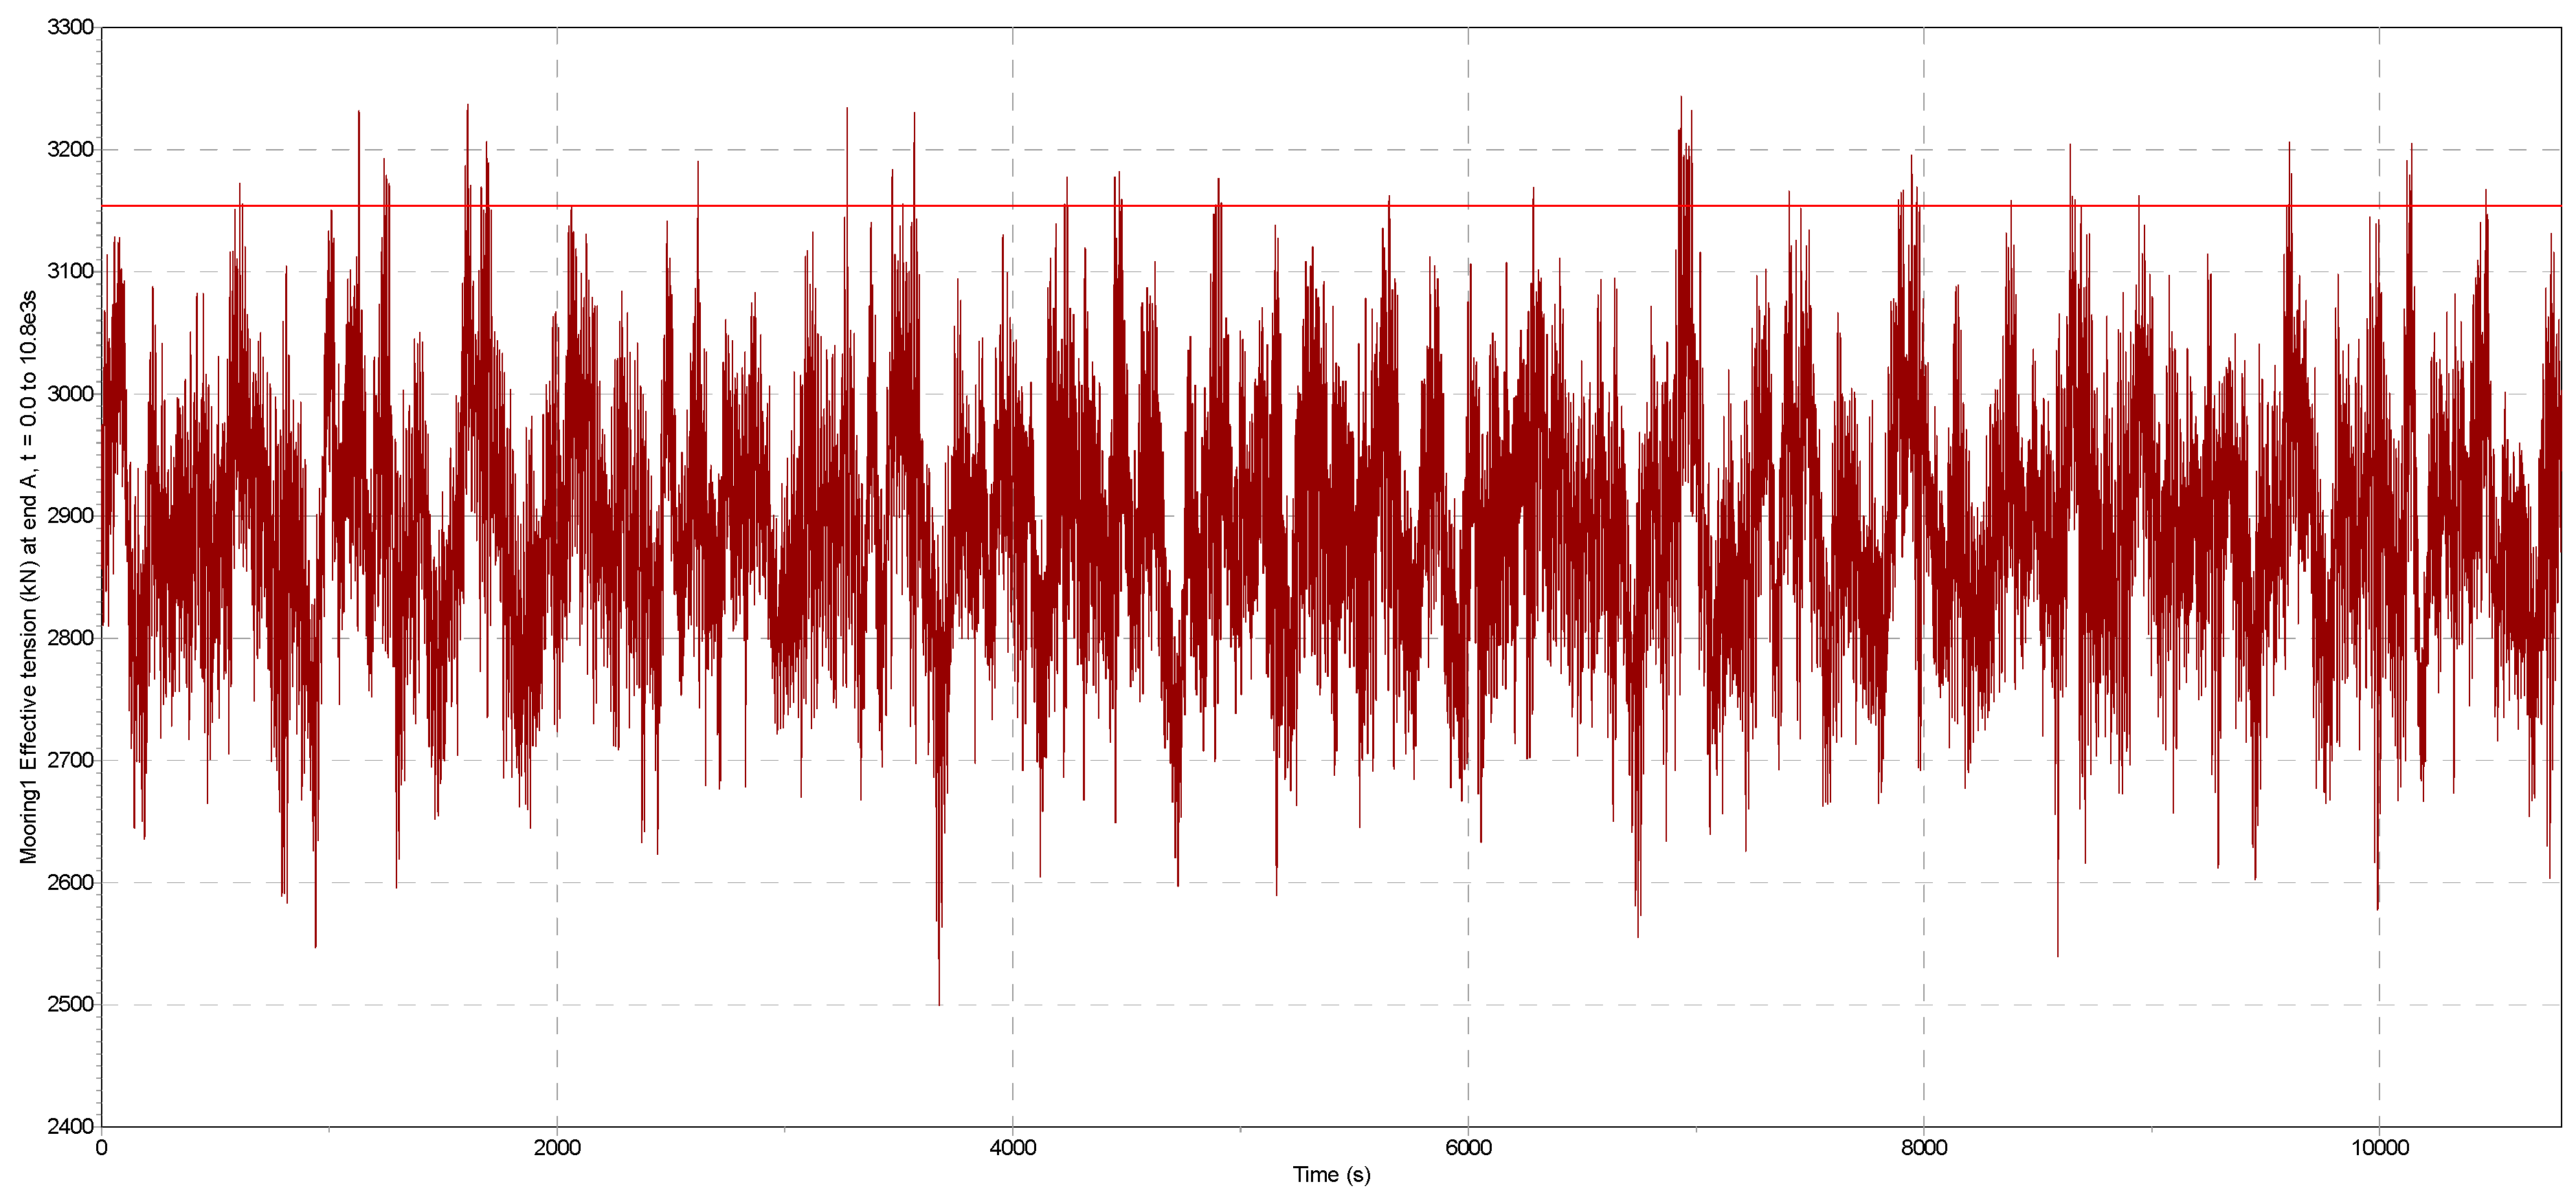
Dynamic analysis is conducted to extract the time history of the line tension, as illustrated in Figure 14, red line representing the threshold for the peaks. The 3 h return level line tension is computed with a generalized Pareto distribution with maximum likelihood fitting [78].
The dynamic tension for each analysis case is extracted by the following equation:
D y n a m i c   T e n s i o n = 3   h o u r   r e t u r n   l e v e l m e a n   t e n s i o n
The mean tension, standard deviation, and 3 h return level line tension over the simulation period is calculated by OrcaFlex, and the analysis output for each load case is presented in Table 14 and Figure 15. The number of peaks is the number of tension peaks in the time history above the selected threshold, which are then fitted into the generalized Pareto distribution.
From the analysis results table, the following conclusions can be summarized:
  • Fiber inserts, in general, have a positive impact on mooring line tensions.
  • New fiber ropes exhibited lower dynamic tensions than old ropes. In theory, the mooring tension gradually increases for a hybrid line as the synthetic rope ages.
  • All-chain system sees higher mean tensions but lower dynamic tension in comparison to a hybrid system, which helps the mooring system designer to determine what types of mooring work are favorable based on the site metocean data.
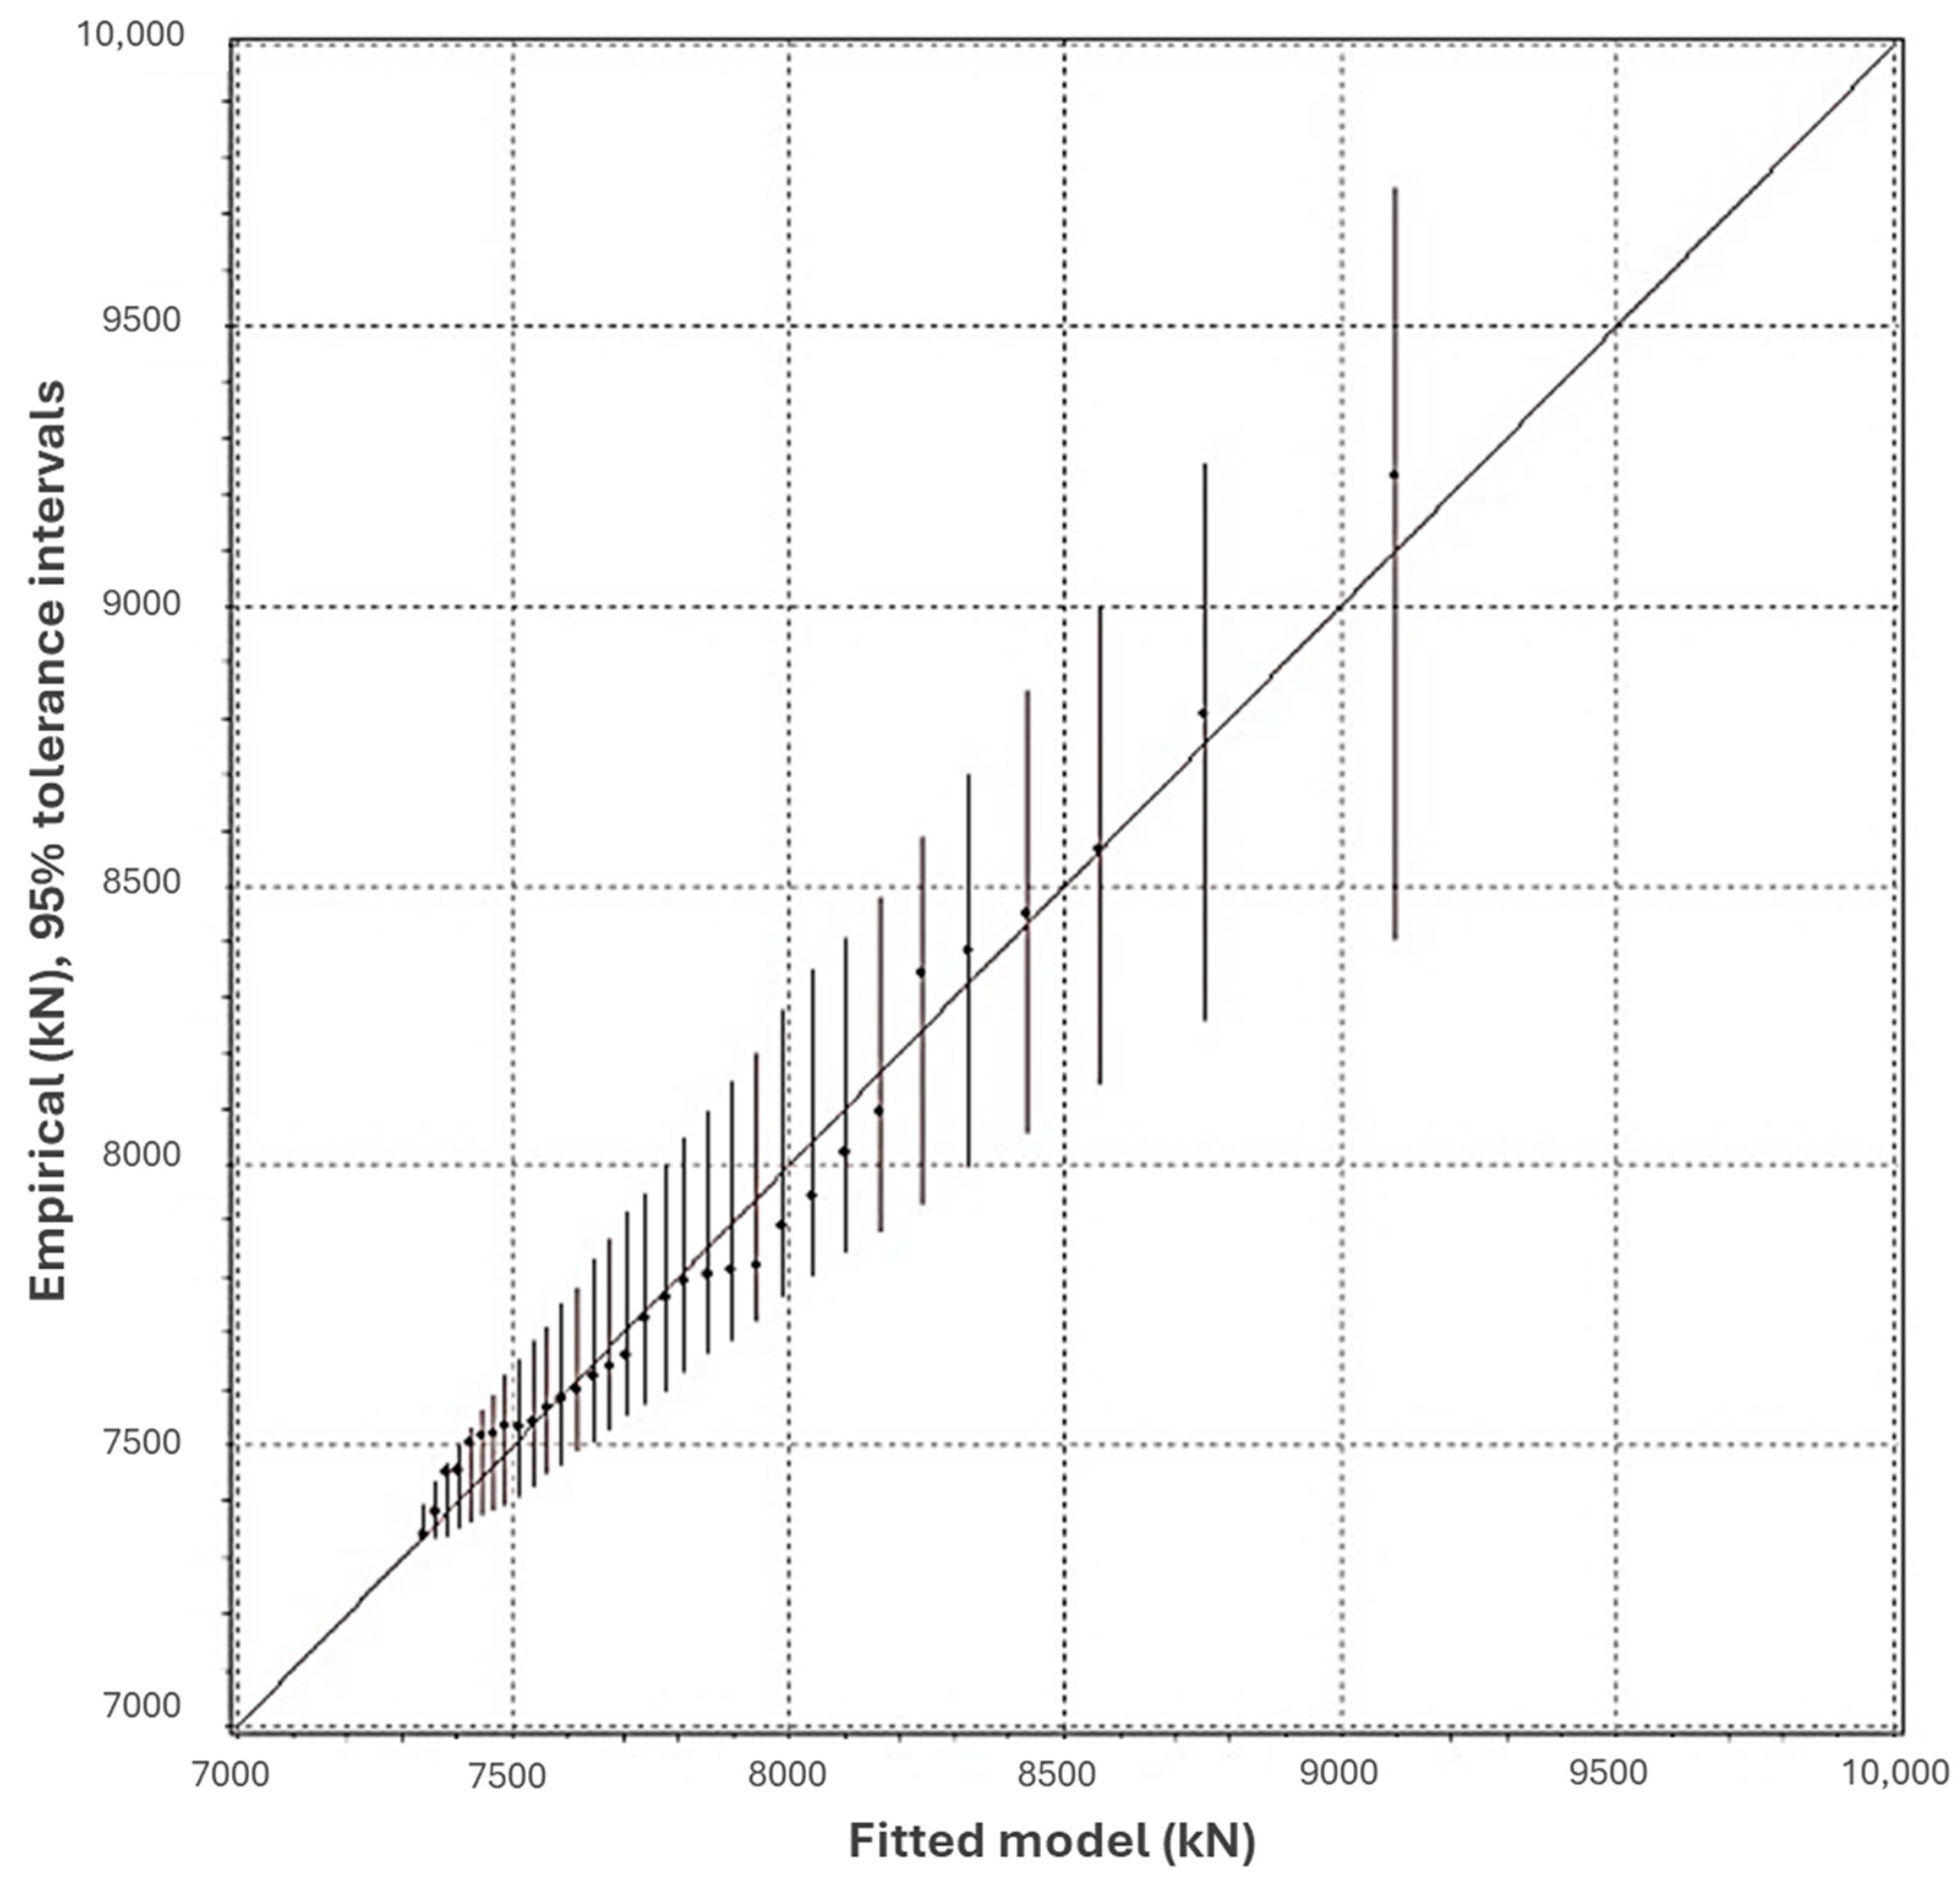
The goodness of the distribution fit is assessed by the review and analysis of quantile plots. For all cases analyzed, the goodness of fit appears to be reasonably good, with all the points sitting between a 95% confidence level and close to the diagonal theoretical line. Two examples from LC01 and LC13 are demonstrated below, in Figure 16 and Figure 17.
The analysis of safety factors across the DNV, ABS, and BV standards reveals significant differences in how these organizations approach the design of mooring systems for floating offshore wind turbines. Specifically, DNV employs a probabilistic approach, incorporating both mean and dynamic tensions to calculate safety factors that account for the variability in environmental loads.
In contrast, ABS adopts a more deterministic approach, using fixed safety factors that are adjusted based on the presence or absence of redundancy in the mooring system. BV, on the other hand, applies additional factors for synthetic ropes, reflecting the unique challenges posed by these materials, such as creep and fatigue. For example, in the case study involving the VolturnUS platform, the safety factors calculated using the DNV standard are generally lower than those calculated using ABS and BV standards under operational conditions. This suggests that DNV’s approach may be less conservative in these scenarios, potentially leading to more cost-effective designs. However, under survival conditions, the BV standard resulted in the highest safety factors, particularly for mooring lines incorporating synthetic ropes, which highlights BV’s emphasis on the long-term material behavior and additional uncertainties associated with synthetic materials.

5.2. Interpretation of Mooring Line Tensions

The calculation of mooring line tensions for the VolturnUS platform under various environmental conditions provides critical insights into the relative conservatism of each standard. Under operational conditions, the mean tensions are relatively consistent across all standards, with the DNV-based calculations showing slightly lower tensions due to the probabilistic treatment of dynamic loads [38]. However, under survival conditions, the tensions calculated using the BV standard are significantly higher, particularly in scenarios involving synthetic ropes.
This disparity can be attributed to the higher safety factors required by BV for synthetic materials, which are designed to account for potential long-term degradation and creep effects. The ABS standard also produces relatively high-tension values in survival scenarios but is more aligned with DNV in operational conditions. These results suggest that while all three standards provide robust guidelines for mooring system design, BV may offer greater conservatism in scenarios involving extreme environmental loads and synthetic materials [39].

5.3. Discussion of Material-Specific Considerations

The use of different materials in mooring lines, such as traditional steel chains and modern synthetic ropes, has a significant impact on the tension results and the associated safety factors. Steel chains, known for their high strength and predictable behavior under load, generally result in lower calculated tensions and safety factors across all standards. In contrast, synthetic ropes, while offering advantages in terms of weight and flexibility, introduce additional challenges due to their non-linear stress–strain behavior and susceptibility to long-term degradation [51].
In the case study, the hybrid mooring system of the VolturnUS platform, which incorporates both steel chains and synthetic ropes, demonstrated higher tension variability under extreme conditions. This finding underscores the importance of carefully selecting mooring materials based on the specific environmental conditions and the intended lifespan of the installation. BV’s higher safety factors for synthetic ropes reflect a more cautious approach, acknowledging the uncertainties associated with these materials.

6. Discussion

The results indicate that tension calculations according to the DNV, BV, and ABS standards are broadly comparable, despite some differences. Notably, Load Case 17 (LC17) failed under DNV and BV standards but passed marginally under ABS. Overall, BV tends to yield more conservative (i.e., higher) tension safety factors, while DNV generally predicts lower tension safety factors, particularly in calm conditions. These variations arise from differing approaches to safety and risk assessment among the classification societies, and there is no absolute standard of correctness. This study focuses on benchmarking these standards under normal operational conditions and does not address damaged scenarios or Accidental Limit States, as defined by DNV. For simplicity, only one wave condition is considered, though a comprehensive mooring analysis would typically involve multiple sea states to statistically determine the most probable maximum line tensions.
The analysis incorporates the non-linear behavior of Dyneema fiber ropes, although the long-term creep behavior is simplified by considering only “new” and “aged” rope conditions. Intermediate stages and time-dependent changes are not explicitly modeled. Similarly, while the peak-over-threshold method is used to identify characteristic maximum tensions, it involves subjective decisions that depend on the analyst’s experience. Extreme value analysis applied to the time-history data generally produced reliable fits, though some load cases showed wider confidence intervals that could be refined with threshold adjustments and additional data. The practical implications of these findings are significant for the offshore wind industry.
The variations in safety factors across different standards suggest that the choice of guidelines can have a considerable impact on the design and cost of mooring systems. For example, adhering to BV standards may result in higher initial costs due to the more conservative safety factors, particularly when synthetic ropes are used. However, this can be justified by the increased safety margin and potentially lower long-term maintenance costs, as these standards account more rigorously for material fatigue and creep.
Furthermore, the results indicate that hybrid mooring systems, such as those used in the VolturnUS platform, can offer superior performance under certain conditions but require careful design consideration to ensure long-term reliability. The higher tension variances observed in synthetic ropes under extreme conditions highlight the need for ongoing monitoring and maintenance to mitigate the risks associated with material degradation over time.
Several limitations of the current study should be acknowledged. The environmental conditions analyzed are specific to the North Sea and may not generalize to all offshore sites. Furthermore, the simplified modeling of rope stiffness and environmental interactions, along with the exclusion of transient phenomena such as wave slamming, may lead to the underestimation of actual mooring loads. These limitations suggest that caution is needed when interpreting the results.
Future research should focus on performing a more detailed evaluation of synthetic rope performance, including long-term fatigue and creep under real conditions. Expanding the scope to include damaged scenarios and more complex environmental interactions—potentially through stochastic and transient modeling—would improve design reliability. Additionally, integrating the strengths of DNV, BV, and ABS into a hybrid or harmonized standard may offer a more balanced and robust framework for mooring system design.

7. Conclusions

This study has made a critical advancement in the understanding of FOWT mooring systems by conducting a detailed comparative analysis of safety factors in line with tensions as prescribed by DNV, ABS, and BV guidelines. Utilizing the VolturnUS platform as a case study, the research employed dynamic mooring analysis through sophisticated simulation tools. This approach not only revealed the nuances and similarities between different standards but also provided a benchmark against which current and future mooring systems could be evaluated. The methodology, grounded in both theoretical and practical aspects, strengthens the study’s credibility and relevance to real-world applications.
This study assessed the effectiveness of international standards—DNV, ABS, and BV—in predicting mooring line safety for offshore wind turbines. The analysis, based on a single-wave condition, effectively demonstrated differences in mooring line behavior but did not capture the full complexity of material responses. Additionally, the subjectivity in identifying maximum line tensions highlights the need for more rigorous and standardized evaluation methodologies.
While broad alignment was observed, discrepancies emerged in specific cases, reflecting the distinct risk assessment frameworks embedded within each standard. The study does not intend to favor any classification society, as there is no absolute standard of correctness. Nonetheless, the study urges comprehensive structural reliability and risk analysis to define a partial safety or target reliability index for the next generation of floating structures.
The findings of this study have important implications for the design of reliable and cost-effective mooring systems not only for floating offshore wind turbines (FOWTs) but also for other floating offshore renewables systems, such as wave energy converters with similar risk profiles (likelihood × consequence). By revealing differences in safety factor requirements across standards, the research supports more informed design decisions that balance safety with economic considerations. In particular, the methodology presented to conduct a comparative analysis of different standards can be used by developers of innovative floating structures to make better-informed decisions in the long and arduous technology qualification process.
The study also emphasizes the need for the continuous refinement of mooring guidelines to meet the evolving demands of offshore wind applications. Future research should investigate damaged-state scenarios and the non-linear mechanical behavior of synthetic ropes to further improve mooring system resilience.
Author Contributions

Conceptualization, F.G., L.W. and A.K.; methodology, F.G., L.W., A.K. and B.Y.; software, F.G. and L.W.; validation, F.G.; formal analysis, F.G., L.W. and A.K.; investigation, F.G., L.W., A.K. and B.Y.; resources, F.G., L.W., A.K. and B.Y.; writing—original draft preparation, F.G. and L.W.; writing—review and editing, A.K. and B.Y.; visualization, F.G. and B.Y.; supervision, A.K.; project administration, A.K. All authors have read and agreed to the published version of the manuscript.

Funding

This research received no external funding.

Data Availability Statement

Research data can be made available upon request.

Conflicts of Interest

Author Fan Gao is employed by the company First Marine Solutions, which may have a commercial interest in the topic of this study. The remaining authors declare that the research was conducted in the absence of any commercial or financial relationships that could be construed as a potential conflict of interest.

Abbreviation, Nomenclature, and Symbols

TWhTerawatt hoursPOTPeaks Over Threshold
GW, MWGiga Watt, Mega WattMBLMinimum Breaking Load
EUEuropean UnionNPDNorwegian Petroleum Directorate
OWTOffshore Wind TurbineJONSWAPJoint North Sea Wave Project
FOWTFloating Offshore Wind TurbineRAOResponse Amplitude Operator
DNVDet Norske VeritasVCGVertical Center of Gravity
ABSAmerican Bureau of ShippingVCGVertical Center of Buoyancy
BVBureau VeritasCoGCenter of Gravity
APIAmerican Petroleum InstituteSWLStill Water Level
IEAInternational Energy Agencym, mmMeter, Millimeter
TLPTensioned Leg PlatformkNKilo Newton
O&GOil and GasKgKilogram
MPMMost probable Maximumm/sMeter Per Second
EVExtreme Valuerad/sRadian Per Second
GPDGeneralized Pareto DistributionHsSignificant Wave Height
VolturnUSFloating Substructure by the University of MaineTzZero Up-Crossing Period
PDFProbability Density FunctionWAMITWave analysis tool for offshore structures
OrcaFlexSoftware for the dynamic analysis of offshore marine systemsFASTPhysics-based engineering tool to analyze the coupled dynamic response of OWT

References

  1. Energy Institute. Statistical Review of World Energy. 2023. Available online: https://ourworldindata.org/energy-production-consumption (accessed on 1 October 2024).
  2. World Forum Offshore Wind. Global Offshore Wind Report, Based on BloombergNEF Offshore Wind Forecast Report in 2023; Global Wind Energy Council: Brussels, Belgium, 2022. [Google Scholar]
  3. GWEC. Global Wind Report; Global Wind Energy Council: Brussels, Belgium, 2023. [Google Scholar]
  4. European Commission. Renewable Energy Targets. Available online: https://energy.ec.europa.eu/topics/renewable-energy/renewable-energy-directive-targets-and-rules/renewable-energy-targets_en (accessed on 1 October 2024).
  5. Visual Capitalist. Progress on 2030 Renewable Energy Targets by Country. Available online: https://www.visualcapitalist.com/progress-on-2030-renewable-energy-targets-by-country/ (accessed on 1 October 2024).
  6. Statista Offshore Wind Energy Capacity Worldwide from 2009 to 2024. Available online: https://www.statista.com/statistics/476327/global-capacity-of-offshore-wind-energy/ (accessed on 1 October 2024).
  7. Díaz, H.; Guedes Soares, C. Review of the current status, technology and future trends of offshore wind farms. Ocean. Eng. 2020, 209, 107381. [Google Scholar] [CrossRef]
  8. Zhao, G.; Zhao, Y.; Dong, S. System reliability analysis of mooring system for floating offshore wind turbine based on environmental contour approach. Ocean. Eng. 2023, 285, 115157. [Google Scholar] [CrossRef]
  9. Tian, H.; Soltani, M.N.; Nielsen, M.E. Review of floating wind turbine damping technology. Ocean. Eng. 2023, 278, 114365. [Google Scholar] [CrossRef]
  10. Leimeister, M.; Kolios, A.; Collu, M. Critical review of floating support structures for offshore wind farm deployment. J. Phys. Conf. Ser. 2018, 1104, 012007. [Google Scholar] [CrossRef]
  11. Martin, H.; Spano, G.; Küster, J.F.; Collu, M.; Kolios, A.J. Application and extension of the TOPSIS method for the assessment of floating offshore wind turbine support structures. Ships Offshore Struct. 2013, 8, 477–487. [Google Scholar] [CrossRef]
  12. Leimeister, M.; Kolios, A. Reliability-based design optimization of a spar-type floating offshore wind turbine support structure. Reliab. Eng. Syst. Saf. 2021, 213, 107666. [Google Scholar] [CrossRef]
  13. Edwards, E.C.; Holcombe, A.; Brown, S.; Ransley, E.; Hann, M.; Greaves, D. Trends in floating offshore wind platforms: A review of early-stage devices. Renew. Sustain. Energy Rev. 2024, 193, 114271. [Google Scholar] [CrossRef]
  14. Rony, J.S.; Karmakar, D. Dynamic analysis of frustum TLP-type wind turbine multi-purpose floating platform. Ships Offshore Struct. 2023, 19, 323–337. [Google Scholar] [CrossRef]
  15. Díaz, H.; Guedes Soares, C. Approach for Installation and Logistics of a Floating Offshore Wind Farm. J. Mar. Sci. Eng. 2023, 11, 53. [Google Scholar] [CrossRef]
  16. Lee, K.; Chung, M.; Kim, S.; Shin, D.H. Damage detection of catenary mooring line based on recurrent neural networks. Ocean. Eng. 2021, 227, 108898. [Google Scholar] [CrossRef]
  17. Lou, J.; Yim, S.C.; von Jouanne, A. Dynamic Mooring Field Experiment and Design of a Wave Energy Converter Platform Test System. J. Offshore Mech. Arct. Eng. 2024, 146, 012001. [Google Scholar] [CrossRef]
  18. Pillai, A.C.; Gordelier, T.J.; Thies, P.R.; Dormenval, C.; Wray, B.; Parkinson, R.; Johanning, L. Anchor loads for shallow water mooring of a 15 MW floating wind turbine—Part I: Chain catenary moorings for single and shared anchor scenarios. Ocean. Eng. 2022, 266, 111816. [Google Scholar] [CrossRef]
  19. Xu, S.; Guedes Soares, C.; Ji, C. Semi-taut mooring line damping. In Maritime Technology and Engineering 3; Guedes Soares, C., Santos, T., Eds.; Taylor & Francis Group: London, UK, 2016; pp. 1149–1155. [Google Scholar]
  20. Ji, C.; Yuan, Z. Experimental study of a hybrid mooring system. J. Mar. Sci. Technol. 2014, 20, 213–225. [Google Scholar] [CrossRef]
  21. Offshore Renewable Energy Catapult. Mooring and Anchoring Systems—Market Projections; ORE Catapult: Northumberland, UK, 2021. [Google Scholar]
  22. Yang, M.; Teng, B.; Ning, D.; Shi, Z. Coupled dynamic analysis for wave interaction with a truss spar and its mooring line/riser system in time domain. Ocean. Eng. 2012, 39, 72–87. [Google Scholar] [CrossRef]
  23. Ma, G.; Wang, H.; Sun, L.; Jiang, Y. Dynamic truncation method for mooring lines with tension estimation combined in the time and frequency domains. Ships Offshore Struct. 2018, 13, 310–319. [Google Scholar] [CrossRef]
  24. He, S.; Wang, A. Time and Frequency Domain Dynamic Analysis of Offshore Mooring. J. Mar. Sci. Eng. 2021, 9, 781. [Google Scholar] [CrossRef]
  25. Yeter, B.; Garbatov, Y. Structural integrity assessment of fixed support structures for offshore wind turbines: A review. Ocean. Eng. 2022, 244, 110271. [Google Scholar] [CrossRef]
  26. Xu, S.; Ji, C.-y.; Guedes Soares, C. Short-term extreme mooring tension and uncertainty analysis by a modified ACER method with adaptive Markov Chain Monte Carlo simulations. Ocean. Eng. 2021, 236, 109445. [Google Scholar] [CrossRef]
  27. Xu, S.; Ji, C.-y.; Guedes Soares, C. Estimation of short-term extreme responses of a semi-submersible moored by two hybrid mooring systems. Ocean. Eng. 2019, 190, 106388. [Google Scholar] [CrossRef]
  28. Tang, H.-J.; Yao, H.-C.; Yang, R.-Y. Experimental and numerical study of a barge-type floating offshore wind turbine under a mooring line failure. Ocean. Eng. 2023, 278, 114411. [Google Scholar] [CrossRef]
  29. Amaechi, C.V.; Odijie, A.C.; Wang, F.; Ye, J. Numerical investigation on mooring line configurations of a Paired Column Semisubmersible for its global performance in deep water condition. Ocean. Eng. 2022, 250, 110572. [Google Scholar] [CrossRef]
  30. Ja’e, I.A.; Ahmed Ali, M.O.; Yenduri, A.; Amaechi, C.V.; Nizamani, Z.; Nakayama, A. Optimization of mooring line design parameters using Mooring Optimization Tool for FPSO (MooOpT4FPSO) with the consideration of integrated design methodology. Ocean. Eng. 2022, 264, 112499. [Google Scholar] [CrossRef]
  31. Li, H.; Du, J.; Wang, S.; Sun, M.; Chang, A. Investigation on the probabilistic distribution of mooring line tension for fatigue damage assessment. Ocean. Eng. 2016, 124, 204–214. [Google Scholar] [CrossRef]
  32. API RP 2SK; Design and Analysis of Stationkeeping Systems for Floating Structures. API: Washington, DC, USA, 2005.
  33. Kvittem, M.I.; Moan, T. Time domain analysis procedures for fatigue assessment of a semi-submersible wind turbine. Mar. Struct. 2015, 40, 38–59. [Google Scholar] [CrossRef]
  34. Zhu, F.; Yeter, B.; Brennan, F.; Collu, M. Time-domain fatigue reliability analysis for floating offshore wind turbine substructures using coupled nonlinear aero-hydro-servo-elastic simulations. Eng. Struct. 2024, 318, 118759. [Google Scholar] [CrossRef]
  35. Zhao, Y.; Liao, Z.; Dong, S. Estimation of characteristic extreme response for mooring system in a complex ocean environment. Ocean. Eng. 2021, 225, 108809. [Google Scholar] [CrossRef]
  36. Montes-Iturrizaga, R.; Heredia-Zavoni, E. Reliability analysis of mooring lines using copulas to model statistical dependence of environmental variables. Appl. Ocean. Res. 2016, 59, 564–576. [Google Scholar] [CrossRef]
  37. Zhang, D.; Du, J.; Wang, J.; Chang, A. Probability Distribution of the Hull Motion and Mooring Line Tension of Two Floating Systems. J. Ocean. Univ. China 2020, 19, 281–297. [Google Scholar] [CrossRef]
  38. Zhao, Y.; Dong, S. Uncertainty analysis of extreme mooring loads associated with environmental contours and peak tension distributions. Mar. Struct. 2023, 89, 103369. [Google Scholar] [CrossRef]
  39. Wang, Y.; Xia, Y.; Liu, X. Establishing robust short-term distributions of load extremes of offshore wind turbines. Renew. Energy 2013, 57, 606–619. [Google Scholar] [CrossRef]
  40. Stanisic, D.; Efthymiou, M.; Kimiaei, M.; Zhao, W. Design loads and long term distribution of mooring line response of a large weathervaning vessel in a tropical cyclone environment. Mar. Struct. 2018, 61, 361–380. [Google Scholar] [CrossRef]
  41. Yeter, B.; Tekgoz, M.; Garbatov, Y.; Guedes Soares, C. Fragility analysis of an ageing monopile offshore wind turbine subjected to simultaneous wind and seismic load. Saf. Extrem. Environ. 2020, 2, 155–170. [Google Scholar] [CrossRef]
  42. Sørum, S.H.; Fonseca, N.; Kent, M.; Faria, R.P. Assessment of nylon versus polyester ropes for mooring of floating wind turbines. Ocean. Eng. 2023, 278, 114339. [Google Scholar] [CrossRef]
  43. Umana, E.C.; Tamuno-Iduabia Tamunodukobipi, D.; Inegiyemiema, M. Comparative analysis of fibre rope (polyester) and steel (wire) rope for a Floating Production Storage and Offloading (FPSO) terminal. Ocean. Eng. 2022, 243, 110081. [Google Scholar] [CrossRef]
  44. Zhang, Y.; Shi, W.; Li, D.; Li, X.; Duan, Y. Development of a numerical mooring line model for a floating wind turbine based on the vector form intrinsic finite element method. Ocean. Eng. 2022, 253, 111354. [Google Scholar] [CrossRef]
  45. Chen, M.; Li, C.B.; Han, Z.; Lee, J.-b. A simulation technique for monitoring the real-time stress responses of various mooring configurations for offshore floating wind turbines. Ocean. Eng. 2023, 278, 114366. [Google Scholar] [CrossRef]
  46. Touzon, I.; Nava, V.; Gao, Z.; Mendikoa, I.; Petuya, V. Small scale experimental validation of a numerical model of the HarshLab2.0 floating platform coupled with a non-linear lumped mass catenary mooring system. Ocean. Eng. 2020, 200, 107036. [Google Scholar] [CrossRef]
  47. Li, Y.; Guo, S.; Chen, W.; Yan, D.; Song, J. Analysis on restoring stiffness and its hysteresis behavior of slender catenary mooring-line. Ocean. Eng. 2020, 209, 107521. [Google Scholar] [CrossRef]
  48. Xu, S.; Wang, S.; Guedes Soares, C. Review of mooring design for floating wave energy converters. Renew. Sustain. Energy Rev. 2019, 111, 595–621. [Google Scholar] [CrossRef]
  49. ISO 19901-7:2013; Stationkeeping Systems for Floating Offshore Structures and Mobile Offshore Units. ISO: Geneva, Switzerland, 2013.
  50. DNV-OS-E301; Position Mooring. DNVGL: Oslo, Norway, 2021.
  51. Ma, K.-T.; Luo, Y.; Kwan, T.; Wu, Y. Mooring design. In Mooring System Engineering for Offshore Structures; Gulf Professional Publishing: Houston, TX, USA, 2019; pp. 63–83. [Google Scholar] [CrossRef]
  52. Viselli, A.; Dagher, H.J.; Goupee, A. Volturnus 1:8—Design and testing of the first grid-connected offshore wind turbine in the U.S.A. In SNAME 19th Offshore Symposium; Onepetro: Houston, TX, USA, 2014; pp. 198–206. [Google Scholar]
  53. Viselli, A.; Goupee, A.; Dagher, H. Model Test of a 1:8-Scale Floating Wind Turbine Offshore in the Gulf of Maine 1. J. Offshore Mech. Arct. Eng. 2015, 137, 041901. [Google Scholar] [CrossRef]
  54. Viselli, A.; Goupee, A.; Dagher, H.; Allen, C. VolturnUS 1:8: Conclusion of 18-Months of Operation of the First Grid-Connected Floating Wind Turbine Prototype in the Americas. In Proceedings of the ASME 2015 34th International Conference on Ocean, Offshore and Arctic Engineering, St. John’s, NL, Canada, 31 May–5 June 2015; ASME: Newfoundland, Canada, 2015; p. V009T09A055. [Google Scholar] [CrossRef]
  55. Sandua-Fernández, I.; Vittori, F.; Eguinoa, I.; Cheng, P. Impact of hydrodynamic drag coefficient uncertainty on 15 MW floating offshore wind turbine power and speed control. J. Phys. Conf. Ser. 2022, 2362, 012037. [Google Scholar] [CrossRef]
  56. Allen, C.; Viscelli, A.; Dagher, H.; Goupee, A.; Gaertner, E.; Abbas, N.; Hall, M.; Barter, G. Definition of the UMaine VolturnUS-S Reference Platform Developed for the IEA Wind 15-Megawatt Offshore Reference Wind Turbine; National Renewable Energy Lab.(NREL): Golden, CO, USA, 2020.
  57. Lankhorst. 2024. Available online: https://www.lankhorstropes.com/synthetic-fibre-ropes/lanko-force (accessed on 1 October 2024).
  58. Glotzer, D.; Pipiras, V.; Belenky, V.; Weems, K.M.; Sapsis, T.P. Distributions and extreme value analysis of critical response rate and split-time metric in nonlinear oscillators with stochastic excitation. Ocean. Eng. 2024, 292, 116538. [Google Scholar] [CrossRef]
  59. Wang, Y.; Mallahzadeh, H.; Abu Husain, M.K.; Mohd Zaki, N.I.; Najafian, G. Probabilistic Modelling of Extreme Offshore Structural Response due to Random Wave Loading. In Proceedings of the ASME 2013 32nd International Conference on Ocean, Offshore and Arctic Engineering, Nantes, France, 9–14 June 2013; ASME: Nantes, France, 2013. [Google Scholar] [CrossRef]
  60. Gong, K.; Ding, J.; Chen, X. Estimation of long-term extreme response of operational and parked wind turbines: Validation and some new insights. Eng. Struct. 2014, 81, 135–147. [Google Scholar] [CrossRef]
  61. Bhaskaran, S.; Verma, A.S.; Goupee, A.J.; Bhattacharya, S.; Nejad, A.R.; Shi, W. Comparison of Extreme Wind and Waves Using Different Statistical Methods in 40 Offshore Wind Energy Lease Areas Worldwide. Energies 2023, 16, 6935. [Google Scholar] [CrossRef]
  62. Orcina Extreme Value Statistics Theory. Available online: https://www.orcina.com/webhelp/OrcaFlex/Content/html/Extremevaluestatisticstheory.htm (accessed on 1 October 2024).
  63. Hou, H.-M.; Liu, Y. Analysis of the upper tail of the short-term extreme tension distribution of mooring line by the peaks-over-threshold method. Ocean. Eng. 2023, 281, 114994. [Google Scholar] [CrossRef]
  64. Cai, J.; Le Grognec, P.; Nême, A. Analytical and numerical study of the lateral buckling of an imperfect pipe accounting for torsional effects. Ocean. Eng. 2023, 271, 113686. [Google Scholar] [CrossRef]
  65. Tian, H.; Soltani, M.N.; Yeter, B.; Galván-Pozos, D.E. Design of a novel tower damping system for semi-submersible floating offshore wind turbines considering fatigue and ultimate limit states. Ocean. Eng. 2025, 320, 120343. [Google Scholar] [CrossRef]
  66. Ma, K.-T.; Luo, Y.; Kwan, T.; Wu, Y. Chapter 3—Environmental loads and vessel motions. In Mooring System Engineering for Offshore Structures; Ma, K.-T., Luo, Y., Kwan, T., Wu, Y., Eds.; Gulf Professional Publishing: Houston, TX, USA, 2019; pp. 41–62. [Google Scholar] [CrossRef]
  67. Wu, Y.; Wang, T.; Eide, Ø.; Haverty, K. Governing factors and locations of fatigue damage on mooring lines of floating structures. Ocean. Eng. 2015, 96, 109–124. [Google Scholar] [CrossRef]
  68. Jonkman, J. Definition of the Floating System for Phase IV of OC3; National Renewable Energy Laboratory: Golden, CO, USA, 2010.
  69. Lin, Y.-H.; Hsu, C.-L.; Kao, S.-H. Hydrodynamics of the wind float OC3-Hywind with mooring loads estimated by the modular system. J. Mar. Sci. Technol. 2019, 24, 237–248. [Google Scholar] [CrossRef]
  70. Mendoza, J.; Nielsen, J.S.; Sørensen, J.D.; Köhler, J. Structural reliability analysis of offshore jackets for system-level fatigue design. Struct. Saf. 2022, 97, 102220. [Google Scholar] [CrossRef]
  71. Yeter, B.; Garbatov, Y.; Guedes Soares, C. System reliability of a jacket offshore wind turbine subjected to fatigue. In Progress in the Analysis and Design of Marine Structures; Guedes Soares, C., Garbatov, Y., Eds.; Taylor & Francis Group: London, UK, 2017; pp. 939–950. [Google Scholar]
  72. Ramachandran, G.K.V.; Robertson, A.; Jonkman, J.M.; Masciola, M.D. Investigation of Response Amplitude Operators for Floating Offshore Wind Turbines. In Proceedings of the 23rd International Ocean, Offshore and Polar Engineering Conference—ISOPE 2013, Anchorage, AK, USA, 30 June–5 July 2013. [Google Scholar]
  73. Xu, X.; Srinil, N. Dynamic Response Analysis of Spar-Type Floating Wind Turbines and Mooring Lines with Uncoupled vs Coupled Models. In Volume 9: Ocean Renewable Energy; American Society of Mechanical Engineers: New York, NY, USA, 2015. [Google Scholar] [CrossRef]
  74. DNVGL-ST-0119; Floating Wind Turbine Structures. DNV: Oslo, Norway, 2021.
  75. BV 572-NI; Classification and Certification of Floating Offshore Wind Turbines. Bureau Veritas: Paris, France, 2019.
  76. ABS. ABS Guide for Building and Classing FOWT; American Bureau of Shipping: Houston, TX, USA, 2020. [Google Scholar]
  77. ABS. ABS-Position-Mooring-Systems; American Bureau of Shipping: Houston, TX, USA, 2018. [Google Scholar]
  78. Orcina. Orcaflex User Manual; Orcina: Ulverston, UK, 2024. [Google Scholar]
Figure 2. Mooring design process flow chart.
Jmse 13 02170 g002
Figure 3. The OrcaFlex model of VolturnUS.
Jmse 13 02170 g003
Figure 4. New and used rope load vs. elongation chart (reproduced from [57]).
Jmse 13 02170 g004
Figure 5. OC3 OrcaFlex model overview.
Jmse 13 02170 g005
Figure 6. OC3 mesh details.
Jmse 13 02170 g006
Figure 7. Generated surge RAO—Orcawave hydrodynamic analysis.
Jmse 13 02170 g007
Figure 8. Surge RAO for comparison (reproduced from [72]).
Jmse 13 02170 g008
Figure 9. Generated heave RAO—Orcawave hydrodynamic analysis.
Jmse 13 02170 g009
Figure 10. Heave RAO for comparison (reproduced from [72]).
Jmse 13 02170 g010
Figure 11. Generated pitch RAO—Orcawave hydrodynamic analysis.
Jmse 13 02170 g011
Figure 12. Pitch RAO for comparison (reproduced from [72]).
Jmse 13 02170 g012
Figure 13. Most loaded line tension response from OrcaFlex analysis.
Jmse 13 02170 g013
Figure 14. LC01 line tension time history and threshold.
Jmse 13 02170 g014
Figure 15. Line tension utilization comparison.
Jmse 13 02170 g015
Figure 16. Quantile plots—load case 01.
Jmse 13 02170 g016
Figure 17. Quantile plots—load case 13.
Jmse 13 02170 g017
Table 1. VolturnUS mooring analysis load cases.
Case IDLoad ConditionLine Make-UpRedundancyWeather DirectionNote
LC01OperationalAll chainNoDown Line
LC02OperationalAll chainNoBetween Line
LC03OperationalAll chainYesDown Line
LC04OperationalAll chainYesBetween Line
LC05Operational400 m FiberNoDown LineOld rope
LC06Operational400 m FiberNoBetween LineOld rope
LC07Operational400 m FiberNoDown LineNew rope
LC08Operational400 m FiberNoBetween LineNew rope
LC09Operational400 m FiberYesDown LineOld rope
LC10Operational400 m FiberYesBetween LineOld rope
LC11Operational400 m FiberYesDown LineNew rope
LC12Operational400 m FiberYesBetween LineNew rope
LC13SurvivalAll chainNoDown Line
LC14SurvivalAll chainNoBetween Line
LC15SurvivalAll chainYesDown Line
LC16SurvivalAll chainYesBetween Line
LC17Survival400 m FiberNoDown LineOld rope
LC18Survival400 m FiberNoBetween LineOld rope
LC19Survival400 m FiberNoDown Linenew rope
LC20Survival400 m FiberNoBetween Linenew rope
LC21Survival400 m FiberYesDown LineOld rope
LC22Survival400 m FiberYesBetween LineOld rope
LC23Survival400 m FiberYesDown LineNew rope
LC24Survival400 m FiberYesBetween LineNew rope
Table 2. All-chain line properties; mooring system with redundancy.
ParameterValueUnit
No. of Lines6-
Line TypeAll Chain-
- Chain GradeR4 Studlink-
- Chain Size137mm
- Chain MBL1732te
Total Line Payout1050m
Pretension200te
Drag Coefficient, Normal2.6-
Drag Coefficient, Axial1.4-
Added Mass Coefficient, Normal1.0-
Added Mass Coefficient, Axial0.5-
Table 3. All-chain line properties; mooring system without redundancy.
ParameterValueUnit
No. of Lines3-
Line TypeAll Chain-
- Chain GradeR4 Studlink-
- Chain Size162mm
- Chain MBL2275te
Total Line Payout1050m
Pretension200te
Drag Coefficient, Normal2.6-
Drag Coefficient, Axial1.4-
Added Mass Coefficient, Normal1.0-
Added Mass Coefficient, Axial0.5-
Table 4. Fiber line properties; mooring system with redundancy.
ParameterValueUnit
No. of Lines6-
Line TypeHybrid-
- Chain GradeR4 Studlink-
- Chain Size137mm
- Chain MBL1732te
- Fiber TypeDyneema-
- Fiber Size171mm
- Fiber MBL2083te
Total Line Payout1050 (50 m top chain + 400 m Fiber Inserts + 600 m anchor chain)m
Pretension200te
Drag Coefficient, Normal2.6-
Drag Coefficient, Axial1.4-
Added Mass Coefficient, Normal1.0-
Added Mass Coefficient, Axial0.5-
Table 5. Fiber line properties; mooring system without redundancy.
ParameterValueUnit
No. of Lines3-
Line TypeHybrid-
- Chain GradeR4 Studlink-
- Chain Size162mm
- Chain MBL2275te
- Fiber TypeDyneema-
- Fiber Size187mm
- Fiber MBL2529te
Total Line Payout1050 (50 m top chain + 400 m Fiber Inserts + 600 m anchor chain)m
Pretension200te
Drag Coefficient, Normal2.6-
Drag Coefficient, Axial1.4-
Added Mass Coefficient, Normal1.0-
Added Mass Coefficient, Axial0.5-
Table 6. Metocean criteria used in mooring analysis.
OperatingSurvivalUnit
Wind Speed at 10 m MSL20.837.7m/s
Wind Speed at 150 m MSL27.452.8m/s
Wind SpectrumNPD
Wave Hs6.6413.5m
Wave Tz9.412.2s
Wave SpectrumJONSWAP
Surface Current Speed0.600.67m/s
Water Depth200m
Table 7. OC3 mooring system properties (reproduced from [68,69]).
ParameterValueUnit
Water Depth320m
Diameter—Platform Base9.4m
Diameter—Platform Top6.5m
Draft120m
Depth130m
Center of Mass below SWL−89.92m
Mass7466.33te
Moment of Inertia—pitch and row2.2 × 107te·m2
Moment of Inertia—yaw1.64 × 105te·m2
Anchor Range853.87m
Total Line Length902.2m
Line Axial Stiffness384,200kN
Table 8. OC3 linear damping matrix (reproduced from [68]).
Surge, kN/(m/s)Sway, kN/(m/s)Heave, kN/(m/s)Roll, kNm/(rad/s)Pitch, kNm/(rad/s)Yaw, kNm/(rad/s)
10000000
01000000
00130000
000000
000000
0000013,000
Table 9. OC3 restoring force matrix (reproduced from [68]).
Surge,
kN/m
Sway,
kN/m
Heave, kN/mRoll,
kN/rad
Pitch,
kNm/(rad/s)
Yaw,
kNm/(rad/s)
41.18000−28210
041.180282100
0011.94000
028160311,10000
−2816000311,1000
0000011,560
Table 10. VolturnUS platform key properties (reproduced from [56]).
ParameterValueUnits
Displacement20,206m3
Hull Steel Mass3914te
Draft20m
Freeboard15m
VCG from SWL−14.94m
VCB from SWL−13.63m
Roll Inertia about CoG1.251 × 1010Kg·m2
Pitch Inertia about CoG1.251 × 1010Kg·m2
Yaw Inertia about CoG2.367 × 1010Kg·m2
Table 11. Original proposed mooring setup (reproduced from [56]).
ParameterValueUnit
No. of Lines3-
Line TypeAll Chain-
-Chain GradeR3 Studless-
-Chain Size185mm
-Chain MBL2272te
Total Line Payout850m
Pretension248te
Drag Coefficient, Normal2.6-
Drag Coefficient, Axial1.4-
Added Mass Coefficient, Normal1.0-
Added Mass Coefficient, Axial0.5-
Table 12. DNV partial safety factors (adapted from [74]).
Limit StatePartial Load FactorConsequence Class 1Consequence Class 2
ULSγmean1.31.5
ULSγdyn1.752.2
Table 13. ABS safety factors.
Line ComponentRedundancyConditionSafety Factor
SteelRedundancyIntact1.67
Non-redundancy2.0
Fiber RopeRedundancy1.82
Non-redundancy1.82 × 1.2
Table 14. Analysis output and threshold selection.
Case IDNo.
of Peaks
3 h Return Level,
kN
Mean Tension, kNStd. Dev. Tension, kNDynamic Tension, kNUtilization
DNVBVABS
LC01423239.32894.397.2345.00.240.290.29
LC02422820.92511.979.5309.00.210.250.25
LC03422048.81841.557.6207.30.170.200.20
LC04421959.41715.156.5244.20.160.190.19
LC05422595.11489.8224.41105.40.220.250.23
LC06421963.41248.3154.7715.10.160.190.18
LC07422307.61488.5190.8819.00.190.220.21
LC08421821.61242.5127.8579.10.150.180.16
LC09421455.4810.7125.3644.70.140.140.14
LC10421696.8976.8149.1720.00.160.170.17
LC11421299.6809.3102.5490.30.120.130.13
LC12421526.5969.0120.5557.60.140.150.15
LC13328885.25091.8750.73793.50.750.800.78
LC14326529.74282.4406.62247.40.540.590.57
LC15324899.62946.0384.41953.60.450.480.48
LC16324471.22783.3311.21687.90.410.440.44
LC173211,240.43941.31654.17299.01.041.090.99
LC18327309.03389.3855.93919.70.650.710.64
LC19329546.63941.51311.25605.10.860.930.84
LC20326430.63361.2704.03069.40.560.620.57
LC21326727.12128.0987.44599.10.670.660.66
LC22326572.42669.5890.33902.90.640.650.65
LC23325726.82123.3803.33603.50.560.560.56
LC24325628.72643.3710.92985.40.540.550.55
Disclaimer/Publisher’s Note: The statements, opinions and data contained in all publications are solely those of the individual author(s) and contributor(s) and not of MDPI and/or the editor(s). MDPI and/or the editor(s) disclaim responsibility for any injury to people or property resulting from any ideas, methods, instructions or products referred to in the content.