Article

Focal Mechanism of 2020–2025 Mw > 5.0 Earthquake Sequence in Bárðarbunga Volcanic Zone, Iceland, and Its Implications for Magma Inflow Activity

1
College of Oceanography, Hohai University, Nanjing 210098, China
2
Institute of Geology and Geophysics, Chinese Academy of Sciences, Beijing 100029, China
3
Shanghai Earthquake Agency, Shanghai 200062, China
4
Shanghai Sheshan National Geophysical Observatory, Shanghai 200062, China
*
Author to whom correspondence should be addressed.
J. Mar. Sci. Eng. 2025, 13(11), 2172; https://doi.org/10.3390/jmse13112172
Submission received: 26 October 2025 / Revised: 11 November 2025 / Accepted: 14 November 2025 / Published: 17 November 2025
(This article belongs to the Special Issue Advances in Ocean Plate Motion and Seismic Research)

Abstract

Iceland is an emergent segment of the Mid-Atlantic Ridge, and the Bárðarbunga volcano lies in central Iceland beneath the Vatnajökull glacier, the largest glacier in Europe. Geodetic and seismic observations indicate persistent post-eruptive inflation since the 2014–2015 intense volcanic eruption at Bárðarbunga, revealing ongoing subsurface magmatic activity. To investigate details of the magma inflow process and monitor possible volcanic eruption, we studied focal mechanisms of seven earthquakes (with moment magnitude Mw > 5.0) that occurred from 2020 to 2025 in the Bárðarbunga volcanic zone, using the generalized Cut and Paste (gCAP) moment tensor inversion method. All inversions were checked and examined using the bootstrap uncertainty analysis. According to the results, all seven events exhibit significant positive non-double-couple components (35–58%), with centroid depths ranging from 3 to 9 km, within the typical brittle–ductile transition zone in Iceland. Our results correspond with the GNSS deformation data and the focal mechanism study of previous earthquakes at Bárðarbunga. We also find that focal mechanisms in the Bárðarbunga volcano region may vary with depth: shallow (≤7 km) events result from magma chamber pressurization or tensile fracturing due to magma intrusion, and deep (~9 km) activity reflects magma emplacement or overpressure accumulation.

1. Introduction

Iceland is an emergent segment of the Mid-Atlantic Ridge formed by the superposition of the spreading ridge axis and the Icelandic hotspot. This unique geological setting fosters interaction between tectonic and volcanic processes, which are manifested at the Earth’s surface as volcano-tectonic systems composed of central volcanoes, long eruptive and non-eruptive fissures, and faults [1,2,3]. The Bárðarbunga volcano system lies on the boundary between the North Volcanic Zone (NVZ) and the Eastern Volcanic Zone (EVZ) in central Iceland (Figure 1), and consists of the central volcano of Bárðarbunga and two transecting fissures, extending approximately 115 km to the southwest and 55 km to the northeast [4]. The system spans roughly 190 km along-strike and 25 km in width, and lies at the boundary between the North American plate and the Eurasian plate, beneath the Vatnajokull glacier (the largest glacier in Europe), representing one of several major glacial volcanoes situated above the Icelandic hotspot center [5,6,7,8].
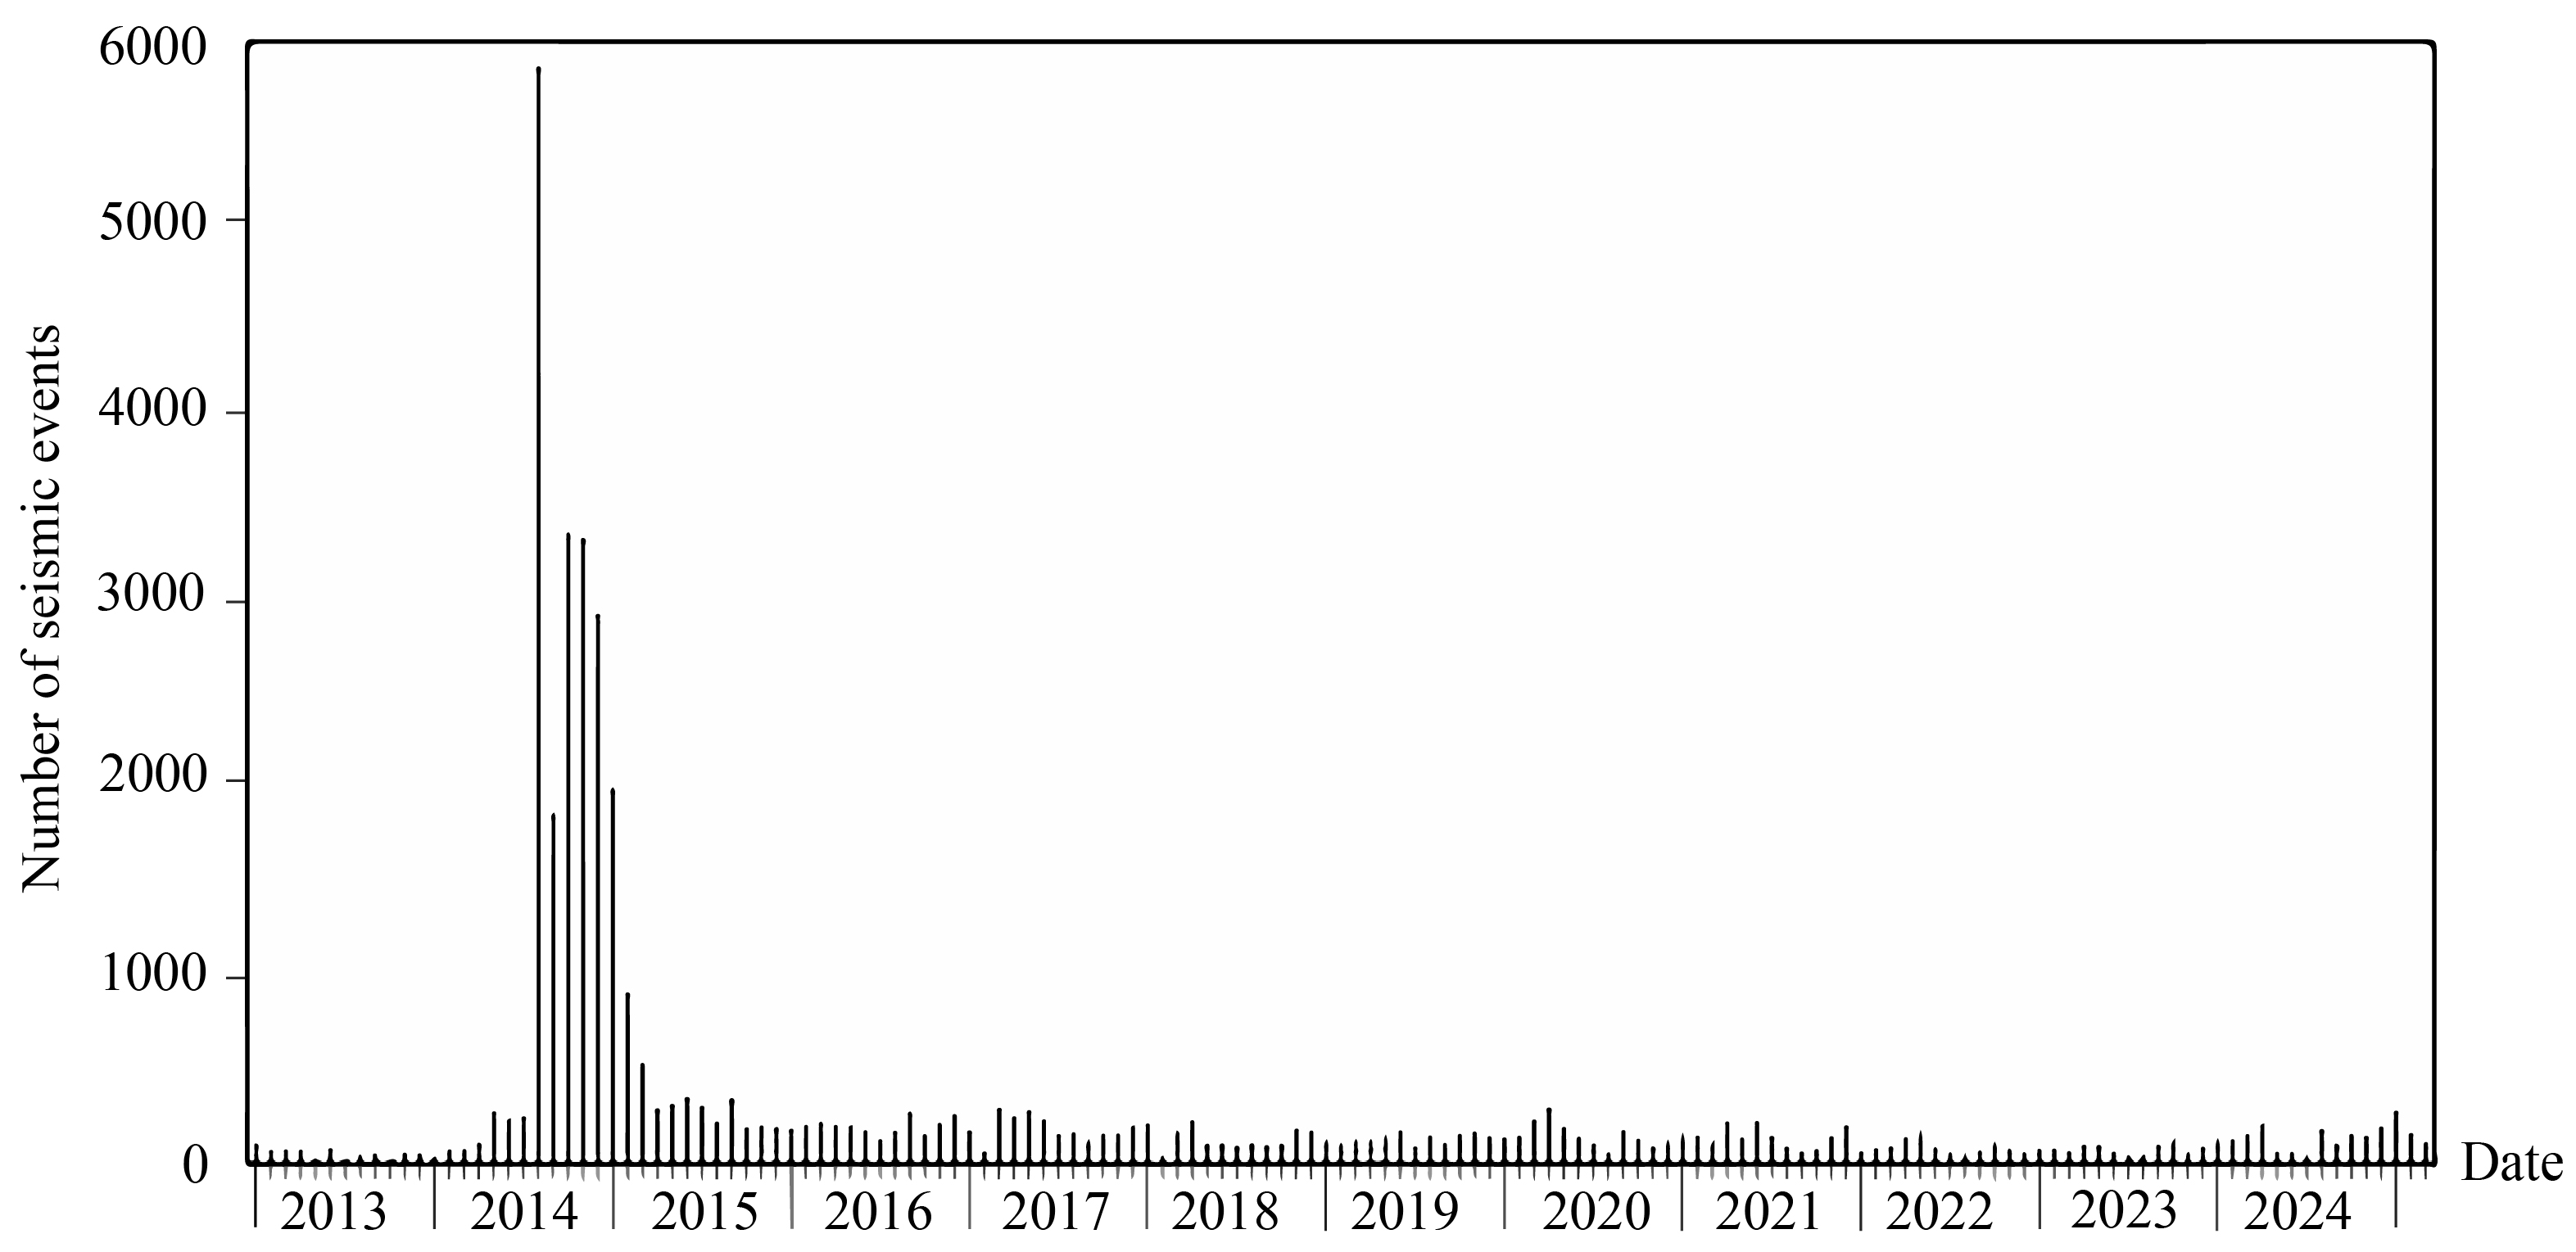
The Bárðarbunga volcanic system has been historically active, with more than 26 eruptions documented over the past 11 centuries [14]. The most recent eruption, which occurred between August 2014 and February 2015, lasted six months and was the largest volcanic event in Europe in the past 250 years [7,15]. It produced one of the most severe and widespread volcanic air pollution episodes in recent centuries [16], accompanied by tens of thousands of earthquakes (Figure 2, [14]). Geodetic and seismic observations indicate that Bárðarbunga volcano has been inflating since 2015, a process that may continue for decades even in the absence of eruptive activity [4,17]. On 14 January 2025, 130 earthquakes, including several events with magnitude M > 3, occurred near the northwest crater of Bárðarbunga volcano [18]. Due to this earthquake swarm, the Icelandic Meteorological Office (IMO) elevated the aviation color code for Bárðarbunga to the yellow level (which means the volcano exhibits elevated unrest above known background levels) [19]. Notably, similar precursory seismicity was observed before the 2014 Bárðarbunga eruption [19].
Typically, when magma and volcanic gas migrate upward through cracks and channels, the seismic activity before volcanic eruption tends to intensify. This rising process can cause rock fracture or induce vibration along pre-existing and newly formed magma channels, thus causing earthquakes [20,21]. Focal mechanism of volcanic earthquakes is helpful to understand the magmatic activity and pre-eruption process inside the volcano or crust, as well as the seismicity origin, providing a basis for the prevention and control of volcanic disasters [22,23].
Figure 2. Number of seismic events in the Bárðarbunga volcano region from 2013 to 2025 [24].
Jmse 13 02172 g002
Most natural seismic focal mechanism study assume a shear faulting source (corresponding to Double-Couple (DC) mechanism) [25]. Improved data quality and denser seismic networks enable moment tensor inversions [26]. Previous studies of volcanic and geothermal earthquakes have identified significant Non-Double-Couple (NDC) components in focal mechanisms [25,27,28,29,30,31,32]. In volcanic-tectonic environments like Iceland, NDC components may occur more frequently [8,22,33,34,35]. Quantifying these NDC components is essential for (1) understanding the physical processes during volcanic eruptions and (2) constraining fault zone seismic anisotropy [35]. Generally, the full moment tensor can be decomposed into DC, isotropic (ISO) and compensated linear vector dipole (CLVD) components [28,36,37,38].
However, resolving NDC components remains a significant challenge for practical earthquake source analysis, primarily due to the following reasons: (1) In most cases, DC mechanisms can adequately explain both regional and teleseismic waveforms, making it challenging to constrain NDC components through focal mechanism inversion; (2) The available seismic constraints or inversion algorithms are incapable of addressing the spatiotemporal separation of DC components, complex earthquake ruptures may introduce apparent CLVD artifacts into the moment tensor solution [35].
Most previous studies on the Bárðarbunga volcanic seismicity focus on the 2014–2015 swarm events, whereas seismic research on the 2015–2025 earthquakes remains limited. Recent observations indicate that Bárðarbunga volcano has been inflating since the 2014–2015 eruption, and seismicity is an important indicator for volcanic unrest. To investigate details of the magma inflow process and monitor possible volcanic eruption, we perform focal mechanism inversion of seven Bárðarbunga earthquakes (with moment magnitude Mw > 5.0) in 2020–2025 (Table 1; [39,40]). We analyze recent geological processes at Bárðarbunga by comparing focal mechanism inversion results with the GNSS deformation data and the previous seismic research.

2. Data and Methods

Broadband seismic waveforms for the seven target earthquakes were retrieved from IMO [18] and the Incorporated Research Institutions for Seismology (IRIS) data center [41]. During inversion, near-field stations within Iceland were used in priority. To improve azimuth coverage and enhance inversion robustness, additional stations with high quality three-component data within an epicentral distance of 15° were incorporated (detailed information about the stations are listed in Table S1 in Supplemental Materials). A minimum of eight stations was ensured for each event. Locations of the selected earthquakes and seismic stations are shown in Figure 3. Owing to the predominantly oceanic setting to the northeast and southwest of Iceland, seismic station distribution is inherently uneven, with the majority aligned along a northwest–southeast orientation on land.
During calculation, synthetic seismograms were generated using the generalized reflection-transmission coefficient matrix and frequency-wavenumber (F-K) method [42,43]. Focal mechanism solutions were obtained using the gCAP method [44], which extends the original CAP method [45,46]. Compared to the CAP method, which is restricted to DC source inversions, the gCAP method allows for the inclusion of NDC components. For the gCAP method, the seismic moment tensor Mij is re-parameterized, and the three-component seismograms are divided into two segments: (1) Pnl phase (P wave and subsequent seismic phases) and (2) S wave (or surface wave). Weights are assigned to each segment to minimize the misfit function calculated by comparing observed and synthetic waveforms [44]. By allowing time shifts between observed and synthetic arrivals, the method reduces sensitivity to velocity model inaccuracies and hypocenter location errors, thus improving the robustness of the focal mechanism solutions [47,48]. The quality of the inversion results was evaluated based on the variance reduction (VR) value [49,50,51]:
V R = 1 i ( d i s i ) 2 i d i 2 × 100 % ,
where d i and s i represent the observed and synthetic waveforms, respectively, and the index i denotes the station component. A VR value close to 100% suggests an excellent match between the synthetic and observed waveforms.
In data processing, we timed the seismograms from 2 min before to 10 min after the origin time, removed the instrument response, and rotated the data into radial, transverse, and vertical components. Following Rodríguez-Cardozo et al. [34], a bandpass filter of 20–50 s was applied separately to the Pnl and S waves, and the ISO component was set to zero during inversion (i.e., the deviatoric moment tensor inversion). Three velocity models were tested for inversion: the regional P wave velocity model of the Icelandic crust and upper mantle [52], the crustal structure beneath the northwestern fjords of Iceland [53], and the global CRUST1.0 model [54]. The inversion results demonstrated negligible differences among these models. Therefore, the CRUST1.0 model was adopted for this study. It is an enhanced version of the earlier CRUST5.1 (5° × 5° resolution) and CRUST2.0 (2° × 2° resolution) models, providing one of the most detailed global crustal models currently available, with improved resolution and crustal property estimates derived from geological, geophysical, and laboratory constraints [55,56].

3. Results

Locations of the selected events were precisely determined using the Hypoinverse absolute location method [57], yielding similar latitude and longitude results to those reported by IMO [18]; therefore, the IMO-reported horizontal locations were adopted. We performed inversions over a source depth range of 1–15 km with an interval of 1 km, and used the depth with the highest VR value as the optimized source depth. To account for potential velocity model errors, a time shift of ±6 s between observed and synthetic seismograms was allowed at each depth, with larger shifts permitted for individual waveforms when necessary. These time shifts were adjusted according to synthetic P wave arrival times calculated with the TauP toolkit [58], which is a commonly used seismic travel time calculator based on the method of Buland and Chapman [59] that works in the delay time (τ)-ray parameter (p) domain.
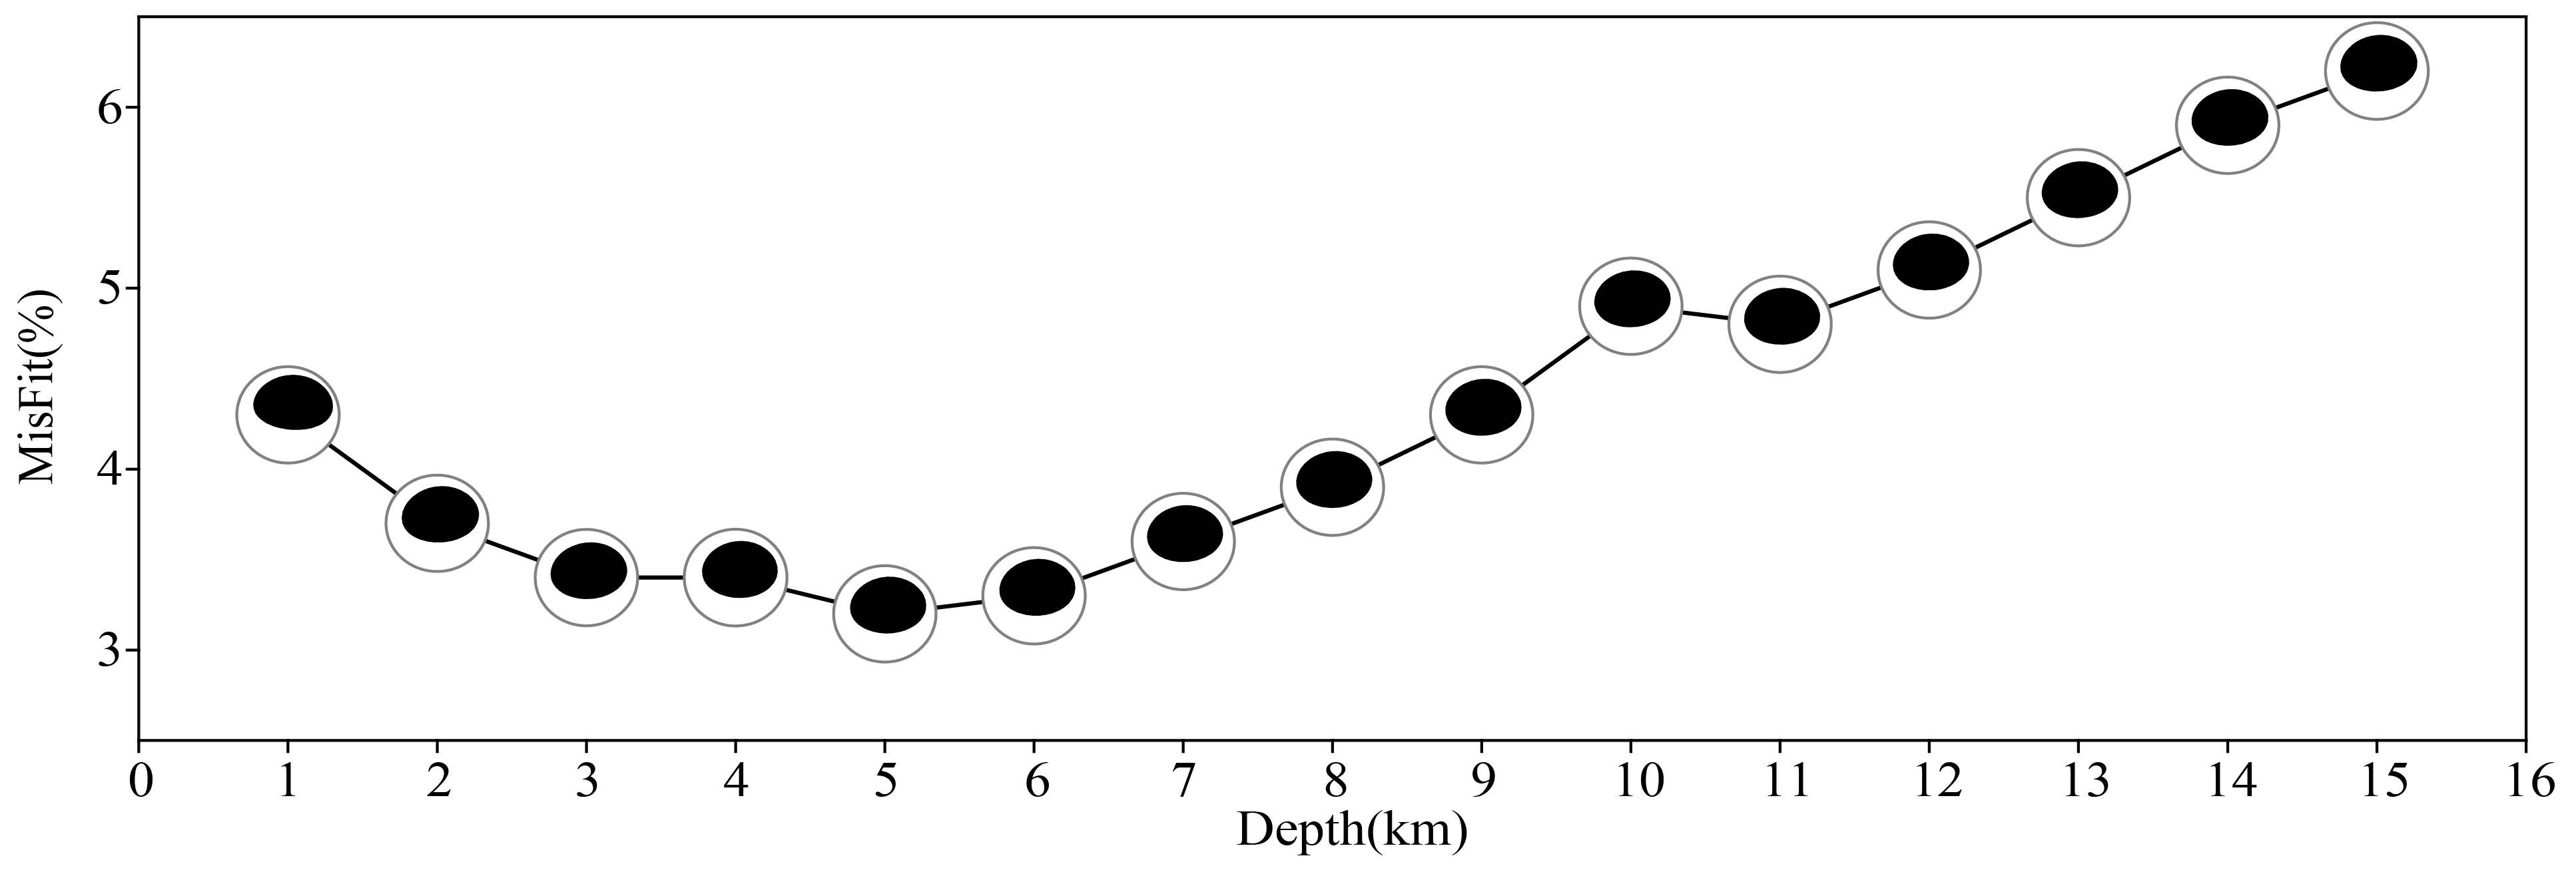
We determined moment tensors for the seven selected earthquakes at Bárðarbunga (Table 1, Figure 3), discarding solutions with a poor fit between observed and synthetic seismograms (VR < 60%). Here, we present the result of the Mw 5.2 earthquake on 24 October 2023 for example. For this inversion, broadband waveforms from 13 stations within 15° epicentral distance were selected. After excluding components with variance reduction (VR) below 60%, a total of 53 waveforms were retained for the inversion. The minimum misfit occurred at a depth of 5 km, and a total number of 44 waveform components achieved cross-correlation coefficients greater than 0.9 and the overall VR value is 96.8% (Figure 4). Moment tensor decomposition reveals 48% DC and 52% CLVD components. The optimal focal mechanism solutions at different centroid depths and the corresponding misfit variations are shown in Figure 5.
Bootstrap uncertainty analysis was conducted by randomly selecting eleven or twelve stations out of thirteen. The deviations in strike, dip, and rake angles were mostly within 15°, and percentage errors for the CLVD and DC components were within 15% (Figure 6), validating the robustness of the inversion results. Meanwhile, we also evaluate the inversion results when adding noise to the observed data (refer to Hrubcová et al. [60,61,62]). Specifically, noise data from background records with levels of 10~25% were added. Errors in P (pressure) and T (tensile) axes solutions, derived from noise-contaminated inversions, are within 5° and 6°, respectively (shown in Table S2 in Supplemental Materials).
Inversion results for the remaining six events are provided in the Supplementary Material to this article. According to the results, the optimal centroid depths are 6–9 km, with VR values ranging from 76.5–89.3%. The corresponding misfit-depth curves, focal mechanism solutions, and bootstrap uncertainty statistics are shown in Figures S1–S18 (Supplemental Materials). All the inversion results of seven events are listed in Table 2.

4. Discussion

4.1. Isotropic Component

For the moment tensors presented in this study, the isotropic (ISO) component was constrained to zero for the following reasons [34,37]: (1) the 1D velocity model used is insufficient to accurately represent Iceland’s complex 3D structure; (2) the volumetric components of the moment tensor (Mxx, Myy, Mzz) exhibit low sensitivity to variations in station azimuth; (3) and for long-period events with source depths shallower than 11 km, the resolution of these volumetric components deteriorates significantly. Given that all events analyzed in this study occurred at depths shallower than 10 km, the isotropic component may not be reliably resolved and was therefore fixed at zero.

4.2. Possible Non-Double-Couple Mechanisms

Earthquakes exhibiting significant non-double-couple (non-DC) components are commonly associated with fluid migration, complex fault geometries, volumetric deformation, tensile faulting, and heterogeneities/anisotropies in the surrounding medium [26,28]. In volcanic settings, non-DC components often arise from transient fluid transport, shear faulting along ring structures, or tensile faulting coexisting with shear slip, and the most widely accepted interpretations are: (1) tensile crack opening induced by the injection of overpressurized fluids or magma, and (2) fault complexity, whereby individual events may comprise multiple smaller double-couple sources [23,28].
Bárðarbunga volcano, located beneath the Vatnajökull glacier together with the adjacent Grímsvötn volcano, forms one of the most active volcanic centers in historical times. The seven 2020–2025 earthquakes in this study have Mw values of 4.9–5.4 and focal depths of 5–9 km, located within the brittle-ductile transition zone in Iceland [22], with DC components accounting for 42–65% of the total moment and positive CLVD components ranging from 35% to 58%. These results are consistent with those reported by Konstantinou et al. [23] for Bárðarbunga earthquakes in 1976–1994.
Moreover, we compared our results with those reported for other volcanic regions in Iceland. In the Reykjanes Peninsula area, Büyükakpınar et al. [63] found focal depths mostly shallower than 4 km (~3 km), which are less than those of our events (5–9 km), while their CLVD percentages (−50% to 60%) are generally consistent with ours (35–58%). In the Hengill–Grensdalur volcanic area, Julian [25] reported focal depths of 2.85–4.53 km and CLVD percentages of −70% to 90%, and Miller [64] observed source depths of 1.9–6.0 km with CLVD of −80% to 90%, both overlapping with our results. Overall, the CLVD component ranges derived in this study are consistent with previous studies of other volcanic regions in Iceland.
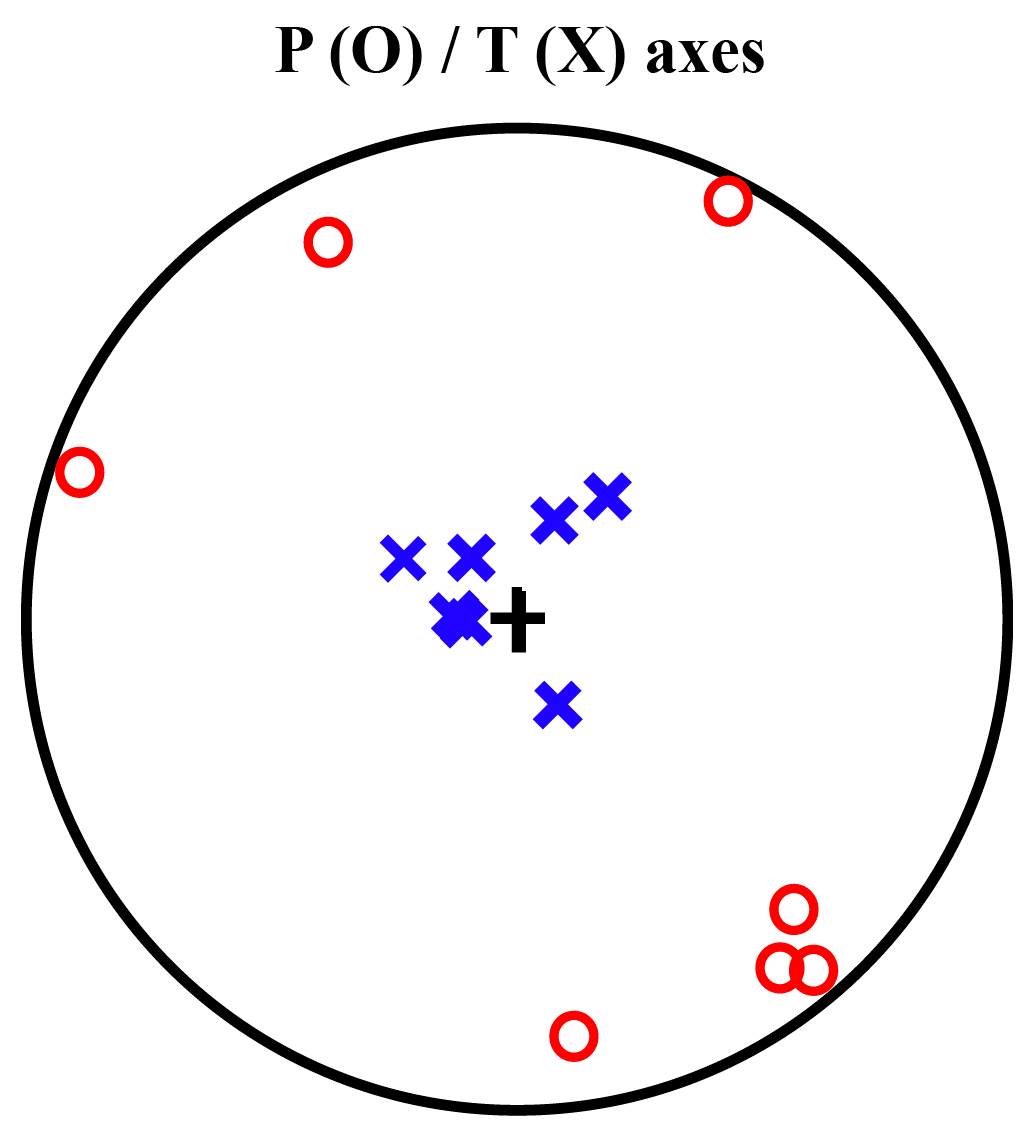
In the study, none of the analyzed events were accompanied by volcanic eruptions or other major volcanic activity, the observed NDC components may be explained by magma injection or rupture processes associated with fault geometry complexity. The P (pressure) and T (tensile) axis directions derived from the moment tensors (Figure 7) indicate that the T-axes of all seven events are concentrated near the center of the focal sphere and oriented nearly vertically. This is consistent with the findings reported by Tkalčić et al. [37]. Collectively, these observations support the interpretation that the injection of overpressurized magma induced tensile cracking, which in turn caused crustal uplift in the volcanic region.

4.3. Possible Magma Inflow Activity

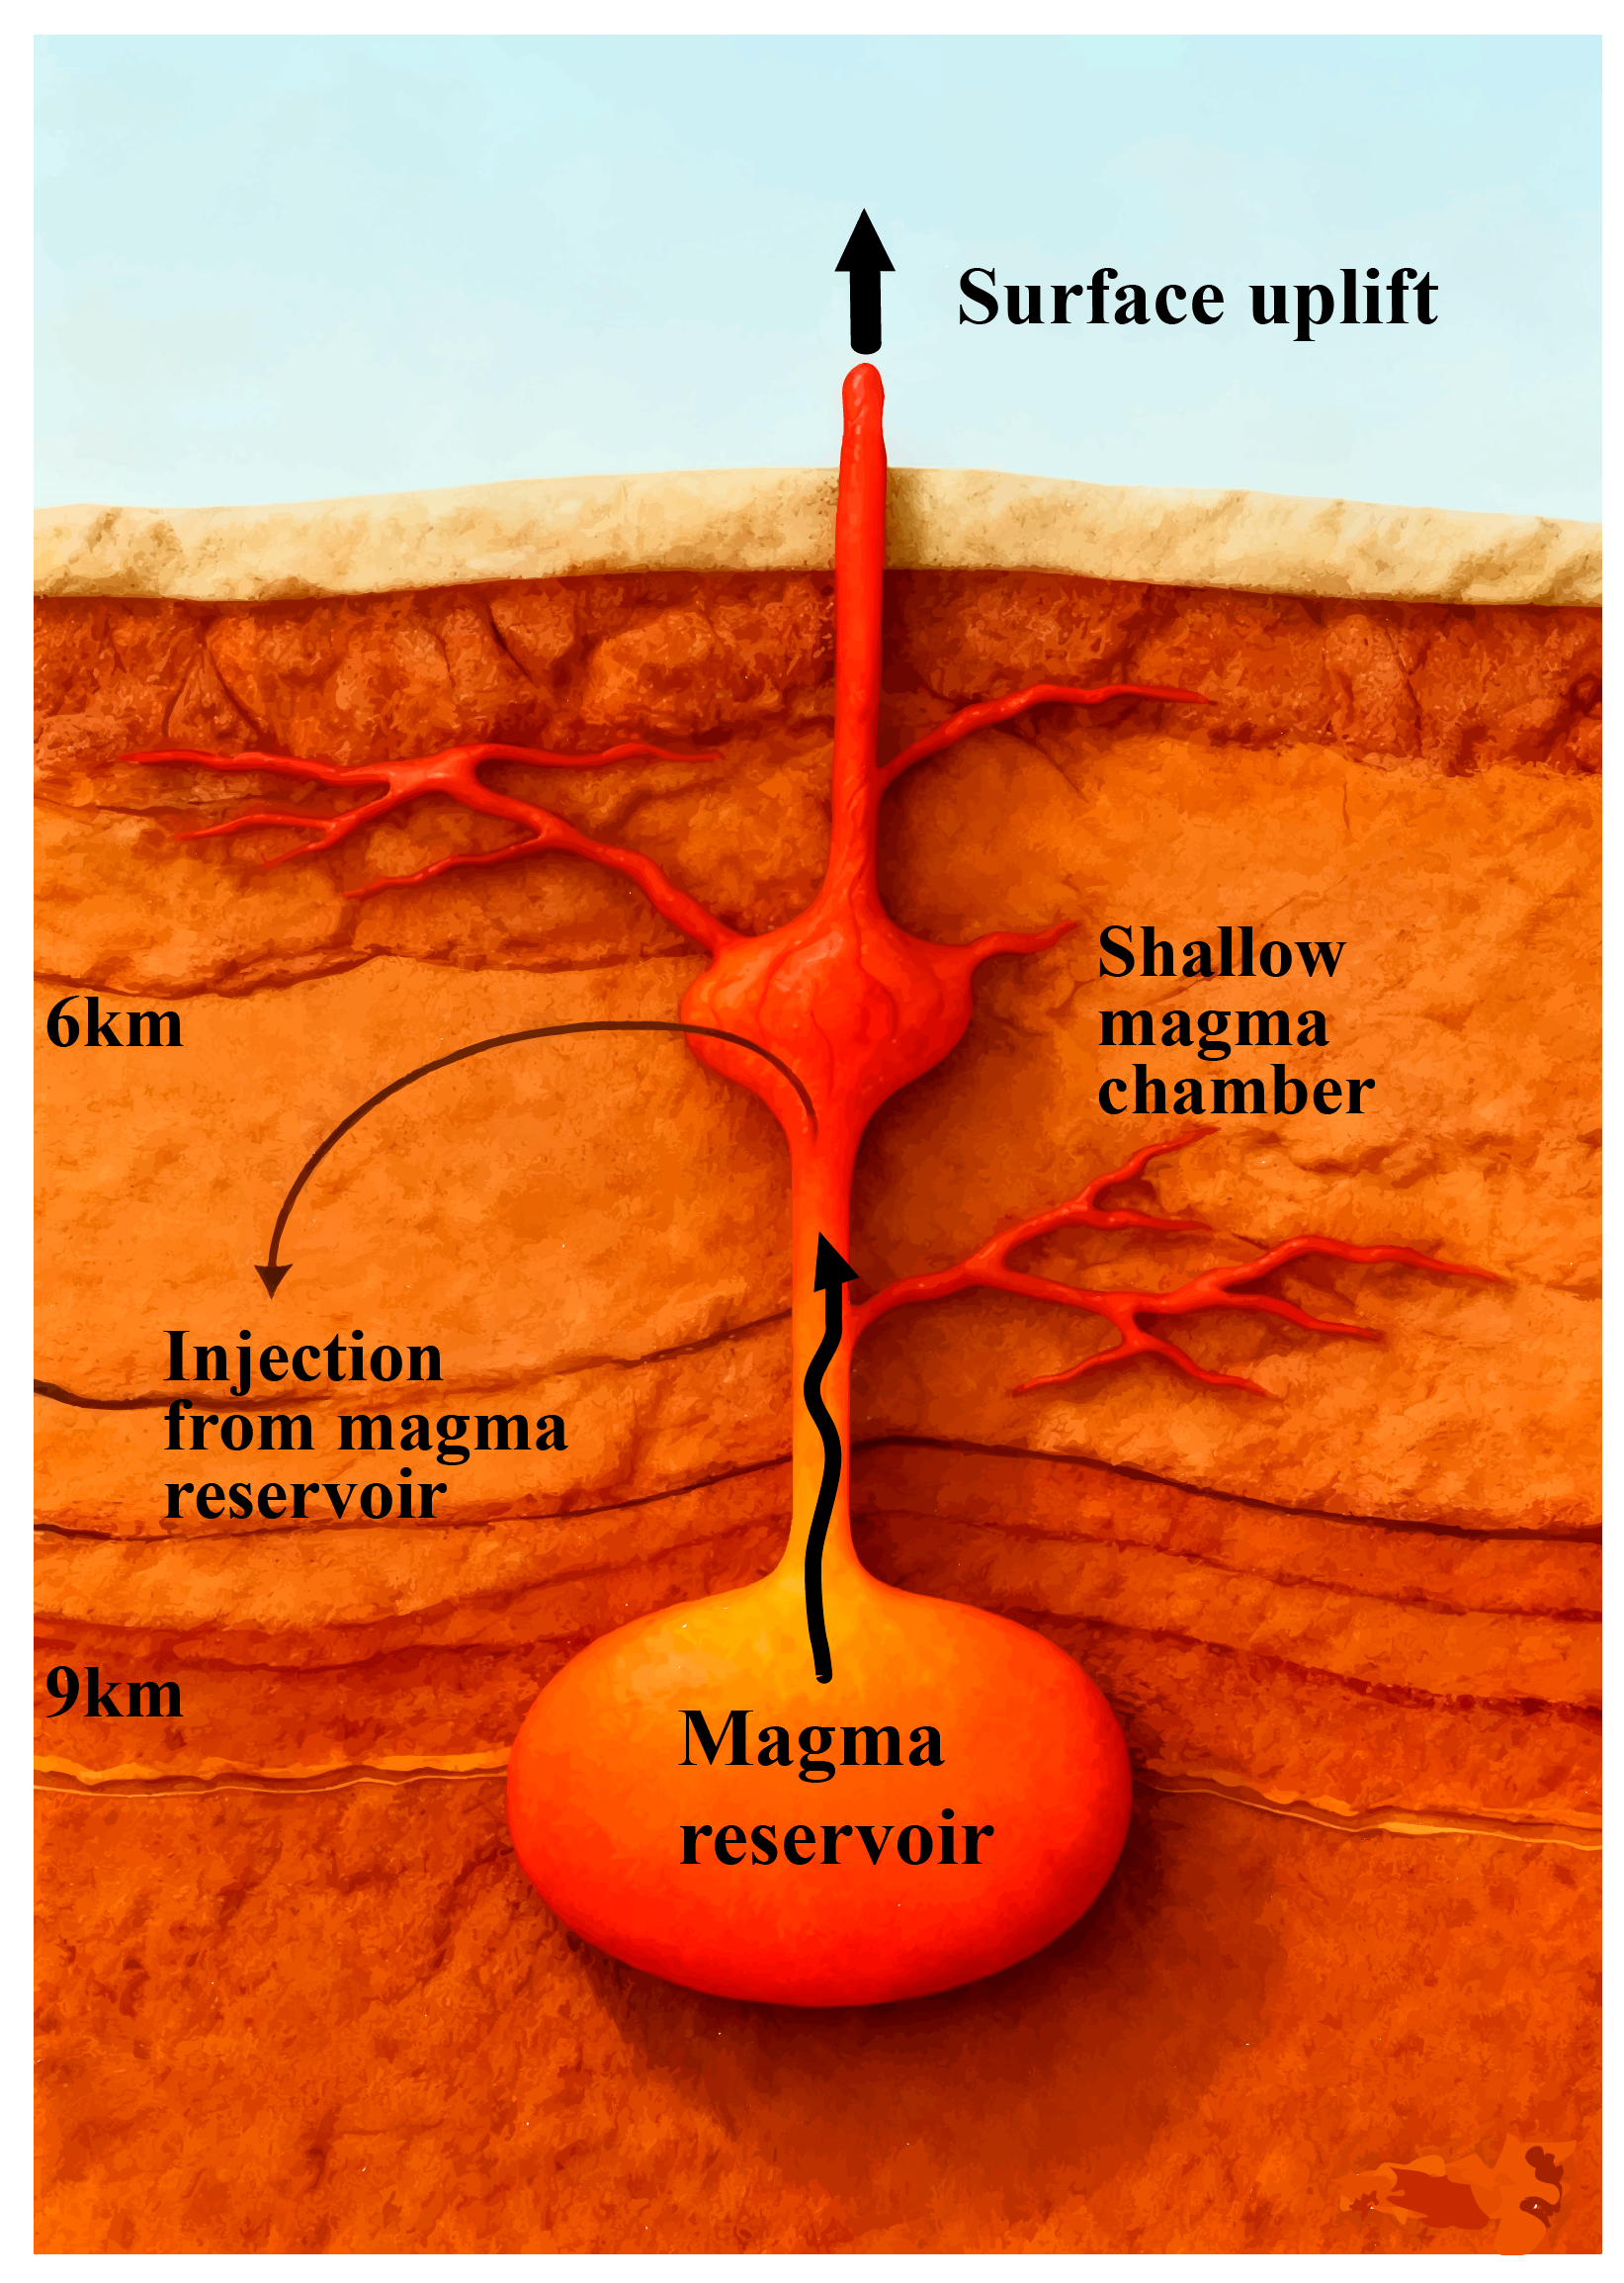
Current studies of exhumed volcanic systems suggest that most Icelandic central volcanoes comprise a shallow magma chamber at 2–6 km, filled with partially molten material and supplied by a deeper reservoir at 8–12 km through a swarm of subvertical dykes [65]. Although little is known about the detailed structure of the volcanic system beneath the Vatnajokull glacier, the depth of the shallow magma chamber is a critical parameter for our interpretation. Comparing our results with the probable location of the Bárðarbunga magma chamber [65] and the GNSS-detected surface deformation [18], we infer that the seismicity at different depths may reflect distinct magmatic processes: (1) earthquakes at depths shallower than ~7 km may be related to the opening of tensile cracks caused by magma inflow, or the failure of magma chamber roof and its surrounding rocks caused by deep magma recharge; (2) earthquake at depth of 9 km, located beneath the chamber but above the deeper reservoir, may indicate either lateral magma emplacement along ascending pathways or localized fluid overpressure that induces tensile failure (Figure 8).

5. Conclusions

We studied the focal mechanisms of seven Mw > 5.0 earthquakes in the Bárðarbunga volcanic zone, Iceland, between 2020 and 2025. Forward modeling was performed using the CRUST1.0 velocity model and the F-K method. Inversion was conducted using the gCAP deviatoric moment tensor inversion method to determine the optimal focal mechanism solutions and centroid depths. The results indicate that all seven seismic events exhibit significant positive CLVD components, ranging from 35% to 38%, with their T-axes consistently oriented in a near-vertical direction. The focal depths of these events range from 5 km to 9 km. Integrating the inferred location of the magma chamber beneath the Bárðarbunga volcano and GNSS-observed surface deformation, we interpret that all seven earthquakes were induced by magma inflow. Specifically, we infer that focal mechanisms in the Bárðarbunga volcano region may vary with depth: shallow (≤7 km) events result from magma chamber pressurization or tensile fracturing due to magma intrusion, and deep (~9 km) activity reflects magma emplacement or overpressure accumulation.
According to the focal mechanism results in this study, the Bárðarbunga volcano may be in a phase of unrest, with potential for future eruptions. Tensile fractures generated by magma inflow, particularly at shallow depths, could potentially serve as conduits for magma ascent during an eruptive event. Our study mainly focused on Mw > 5.0 earthquakes in 2020–2025 and investigate possible magma activities based on focal mechanisms of large-magnitude events. As part of our future work, we will expand the relative limited number of large earthquakes in this study to include smaller-magnitude events, in order to explore more details about the deep geological processes at Bárðarbunga. Given that volcanic eruptions are controlled by multiple factors and involve complex processes, multidisciplinary and multifaceted research is needed to fully understand the underlying mechanisms and evolutionary behavior of volcanoes.

Supplementary Materials

The following supporting information can be downloaded at: https://www.mdpi.com/article/10.3390/jmse13112172/s1, Table S1: detailed information on the stations used for the inversion of seven earthquake events. Table S2: results of the noise-contaminated inversion tests for the 24 October 2023 Mw 5.2 earthquake. Figures S1, S4, S7, S10, S13, and S16: Variation in fitting misfit with source depth for the 20 April 2020 Mw5.1, 21 February 2023 Mw5.2, 6 October 2024 Mw5.3, 14 January 2025 Mw5.2, 22 February 2025 Mw5.1, and 27 July 2025 Mw5.3 earthquakes, respectively. Figures S2, S5, S8, S11, S14, and S17: Bootstrap error statistics of subsampling tests for the six earthquakes, respectively. Figures S3, S6, S9, S12, S15, and S18: Focal mechanism inversion results for the six earthquakes, respectively.

Author Contributions

Conceptualization, B.H., H.L., X.C. and J.H.; methodology, B.H. and H.L.; validation, B.H. and H.L.; data curation, B.H. and H.L.; writing—original draft preparation, B.H.; writing—review and editing, H.L., X.C., J.H., S.Z. and Q.Y.; project administration, H.L., X.C., J.H., S.Z. and Q.Y.; funding acquisition, H.L., X.C. and J.H. All authors have read and agreed to the published version of the manuscript.

Funding

This research was funded by National Natural Science Foundation of China (42474084 and 42274075) and Shanghai Sheshan National Geophysical Observatory (SSOP202403).

Data Availability Statement

Waveforms and related metadata of the 2020–2025 Bárðarbunga sequence were downloaded through the Icelandic Meteorological Office (IMO) and the IRIS Web Services [18,41]. Some figures were drawn using the Generic Mapping Tools (GMT) software (version 6.4.0) [66]. The gCAP inversion was conducted using the open-source gCAP program developed by Lupei Zhu [67].

Conflicts of Interest

The authors declare no conflicts of interest.

References

  1. Ward, P.L. New Interpretation of the Geology of Iceland. GSA Bull. 1971, 82, 2991–3012. [Google Scholar] [CrossRef]
  2. Rojas, O.; Monterrubio-Velasco, M.; Rodríguez, J.E.; Callaghan, S.; Abril, C.; Halldorsson, B.; Kowsari, M.; Bayat, F.; Olsen, K.B.; Gabriel, A.A.; et al. Earthquake Fault Rupture Modeling and Ground-Motion Simulations for the Southwest Iceland Transform Zone Using CyberShake. Bull. Seismol. Soc. Am. 2024, 115, 69–85. [Google Scholar] [CrossRef]
  3. Sæmundsson, K. Outline of the geology of Iceland (Yfirlit um jarðfræði Íslands). Jökull 2023, 29, 7–28. [Google Scholar] [CrossRef]
  4. Li, S.; Sigmundsson, F.; Drouin, V.; Parks, M.M.; Ófeigsson, B.G.; Jónsdóttir, K.; Grapenthin, R.; Geirsson, H.; Hooper, A.; Hreinsdóttir, S. Ground Deformation After a Caldera Collapse: Contributions of Magma Inflow and Viscoelastic Response to the 2015–2018 Deformation Field Around Bárðarbunga, Iceland. J. Geophys. Res. Solid Earth 2021, 126, e2020JB020157. [Google Scholar] [CrossRef]
  5. Ágústsdóttir, T.; Woods, J.; Greenfield, T.; Green, R.G.; White, R.S.; Winder, T.; Brandsdóttir, B.; Steinthórsson, S.; Soosalu, H. Strike-slip faulting during the 2014 Bárðarbunga-Holuhraun dike intrusion, central Iceland. Geophys. Res. Lett. 2016, 43, 1495–1503. [Google Scholar] [CrossRef]
  6. Einarsson, P.; Brandsdóttir, B.; Gudmundsson, M.T.; Björnsson, H.; Grínvold, K.; Sigmundsson, F. Center of the Iceland hotspot experiences volcanic unrest. Eos Trans. Am. Geophys. Union 1997, 78, 369–375. [Google Scholar] [CrossRef]
  7. Gudmundsson, M.T.; Jónsdóttir, K.; Hooper, A.; Holohan, E.P.; Halldórsson, S.A.; Ófeigsson, B.G.; Cesca, S.; Vogfjörd, K.S.; Sigmundsson, F.; Högnadóttir, T.; et al. Gradual caldera collapse at Bárdarbunga volcano, Iceland, regulated by lateral magma outflow. Science 2016, 353, aaf8988. [Google Scholar] [CrossRef] [PubMed]
  8. Nettles, M.; Ekström, G. Faulting mechanism of anomalous earthquakes near Bárdarbunga Volcano, Iceland. J. Geophys. Res. Solid Earth 1998, 103, 17973–17983. [Google Scholar] [CrossRef]
  9. Islam, M.T.; Sturkell, E.; LaFemina, P.; Geirsson, H.; Sigmundsson, F.; Ólafsson, H. Continuous subsidence in the Thingvellir rift graben, Iceland: Geodetic observations since 1967 compared to rheological models of plate spreading. J. Geophys. Res. Solid Earth 2016, 121, 321–338. [Google Scholar] [CrossRef]
  10. Jakobsson, S.; Jónasson, K.; Sigurdsson, I. The three igneous rock series of Iceland. Jökull 2008, 58, 117–138. [Google Scholar] [CrossRef]
  11. Kahl, M.; Bali, E.; Guðfinnsson, G.H.; Neave, D.A.; Ubide, T.; van der Meer, Q.H.A.; Matthews, S. Conditions and Dynamics of Magma Storage in the Snæfellsnes Volcanic Zone, Western Iceland: Insights from the Búðahraun and Berserkjahraun Eruptions. J. Petrol. 2021, 62, egab054. [Google Scholar] [CrossRef]
  12. Matrau, R.; Klinger, Y.; Thorðarson, T.; Guðmundsdóttir, E.R.; Avşar, U.; Parisi, L.; Fittipaldi, M.; Jónsson, S. Evidence for Holocene Earthquakes along the Húsavík-Flatey Fault in North Iceland: Implications for the Seismic Behavior of Oceanic Transform Faults. Bull. Seismol. Soc. Am. 2024, 114, 1966–1993. [Google Scholar] [CrossRef]
  13. Thordarson, T.; Larsen, G. Volcanism in Iceland in historical time: Volcano types, eruption styles and eruptive history. J. Geodyn. 2007, 43, 118–152. [Google Scholar] [CrossRef]
  14. Glastonbury-Southern, E.; Winder, T.; White, R.S.; Brandsdóttir, B. Ring Fault Slip Reversal at Bárðarbunga Volcano, Iceland: Seismicity During Caldera Collapse and Re-Inflation 2014–2018. Geophys. Res. Lett. 2022, 49, e2021GL097613. [Google Scholar] [CrossRef]
  15. Sigmundsson, F.; Hooper, A.; Hreinsdóttir, S.; Vogfjörd, K.S.; Ófeigsson, B.G.; Heimisson, E.R.; Dumont, S.; Parks, M.; Spaans, K.; Gudmundsson, G.B.; et al. Segmented lateral dyke growth in a rifting event at Bárðarbunga volcanic system, Iceland. Nature 2015, 517, 191–195. [Google Scholar] [CrossRef] [PubMed]
  16. Eiriksdottir, E.S.; Galeczka, I.M.; Gislason, S.R. Continuous measurements of riverine chemical constituents reveal the environmental effect of the 2014–2015 Bárðarbunga eruption in Iceland. J. Volcanol. Geotherm. Res. 2020, 392, 106766. [Google Scholar] [CrossRef]
  17. Jónsdótti, K. Bardarbunga Volcano (Iceland): M 4.9 Quake, Continuous Inflation Since 2015. Available online: https://www.volcanodiscovery.com/bardarbunga/news.html (accessed on 10 November 2025).
  18. Icelandic Meteorological Office. Available online: https://en.vedur.is/ (accessed on 26 October 2025).
  19. Smithsonian Institution National Museum of Natural History Global Volcanism Program. Available online: https://volcano.si.edu/showreport.cfm?wvar=GVP.WVAR20250108-373030 (accessed on 5 November 2025).
  20. Bachèlery, P. Understanding the Geological History of Volcanoes: An Essential Prerequisite to Their Monitoring. In Hazards and Monitoring of Volcanic Activity 1; Wiley: Hoboken, NJ, USA, 2022; pp. 1–74. [Google Scholar] [CrossRef]
  21. Thompson, G. Seismic Monitoring of Volcanoes; Springer: Berlin/Heidelberg, Germany, 2015; pp. 1–25. [Google Scholar] [CrossRef]
  22. Hudson, T.S.; White, R.S.; Greenfield, T.; Ágústsdóttir, T.; Brisbourne, A.; Green, R.G. Deep crustal melt plumbing of Bárðarbunga volcano, Iceland. Geophys. Res. Lett. 2017, 44, 8785–8794. [Google Scholar] [CrossRef]
  23. Konstantinou, K.; Kao, H.; Lin, C.H.; Liang, W.T. Analysis of Broadband regional waveforms of the September 29, 1996 earthquake at Bardarbunga volcano, centrral Iceland. Geophys. J. Int. 2003, 154, 134–145. [Google Scholar] [CrossRef]
  24. Volcano Discovery. Available online: https://www.volcanodiscovery.com (accessed on 26 October 2025).
  25. Julian, B.R.; Miller, A.D.; Foulger, G.R. Non-double-couple earthquake mechanisms at the Hengill-Grensdalur Volcanic Complex, Southwest Iceland. Geophys. Res. Lett. 1997, 24, 743–746. [Google Scholar] [CrossRef]
  26. Li, H.; Chang, X. A review of the microseismic focal mechanism research. Sci. China Earth Sci. 2021, 64, 351–363. [Google Scholar] [CrossRef]
  27. Foulger, G.R. Hengill Triple Junction, SW Iceland 1. Tectonic Structure And The Spatial And Temporal Distribution Of Local Earthquakes. J. Geophys. Res. Solid Earth 1988, 93, 13493–13506. [Google Scholar] [CrossRef]
  28. Julian, B.; Miller, A.; Foulger, G. Non-double-couple earthquakes. 1. Theory. Rev. Geophys. 1998, 36, 525–549. [Google Scholar] [CrossRef]
  29. Julian, B.; Foulger, G. Non-Double-Couple Earthquake Mechanisms. 2009. Available online: https://www.researchgate.net/publication/228836707_Non-Double-Couple_Earthquake_Mechanisms (accessed on 13 November 2025).
  30. Miller, A.D.; Foulger, G.R.; Julian, B.R. Non-double-couple earthquakes 2. Observations. Rev. Geophys. 1998, 36, 551–568. [Google Scholar] [CrossRef]
  31. Rösler, B.; Spencer, B.D.; Stein, S. Which Global Moment Tensor Catalog Provides the Most Precise Non-Double-Couple Components? Seismol. Res. Lett. 2024, 95, 2444–2451. [Google Scholar] [CrossRef]
  32. Rösler, B.; Stein, S. Consistency of Non-Double-Couple Components of Seismic Moment Tensors with Earthquake Magnitude and Mechanism. Seismol. Res. Lett. 2022, 93, 1510–1523. [Google Scholar] [CrossRef]
  33. Oliva, S.J.; Ebinger, C.J.; Wauthier, C.; Muirhead, J.D.; Roecker, S.W.; Rivalta, E.; Heimann, S. Insights Into Fault-Magma Interactions in an Early-Stage Continental Rift From Source Mechanisms and Correlated Volcano-Tectonic Earthquakes. Geophys. Res. Lett. 2019, 46, 2065–2074. [Google Scholar] [CrossRef]
  34. Rodríguez-Cardozo, F.; Hjörleifsdóttir, V.; Jónsdóttir, K.; Iglesias, A.; Franco, S.I.; Geirsson, H.; Trujillo-Castrillón, N.; Hensch, M. The 2014–2015 complex collapse of the Bárðarbunga caldera, Iceland, revealed by seismic moment tensors. J. Volcanol. Geotherm. Res. 2021, 416, 107275. [Google Scholar] [CrossRef]
  35. Xu, Y.; Wen, L. Non-Double-Couple Components of Seismic Source: Method and Application to the 2014–2015 Bárðarbunga Volcanic Event Sequence, Iceland. J. Geophys. Res. Solid Earth 2024, 129, e2023JB028592. [Google Scholar] [CrossRef]
  36. Knopoff, L.; Randall, M.J. The compensated linear-vector dipole: A possible mechanism for deep earthquakes. J. Geophys. Res. 1970, 75, 4957–4963. [Google Scholar] [CrossRef]
  37. Tkalčić, H.; Dreger, D.S.; Foulger, G.R.; Julian, B.R. The Puzzle of the 1996 Bárdarbunga, Iceland, Earthquake: No Volumetric Component in the Source Mechanism. Bull. Seismol. Soc. Am. 2009, 99, 3077–3085. [Google Scholar] [CrossRef]
  38. Vavryčuk, V. Moment tensor decompositions revisited. J. Seismolog. 2014, 19, 231–252. [Google Scholar] [CrossRef]
  39. NSF Seismological Facility for the Advancement of Geoscience (SAGE). Available online: https://ds.iris.edu/wilber3/find_event (accessed on 26 October 2025).
  40. GEOFON and EIDA Data Archives. Available online: http://eida.gfz.de/webdc3/ (accessed on 26 October 2025).
  41. Incorporated Research Institutions for Seismology. Available online: https://ds.iris.edu/wilber3/ (accessed on 26 October 2025).
  42. Zhu, L.; Rivera, L.A. A note on the dynamic and static displacements from a point source in multilayered media. Geophys. J. Int. 2002, 148, 619–627. [Google Scholar] [CrossRef]
  43. Yao, Z.X.; Harkrider, D.G. A generalized reflection-transmission coefficient matrix and discrete wavenumber method for synthetic seismograms. Bull. Seismol. Soc. Am. 1983, 73, 1685–1699. [Google Scholar]
  44. Zhu, L.; Ben-Zion, Y. Parametrization of general seismic potency and moment tensors for source inversion of seismic waveform data. Geophys. J. Int. 2013, 194, 839–843. [Google Scholar] [CrossRef]
  45. Zhao, L.-S.; Helmberger, D. Source Estimation from Broad-Band Regional Seismograms. Bull. Seismol. Soc. Am. 1994, 84, 91–104. [Google Scholar]
  46. Zhu, L.; Helmberger, D.V. Advancement in source estimation techniques using broadband regional seismograms. Bull. Seismol. Soc. Am. 1996, 86, 1634–1641. [Google Scholar] [CrossRef]
  47. Luo, Y.; Zhao, L.; Zeng, X.; Gao, Y. Focal mechanisms of the Lushan earthquake sequence and spatial variation of the stress field. Sci. China Earth Sci. 2015, 58, 1148–1158. [Google Scholar] [CrossRef]
  48. Yi, G.X.; Long, F.; Zhang, Z.W. Spatial and temporal variation of focal mechanisms for aftershocks of the 2008 MS8.0 Wenchuan earthquake. Chin. J. Geophys. 2012, 55, 1213–1227. (In Chinese) [Google Scholar] [CrossRef]
  49. Li, H.; Chang, X.; Hao, J. Hydraulic Fracturing Shear/Tensile/Compressive Crack Investigation Using Microseismic Data. Remote Sens. 2024, 16, 1902. [Google Scholar] [CrossRef]
  50. Chiang, A.; Ichinose, G.A.; Dreger, D.S.; Ford, S.R.; Matzel, E.M.; Myers, S.C.; Walter, W.R. Moment Tensor Source-Type Analysis for the Democratic People’s Republic of Korea–Declared Nuclear Explosions (2006–2017) and 3 September 2017 Collapse Event. Seismol. Res. Lett. 2018, 89, 2152–2165. [Google Scholar] [CrossRef]
  51. Křížová, D.; Málek, J. Focal Mechanisms of West Bohemia, Central Europe, Earthquakes—End of May 2014: Evidence of Volume Changes. Seismol. Res. Lett. 2021, 92, 3398–3415. [Google Scholar] [CrossRef]
  52. Yang, T.; Shen, Y. P-wave velocity structure of the crust and uppermost mantle beneath Iceland from local earthquake tomography. Earth Planet. Sci. Lett. 2005, 235, 597–609. [Google Scholar] [CrossRef]
  53. Du, Z.J.; Foulger, G.R. The crustal structure beneath the northwest fjords, Iceland, from receiver functions and surface waves. Geophys. J. Int. 1999, 139, 419–432. [Google Scholar] [CrossRef]
  54. Laske, G.; Masters, G.; Ma, Z.; Pasyanos, M.E. Update on CRUST1.0—A 1-Degree Global Model of Earth’s Crust. 2013. Available online: http://www.meetingorganizer.copernicus.org/EGU2013/EGU2013-2658.pdf (accessed on 13 November 2025).
  55. Zhu, L.-F.; Pan, X.; Sun, J.-Z. Visualization and dissemination of global crustal models on virtual globes. Comput. Geosci. 2016, 90, 34–40. [Google Scholar] [CrossRef]
  56. Luo, F.; Yan, J.Y.; Fu, G.M.; Luo, L.; Tao, X.; Wang, H. Crust 1. 0 crustal model and its application: An example fromMiddle- Lower Yangtze Metallogenic Belt. Acta Geol. Sin. 2020, 94, 648–660. [Google Scholar] [CrossRef]
  57. Klein, F.W. User’s Guide to HYPOINVERSE-2000, a Fortran Program to Solve for Earthquake Locations and Magnitudes; 2002-171; US Geological Survey: Herndon, VA, USA, 2002; p. 123.
  58. Crotwell, H.P.; Owens, T.J.; Ritsema, J. The TauP Toolkit: Flexible Seismic Travel-time and Ray-path Utilities. Seismol. Res. Lett. 1999, 70, 154–160. [Google Scholar] [CrossRef]
  59. Buland, R.; Chapman, C.H. The computation of seismic travel times. Bull. Seismol. Soc. Am. 1983, 73, 1271–1302. [Google Scholar]
  60. Hrubcová, P.; Doubravová, J.; Vavryčuk, V. Non-double-couple earthquakes in 2017 swarm in Reykjanes Peninsula, SW Iceland: Sensitive indicator of volcano-tectonic movements at slow-spreading rift. Earth Planet. Sci. Lett. 2021, 563, 116875. [Google Scholar] [CrossRef]
  61. Hrubcová, P.; Vavryčuk, V. Tectonic stress changes related to plate spreading prior to the 2021 Fagradalsfjall eruption in SW Iceland. Tectonophysics 2023, 851, 229761. [Google Scholar] [CrossRef]
  62. Hrubcová, P.; Vavryčuk, V.; Fischer, T.; Doubravová, J. Stress variations and non-shear earthquakes before the 2021 Iceland eruption trace magmatic fluid flow. Commun. Earth Environ. 2025, 6, 575. [Google Scholar] [CrossRef]
  63. Büyükakpınar, P.; Isken, M.P.; Heimann, S.; Dahm, T.; Kühn, D.; Starke, J.; López Comino, J.Á.; Cesca, S.; Doubravová, J.; Gudnason, E.Á.; et al. Understanding the Seismic Signature of Transtensional Opening in the Reykjanes Peninsula Rift Zone, SW Iceland. J. Geophys. Res. Solid Earth 2025, 130, e2024JB029566. [Google Scholar] [CrossRef]
  64. Miller, A.D.; Julian, B.R.; Foulger, G.R. Three-dimensional seismic structure and moment tensors of non-double-couple earthquakes at the Hengill–Grensdalur volcanic complex, Iceland. Geophys. J. Int. 1998, 133, 309–325. [Google Scholar] [CrossRef]
  65. Gudmundsson, A. Infrastructure and mechanics of volcanic systems in Iceland. J. Volcanol. Geotherm. Res. 1995, 64, 1–22. [Google Scholar] [CrossRef]
  66. Wessel, P.; Luis, J.F.; Uieda, L.; Scharroo, R.; Wobbe, F.; Smith, W.H.F.; Tian, D. The Generic Mapping Tools Version 6. Geochem. Geophys. Geosyst. 2019, 20, 5556–5564. [Google Scholar] [CrossRef]
  67. Lupei Zhu’s Home Page. Available online: https://www.eas.slu.edu/People/LZhu/home.html (accessed on 26 October 2025).
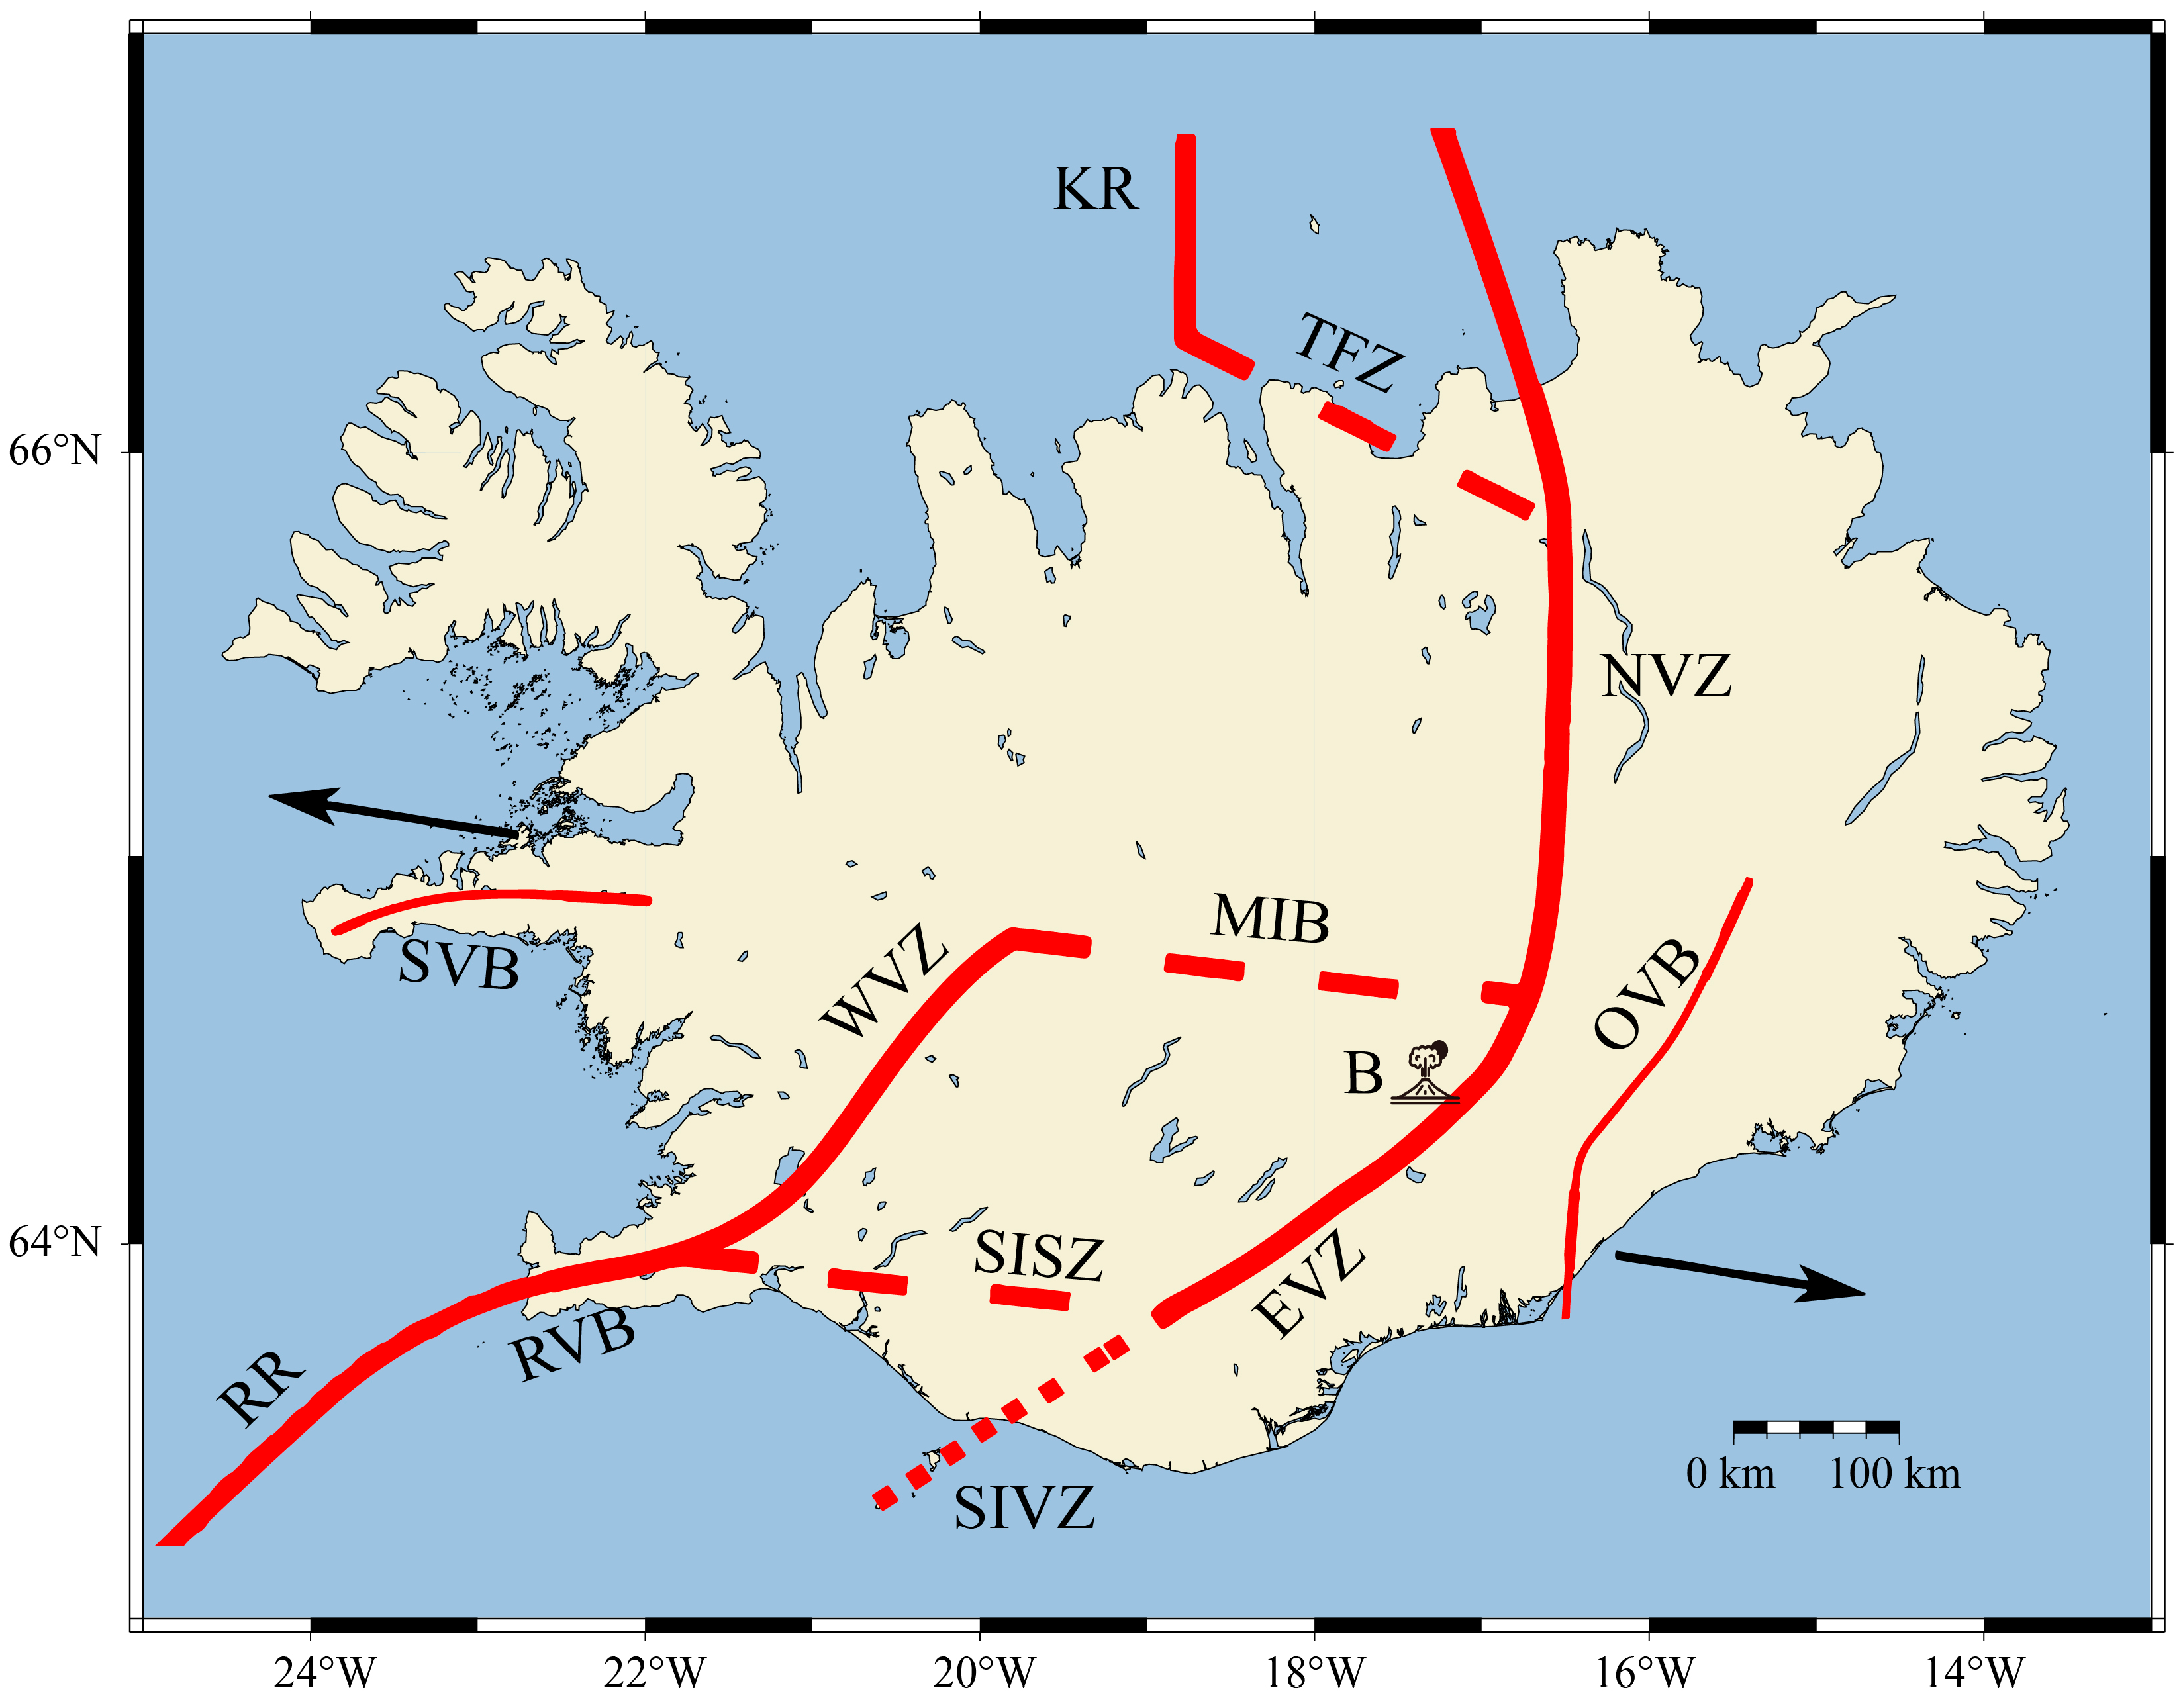
Figure 1. Geological overview map of Iceland [9,10,11,12,13]. B: Bárðarbunga volcano; RR: Reykjanes Ridge; RVB: Reykjanes volcanic belt; WVZ: West volcanic zone; MIB: Mid-Iceland belt; SISZ: South Iceland seismic zone; EVZ: East volcanic zone; SIVZ: South Iceland volcanic zone; NVZ: North volcanic zone; TFZ: Tjörnes fracture zone; KR: Kolbeinsey Ridge; OVB: Öræfajökul volcanic belt; SVB: Snæfellsnes volcanic belt. The arrow indicates the direction of plate motion.
Jmse 13 02172 g001
Figure 3. Locations of the seven selected seismic events (Mw > 5.0, 2020–2025) in the Bárðarbunga volcano region and the seismic stations used for inversion. In panel (a), the red triangle denotes the Bárðarbunga volcano, black triangles represent the selected stations, and circles indicate different epicentral distances. Panel (b) presents the epicentral positions of the seven events, denoted by red stars. Panel (c) is a partial enlarged view of the earthquake locations (shown as red stars) (Table 1).
Jmse 13 02172 g003
Figure 4. Focal mechanism inversion results for the Mw5.2 earthquake at Bárðarbunga on 21 October 2023. The red and black lines represent the synthetic and observed waveforms, respectively. Station abbreviations are listed on the left, with epicentral distance (km) and azimuth (°) indicated below each station. The numbers below the waveforms represent the relative time shift (s) between the synthetic and observed seismograms and the VR value (%) between them.
Jmse 13 02172 g004
Figure 5. Variation in fitting misfit with different source depth for the Mw5.2 earthquake on 24 October 2023.
Jmse 13 02172 g005
Figure 6. Bootstrap uncertainty test results for the best centroid depth inversion of the 21 October 2023 Mw 5.2 earthquake. Twelve or eleven stations were randomly selected from the total of thirteen stations for the subsampling tests. Panels (af) indicate uncertainty analysis of CLVD, DC, Mw, strike, dip, and rake angles, respectively. The horizontal axis represents the differences between subsampled inversion results and those obtained using all stations, while the vertical axis shows the frequency number for each error value.
Jmse 13 02172 g006
Figure 7. Distribution of the P and T axis orientations for the seven analyzed earthquakes. The red circle represents the P-axis, and the blue X represents the T-axis.
Jmse 13 02172 g007
Figure 8. Schematic diagram of magma inflow activity.
Jmse 13 02172 g008
Table 1. List of the selected seven earthquake events in the Bárðarbunga volcano region during 2020–2025 in this study [39,40].
UTC TimeLatitudeLongitudeDepthMoment Magnitude (Mw)
(°)(°)(km)
20 April 2020, 03:54:5164.6817.48105.1
21 February 2023, 08:41:0564.7117.68105.2
24 October 2023, 22:19:4764.6917.57105.2
6 October 2024, 17:56:3064.6717.23105.3
14 January 2025, 08:05:2364.5817.64105.2
22 February 2025, 21:04:4864.6917.52105.1
27 July 2025, 23:40:0364.5817.29105.3
Table 2. Inversion results for the seven seismic events in this study.
Origin TimeFault Plane 1Fault Plane 2DC
(%)
CLVD
(%)
MwDepth
(km)
Beach
Ball
Strike
(°)
Dip
(°)
Rake
(°)
Strike
(°)
Dip
(°)
Rake
(°)
20 April 20202955099109417950504.96Jmse 13 02172 i001
21 February 20231815762454212665355.47Jmse 13 02172 i002
24 October 2023251307588619848525.35Jmse 13 02172 i003
6 October 2024233339053579042585.29Jmse 13 02172 i004
14 January 2025643090244609053475.36Jmse 13 02172 i005
22 February 20252383810243538143575.16Jmse 13 02172 i006
27 July 20252372610541658358425.37Jmse 13 02172 i007
Disclaimer/Publisher’s Note: The statements, opinions and data contained in all publications are solely those of the individual author(s) and contributor(s) and not of MDPI and/or the editor(s). MDPI and/or the editor(s) disclaim responsibility for any injury to people or property resulting from any ideas, methods, instructions or products referred to in the content.