Abstract
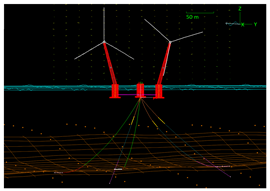
This article presents the design and optimization of the mooring system for a floating wind platform inspired by W2Power, which incorporates two wind turbines on a semi-submersible structure that weathervanes using a single-point mooring (SPM) system. Although several industrial concepts have adopted SPM configurations, research on their performance remains limited. This work addresses that gap by developing and applying a set of optimization strategies for the mooring system of such a platform using OrcaFlex, with the objective of minimizing the capital expenditure while satisfying Ultimate Limit State (ULS) and Fatigue Limit State (FLS) cases. The methodology was tested across two distinct marine environments: the Atlantic (Gran Canaria, GC-1) and the Mediterranean (Catalonia, LEBA-1), both characterized by their irregular bathymetry. In Catalonia, the environmental conditions are almost omnidirectional, while the platform in Gran Canaria is exposed to highly unidirectional loads. The article presents the most cost-effective solution for single-point moorings with three, four, and five lines in each case. Results demonstrate the viability of SPM-based floating wind systems with twin-turbines under diverse site conditions.
1. Introduction
The global deployment of floating offshore wind is expected to increase significantly in the coming years, driven by upcoming floating wind auctions in several countries. This trend raises questions about which types of floating wind platforms can achieve higher efficiency and/or lower costs []. Among the available technologies, a class of numerous industrial concepts is weathervaning platforms using a single-point mooring system (SPM). SPMs have evolved from a station-keeping solution for oil and gas to modern floating wind designs. By allowing the entire platform to “weathervane” into the prevailing wind, waves, and current, an SPM eliminates the RNA yaw system, thereby simplifying topside hardware and maintenance. Passive weathervaning may also lead to the damping of platform motions and load reductions, as numerical simulations and basin tests show large reductions in pitch response and mooring tension relative to spread-mooring layouts [,]. Steadier inflow from yaw-free alignment can also deliver modest gains in energy capture [].
Several technology developers have been testing their weathervaning concepts, and a growing body of research has examined these technologies. For single-turbine floating structures, Eolink’s four-legged pyramidal floater connects the turbine to a rotating buoy via two hawsers and anchors it to the seabed. Studies of this platform include validation of a Flexcom model with IFREMER basin tests [] and the development of a virtual mooring sensor that uses machine-learning models trained on OrcaFlex simulations to predict mooring loads from position and inertial measurements []. X1 Wind’s downwind, tension-leg variant (“PivotBuoy”) has been investigated through experiments and simulations addressing yaw-control strategies [], shallow-water mooring configurations [], and slamming-load mitigation []. Finally, Saitec Offshore’s DemoSATH, a concrete, twin-hull (SATH) semi-submersible with a single-point mooring that passively weathervanes, has been assessed through hybrid basin tests that impose rotor thrust and moments for a 10 MW configuration to characterize the coupled aero–hydro–mooring response [], as well as a techno-economic sensitivity study for Atlantic deployments that quantifies LCOE drivers for the SATH platform [].
Weathervaning platforms have also been investigated for hosting multiple rotors on a single hull. This twin-turbine configuration further boosts power extraction and, by extension, commercial appeal: Enerocean has developed the “W2Power” platform, which incorporates a twin-turbine configuration with an SPM system connected to the upwind wind column. Research conducted with this platform demonstrated that this double-turbine weathervaning architecture can be modeled with high fidelity, maintain stable alignment, and offers an attractive cost-of-energy pathway. Berdugo-Parada et al. [] showed that the double-rotor configuration can be modeled with high-fidelity including SeaFEM and OpenFAST. Stable weathervaning under aligned/misaligned cases was demonstrated via a real-time hybrid testing rig, where rotor loads were physically imposed while the hydrodynamics were simulated []. Looking at the hydrodynamics and their influence on the weathervaning capabilities, it was found that wave-current interactions are capable of changing the natural wind-tracking behavior, as well as the structure’s surge/heave motions and mooring tensions []. To keep the floater aligned and to compensate for the absent RNA yawing, individual pitch control and turret adjustments have been found beneficial to restore the desired floater position [,]. To validate the double-rotor configuration from an economic perspective, the authors of [] provided a first early-stage numerical optimization, basin testing, and preliminary cost modelling, concluding that the high investment cost for the large hull is effectively amortized over the typical lifetime thanks to the twin-rotor configuration. Complementary evidence on performance and operations with similar structures shows that dual-rotor systems come with higher power density while being subject to manageable loading and rapid wake recovery, indicating the aerodynamic feasibility of near-lateral rotor spacing []. Also, from a maintenance point of view, benefits can be identified as simulations for a 700 MW array showed streamlined maintenance logistics and lower life-cycle costs for twin-rotor layouts when compared to an array with single-rotor floaters [].
To the best of the authors’ knowledge, there are very few investigations that address the design aspects of single-point moorings for these twin-turbine systems. For itself, the design of the anchoring system for floating offshore wind turbines remains largely a trial-and-error exercise in industry []. This is mainly due to the large possible design space. To overcome this problem, the optimization space itself is usually narrowed to a handful of design variables (e.g., line length, diameter, anchor radius), which are guided by a metaheuristic to reduce the high computational times of deterministic solvers. Each possible solution during optimization needs to be carefully assessed, but because time-domain simulations are too costly at scale, frequency-domain models dominate the research []. Finally, while accounting for real, irregular bathymetries, works such as Hall et al. [] show that including actual seabeds influences final mooring configurations and serves as a basis for this study.
An extensive analysis of optimal mooring configurations for weathervaning twin-turbine floaters remains lacking, highlighting a significant research gap. Therefore, this work aims to address this gap, and its main contributions of this work can be summarized as follows:
- 1.
- Modeling of a single-point–moored (SPM) weathervaning twin-turbine semi-submersible in OrcaFlex.
- 2.
- Optimization and evaluation of three-, four-, and five-line mooring configurations at two Spanish sites with real, irregular bathymetry, with the objective of minimizing the capital expenditure.
The paper is organized as follows. Section 2 introduces a preliminary analysis of the bathymetries under study, describes the modeling framework of the platform in OrcaFlex, and defines the optimization algorithm to be used. Section 3 presents the results obtained for each case study. Finally, Section 4 provides the conclusions.
2. Methodology
This section outlines the methodology adopted in the study, focusing on three main aspects: the characteristics of the two sites, the structural modeling approaches, and the description of the mooring system optimization.
2.1. Site Selection in the Atlantic and Mediterranean Seas
For this study, two sites were selected: one in the Mediterranean, the Gulf of Roses off the coast of Catalonia, Spain (LEBA-1), and one in the Atlantic, near Barranco de Tirajana, Gran Canaria, Spain (GC-1). Detailed bathymetric data for both sites were obtained from the POEM definition via Puertos del Estado. The bathymetries for Catalonia and Gran Canaria are illustrated in Figure 1a and Figure 1b, respectively. The corresponding wind, wave, and current roses are presented in Figure 2a–Figure 3c.
Figure 1.
3D plots of the real bathymetries at two locations in Spain. The shaded areas indicated by the arrows correspond to the regions used for the mooring optimizations in this study.
Figure 2.
Environmental roses used for Catalonia (LEBA-1).
Figure 3.
Environmental roses for Gran Canaria (GC-1).
At the LEBA-1 area, the water depths range from about 100 m to 500 m (Figure 1a). The shelf break is situated near 150 m, closely after the seabed descends into the upper continental slope. Mapping of the northern Catalan shelf showed sandy and muddy sediments []. Sediment-wave features have been identified between approximately 200 and 400 m. The minimum distance from shore is about 12 km, with the shallower part of the polygon lying on the outer shelf and the deeper part extending onto the slope.
The local wind regime is characterized by a predominance of flows from the northwest sector (Figure 2a), with frequent wind speeds in the range of 8–16 m/s and occasional events exceeding 20 m/s. The wave climate (Figure 2b) is consistent with this pattern, showing dominant wave origins from the north and northwest, with significant wave heights of 0.5 m (corresponding peak return period of 4 s) in nominal sea states (NSS), and occasional storms producing extreme sea states (ESS) with of 7.5 m with of 10.5 s. Occasional wind and wave energy from the south is also observed, though not to a great extent. The current regime (Figure 2c) shows a similar distribution, with predominant flows coming mainly from the north/northeast. Typical current speeds range between 0.2–0.6 m/s, with maximum values approaching 1.0 m/s. This produces a small misalignment between the prevailing wind and wave forcing from the northwest and the dominant current propagation from the northeastern sector, which is ignored in the remainder of this study, as we assume the loads are co-aligned.
On the other site, the GC-1 area, water depths range from approximately 80 m to 1000 m (Figure 1b). Local minima of about 70–80 m occur at distances of 6–7 km from the coast, after which the seabed deepens rapidly due to the island’s narrow shelf and steep submarine slopes. Depths of 150–400 m are reached within short cross-shore distances, while the outer part of the designated area extends toward depths close to 1000 m. At water depths of 80–250 m (here, the design is focused on around 160 m), the seabed is mostly a steep slope with patchy rock/hardground [].
The wind and wave climates are dominated by northeastern directions. Figure 3a shows that winds originate predominantly from the NE–NNE sector, with most occurrences between 5 m/s and 12 m/s, and occasional higher values. The wave climate (Figure 3b) follows a similar pattern, with waves arriving mainly from the NNE, typically with significant wave heights of 1.5 m with of 6 s, and less frequent ESS events exceeding an of 5 m with of 11 s.
The current regime exhibits a slightly different orientation (Figure 3c), with flows coming mainly from EEN propagating towards WWS. Typical magnitudes lie in the range of 0.2–0.6 m/s, with maxima above 1.0 m/s. The small misalignment between the predominant wind-wave system (from NNE) and the dominant current origin (EEN) is not further assessed as co-aligned environmental conditions are assumed. However, the strongly unidirectional load directions from Northeast to Southwest are an important factor for the design and analysis of floating systems at the site, as is further discussed in Section 3.2.
2.2. FOWT Modeling Framework
The framework applied in this study follows the sequence illustrated in Figure 4 from left to right. First, the geometry of the semi-submersible platform is defined to generate the mesh using Gmsh 4.1. The resulting meshes are then imported into OrcaWave to perform potential flow analysis with added Morison elements to account for viscous drag and inertia contributions in second-order wave forces. The model is subsequently integrated into OrcaFlex 11.5c, where the detailed bathymetry is incorporated using the 3D seabed option.
Figure 4.
Conceptual framework from geometry definition to optimization and analysis.
Next, a Python 3.12 optimization script is coupled to the model. This script communicates with the corresponding OrcaFlex file via the OrcFxAPI. The optimization process is executed sequentially in the frequency domain, based on the previous potential-flow analysis and linearized drag forces. During the optimization, different mooring configurations are tested, and the best solutions are identified, analyzed, and visualized here.
2.3. Optimization Framework
The optimization framework adopted here follows the methodology in [], with adjustments made to suit the characteristics of single-point mooring systems. The configuration of each mooring line group is characterized by a vector of design variables . These variables govern the geometric layout, the selection of diameters, and the integration of auxiliary components such as load-reduction devices, clump weights, and buoyancy modules. For clarity, Table 1 summarizes all decision variables, their mathematical domains, and their physical meaning. Note that a detailed summary of all optimization variables is also provided in the “List of Symbols” at the end of the article.
Table 1.
Design variables describing the configuration of the line group g.
The complete design vector for the mooring layout is obtained as . The catenary coefficient defines the total line length , which is bound by the geometric condition
where denotes the vertical distance between the seabed and the fairlead connection, being the water depth and the fairlead depth below the free surface. Chain length ratios must satisfy , with each ratio constrained by minimum values dictated by seabed clearance and depth requirements:
If the cumulative length ratios of the BC, FC and used LRDs stays below 1 (i.e., 100% of the total line length), the remaining part of the line will be modeled via wire rope. This is because other synthetic ropes (e.g., nylon) are prone to ultraviolet impact and should be kept below 100 m water depth. Due to the prevailing depths at the sites of interest, we exclude such ropes from the optimization.
The feasible design space is defined by a set of nonlinear constraints , which ensure structural integrity and compliance with operational requirements. These constraints encompass dynamic stability, load limitations, positioning rules for all mooring components, and fatigue life. Table 2 summarizes the constraints, providing their mathematical expressions, limits, and engineering rationale.
Table 2.
Constraints defining the feasible region .
The design tension is expressed as a scalar product between the vector of safety factors and the vector of tension components :
with and , being is the effective dynamic load factor. Next, the corroded breaking load is given by the following:
Fatigue damage for the chain segments is evaluated using a power law for cycles to failure :
where is the number of cycles at stress range . Note that a design is feasible only if , with DFF being the design fatigue factor. The authors note that the fatigue assessment utilized herein does not replace, nor does it constitute, a full fatigue analysis as required by applicable standards.
The total cost of the mooring system is the sum of the acquisition costs of all components across line groups , plus penalty terms for infeasible (or undesirable) designs. Let . The problem is as follows:
with
Component costs follow the models in Table 3. Chain and rope costs depend primarily on the minimum breaking load (MBL) and the corresponding line length L. Anchor masses are computed from the prevailing soil conditions and the required ultimate holding capacity (UHC), following [] for drag-embedment anchors (DEAs) and [] for suction anchors. For simplicity, the UHC is taken as the minimum breaking load required of the connected chain.
Table 3.
Cost models for mooring components (in USD).
Penalty terms and are added to discourage non-convergent runs and constraint violations. For a candidate p, the violation penalty is as follows:
where collects the normalized violations; is their -sum; and M is the number of constraint checks.
3. Results
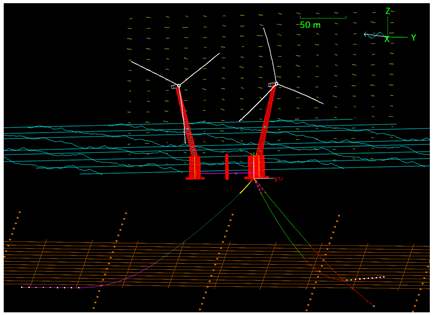
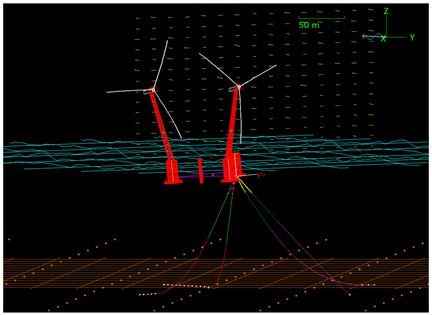
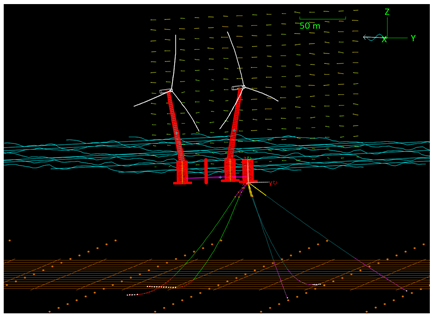
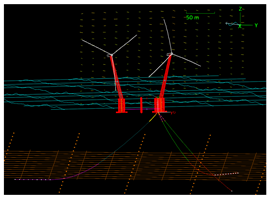
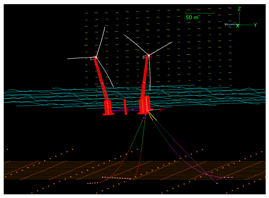
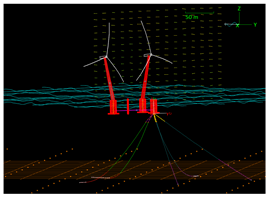
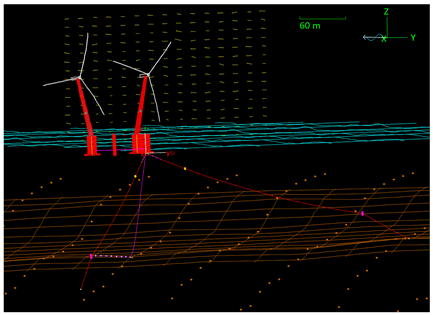
To streamline the presentation of the results, a common structure is adopted for all case studies. The results are obtained exclusively with the previously described tools: OrcaFlex for the structural modeling of the FOWT and Python to interface OrcaFlex with the optimization routine. For clarity, the results are organized into two subsections, one per site-specific case study. For each site, a first table provides images of the final optimal mooring layouts and the corresponding mooring line characteristics for the 3-, 4-, and 5-line solutions. A second table then reports the total costs of the resulting configurations, highlighting the best-performing, lowest-cost designs.
3.1. Mediterranean Site: Catalonia (Gulf of Roses, LEBA-1)
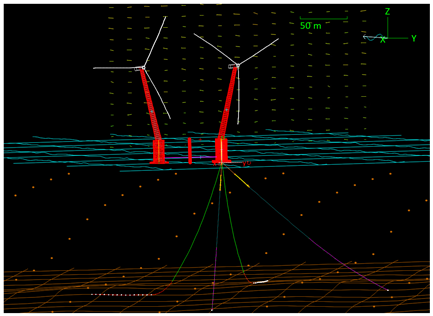
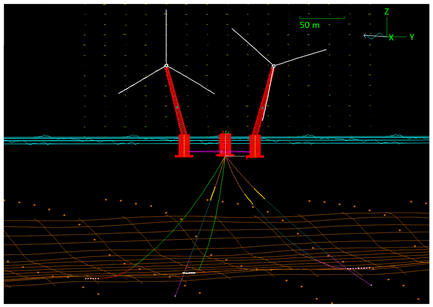
Environmental conditions at the LEBA-1 site do not indicate a prevailing upwind direction. Hence, the mooring system is designed to resist loads from any direction. All lines are configured identically and connected to the turret of the upwind column, which allows the twin-turbine platform to weathervane. Due to the sandy/muddy seabed, the optimization considers suction anchors and/or drag-embedded anchors as possible anchoring solutions. The results are summarized in Table 4.
Table 4.
Design and specifications of the solutions for Catalonia (LEBA-1).
The solutions use suction anchors arranged radially around the connection point and consist of chain–wire composite lines without auxiliary clump weights or buoyancy modules.
In the three-line configuration, each line follows a catenary profile without prestretch. The suction anchors are positioned on a circle of 259 m radius. Each line includes a 154 m bottom chain (BC) with a diameter of 102 mm, grade ORQ, connected to a 116 m wire section of 82 mm diameter and a short fairlead chain (FC) of 6 m length, 100 mm diameter, grade 3. The system is supported by three load-reduction devices (LRDs) with a nominal capacity of 2000 kN.
The four-line configuration adopts a catenary layout with a catenary of 11% and no prestretch. The anchor radius is reduced to 163 m. The BC length is 142 m with a diameter of 95 mm, grade ORQ, followed by a shorter 56 m wire section of 82 mm diameter. The FC length decreases to only 2 m with a diameter of 87 mm, grade 4. The LRD capacity is increased to 3000 kN to reflect the higher pretension.
The five-line configuration is a fully taut arrangement and introduces a small prestretch of 3%. The suction anchors remain at a radius of 163 m. The BC is shortened to 69 m with a diameter of 76 mm, grade 6. The wire section is lengthened to 116 m with a diameter of 82 mm, and the FC consists of only 2 m of chain with a diameter of 87 mm, grade 5S. The LRDs are again rated at 3000 kN.
Increasing the number of lines from three to four (and to five) allows a substantial reduction of the anchor radius from 259 m to 163 m. This means that moving from three to at least four lines reduces the seabed area requirement by approximately 60% while retaining suction anchors. This inward relocation is physically consistent with load sharing: with more lines, the needed horizontal restoring force per line is reduced, and anchors can be pulled closer to the floater without compromising ultimate limit state (ULS) margins.
Comparing the cases, we can see that as the line count increases, the design systematically shortens and slims the steel chain sections. The bottom chain (BC) length per line reduces from 154 m (3 lines) to 142 m (4 lines, −8%) and to 69 m (5 lines, −55%). The BC diameter similarly reduces from 102 mm to 95 mm (−7%) and to 76 mm (−25%), while the chain grade increases from ORQ (3–4 lines) to Grade 6 (5 lines). The fairlead chain (FC) follows the same trend: its length reduces from 6 m to 2 m (−67%) and its diameter from 100 mm to 87 mm (−13%), with the grade increasing from 3 to 4 and then to 5S. These coordinated choices with shorter lengths and smaller diameters, paired with higher grades, are physically coherent. Higher-strength steels allow smaller diameters without sacrificing minimum breaking load, and the aggregate suspended steel mass near the floater is reduced, improving the vertical center of gravity and decreasing wave-induced inertia loads.
This is reflected in the material allocation, which shifts markedly as line count increases. Using a simple chain tonnage proxy proportional to length times diameter squared, the combined (bottom- plus fairlead-chain) index is about 4.99 for the three-line layout system, rises slightly to 5.19 for the system with four lines, and then drops sharply to 2.07 for the five-line system. In relative terms, the four-line case uses roughly 4% more “chain steel proxy” than the three-line solution, whereas the five-line layout achieves a 59% reduction.
Rope usage follows the opposite trend, signaling a change in the global stiffness strategy. With a diameter held at 82 mm, the total rope length is 348 m in the three-line case (116 m per line), decreases to 224 m in the four-line case (56 m per line), and then increases substantially to 580 m in the five-line case (116 m per line). Only the five-line solution introduces a 3% prestretch. Together, the long, prestretched rope and short, high-grade chains, as well as the 0% catenary form, indicate a fully-taut configuration in which axial elasticity provides the primary restoring mechanism.
Device-assisted load moderation scales with line count as well. The total installed LRD capacity increases from 18 MN in the three-line case (3 × 2000 kN per line across three lines) to 36 MN for four lines and 45 MN for five lines (3 × 3000 kN per line). This progression is consistent with the observed move toward higher axial stiffness and lower catenary damping.
The presented configurations are designed to fulfill the constraints outlawed in Section 2.3. We summarize dynamic responses and governing limits as utilization percentages of the allowable limits (100% uses the full limit). For the 3-, 4-, 5-line solutions, platform offset utilization is 72%, 92%, 41%, respectively. This shows that the 5-line layout roughly halves the used offset margin relative to 4 lines and is markedly tighter than 3 lines. The airgap remains well within limits at 39–44% of the allowed sea surface clearance across all cases. Pitch is stable and similar (46%, 40%, 40% of allowed limits), and yaw is negligible (≈1%). The anchor ultimate holding capacity utilizations are 79%, 82%, 78% (all comfortably below 100%). The bottom chain (BC) reaches 100% utilization in all cases, indicating it is a governing component sized to its minimum breaking load (MBL). Rope usage is 98%, 90%, 96% of the MBL, showing that the 4-line case carries the lowest rope-tension demands, while the 3- and 5-line cases approach but remain below MBL. Fairlead chain (FC) MBL utilization is 80%, 97%, 81%, indicating that the 4-line design is locally most demanding at the fairlead but still acceptable. The LRD target-load utilization is 134%, 90%, 88%, indicating that with only 3 lines, the selected devices exceed their nominal target. Although they pass all constraints, the LRDs may require upsizing to further enhance system behavior. Both 4- and 5-line systems keep the selected LRDs within their target loads. Fatigue (FLS) was screened using the set-out frequency-domain checks, and all reported solutions passed the adopted fatigue criteria.
The cost of the optimized mooring solutions is summarized in Table 5. The table provides the unit cost for each line and anchor, and the total system cost is the aggregated cost of all lines and anchors. The reported costs confirm that, for otherwise comparable component choices, total mooring expenditure scales essentially linearly with the number of lines and anchors. The three-line system totals EUR 1.33 M, the four-line system EUR 1.65 M (+24% versus three lines), and the five-line system EUR 2.12 M (+28% versus four lines; +59% versus three lines). Notably, the per-line cost drops from EUR 0.16 M in the three- and four-line designs to EUR 0.14 M in the five-line optimum, reflecting the shift to shorter, smaller-diameter chain segments and a more rope-dominated, near-taut architecture. Per-anchor cost is lowest in the four-line case at EUR 0.25 M, compared with EUR 0.28 M for three- and five-line cases. Given that the optimized anchor radius is 259 m for three lines and 163 m for both four and five lines, the reduction from three to four lines delivers footprint contraction at a modest incremental cost, whereas adding a fifth line raises the anchor count and total cost without further shrinking the radius. Looking at the dynamics, the 5-line design provides the best stability margins (lowest offset utilization and within the target loads of the LRDs) at the expense of higher CAPEX, while 4 lines offer a balanced compromise with tight but acceptable margins and reduced cost.
Table 5.
Cost comparison of the solutions for Catalonia (LEBA-1).
3.2. Atlantic Site: Gran Canaria (Tirajana, GC-1)
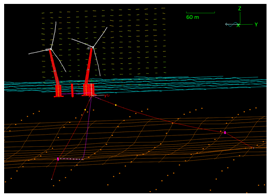
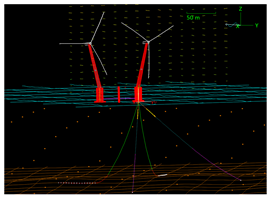
Environmental conditions at GC-1 consistently act from a range from N-E towards S-W, which leads to a clear design choice of distinct upwind and downwind mooring lines. In this case, we will consider mooring systems evenly spaced around the floater, while the upwind group always holds the same or more lines than the downwind to distribute the loads more evenly as proposed in []. Due to the volcanic/rocky seabed which may be impenetrable we limit the anchor choice to gravity anchors. The upwind lines carry the governing environmental loads and therefore adopt higher diameters, grades, and device assistance. Downwind lines are lighter and sometimes slightly more catenary to contribute restoring force mainly in moderate offsets. Table 6 highlights the design choices.
Table 6.
Design and specifications of the solutions for Gran Canaria (GC-1).
In the three-line configuration, the system is chain-dominated and near-taut with no rope segments. Upwind lines use 342 m × 81 mm ORQ bottom chain plus 4 m × 76 mm grade-6 fairlead chain. The downwind line uses 224 m × 76 mm ORQ bottom chain and 2 m × 81 mm ORQ fairlead chain. Catenary is 0% in both groups, indicating that restoring comes from axial tension and geometry rather than seabed lay-down. A 3 t clump weight near the floater lowers the fairlead angle and adds local compliance. Two 9 t buoys placed close to the anchor lift the final span and increase the padeye uplift angle. This is adverse for gravity anchors that rely on weight and friction. To preserve anchor capacity, this extra uplift must be countered by higher anchor mass, greater anchor radius, and/or peak-load reduction. Reflecting this, anchor radii are large and asymmetric: 314 m upwind and 180 m downwind. Load-reduction devices are installed only upwind (three per line at 1000 kN each), giving 6 MN system capacity. System totals are 908 m of bottom chain and 10 m of fairlead chain, with a combined chain-steel proxy of 5.84. Overall, the layout secures station-keeping through heavy chain and attachments but at the cost of a large upwind footprint and increased anchor uplift due to buoy placement, making it less material- and footprint-efficient than the higher line-count optima for this unidirectional, gravity-anchored site.
The four-line configuration marks a decisive architectural shift. Wire rope is introduced in both groups (upwind 84 m × 82 mm with 4% prestretch; downwind 135 m × 76 mm with no prestretch), and the anchor radii collapse to 160 m in both sectors, effectively halving the upwind radius relative to the three-line case. Upwind bottom chain shortens drastically to 102 m but grows to 120 mm (grade 4), and the fairlead chain becomes longer and stronger at 18 m × 87 mm (grade 6), reflecting higher local tensions and wear near the fairlead in a more axial system. Downwind bottom chain is 92 m × 76 mm (ORQ) with a very short fairlead chain of 2 m × 76 mm (grade 3). The downwind group alone retains a small catenary component (3%), consistent with its secondary role. System-level totals are 388 m of bottom chain, 40 m of fairlead chain, and 438 m of rope. The chain proxy falls to 4.30, a 26% reduction versus three lines, while installed LRD capacity rises sharply to 18 MN (three devices per upwind line at 3000 kN each). Load sharing across four lines and limited but larger wire rope elasticity, plus the upwind LRD capacity rise, allows for a compact footprint with much less bottom chain, while the longer, high-grade fairlead chain on the upwind lines protects the interface where tensions and bending cycles concentrate.
The five-line configuration reinforces the near-taut, elasticity-driven strategy and rebalances material away from the bottom chains. The bottom chains are reduced further to 71 m × 87 mm (grade 6), and downwind to 57 m × 76 mm (ORQ). Wire rope segments lengthen again (upwind 106 m × 90 mm with 7% prestretch; downwind 154 m × 76 mm with 4% prestretch). The upwind fairlead chain becomes very substantial at 53 m × 90 mm (grade 6) and while also increasing slightly on the downwind side to 9 m × 76 mm (grade 6). Both groups show no catenary from. The anchor footprint remains compact but grows relative to four lines, governed by an upwind radius of 198 m (downwind 160 m), which is still far smaller than the three-line case. Whole-system totals are 327 m of bottom chain, 177 m of fairlead chain, and 626 m of rope. Despite the large fairlead segment, the overall chain proxy drops again to 3.66, 37% below the three-line solution and 15% below the four-line solution. LRDs remain upwind-only (three per line at 2000 kN), summing again to a total of 18 MN. The pattern reveals a deliberate push toward axial stiffness and device-assisted load management, with rope elasticity and fairlead chain absorbing dynamics while the bottom chain is minimized to reduce seabed interaction and anchor demands.
For the Gran Canaria site, a similar system behavior can be observed as for the Catalonia systems, as the responses tighten with increasing line count. The allowed offset utilization drops from 96% (3 lines) to 58% (4 lines) and 34% (5 lines). The airgap usage remains modest at 24–27%, and pitch reduces from 40% to 31–30% of its limit. Yaw motion reaches ≈ 1–2% degrees of its allowance in all cases and is negligible. The utilization of the upwind anchor is 99%, 40% and 71% of the ultimate holding capacity for the 3/4/5-line designs, with negligible downwind demands (≤5%). Bottom-chain MBL usage (upwind) trends 100%, 50%, 91%, indicating the 3-line layout sizes the upwind BC to its limit, while the 4-line configuration shows reduced relative demand. Rope MBL usage is much higher in the upwind than for the downwind groups (upwind ≈ 90%, downwind 5–7%). Forerunner chains (upwind) are loaded with 70–90% of their design limit, downwind ≤10%. LRD target-load utilization (upwind) is 269%, 102%, and 126%, indicating that the nominal target load in the 3-line case is clearly exceeded and would require upsizing for more favorable system responses. In the 5-line case, the system behavior exceeds the target load but is still in a favorable low-stiffness zone. The 4-line configuration indicates an ideal working behavior of the applied LRD.
Table 7 mirrors the cost of the case study. Total mooring cost increases with line count, even as unit costs per line decline. System totals are 1.35 M€ (3 lines), 1.80 M€ (4 lines; +33% vs. 3 lines), and 2.12 M€ (5 lines; +18% vs. 4 lines; +57% vs. 3 lines). Upwind per-line cost decreases from 0.27 M€ (3 lines) to 0.21 M€ (4 lines) and 0.17 M€ (5 lines), while downwind per-line cost drops from 0.07 M€ to 0.04 M€. These unit-cost reductions reflect the progressive shift from long, heavy bottom chains to wire-rope segments with calibrated prestretch. Upwind per-anchor cost is lowest at 0.29 M€ (3 lines), peaks at 0.48 M€ (4 lines), then falls to 0.40 M€ (5 lines), whereas downwind anchors remain at 0.16 M€ across all cases. The upwind peak at four lines coincides with the strong footprint contraction (the anchor radius collapsing to 160 m) and the associated increase in vertical load component on gravity anchors. This requires a greater gravity anchor mass to preserve capacity. In the five-line optimal, the upwind radius relaxes to 198 m, reducing uplift and lowering per-anchor cost relative to the four-line case. Overall, the four-line layout offers a balanced compromise: it halves the upwind footprint relative to three lines and keeps total cost at 1.80 M€, while substantially reducing chain tonnage via rope introduction and device assistance. The five-line option further reduces per-line costs and chain usage, but total cost rises to 2.12 M€ because the additional line and anchor count outweigh unit savings. Operationally, a four-line layout offers the most balanced compromise between footprint and cost, whereas a five-line scheme is warranted when minimizing chain, tightening dynamic response, or increasing redundancy is paramount, and the higher upwind-anchor outlay is acceptable.
Table 7.
Cost comparison of the solutions for Gran Canaria (GC-1).
3.3. Algorithm Stability and Computational Footprint
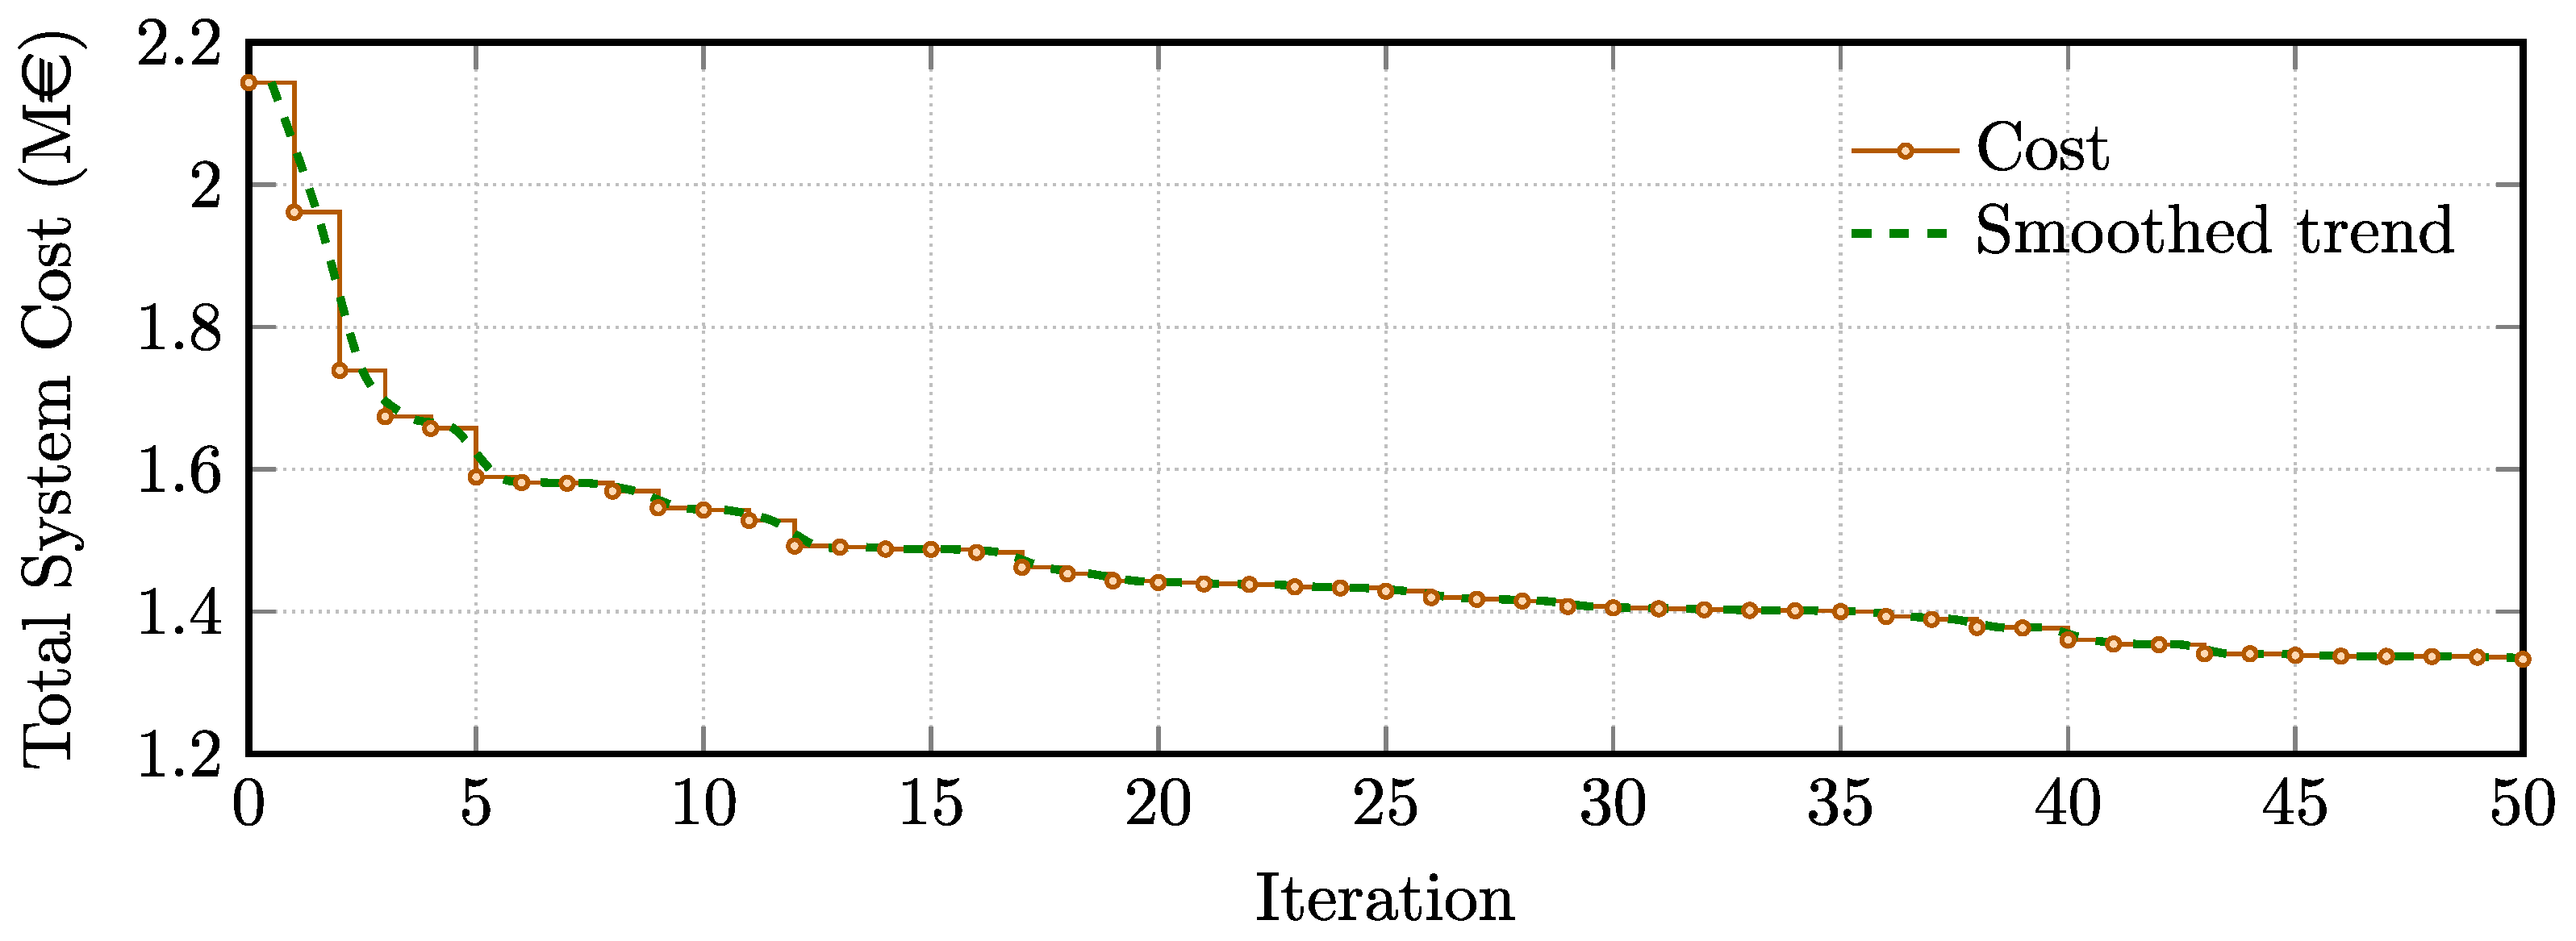
To illustrate the algorithm’s stability, a representative trace for the Catalonia 3-line case is reported. For each iteration, we record the minimum total system cost among feasible evaluations and plot the best-so-far value as a step curve (Figure 5). This feasible-only trace summarizes progress toward cheaper, valid designs while avoiding penalized infeasible evaluations.
Figure 5.
Convergence (feasible-only) of the LEBA1 3-line case. Step curve shows the best-so-far total system cost by iteration, and the greed dashed line its smoothed trend.
Across 50 iterations, the best-so-far total system cost decreases from 2.14 M€ to 1.33 M€ (−37.8%), with 18 improvements and the last improvement at iteration 44. In the early phase of the optimization, larger improvements emphasize the importance of global exploration of the search space, while the smaller improvements towards the end indicate the benefit of local exploitation of known solutions.
After iteration 44, the best-so-far value remains constant, indicating a stable plateau with no late drift in the objective. This confirms that the optimizer reaches stable performance before termination for the reported case.
The executed the optimization workflow described in [] on a virtual machine with 12 vCPUs and 12 GB RAM (Windows 11; Python 3.12; OrcaFlex 11.5c). A single particle evaluation that reaches a statically stable configuration in all load cases typically requires 10–15 s wall time. If static stability is not reached, the evaluation is aborted, and the assessment terminates sooner. The upper example with 100 particles assessed over 50 iterations (5000 evaluations) corresponds to the following serial compute time:
Assuming concurrent execution over 12 cores with parallel efficiency , the estimated wall-clock time for a full execution is as follows:
It should be noted that many infeasible particles exit early (especially in the early stages of the optimization), which makes observed wall-clock times for the final reported designs fall within or below this bound.
Because compute cost is not the focus of this study and depends on implementation details (e.g., parallel strategy, caching, and stopping criteria), we report these values as order-of-magnitude estimates rather than precise benchmarks.
4. Conclusions
This study contrasted two mooring philosophies for a twin-turbine, turret-moored, weathervaning semi-submersible: (i) a symmetric layout for omnidirectional seas (Catalonia) and (ii) a functionality-based layout for a highly unidirectional site (Gran Canaria) that explicitly separates upwind and downwind duties. Symmetric designs maintain identical lines and distribute loads uniformly. In contrast, the functionality-based designs intentionally enlarge the upwind group (larger diameters/grades, higher LRD capacity, longer FC/rope) while lightening the downwind group.
Key findings are consistent across sites: We found that the line count governs the footprint. Going from three to four lines reduces anchor radius, with diminishing returns thereafter. Furthermore, does the preferred mooring topology shift with line count? More lines enable higher grades, shorter chains, and longer ropes, e.g., five-line optima are near-taut with a small prestretch. On the economic side, the cost scales primarily with the number of lines/anchors. Three-line systems are cheapest, while four-line systems buy most of the footprint benefit. Five lines, on the other hand, increase CAPEX but reduce the “chain steel proxy” and tighten dynamics. At unidirectional sites, role-split designs are superior as they localize robustness and LRD capacity upwind, keeping the downwind side lean, and avoid excessive uplift for gravity anchors, achieving large radius reductions without uniform over-design.
For future projects, these results imply site-tailored standardization: symmetric four-line solutions for omnidirectional sites and role-split four-line concepts for directional sites. Five-line variants may be beneficial for projects prioritizing dynamic performance, redundancy, or additional tonnage reductions along the chain.
Future work could implement a dedicated multiobjective extension to map CAPEX versus stability trade-offs (e.g., Pareto fronts over cost and dynamic metrics), jointly optimize hull, turret, and mooring dynamics, include additional anchoring technologies (including solutions for rocky seabeds), and quantify installation and maintenance impacts.
Author Contributions
Conceptualization, M.D.K. and H.d.P.G.; methodology, M.D.K. and H.d.P.G.; software, M.D.K. and H.d.P.G.; validation, M.D.K., H.d.P.G., and J.F.-Q.; formal analysis, M.D.K. and H.d.P.G.; investigation, M.D.K. and H.d.P.G.; resources, M.D.K. and H.d.P.G.; data curation, M.D.K. and H.d.P.G.; writing-original draft preparation, M.D.K. and H.d.P.G.; writing-review and editing, J.F.-Q. and J.L.D.-G.; visualization, M.D.K. and H.d.P.G.; supervision, J.F.-Q. and J.L.D.-G.; project administration, J.F.-Q. and J.L.D.-G.; funding acquisition, J.L.D.-G. All authors have read and agreed to the published version of the manuscript.
Funding
The research leading to these results has received financial support from the Spanish Ministry of Science and Innovation, subsidized by CDTI through the TRANSMISIONES 2023 program under the OPTIMAR project with grant agreement PLEC2023-010352.
Data Availability Statement
The data related to the platform design is confidential. The remaining parameters needed for the mooring optimization are provided in the figures and tables of the text.
Conflicts of Interest
Javier Fernandez-Quijano is employed by EnerOcean S.L., which owns the platform design on which this article is based. The remaining authors declare no conflicts of interest and no financial, personal, or professional ties that could have influenced the results of this study. The platform design used in this article was developed independently and in parallel, without access to confidential company data, within the framework of the OPTIMAR project.
Abbreviations
The following abbreviations are used in this manuscript:
| BC | Bottom Chain |
| BE | Buoyancy Element |
| CW | Clump Weight |
| DEA | Drag Embedded Anchor |
| ESS | Extreme Sea State |
| FEED | Front-End Engineering Design |
| FC | Fairlead Chain |
| LRD | Line Reduction Device |
| MBL | Minimum Breaking Load |
| NSS | Nominal Sea State |
| UHC | Ultimate Holding Capacity |
| List of Symbols | |
| Water depth. | |
| Fairlead depth below free surface. | |
| Vertical distance seabed-fairlead. | |
| Line-group index. | |
| Catenary coefficient controlling line slackness. | |
| Horizontal anchor-fairlead distance. | |
| Bottom/fairlead chain length ratios relative to total line length. | |
| Minimum admissible ratios for bottom/fairlead chain. | |
| Nominal diameter of rope or chain. | |
| Minimum instantaneous airgap under the deck for design state x. | |
| Platform horizontal offset statistic for state x. | |
| Platform rotation metric (pitch/roll/yaw) for state x. | |
| Minimum vertical seabed clearance of rope/LRD along the line. | |
| Significant wave height of the considered sea state. | |
| a | Adimensional limit for offset, defining . |
| Mean and dynamic tension components. | |
| Safety factors acting on mean and dynamic tension. | |
| Design tension . | |
| New and corroded minimum breaking load. | |
| New and corroded diameter used in corrosion scaling. | |
| Reference breaking load used in the S–N law. | |
| S–N curve parameters for the selected chain detail class. | |
| Design Fatigue Factor. | |
| Target activation load for the LRD cost model. | |
| Penalty for non-convergent simulations. | |
| Penalty for constraint violations. |
References
- del Pozo Gonzalez, H.; Kallinger, M.D.; Rapha, J.I.; Domínguez-García, J.L. Modern Floating Wind Energy Technologies. In Energy Systems Integration for Multi-Energy Systems: From Operation to Planning in the Green Energy Context; Springer: Berlin/Heidelberg, Germany, 2025; pp. 295–316. [Google Scholar] [CrossRef]
- Liu, Y.; Yoshida, S.; Yamamoto, H.; Toyofuku, A.; He, G.; Yang, S. Response Characteristics of the DeepCwind Floating Wind Turbine Moored by a Single-Point Mooring System. Appl. Sci. 2018, 8, 2306. [Google Scholar] [CrossRef]
- Nihei, Y.; Matsuda, Y.; Kitamura, S.; Takaiwa, K.; Kanda, N. Research and Development about the Mechanisms of a Single Point Mooring System for Offshore Wind Turbines. Ocean Eng. 2018, 147, 431–446. [Google Scholar] [CrossRef]
- Zhang, H.; Liu, X.; Cao, X.; Zhang, N.; Law, A.W.K. Dynamic response and power performance of a novel wind–wave–tidal energy system with single-point mooring integration. Energy 2025, 325, 136114. [Google Scholar] [CrossRef]
- Connolly, A.; Guyot, M.; Boulluec, M.L.; Héry, L.; O’Connor, A. Fully Coupled Aero–Hydro–Structural Simulation of a New Floating Wind Turbine Concept. In Proceedings of the ASME 1st International Offshore Wind Technical Conference (IOWTC2018), San Francisco, CA, USA, 4–7 November 2018. [Google Scholar] [CrossRef]
- del Pozo Gonzalez, H.; Kallinger, M.D.; Yalcin, T.; Rapha, J.I.; Domínguez-García, J.L. Design of Virtual Sensors for a Pyramidal Weathervaning Floating Wind Turbine. J. Mar. Sci. Eng. 2025, 13, 1411. [Google Scholar] [CrossRef]
- Urbán, A.M.; Voltà, L.; Lio, W.H.; Torres, R. Preliminary Assessment of Yaw Alignment on a Single Point Moored Downwind Floating Platform. J. Phys. Conf. Ser. 2021, 2018, 012043. [Google Scholar] [CrossRef]
- Huo, F.; Xu, J.; Yang, H.; Yuan, Z.; Shen, Z. Study on characteristics of mooring system of a new floating offshore wind turbine in shallow water by experiment. Front. Energy Res. 2023, 10, 1007996. [Google Scholar] [CrossRef]
- Huo, F.L.; Ye, C.; Nie, Y.; Yuan, Z.J.; Xu, S.; Li, M.Y. Experimental Study on the Slamming Characteristics of a New Type of Floating Wind Turbine. China Ocean Eng. 2025, 39, 529–540. [Google Scholar] [CrossRef]
- Vittori, F.; Azcona, J.; Eguinoa, I.; Pires, O.; Rodríguez, A.; Morató, Á.; Garrido, C.; Desmond, C. Model tests of a 10 MW semi-submersible floating wind turbine under waves and wind using hybrid method to integrate the rotor thrust and moments. Wind Energy Sci. 2022, 7, 2149–2161. [Google Scholar] [CrossRef]
- Filgueira-Vizoso, A.; Cordal-Iglesias, D.; Puime-Guillen, F.; Lamas-Galdo, I.; Martínez-Rubio, A.; Larrinaga-Calderón, I.; Castro-Santos, L. Sensitivity study of the economics of a floating offshore wind farm. The case study of the SATH® concrete platform in the Atlantic waters of Europe. Energy Rep. 2023, 9, 2604–2617. [Google Scholar] [CrossRef]
- Berdugo-Parada, I.; Servan-Camas, B.; Garcia-Espinosa, J. Numerical Framework for the Coupled Analysis of Floating Offshore Multi-Wind Turbines. J. Mar. Sci. Eng. 2024, 12, 85. [Google Scholar] [CrossRef]
- Liu, G.; Jiang, Z.; Zhang, H.; Du, Y.; Tian, X.; Wen, B.; Peng, Z. A Novel Real-Time Hybrid Testing Method for Twin-Rotor Floating Wind Turbines with Single-Point Mooring Systems. Ocean Eng. 2024, 312, 119151. [Google Scholar] [CrossRef]
- Elobeid, M.; Pillai, A.C.; Tao, L.; Ingram, D.; Hanssen, J.E.; Mayorga, P. Implications of Wave–Current Interaction on the Dynamic Responses of a Floating Offshore Wind Turbine. Ocean Eng. 2024, 292, 116571. [Google Scholar] [CrossRef]
- Sandua-Fernández, I.; Martín-San-Román, R.; Eguinoa, I.; Cascales-Gómez, A.; Iribas-Latour, M. About Control of Bi-Wind Turbine Single-Point-Moored Floating Offshore Wind Turbines. J. Phys. Conf. Ser. 2024, 2767, 032031. [Google Scholar] [CrossRef]
- Chen, J.; Ma, Y.; Guo, Z.; Zha, R. Performance and Optimization of Wind Tracking of a Single-Point Moored Floating Offshore Wind Turbine. Ocean Eng. 2025, 329, 121139. [Google Scholar] [CrossRef]
- Hanssen, J.E.; Margheritini, L.; Mayorga, P.; Hezari, R.; O’Sullivan, K.; Martinez, I.; Arriaga, A.; Agos, I.; Todalshaug, J.H.; Steynor, J.; et al. Design and Performance Validation of a Hybrid Offshore Renewable Energy Platform: A Path to Cost-Efficient Development of Deep-Water Marine Energy Resources. In Proceedings of the 10th International Conference on Ecological Vehicles and Renewable Energies (EVER 2015), Monte Carlo, Monaco, 31 March–2 April 2015; pp. 1–8. [Google Scholar] [CrossRef]
- Mendoza, V.; Katsidoniotaki, E.; Florentiades, M.; Fraga, J.D.; Dyachuk, E. Aerodynamic Performance of a Dual Turbine Concept Characterized by a Relatively Close Distance Between Rotors. Wind Energy 2023, 26, 521–537. [Google Scholar] [CrossRef]
- Avanessova, N.; Land, J.; Lee, A.; Lazakis, I.; Thomson, C. Comparison of Operation and Maintenance of Floating 14 MW Turbines and Twin 10 MW Turbines. ASME Open J. Eng. 2023, 2, 021031. [Google Scholar] [CrossRef]
- Ja’e, I.A.; Ali, O.M.A.; Yenduri, A.; Nizamani, Z.; Nakayama, A. Optimisation of mooring line parameters for offshore floating structures: A review paper. Ocean Eng. 2022, 247, 110644. [Google Scholar] [CrossRef]
- Abdelmoteleb, S.E.; Bachynski-Polić, E.E. A frequency-domain optimization procedure for catenary and semi-taut mooring systems of floating wind turbines. Mar. Struct. 2025, 101, 103768. [Google Scholar] [CrossRef]
- Hall, M.; Biglu, M.; Housner, S.; Coughlan, K.; Mahfouz, M.Y.; Lozon, E. Floating wind farm layout optimization considering moorings and seabed variations. J. Phys. Conf. Ser. 2024, 2767, 062038. [Google Scholar] [CrossRef]
- Durán, R.; Puig, P.; Paradis, S.; Guillén, J.; Palanques, A.; Lo Iacono, C.; Arjona-Camas, M.; Muñoz, A.; Micallef, A. Long-term morphological and sedimentological changes caused by bottom trawling on the northern Catalan continental shelf (NW Mediterranean). Front. Mar. Sci. 2023, 10, 1270485. [Google Scholar] [CrossRef]
- Fontán Bouzas, A.; Alcántara-Carrió, J.; Montoya Montes, I.; Barranco Ojeda, A.; Albarracín, S.; Rey Díaz de Rada, J.; Rey Salgado, J. Distribution and thickness of sedimentary facies in the coastal dune, beach and nearshore sedimentary system at Maspalomas, Canary Islands. Geo-Mar. Lett. 2013, 33, 117–127. [Google Scholar] [CrossRef]
- Kallinger, M.D.; del Pozo Gonzalez, H.; Trubat, P.; Dominguez-Garcia, J.L.; Molins-Borrel, C. Holistic optimization and comparison of mooring systems for floating offshore wind turbines. Ocean Eng. 2025; submitted. [Google Scholar]
- Vryhof Manual–The Guide to Anchoring; Technical Report; VRYHOF: Schiedam, The Netherlands, 2015.
- Offshore Anchor Data for Preliminary Design of Anchors of Floating Offshore Wind Turbines; Technical Report; ABS: Houston, TX, USA, 2013.
- Davies, R.; Baca, E.; Hall, M. An Updated Mooring Cost Modeling Tool Set With Application to a Reference Model Wave Energy Converter. In Proceedings of the ASME 2025 44th International Conference on Ocean, Offshore and Arctic Engineering, Volume 5: Ocean Renewable Energy, Vancouver, BC, Canada, 22–27 June 2025; p. V005T09A066. [Google Scholar] [CrossRef]
- Offshore Wind Scotland. Fact Sheet 2: Anchors and Moorings. Technical Report. Available online: https://www.sdi.co.uk/media/l31f0f42/02-anchors-moorings.pdf (accessed on 6 November 2025).
- Chemineau, M.; Castillo, F.; Arramounet, V.; Trubat, P.; Molins, C.; Vigara, F.; de Guglielmo, G.; Cortés, C.; Mahfouz, M.Y.; Pan, Q.; et al. D2.2 Design Analysis and Optimization of Mooring & Anchoring System for FOWT; Technical Report; COREWIND: Madrid, Spain, 2022. [Google Scholar]
Disclaimer/Publisher’s Note: The statements, opinions and data contained in all publications are solely those of the individual author(s) and contributor(s) and not of MDPI and/or the editor(s). MDPI and/or the editor(s) disclaim responsibility for any injury to people or property resulting from any ideas, methods, instructions or products referred to in the content. |
© 2025 by the authors. Licensee MDPI, Basel, Switzerland. This article is an open access article distributed under the terms and conditions of the Creative Commons Attribution (CC BY) license (https://creativecommons.org/licenses/by/4.0/).