Abstract
In this study, 101 and 102 rainwater samples were collected from April 2020 to February 2024 in a coastal and marine area, respectively. The results show that the Cl/Na ratios in both study areas were lower than the seawater value (1.17), suggesting chloride depletion. The chloride depletion rates in both areas decreased after the COVID-19 lockdown period. The molar ratio of NH4+ to non-sea-salt sulfate (nss-SO42−) was 1.54, with a mixture of (NH4)2SO4 and NH4HSO4 in the coastal area, and 0.83, with NH4HSO4 as the main form, in the marine area. A decreasing trend attributed to high O3 and relative humidity (RH) levels occurred in 2022. Among the dissolved organic nitrogen (DON) species, DON accounted for 24% and 32% of the total dissolved nitrogen (TDN) in the coastal and marine areas, respectively, indicating a greater relative contribution under lower anthropogenic influence. On the basis of the correlation between the species and source analysis results, NO3− mainly originated from fossil fuel combustion, NH4+ originated from agricultural emissions and secondary aerosols, and DON originated from secondary aerosols via combustion processes and natural emissions. In terms of the flux, due to lockdown activities, the Dissolved Inorganic Nitrogen (DIN) flux decreased significantly from 40.6 to 19.3 mmol m−2 yr−1 in the coastal area and from 27.7 to 15.1 mmol m−2 yr−1 in the marine area. Additionally, a slight decrease occurred in the DON flux, from 21.6 to 19.3 mmol m−2 yr−1 and from 27.7 to 15.1 mmol m−2 yr−1, respectively. Regarding new production, based on nitrogen input, the level in the coastal area decreased from 5.83 to 2.10 g C m−2 yr−1, and that in the marine area decreased from 3.92 to 1.55 g C m−2 yr−1, indicating a significant reduction during the COVID-19 lockdown.
1. Introduction
Over the past few years, with the rapid development of technology, heavy fertilizer usage and fossil fuel combustion have led to significant increases in the emissions of reactive nitrogen (Nr) [1,2]. Nitrogen deposition in the environment leads to issues such as acidification and eutrophication, posing challenges for normal biological growth and becoming an important global concern. In recent years, with the rapid increase in agricultural and industrial activities, anthropogenic emissions of reactive nitrogen have significantly increased, surpassing natural emissions in 2010 (210 Tg N yr−1 compared with 203 Tg N yr−1) [3]. China, as one of the three major nitrogen deposition hotspots globally, exhibited an increase of approximately 60% in nitrogen deposition during the 2010s compared with that during the 1980s [2,4]. Wet deposition, as one of the main pathways for the atmospheric deposition of reactive nitrogen [3], carries approximately 40% to 80% of reduced nitrogen and 40% to 70% of nitrogen oxides to the Earth’s surface globally [5]. In China, from 1980 to 1990, approximately 67% of the total nitrogen (TN) deposition occurred through wet deposition, and even from 2011 to 2015, wet deposition still accounted for more than 50% of the total nitrogen (TN) deposition [2]. These findings indicate that wet deposition is an integral part of atmospheric nitrogen deposition.
With respect to inorganic nitrogen (IN), which has been influenced by industrialization since the 18th century, nitrogen oxide (NOx) emissions from industrial activities have notably increased in areas such as Europe and America, becoming major hotspots of nitrogen emissions at that time. Subsequently, areas in East Asia and Southeast Asia also became emission hotspots after the 1990s due to increased fertilizer use and fossil fuel combustion [6,7]. In terms of the atmospheric composition, nitrogen deposition in Europe and North America was primarily dominated by NOx during the 18th century. However, after efforts to reduce NOx emissions started during the 1990s in Europe and America, NOx emissions decreased by approximately 50–60% by 2018 compared with those in 1980, and similar control measures were implemented by the Chinese government after 2010, resulting in an approximately 16% reduction in NOx emissions from 2012 to 2018 [8,9,10]. Conversely, in terms of NHy, there are almost no policy interventions to address NHy emissions from food systems other than NOx generated by fossil fuel combustion, leading to a steady increase in NHy emissions in both the United States and China [9]. Therefore, nitrogen deposition in the atmosphere, which has been largely dominated by NOx since the 1990s, has transitioned to dominance by NHy in recent years [8,11].
The sources of organic nitrogen (ON) are complex and include both anthropogenic and natural sources. Anthropogenic sources include fertilizers used in agriculture, fossil fuel combustion, and biomass burning, whereas natural sources include volatile organic compounds (VOCs) emitted by vegetation, soil dust, bacteria, and pollen [12,13,14]. Previous studies have indicated that a large portion of ON in rainwater is bioavailable and that approximately 45% to 75% of ON can be rapidly utilized by microorganisms [15], suggesting significant contributions of ON to primary and secondary productivity levels. Previous research has shown that dissolved organic nitrogen (DON) accounts for an average of 25% to 35% of TDN globally [16], highlighting the importance of DON in atmospheric nitrogen deposition calculations and suggesting that neglecting DON emissions can lead to significant errors in nitrogen deposition calculations. Therefore, DON plays a crucial role in determining wet deposition [11,17].
Previous studies have shown that the relative contribution of dissolved organic nitrogen (DON) to total dissolved nitrogen (TDN) varies across regions and is generally about 30% worldwide [1,16,18,19]. Rural or less industrialized areas often exhibit higher DON fractions because of lower anthropogenic emissions, whereas densely populated urban centers tend to have lower DON/TDN ratios [20]. This spatial variability highlights the significance of atmospheric dissolved inorganic nitrogen (DIN) derived from human activities and its contribution relative to riverine nitrogen inputs, which is essential for understanding how the unprecedented COVID-19-related emission reductions may have influenced nitrogen delivery to coastal waters.
Atmospheric nitrogen cycling is strongly influenced by interactions between natural marine processes and anthropogenic emissions. Marine aerosols containing Cl− can react heterogeneously with acidic species such as NO3− and SO42−, leading to chloride depletion and the formation of reactive chlorine compounds (e.g., ClNO2, HCl, and Cl2) that alter atmospheric oxidation and soil acidity [21,22,23]. Meanwhile, NH4+ derived mainly from agricultural activities readily reacts with non-sea-salt sulfate (nss-SO42−) originating from fossil fuel combustion, producing secondary inorganic aerosols that affect aerosol mass, hygroscopicity, and acidity [24,25]. The NH4+/nss-SO42− molar ratio is therefore a useful indicator of atmospheric neutralization and regional emission characteristics—higher ratios reflect NH4+-rich agricultural influence, while lower ratios are typically observed in industrial or marine-dominated regions [25,26]. Representative NH4+/nss-SO42− molar ratios reported for various regions are summarized in Table 1 to illustrate these contrasting emission environments. In addition to inorganic nitrogen, dissolved organic nitrogen (DON) plays an important but less understood role in atmospheric nitrogen cycling. DON arises from both primary emissions (natural and anthropogenic) and secondary formation through reactions involving aldehydes, hydrocarbons, and nitrogen oxides [27,28]. Understanding the relative contributions of these sources is essential to assess how human activities—including energy consumption changes and reduced emissions during the COVID-19 lockdown—have modified nitrogen composition and deposition in coastal and marine atmospheres. Therefore, statistical techniques such as principal component analysis (PCA) and positive matrix factorization (PMF) were applied in this study to identify the major sources of DON and to evaluate their temporal and spatial variability under changing anthropogenic conditions.

Table 1.
NH4+/SO42− molar ratios in various regions.
Global wet nitrogen (N) deposition shows strong spatial variability, with the Americas, Europe, and Southeast Asia identified as major emission regions [36,37]. The global average wet deposition rate is about 2.0 kg N ha−1 yr−1, but regional values differ markedly—approximately 3–5 kg N ha−1 yr−1 in North America and Europe, and exceeding 15 kg N ha−1 yr−1 in parts of Asia [38]. In China, strict emission control policies implemented since 2016 have gradually reduced atmospheric nitrogen emissions through 2020 [39,40].
In 2019, the COVID-19 pandemic occurred, leading to factors such as the closure of factories and a significant reduction in transportation, indirectly reducing air pollution emissions [41]. Previous studies have reported significant reductions in atmospheric nitrogen emissions during the COVID-19 lockdowns, such as a 9.6% decrease in total (dry + wet) nitrogen deposition in Danjiangkou in 2020 compared with 2019 due to China’s strict containment measures [42]. However, most investigations have focused on urban or terrestrial regions, while little is known about how these unprecedented emission reductions affected wet-deposited nitrogen species in remote coastal and offshore marine areas. Atmospheric nitrogen deposition is an important source of external nitrogen for coastal ecosystems, potentially influencing primary productivity and nutrient cycling.
The aim of this work was therefore to quantify the changes in concentrations, sources, and fluxes of dissolved nitrogen species (TDN, DIN, and DON) in rainwater at two representative sites—Matsu (coastal) and Pengjiayu (offshore island)—before, during, and after the COVID-19 outbreak. By comparing these temporal changes with shifts in emission sources, we sought to reveal how the pandemic-related emission reduction influenced nitrogen input to the adjacent marine environment.
2. Methodology
2.1. Sampling
The coastal sampling station in this study was established on the Matsu Islands (26.167° N, 119.917° E), located approximately 97 km west of mainland China and 220 km east of Taiwan Island, adjacent to the Taiwan Strait. The marine sampling station was set up at the Pengjiayu meteorological station (25.375° N, 122.041° E), which is surrounded by ocean areas and is situated 56 km from Taiwan Island. Moreover, the island is uninhabited, significantly reducing anthropogenic influences. Our sampling sites correspond to those reported by Chen et al. [43] and Hsieh et al. [44], respectively, as shown in Figure 1.
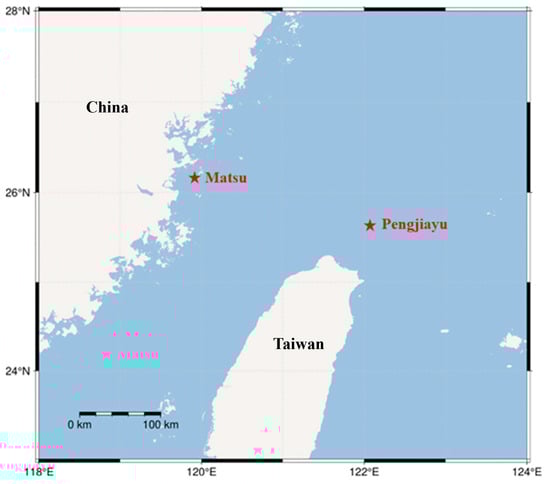
Figure 1.
Location of the sampling sites at Matsu (coastal area) and Pengjiayu (marine area), respectively.
Samples were collected from April 2020 to February 2024, with 101 and 102 samples collected in the coastal and marine areas, respectively. During the sampling period, one sample was collected in the coastal area during a typhoon event. This sample is considered to reflect a special event that may affect the overall data accuracy, so it was not included in the analysis. Rainwater samples were collected using stainless steel funnels with a diameter of 27 cm and 5 L amber glass bottles. Samples with a volume smaller than 500 mL were not collected to because this volume is insufficient for experimentation. Before experimentation, the samples were filtered through pre-ashed quartz fiber filters (20 mm, Millipore) into amber sample bottles and stored in a refrigerator at 4 °C. The samples were analyzed within one week. To prevent changes in the chemical composition, the samples were stored in a refrigerator for up to three weeks.
2.2. Chemical Analysis
In this study, two main experimental methods were employed:
- Ion chromatography (IC) for the analysis of major ions.
- Spectrophotometry for the analysis of nitrogen species.
After sample pretreatment, ion chromatography was used to analyze both anions and cations in the rainwater samples. Specifically, six ions were analyzed using ion chromatography: Na+, K+, Mg2+, Ca2+, Cl−, and SO42−. The purpose of studying these ions was to better understand the sources of aerosols in the area. Aerosols can originate not only from the ocean but also from external sources such as fossil fuel combustion, biomass burning, and crustal sources. Therefore, measuring the concentrations of major ions can help identify the sources of aerosols.
To analyze nitrogen species, the indophenol blue method described by Bower et al. [45] and the pink azo dye method described by Armstrong et al. [46] were utilized to determine NH4+ and NO2− concentrations, respectively. NO3− was determined using the method described by Pai et al. [47], in which the reagents are mixed and added to the sample, followed by a 25 min water bath at 55 °C, termination of the reaction in an ice bath, and a 10 min rest at room temperature before measurement.
In this study, inorganic nitrogen primarily consists of the sum of NO2−, NO3−, and NH4+, whereas organic nitrogen, owing to its diverse types in the environment, is relatively challenging to quantify. Total nitrogen is the sum of inorganic nitrogen and organic nitrogen and thus can be represented as follows:
Owing to the complexity of DON in the environment, an oxidation method can be utilized to convert all nitrogen species in rainwater samples into NO3− species. The TDN concentration can subsequently be determined via the measurement method described by Pai et al. [47]. Finally, the DON concentration can be obtained by subtracting the sum of DIN values from the TDN concentration using a deduction method.
To measure the concentration of DON in the samples, the method outlined by Bronk et al. [13] was employed. Potassium persulfate was added to the samples, which were then subjected to UV irradiation for 24 h to oxidize all the nitrogen species in the samples into NO3−. The NO3− concentration was subsequently determined using the aforementioned method for NO3−. To reduce vanadium chloride, ethylenediaminetetraacetic acid (EDTA), quinolone, and urea were employed as standard reagents to assess the reduction efficiency for TDN in the samples. Table 2 presents the reduction efficiency obtained in this experiment and the oxidation efficiency reported by Chen et al. [43] and Bronk et al. [13] to confirm whether the experimental results occur within a reasonable range. Although Bronk et al. [13] noted that the standard UV oxidation method can be unpredictable in practice, the efficiencies obtained in this study fall within the reasonable range reported in previous studies, indicating that the procedure was reliable under our experimental conditions. Furthermore, although Chen et al. [43] did not explicitly describe their analytical procedure, their research conducted on the Matsu Islands adopted the same UV oxidation method for nitrogen determination as used in the present study. The blank values and detection limits for anions, cations, and DIN species are listed in Table 3. When all the samples were analyzed, the detected concentrations were at least 3 standard deviations greater than the blank values.
Table 2.
DON percent recoveries compared with previous studies.
Table 3.
The blank values and detection limits in this study.
3. Results and Discussion
3.1. Meteorological Characteristics and Air Masses
The study period ranges from April 2020 to February 2024. The average temperatures in the coastal and marine areas were 18.7 ± 6.2 °C and 22.7 ± 4.4 °C, respectively, and the average wind speeds were 4.0 ± 0.7 m/s and 7.2 ± 1.2 m/s, respectively. The seasons in the study area were categorized as follows: March to May (spring), June to August (summer), September to November (autumn), and December to February (winter). Consequently, the coastal and marine areas exhibited the lowest temperatures in winter (11.9 ± 1.66 °C and 16.8 ± 1.05 °C, respectively) and the highest temperatures in summer (27.5 ± 0.71 °C and 28.2 ± 0.79 °C, respectively).
In terms of air mass sources, air mass backward trajectories (AMBTs) were employed to track the primary air mass sources. Data were obtained from the National Oceanic and Atmospheric Administration (NOAA) of the United States and integrated with the Hybrid Single-Particle Lagrangian Integrated Trajectory (HYSPLIT) model to better understand the air mass sources during the study period. In analyzing the AMBTs in this study, the air mass height was defined as 500 m to classify air mass sources [48]. Research has indicated that wet deposition can be influenced by the washout and rainout effects of rainfall [16]. Therefore, the background information of air masses from AMBTs can be used to trace the sources of nitrogen species in rainwater.
The air mass backward trajectory models in the coastal and marine areas are shown in Figure 2a and Figure 2b, respectively. Notably, 44% of the air masses in the coastal area originated from coastal Northeast China, 16% from inland Northwest China, 12% from the Northwest Pacific, and 27% from the coastal region of the South China Sea. In contrast, in the marine area, 38% of the air masses originated from northeastern China and inland regions, 27% from the southern East China Sea, 12% from the western Pacific, and 23% from Taiwan and the northern South China Sea. Therefore, it can be inferred that 44% of the air masses in the coastal areas were directly influenced by anthropogenic sources, whereas only 23% of the air masses in the marine area were directly affected by anthropogenic emissions.
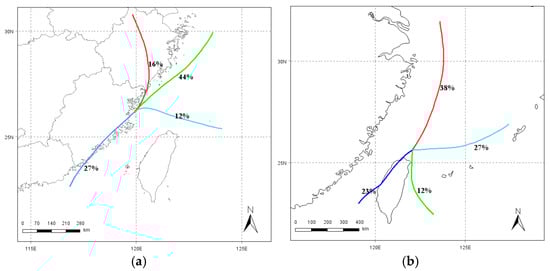
Figure 2.
HYSPLIT backward trajectory model in (a) coastal area and (b) marine area during sampling time.
3.2. Major Ion Concentrations
According to Wang et al. [49], the correlation between species and major ions can provide insights into the sources of species. Chen et al. [16,43] indicated that the main ion sources in this area are sea salt, fossil fuel combustion, and biomass burning. Figure 3a and Figure 3b show the seasonal changes in major ions in the coastal and marine study areas, respectively. The average concentrations of Na+ and Cl− in the marine area are higher (326 ± 322 μM and 345 ± 499 μM, respectively) than those in the coastal area (245 ± 133 μM and 255 ± 153 μM, respectively) because the marine area is surrounded by seas, primarily encompassing marine sources [50].
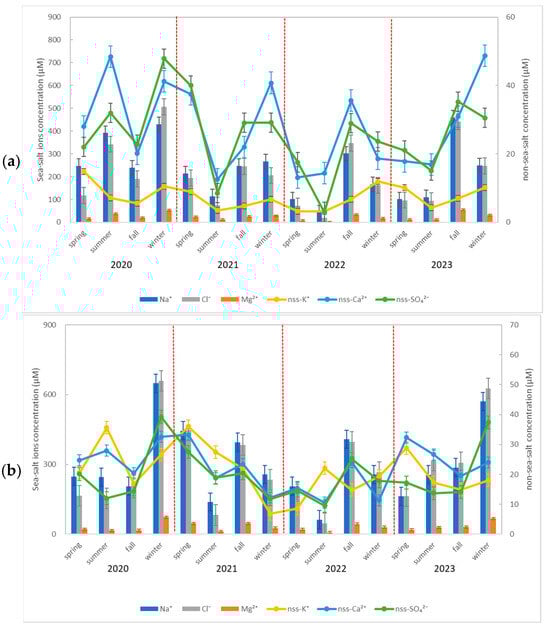
Figure 3.
Seasonal variations in major ions in the (a) coastal (b) marine area. The red dashed lines represent the separation between each year.
According to Chen et al. [16] and Chen and Huang [24], Na+, Mg2+, and Cl− are considered marine ions, whereas non-sea-salt ions (nss-ions), such as K+, Ca2+, and SO42−, can serve as indicators of biomass burning, crustal elements, and fossil fuel combustion. The concentration of nss-ions can be determined as follows:
Among these ions, nss-SO42− is derived mainly from fossil fuel combustion and is considered an indicator of anthropogenic sources; nss-K+ is considered an indicator of biomass burning sources; and nss-Ca2+ is a component of dust and can thus be used as an indicator of crustal sources [51,52].
In Figure 3a, the highest peaks of nss-ions in the coastal area are mainly concentrated in winter because of the prevailing northeast monsoon, which brings continental sources and anthropogenic pollution to the coastal area. In summer, the concentrations are lower because the air masses are influenced by the southwest monsoon, which originates from marine sources and is thus less notably affected by anthropogenic and continental influences. According to Figure 3b, the trend in the marine area is less distinct, likely because the area is farther from the continent and thus less affected by continental pollution.
Throughout the year, the concentration of nss-ions in both study areas showed an increasing trend in 2021. This could be attributed to the increase in human activities during the easing period after the first outbreak of the pandemic in 2021, which led to higher concentrations. In 2022, the second outbreak of the pandemic resulted in reduced human activities, causing a sharp decrease in the concentration of nss-ions. It was not until 2023, when the pandemic had stabilized, that human activities began to increase.
In the atmosphere, Na+, Mg2+, and Cl− ions are primarily sea-salt ions originating from sea spray. However, when air masses transition between land and sea, sea-salt ions can react with acidic substances (e.g., sulfuric acid and nitric acid) to form HCl gas, which then dissipates, leading to a reduction in the Cl− ion concentration. This phenomenon is referred to as the chloride depletion reaction [21,53]. The reaction for chloride depletion in the atmosphere is as follows [21]:
where denotes acidic species (e.g., sulfuric acid or nitric acid), and denotes salts formed after the chloride depletion reaction. On the basis of the above chemical equation, nitric acid and sulfuric acid can react with sea-salt ions to form salts, and sulfuric acid and nitric acid in the atmosphere are considered to originate from fossil fuel combustion and anthropogenic sources [24]. Therefore, chloride depletion can be determined through the molar concentration ratio of [Cl−]/[Na+] in rainwater samples to that in seawater.
Figure 4 shows the molar concentration ratio of [Cl−]/[Na+] in the two areas compared with that in seawater. In the coastal and marine areas, the [Cl−]/[Na+] ratios are 1.07 and 1.12, respectively, both of which are lower than the [Cl−]/[Na+] ratio in seawater (1.17). This result indicates that chloride depletion reactions occur in both areas. To better understand the seasonal variations and annual changes in chloride depletion in the two study areas, calculations were performed on the basis of the equation of Su et al. [21], and the results are shown in Figure 5. The calculation is as follows:
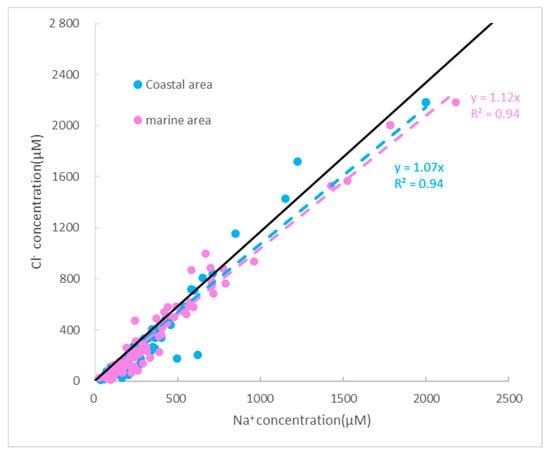
Figure 4.
Cl−/Na+ molar ratio in the coastal and marine areas. The black line represents the Cl−/Na+ ratio in the ocean (1.17).
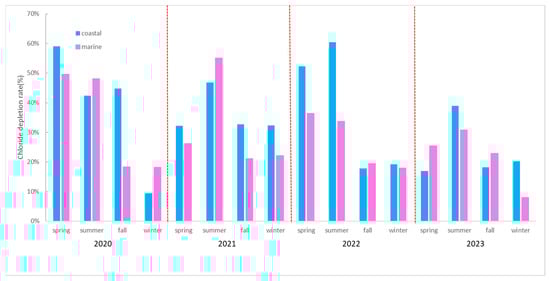
Figure 5.
Seasonal variations in Cl−/Na+ ratio in the coastal and marine area. The red dashed lines represent the separation between each year.
In Figure 5, the average chloride depletion in the coastal area was 33%, whereas in the marine area, it was 28.1%. This result indicates that the coastal areas was more greatly affected by anthropogenic activities than the marine area was. In terms of seasonal variations, both study areas exhibited greater depletions in spring and summer. This is due to enhanced photochemical reactions that facilitate the conversion of nitrogen dioxide (NO2) and sulfur dioxide (SO2) gases into NO3− and SO42−, respectively, leading to increased chloride depletion reactions [34,54].
In terms of annual changes, chloride depletion in the coastal area decreased by approximately 30% after the pandemic compared with that before the pandemic; in the marine area, chloride depletion decreased by approximately 37%. This could be attributed to the impact of the COVID-19 outbreak, when the Chinese government implemented home isolation policies, significantly reducing emissions from factories and vehicles. Consequently, the concentrations of NO3− and SO42− in the atmosphere decreased, leading to a reduction in chloride depletion reactions.
3.3. TDN, DIN, and DON Species Concentrations
Table 4 and Table 5 provide the monthly average DIN and DON concentrations in the coastal and marine areas, respectively. Because typhoon events are considered special cases that can affect data accuracy, they were not considered in this study. The average concentrations of TDN in the coastal and marine areas during the study period were 160 ± 77.4 μM and 63.8 ± 58.1 μM, respectively. In the coastal area, the highest TDN concentration was 348 μM (in April 2021), and the lowest value was 9.8 μM (in July 2022). In the marine area, the maximum TDN concentration was 280 μM (in January 2021), with a minimum value of 9.4 μM (in September 2023). The average DIN concentrations were 118 ± 54.6 μM and 41.1 ± 33.7 μM, whereas the average DON concentrations were 35.0 ± 27.6 μM and 21.4 ± 27.6 μM in the coastal and marine areas, respectively. According to the above results, DIN (p = 0.04) in wet deposition is significantly influenced by climatic conditions and aerosol sources. Lower DIN concentrations occurred in summer because of the southwest monsoon, whereas the higher concentrations during the other seasons were caused by the northeast monsoon. In contrast, there was no clear seasonal variation in the DON (p > 0.05) concentration, suggesting complex sources of DON in the atmosphere [1,11,17].
Table 4.
Nitrogen species monthly concentration in coastal area (μM).
Table 5.
Nitrogen species monthly concentration in marine area (μM).
In terms of the annual variation in the DIN concentration, the DIN concentration in the coastal area decreased from 138 μM in 2020 to 104 μM in 2023, whereas that in the marine area decreased from 46.1 μM in 2020 to 45.5 μM in 2023. This indicates a declining trend in the DIN concentration in the coastal area following the impact of COVID-19 in 2020. However, in the marine area, the DIN concentrations were low in 2022 (27.3 μM) because of the impact of the second outbreak of the COVID-19 pandemic. In other years, the DIN concentrations did not significantly change and were less greatly affected by anthropogenic influences in marine areas.
With respect to DIN species, Figure 6 shows the annual percentage trends of NO3− and NH4+ in the two study areas. In the coastal area, NO3− and NH4+ accounted for 60.4 ± 11.5% and 39.6 ± 11.5% of the total DIN, respectively. In the marine area, NO3− and NH4+ accounted for 57.8 ± 14.9% and 42.2 ± 14.9%, respectively, of the total DIN. Figure 6 revealed that the contribution of NO3− in both study areas decreased during the study period. This suggests that after the outbreak of the COVID-19 pandemic in 2020 and the restrictions on nitrogen emissions implemented by the Chinese government, the concentration of anthropogenic NO3− decreased. The atmosphere began to shift from nitrogen oxides (NOx) to reduced nitrogen (NHy) as the primary form [12,55].
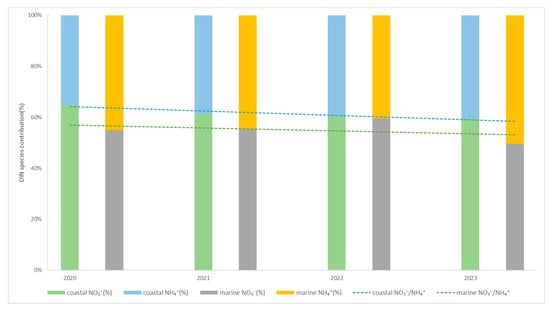
Figure 6.
The trend of NO3− and NH4+ in DIN annual percentage in the coastal and marine area.
As described by Feng et al. [56] and Zhang et al. [39], NH4+ reacts with SO42− and NO3− to form secondary aerosols. A comparison of the NH4+/nss-SO42− ratios in both areas is shown in Figure 7. The black lines represent the molar ratios of (NH4)2SO4 and NH4HSO4 in the atmosphere. The results indicate that in the coastal area, air masses originate from both land and sea sources and are more influenced by human activities. Therefore, NH4HSO4 and (NH4)2SO4 are present primarily in the atmosphere in the coastal area. In contrast, in the marine area, due to the notable maritime influences and lower anthropogenic influences, NH4+ is not sufficient to react completely with nss-SO42−. As a result, NH4HSO4 is present primarily in the atmosphere in the marine area.
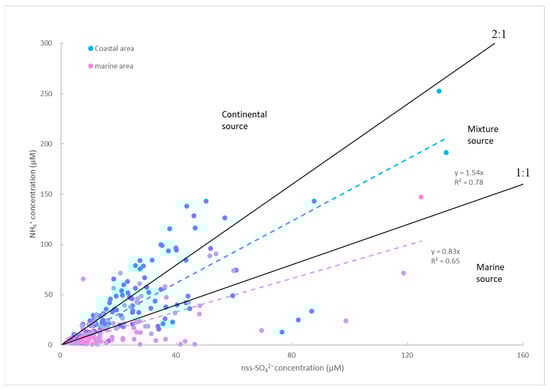
Figure 7.
The molar ratio of [NH4+]/[nss-SO42−] in the coastal and marine area. The black lines represent the molar ratio of 2:1 and 1:1.
Figure 8 shows the annual variations in [NH4+]/[nss-SO42−] for the two study areas. According to previous research, O3 and the relative humidity (RH) are the main factors influencing the oxidation of SO2 gas to nss-SO42− in the atmosphere [57]. In 2022, the [NH4+]/[nss-SO42−] ratios in both study areas were significantly lower because, during the second outbreak of the COVID-19 pandemic, anthropogenic activities that produced NO2 and SO2 gases decreased. This led to an increase in the atmospheric O3 concentration and a higher RH that year. The atmospheric SO2 gas is more significantly influenced by RH and O3, resulting in a higher efficiency of oxidation to nss-SO42−. Consequently, the [NH4+]/[nss-SO42−] ratios were lower in both study areas in 2022.
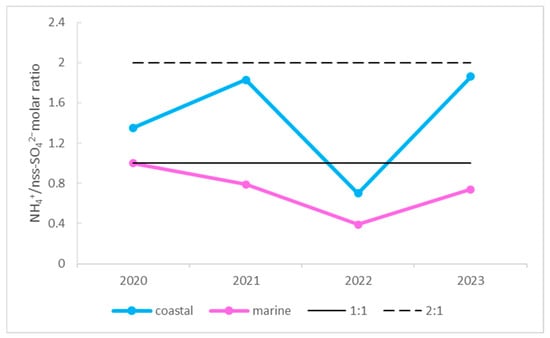
Figure 8.
The annual variation in the molar ratio of [NH4+]/[nss-SO42−] in the coastal and marine area.
The DON concentration in the coastal area was more than twice as high as that in the marine area. This difference can be attributed to the proximity of the coastal area to mainland China, which experiences greater anthropogenic influences (such as fossil fuel combustion and biomass burning) and natural emissions (biogenic sources), leading to higher DON concentrations. Table 4 and Table 5 indicate that from 2021 to 2022, both areas experienced lower DON concentrations, which may be attributed to the significant reduction in human activities during the COVID-19 outbreak.
Previous studies have indicated that DON accounts for approximately 15% to 30% of the total TDN in the atmosphere [58,59]. In this study, the DON/TDN ratios reached 24% in the coastal area and 32% in the marine area. Figure 9 shows the yearly proportions of the DON concentration in the two study areas. In 2022, both study areas experienced the lowest proportion of DON, which could be attributed to the impact of the COVID-19 pandemic leading to a lower DON proportion. Compared with that in 2021, the DON concentration in the marine area decreased by 35.4 μM compared with that in 2021, with a proportional decrease of approximately 21%. These findings indicate that the reduction in the DON proportion in the marine area is related to reduced anthropogenic activities. However, in the coastal area, the DON concentration decreased by approximately 17.4 μM in 2022, but the proportional decrease in DON was only approximately 5.8%. On the basis of these results, it can be inferred that the coastal area contains more complex sources of DON species, resulting in a less decreasing trend in the DON proportion.
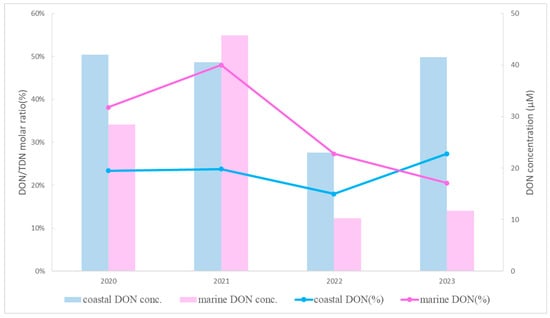
Figure 9.
The yearly variation in DON concentration and DON/TDN molar ratio in coastal and marine area.
3.4. Correlations and Source Identification of Nitrogen Species
To better understand the sources and correlations of nitrogen species, non-sea-salt ions were utilized as source-specific indicators for correlation and source analysis. In this study, the source indicators of non-sea-salt ions were identified based on previous studies [16,24,60,61]. In this study, the Pearson correlation coefficient, principal component analysis (PCA), and positive matrix factorization (PMF) methods were used. Notably, the correlation method used by Chen and Chen [62], the PCA method outlined by Chen and Chen [62] and the PMF method used by Chen et al. [51] were adopted. Table 6 presents the correlations for both study areas, while Table 7 summarizes the nitrogen sources during the pandemic and non-pandemic periods.
Table 6.
Correlation analysis (r) of wet deposition in sampling site. The pink color represents the marine area and the blue color represents the coastal area. (* indicates p-value < 0.05, and bold type indicates correlation coefficient > 0.7).
Table 7.
The major sources of NO3−, NH4+, and DON species during pandemic and non-pandemic period in coastal and marine areas.
In Table 6, NO3− in the coastal and marine areas was strongly correlated with nss-Ca2+ (r = 0.80 and 0.77, respectively) and with nss-SO42− (r = 0.89 and 0.78, respectively). NO3− also exhibited high and moderate correlations (r = 0.50~0.84), respectively, with marine ions. This result indicates that NO3− in both regions originates from inland fossil fuel combustion and is transported to the study areas via the ocean. The NH4+ ions in the coastal and marine areas exhibited moderate and low correlations with marine ions (r = 0.52~0.54 and 0.33~0.41, respectively) and high and moderate correlations with nss-SO42− (r = 0.76 and 0.64, respectively). Therefore, it could be inferred that the primary source of NH4+ in both regions is the reaction of NH4+ with nss-SO42− to form secondary aerosols (NH4HSO4 and (NH4)2SO4), hence resulting in a greater correlation [24].
Notably, DON in both areas exhibited moderate correlations with marine ions (r = 0.49~0.53 and 0.43~0.53, respectively), moderate correlations with nss-Ca2+ (r = 0.52 and 0.69, respectively), and high and moderate correlations with nss-SO42− (r = 0.71 and 0.69, respectively). This result suggests that DON mainly originates from inland fossil fuel combustion and is carried to the study areas by air masses.
Table 7 provides the sources of nitrogen species during the pandemic and non-pandemic periods. During the non-pandemic period, NO3− in both study areas was associated with the same sources as those of nss-SO42− and nss-Ca2+, reflecting a fossil fuel combustion source from inland China. For NH4+ species, nss-K+ exhibited the same factor during the non-pandemic period in the coastal area, reflecting an agricultural source. However, nss-SO42− exhibited the same source as NH4+ during the COVID-19 pandemic period in both study areas and during the non-pandemic period in the marine area, reflecting secondary aerosols of NH4HSO4 and (NH4)2SO4 compounds in the atmosphere, as previously discussed. For DON, DIN species (NH4+ and NO3−) attained the same factor in the coastal and marine areas during the pandemic period and in the marine area during the non-pandemic period, whereas nss-Ca2+ attained the same factor as that of DON in the coastal area during the pandemic period. The results suggest that natural emissions from inland China are the major source in the coastal area during non-pandemic periods, whereas secondary aerosols from the atmosphere are the major source during pandemic periods during both the pandemic and non-pandemic periods in the marine area.
3.5. Fluxes of Nitrogen Species
According to the methods outlined in Zhang et al. [52] and Chen et al. [16] for calculating the flux of wet deposition species, the nitrogen species flux in both areas can be calculated as follows:
where denotes the wet deposition flux (μmol m−2 d−1), denotes the ion concentration in an individual sample (μmol L−1), and denotes the rainfall amount at the time of sample collection (mm day−1).
Because the wet deposition flux is the product of rainfall and nitrogen species concentrations, there was no significant difference in the annual rainfall during the study period. During the sampling period, the cumulative rainfall amounts in the coastal and marine areas were 3122 and 5051 mm, respectively. The highest TDN, DIN, and DON daily fluxes in the coastal area occurred in September 2020, with a TDN flux of 18.0 μmol m−2 d−1, a DIN flux of 11.6 μmol m−2 d−1, and a DON flux of 6.9 μmol m−2 d−1. In the marine area, the highest TDN and DIN daily fluxes occurred in May 2020, with a TDN flux of 12.6 μmol m−2 d−1 and DIN flux of 11.4 μmol m−2 d−1, whereas the highest DON flux occurred in September 2020, with a value of 1.64 μmol m−2 d−1.
To better understand the impact of the COVID-19 pandemic on nitrogen deposition in the two study areas, the annual flux variations in the coastal and marine areas were determined, as shown in Figure 10a and Figure 10b, respectively. During the study period, there was a significant decreasing trend in the TDN, DIN, and DON concentrations from 2021 to 2022 in both study areas. This decline was due to the COVID-19 pandemic, during which the government of China implemented home isolation policies that significantly reduced anthropogenic emissions. By the end of 2022 and the beginning of 2023, as the pandemic began to subside, human activities gradually increased. However, the nitrogen emission levels remained lower than those before the pandemic outbreak in 2020. In the coastal area, the annual variation trends of the TDN, DIN, and DON fluxes are −16.7, −12.1, and −5.05 mmol m−2 yr−1, respectively. In the marine area, the trends are −8.42, −4.32, and −4.11 mmol m−2 yr−1, respectively. According to the above results, there an overall negative growth trend in nitrogen deposition. This decline can be attributed to the impact of the COVID-19 pandemic from 2020 to 2023, during which the Chinese government implemented home isolation policies. This led to a significant decrease in nitrogen deposition in both study areas [40,41,42].
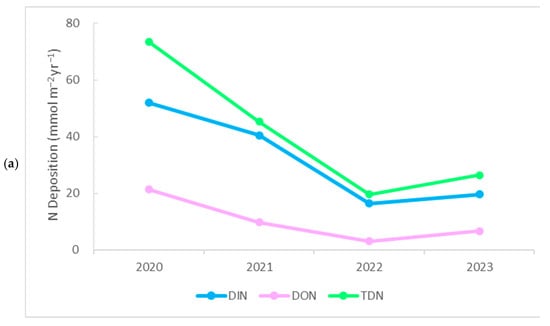
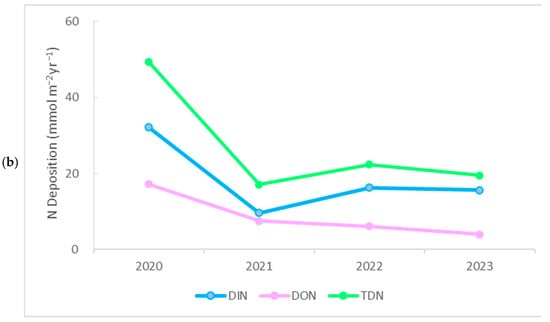
Figure 10.
The annual flux variations for TDN, DIN, and DON in the (a) coastal and (b) marine area.
3.6. The Impact of COVID-19 Lockdowns on Marine New Productivity
To investigate the impact of the COVID-19 lockdown on marine primary productivity, we estimated the yearly primary productivity of nitrogen species in both study areas. According to Yan and Kim [19], IN species can be fully bioavailable, whereas ON species exhibit a lower bioavailability, ranging from 20 to 80%. The new production equation method by Chen and Huang [63] is as follows:
where and denote the inorganic and organic nitrogen fluxes in wet deposition, respectively, is the ON bioavailability parameter, which ranges from 0.2 to 0.8, and 6.625 denotes the constant ratio of C:N in marine phytoplankton proposed by Redfield in 1934.
This method was adopted in the present study because the environmental conditions and regional characteristics in Chen and Huang’s research are highly comparable to those of our study area, making it suitable for evaluating new production under similar marine settings.
With this approach and on the basis of the coastal East China Sea particulate organic carbon flux (21.6 g C m−2 yr−1) calculated by Wang et al. [64], the new products supplied from the atmosphere via wet deposition in this study are listed in Table 8. In 2020, the level of new production in the coastal and marine areas was 5.83 and 3.92 g C m−2 yr−1, respectively. By 2023, the primary productivity in the coastal and marine areas had decreased to 2.10 and 1.55 g C m−2 yr−1, respectively. According to the results, the coastal area exhibited a lower new productivity of DIN and DON than that obtained by Chen et al. [43], which further demonstrates the significant effectiveness of China’s energy policies in reducing nitrogen emissions. In terms of the annual variation, the coastal and marine areas exhibited reductions of 17.3% and 11.0%, respectively. These results show that the reduction in anthropogenic activities led to a significant decrease in marine primary productivity in both the coastal and marine areas during the COVID-19 lockdown period.
Table 8.
The yearly new production (g C m−2 yr−1) and the proportion of new production from nitrogen species via wet deposition in coastal and marine areas.
4. Conclusions
In this study, rainwater samples were collected from the selected coastal and marine areas for concentration, correlation, and source analyses of TDN, DIN, DON, and major ions. In terms of major ion concentrations, the Cl−/Na+ ratio in both the coastal (1.07) and marine (1.12) areas was lower than that in the ocean (1.17), indicating that reactions between anthropogenic pollutant emissions such as SO42− and NO3− and sea salt ions (NaCl) led to chloride depletion reactions. The yearly chloride depletion rate decreased after the COVID-19 lockdown period in 2020.
With respect to the DIN (NO3− and NH4+) concentrations and seasonal analysis, higher values were observed in spring and winter because of the influence of the northeast monsoon (continental air masses), whereas lower values were observed in summer because of the southwest monsoon (marine air masses). The NH4+/nss-SO42− ratio analysis indicated values between 1 and 2 in the coastal area, reflecting mixed sources of air masses (land and ocean), whereas the values were less than 1 in the marine area because of marine-influenced air masses and relatively minor anthropogenic impacts. In terms of yearly changes, the NH4+/nss-SO42− ratio in both study areas decreased during the lockdown period because of reduced anthropogenic activities, resulting in higher O3 concentrations and RH levels in 2022.
Previous studies have revealed complex sources of DON, including anthropogenic emissions (biomass burning and fossil fuel combustion) and natural emissions (land/plant emissions) [11,13,14]. The average DON concentration in the coastal area was higher than that in the marine area, with higher values observed in autumn in the coastal area and in winter and spring in the marine area. The DON/TDN ratio was 24% in the coastal area and 32% in the marine area. At the yearly scale, DON/TDN decreased by 40% in the coastal area and by 78% in the marine area in 2022, indicating complex sources of DON in the coastal area and the major contribution of anthropogenic sources in the marine area.
According to the correlation analysis results, NO3− was highly correlated with nss-SO42−, indicating that it is a fossil fuel combustion source. NH4+ also attained a high correlation with nss-SO42− because of the acid-base neutralization reactions between NH4+ and nss-SO42− in the atmosphere. DON in both study areas exhibited moderate to high correlations with nss-Ca2+ and nss-SO42−, indicating that fossil fuel combustion and natural emissions are the major sources of DON in the coastal and marine areas, respectively.
According to PCA and PMF results, it is evident that during the COVID-19 pandemic period, NO3−, NH4+, and DON in the coastal area were associated with the same factors. This indicates that the nitrogen species primarily originated from secondary aerosols formed through atmospheric reactions following fossil fuel combustion. However, during non-pandemic periods, DON in the coastal area was distinctly separate from NO3− and NH4+ in the different components and was found in the same component as nss-Ca2+ in the PMF results. These findings suggest that the primary source of DON in the coastal area is natural emissions from inland regions. In the marine area, DON, NO3−, and NH4+ all occurred within the same component, indicating that the primary source of DON in the marine area was secondary aerosols formed through atmospheric reactions following anthropogenic activities.
In terms of flux, the wet deposition flux is calculated as the product of rainfall and concentration, suggesting that months with higher rainfall exhibit higher wet deposition fluxes. On the yearly average, the coastal area exhibited higher DIN and DON fluxes than the marine area did because of the closer anthropogenic emission sources, and DON originated from both anthropogenic and natural sources. In terms of annual flux changes, the DIN and DON fluxes in the coastal area (−12.1 and −5.05 mmol m−2 yr−1, respectively) and the marine area (−4.32 and −4.11 mmol m−2 yr−1, respectively) showed a decreasing trend. In regard to new productivity, wet deposition supported 27.1% and 18.2% of new production in the coastal and marine areas, respectively, in 2020. Compared with that noted by Chen et al. [43], lower new productivity was found in this study because of China’s energy policies. On a yearly basis, new production decreased by 17.3% and 11.0%, respectively, from 2020 to 2023. These results indicate that, due to the impact of the COVID-19 pandemic, reduced anthropogenic activities significantly impacted the nitrogen cycle in biogeochemistry.
Author Contributions
Conceptualization, H.-Y.C. and J.-H.L.; methodology, H.-Y.C. and J.-H.L.; software, J.-H.L.; validation, H.-Y.C. and F.T.; formal analysis, H.-Y.C.; investigation, H.-Y.C. and J.-H.L.; resources, H.-Y.C.; data curation, H.-Y.C. and J.-H.L.; writing—original draft preparation, H.-Y.C., J.-H.L. and F.T.; writing—review and editing, H.-Y.C.; visualization, J.-H.L. and F.T.; supervision, H.-Y.C.; project administration, H.-Y.C.; funding acquisition, H.-Y.C. All authors have read and agreed to the published version of the manuscript.
Funding
This research was funded by the National Science and Technology Council of the Republic of China, grant number NSTC 113-2611-M-019-013 and NSTC 114-2611-M-019-011.
Data Availability Statement
The original contributions presented in this study are included in the article. Further inquiries can be directed to the corresponding author.
Acknowledgments
The sample collection for this study was assisted by Kuo-Ping Chiang’s laboratory at the Blue Tears Memorial Hall in Matsu, for which we extremely grateful.
Conflicts of Interest
The authors declare no conflicts of interest.
References
- Xi, Y.; Wang, Q.; Zhu, J.; Yang, M.; Hao, T.; Chen, Y.; Zhang, Q.; He, N.; Yu, G. Atmospheric wet organic nitrogen deposition in China: Insights from the national observation network. Sci. Total Environ. 2023, 898, 165629. [Google Scholar] [CrossRef]
- Yu, G.; Jia, Y.; He, N.; Zhu, J.; Chen, Z.; Wang, Q.; Piao, S.; Liu, X.; He, H.; Guo, X.; et al. Stabilization of atmospheric nitrogen deposition in China over the past decade. Nat. Geosci. 2019, 12, 424–429. [Google Scholar] [CrossRef]
- Fowler, D.; Coyle, M.; Skiba, U.; Sutton, M.A.; Cape, J.N.; Reis, S.; Sheppard, L.J.; Jenkins, A.; Grizzetti, B.; Galloway, J.N.; et al. The global nitrogen cycle in the twenty-first century. Philos. Trans. R. Soc. B Biol. Sci. 2013, 368, 20130164. [Google Scholar] [CrossRef]
- Liu, X.; Zhang, Y.; Han, W.; Tang, A.; Shen, J.; Cui, Z.; Vitousek, P.; Erisman, J.W.; Goulding, K.; Christie, P.; et al. Enhanced nitrogen deposition over China. Nature 2013, 494, 459–462. [Google Scholar] [CrossRef]
- Dentener, F.; Drevet, J.; Lamarque, J.F.; Bey, I.; Eickhout, B.; Fiore, A.M.; Hauglustaine, D.; Horowitz, L.W.; Krol, M.; Kulshrestha, U.C.; et al. Nitrogen and sulfur deposition on regional and global scales: A multimodel evaluation. Glob. Biogeochem. Cycles 2006, 20, GB4003. [Google Scholar] [CrossRef]
- Duan, Y.; Xu, M.; Gao, S.; Liu, H.; Huang, S.; Wang, B. Long-term incorporation of manure with chemical fertilizers reduced total nitrogen loss in rain-fed cropping systems. Sci. Rep. 2016, 6, 33611. [Google Scholar] [CrossRef]
- Vet, R.; Artz, R.S.; Carou, S. A global assessment of precipitation chemistry and deposition of sulfur, nitrogen, sea salt, base cations, organic acids, acidity and pH, and phosphorus. Atmos. Environ. 2014, 93, 1–2. [Google Scholar] [CrossRef]
- Chang, C.T.; Yang, C.J.; Huang, K.H.; Huang, J.C.; Lin, T.C. Changes of precipitation acidity related to sulfur and nitrogen deposition in forests across three continents in north hemisphere over last two decades. Sci. Total Environ. 2022, 806, 150552. [Google Scholar] [CrossRef]
- Liu, L.; Xu, W.; Lu, X.; Zhong, B.; Guo, Y.; Lu, X.; Zhao, Y.; He, W.; Wang, S.; Zhang, X.; et al. Exploring global changes in agricultural ammonia emissions and their contribution to nitrogen deposition since 1980. Proc. Natl. Acad. Sci. USA 2022, 119, e2121998119. [Google Scholar] [CrossRef]
- Liu, X.J.; Xu, W.; Du, E.Z.; Tang, A.H.; Zhang, Y.; Zhang, Y.Y.; Wen, Z.; Hao, T.X.; Pan, Y.P.; Zhang, L.; et al. Environmental impacts of nitrogen emissions in China and the role of policies in emission reduction. Philos. Trans. R. Soc. A Math. Phys. Eng. Sci. 2020, 378, 20190324. [Google Scholar] [CrossRef] [PubMed]
- Zhang, Z.E.; Li, J.; Zhang, R.; Tian, C.; Sun, Z.; Li, T.; Han, M.; Yu, K.; Zhang, G. Increase in agricultural-derived NHx and decrease in coal combustion-derived NOx result in atmospheric particulate N-NH4+ surpassing N-NO3− in the South China sea. Environ. Sci. Technol. 2024, 58, 6682–6692. [Google Scholar] [CrossRef] [PubMed]
- Zhang, Q.; Guo, X.; Zhao, T.; Jin, C.; Xiao, C.; He, Y. Atmospheric organic nitrogen deposition around the Danjiangkou reservoir: Fluxes, characteristics and evidence of agricultural source. Environ. Pollut. 2024, 341, 122906. [Google Scholar] [CrossRef] [PubMed]
- Bronk, D.A.; Lomas, M.W.; Glibert, P.M.; Schukert, K.J.; Sanderson, M.P. Total dissolved nitrogen analysis: Comparisons between the persulfate, UV and high temperature oxidation methods. Mar. Chem. 2000, 69, 163–178. [Google Scholar] [CrossRef]
- Cape, J.N.; Cornell, S.E.; Jickells, T.D.; Nemitz, E. Organic nitrogen in the atmosphere—Where does it come from? A review of sources and methods. Atmos. Res. 2011, 102, 30–48. [Google Scholar] [CrossRef]
- Seitzinger, S.P.; Sanders, R.W. Atmospheric inputs of dissolved organic nitrogen stimulate estuarine bacteria and phytoplankton. Limnol. Oceanogr. 1999, 44, 721–730. [Google Scholar] [CrossRef]
- Chen, Y.X.; Chen, H.Y.; Wang, W.; Yeh, J.X.; Chou, W.C.; Gong, G.C.; Tsai, F.J.; Huang, S.J.; Lin, C.T. Dissolved organic nitrogen in wet deposition in a coastal city (Keelung) of the southern East China sea: Origin, molecular composition and flux. Atmos. Environ. 2015, 112, 20–31. [Google Scholar] [CrossRef]
- Yu, X.; Li, D.; Li, D.; Zhang, G.; Zhou, H.; Li, S.; Song, W.; Zhang, Y.; Bi, X.; Yu, J.; et al. Enhanced wet deposition of water-soluble organic nitrogen during the harvest season: Influence of biomass burning and in-cloud scavenging. J. Geophys. Res. Atmos. 2020, 125, e2020JD032699. [Google Scholar] [CrossRef]
- Jiang, C.M.; Yu, W.T.; Ma, Q.; Xu, Y.G.; Zou, H.; Zhang, S.C.; Sheng, W.P. Atmospheric organic nitrogen deposition: Analysis of nationwide data and a case study in Northeast China. Environ. Pollut. 2013, 182, 430–436. [Google Scholar] [CrossRef]
- Yan, G.; Kim, G. Sources and fluxes of organic nitrogen in precipitation over the Southern East Sea/Sea of Japan. Atmos. Chem. Phys. 2015, 15, 2761–2774. [Google Scholar] [CrossRef]
- Chen, Z.; Huang, X.; Huang, C.; Yang, Y.; Yang, H.; Zhang, J.; Huang, T. High atmospheric wet nitrogen deposition and major sources in two cities of Yangtze river delta: Combustion-related NH3 and non-fossil fuel NOx. Sci. Total Environ. 2022, 806, 150502. [Google Scholar] [CrossRef]
- Su, B.; Wang, T.; Zhang, G.; Liang, Y.; Lv, C.; Hu, Y.; Li, L.; Zhou, Z.; Wang, X.; Bi, X. A review of atmospheric aging of sea spray aerosols: Potential factors affecting chloride depletion. Atmos. Environ. 2022, 290, 119365. [Google Scholar] [CrossRef]
- Hoffmann, E.H.; Tilgner, A.; Wolke, R.; Herrmann, H. Enhanced chlorine and bromine atom activation by hydrolysis of halogen nitrates from marine aerosols at polluted coastal areas. Environ. Sci. Technol. 2019, 53, 771–778. [Google Scholar] [CrossRef]
- Qiu, X.; Ying, Q.; Wang, S.; Duan, L.; Wang, Y.; Lu, K.; Wang, P.; Xing, J.; Zheng, M.; Zhao, M.; et al. Significant impact of heterogeneous reactions of reactive chlorine species on summertime atmospheric ozone and free-radical formation in North China. Sci. Total Environ. 2019, 693, 133580. [Google Scholar] [CrossRef] [PubMed]
- Chen, H.Y.; Huang, S.Z. Effects of atmospheric dry deposition on external nitrogen supply and new production in the Northern South China Sea. Atmosphere 2018, 9, 386. [Google Scholar] [CrossRef]
- Silvern, R.F.; Jacob, D.J.; Kim, P.S.; Marais, E.A.; Turner, J.R.; Campuzano-Jost, P.; Jimenez, J.L. Inconsistency of ammonium–sulfate aerosol ratios with thermodynamic models in the eastern US: A possible role of organic aerosol. Atmos. Chem. Phys. 2017, 17, 5107–5118. [Google Scholar] [CrossRef]
- Behera, S.N.; Betha, R.; Balasubramanian, R. Insights into chemical coupling among acidic gases, ammonia and secondary inorganic aerosols. Aerosol Air Qual. Res. 2013, 13, 1282–1296. [Google Scholar] [CrossRef]
- Galloway, M.M.; Chhabra, P.S.; Chan, A.W.H.; Surratt, J.D.; Flagan, R.C.; Seinfeld, J.H.; Keutsch, F.N. Glyoxal uptake on ammonium sulphate seed aerosol: Reaction products and reversibility of uptake under dark and irradiated conditions. Atmos. Chem. Phys. 2009, 9, 3331–3345. [Google Scholar] [CrossRef]
- Perring, A.E.; Pusede, S.E.; Cohen, R.C. An observational perspective on the atmospheric impacts of alkyl and multifunctional nitrates on ozone and secondary organic aerosol. Chem. Rev. 2013, 113, 5848–5870. [Google Scholar] [CrossRef]
- Remoundaki, E.; Kassomenos, P.; Mantas, E.; Mihalopoulos, N.; Tsezos, M. Composition and mass closure of PM2.5 in urban environment (Athens, Greece). Aerosol Air Qual. Res. 2013, 13, 72–82. [Google Scholar] [CrossRef]
- Behera, S.N.; Sharma, M. Investigating the potential role of ammonia in ion chemistry of fine particulate matter formation for an urban environment. Sci. Total Environ. 2010, 408, 3569–3575. [Google Scholar] [CrossRef]
- Deshmukh, D.K.; Deb, M.K.; Tsai, Y.I.; Mkoma, S.L. Water soluble ions in PM2.5 and PM1 aerosols in durg city, Chhattisgarh, India. Aerosol Air Qual. Res. 2011, 11, 696–708. [Google Scholar] [CrossRef]
- Stone, E.A.; Yoon, S.C.; Schauer, J.J. Chemical characterization of fine and coarse particles in Gosan, Korea during springtime dust events. Aerosol Air Qual. Res. 2011, 11, 31–43. [Google Scholar] [CrossRef]
- Zhu, L.; Chen, Y.; Guo, L.; Wang, F. Estimate of dry deposition fluxes of nutrients over the East China sea: The implication of aerosol ammonium to non-sea-salt sulfate ratio to nutrient deposition of coastal oceans. Atmos. Environ. 2013, 69, 131–138. [Google Scholar] [CrossRef]
- Hsu, S.C.; Liu, S.C.; Kao, S.J.; Jeng, W.L.; Huang, Y.T.; Tseng, C.M.; Tsai, F.; Tu, J.Y.; Yang, Y. Water-soluble species in the marine aerosol from the northern South China sea: High chloride depletion related to air pollution. J. Geophys. Res. Atmos. 2007, 112, D19304. [Google Scholar] [CrossRef]
- Zhang, R.; Jing, J.; Tao, J.; Hsu, S.C.; Wang, G.; Cao, J.; Lee, C.S.L.; Zhu, L.; Chen, Z.; Zhao, Y.; et al. Chemical characterization and source apportionment of PM2.5 in Beijing: Seasonal perspective. Atmos. Chem. Phys. 2013, 13, 7053–7074. [Google Scholar] [CrossRef]
- Ackerman, D.; Millet, D.B.; Chen, X. Global estimates of inorganic nitrogen deposition across four decades. Glob. Biogeochem. Cycles 2019, 33, 100–107. [Google Scholar] [CrossRef]
- Zhang, K.; Liu, X.Y.; Song, W.; Hien, T.T.; Wang, X.; Chen, Z.; Hai, H.T.N.; He, S. Precipitation records of anthropogenic nitrogen pollution in two metropolitan cities of Southeast Asia. Urban Clim. 2023, 52, 101749. [Google Scholar] [CrossRef]
- Zhang, Q.; Li, Y.; Wang, M.; Wang, K.; Meng, F.; Liu, L.; Zhao, Y.; Ma, L.; Zhu, Q.; Xu, W.; et al. Atmospheric nitrogen deposition: A review of quantification methods and its spatial pattern derived from the global monitoring networks. Ecotoxicol. Environ. Saf. 2021, 216, 112180. [Google Scholar] [CrossRef]
- Zhang, Y.; Liu, X.; Zhang, L.; Tang, A.; Goulding, K.; Collett, J.L. Evolution of secondary inorganic aerosols amidst improving PM2.5 air quality in the North China plain. Environ. Pollut. 2021, 281, 117027. [Google Scholar] [CrossRef]
- Chen, S.; Chen, B.; Wang, S.; Sun, L.; Shi, H.; Liu, Z.; Wang, Q.; Li, H.; Zhu, T.; Li, D.; et al. Spatiotemporal variations of atmospheric nitrogen deposition in China during 2008–2020. Atmos. Environ. 2023, 315, 120120. [Google Scholar] [CrossRef]
- Filonchyk, M.; Peterson, M. Air quality changes in Shanghai, China, and the surrounding urban agglomeration during the COVID-19 lockdown. J. Geovis. Spat. Anal. 2020, 4, 22. [Google Scholar] [CrossRef]
- Yang, Y.; Zhao, T.; Jiao, H.; Wu, L.; Xiao, C.; Guo, X.; Jin, C. Atmospheric organic nitrogen deposition in strategic water sources of China after COVID-19 lockdown. Int. J. Environ. Res. Public Health 2022, 19, 2734. [Google Scholar] [CrossRef] [PubMed]
- Chen, H.Y.; Huang, L.M.; Ho, T.Y.; Chiang, K.P.; Chou, W.C. A study of the nitrogen and phosphorus imbalance in East Asia based on the distribution patterns of and stoichiometric variation in global atmospheric nitrogen and phosphorus. Atmos. Environ. 2021, 266, 118691. [Google Scholar] [CrossRef]
- Hsieh, C.-C.; Chen, H.-Y.; Ho, T.-Y. The effect of aerosol size on Fe solubility and deposition flux: A case study in the East China Sea. Mar. Chem. 2022, 241, 104106. [Google Scholar] [CrossRef]
- Bower, C.E.; Holm-Hansen, T. A Salicylate–Hypochlorite Method for Determining Ammonia in Seawater. Can. J. Fish. Aquat. Sci. 1980, 37, 794–798. [Google Scholar] [CrossRef]
- Armstrong, F.A.J.; Stearns, C.R.; Strickland, J.D.H. The Measurement of Upwelling and Subsequent Biological Process by Means of the Technicon Autoanalyzer® and Associated Equipment. Deep. Sea Res. Oceanogr. Abstr. 1967, 14, 381–389. [Google Scholar] [CrossRef]
- Pai, S.C.; Su, Y.T.; Lu, M.C.; Chou, Y.; Ho, T.Y. Determination of nitrate in natural waters by vanadium reduction and the griess assay: Reassessment and optimization. ACS EST Water 2021, 1, 1524–1532. [Google Scholar] [CrossRef]
- Wang, Y.Q. MeteoInfo: GIS software for meteorological data visualization and analysis. Meteorol. Appl. 2014, 21, 360–368. [Google Scholar] [CrossRef]
- Wang, Y.; Zhuang, G.; Zhang, X.; Huang, K.; Xu, C.; Tang, A.; Chen, J.; An, Z. The ion chemistry, seasonal cycle, and sources of PM2.5 and TSP aerosol in Shanghai. Atmos. Environ. 2006, 40, 2935–2952. [Google Scholar] [CrossRef]
- Lai, A.M.; Shafer, M.M.; Dibb, J.E.; Polashenski, C.M.; Schauer, J.J. Elements and inorganic ions as source tracers in recent Greenland snow. Atmos. Environ. 2017, 164, 205–215. [Google Scholar] [CrossRef]
- Chen, H.Y.; Chen, L.D.; Chiang, Z.Y.; Hung, C.C.; Lin, F.J.; Chou, W.C.; Gong, G.C.; Wen, L.S. Size fractionation and molecular composition of water-soluble inorganic and organic nitrogen in aerosols of a coastal environment. J. Geophys. Res. Atmos. 2010, 115, D22307. [Google Scholar] [CrossRef]
- Zhang, J.; Zhang, G.S.; Bi, Y.F.; Liu, S.M. Nitrogen species in rainwater and aerosols of the yellow and East China seas: Effects of the East Asian monsoon and anthropogenic emissions and relevance for the NW Pacific ocean. Glob. Biogeochem. Cycles. 2011, 25, GB3020. [Google Scholar] [CrossRef]
- Hossaini, R.; Chipperfield, M.P.; Saiz-Lopez, A.; Fernandez, R.; Monks, S.; Feng, W.; Brauer, P.; Von Glasow, R. A global model of tropospheric chlorine chemistry: Organic versus inorganic sources and impact on methane oxidation. J. Geophys. Res. Atmos. 2016, 121, 14271–14297. [Google Scholar] [CrossRef]
- Kouyoumdjian, H.; Saliba, N.A. Mass concentration and ion composition of coarse and fine particles in an urban area in Beirut: Effect of calcium carbonate on the absorption of nitric and sulfuric acids and the depletion of chloride. Atmos. Chem. Phys. 2006, 6, 1865–1877. [Google Scholar] [CrossRef]
- Li, Y.; Schichtel, B.A.; Walker, J.T.; Schwede, D.B.; Chen, X.; Lehmann, C.M.B.; Puchalski, M.A.; Gay, D.A.; Collett, J.L., Jr. Increasing importance of deposition of reduced nitrogen in the United States. Proc. Natl. Acad. Sci. USA 2016, 113, 5874–5879. [Google Scholar] [CrossRef] [PubMed]
- Feng, Y.; Zhao, S.; Wang, S.; Lin, Q.; Luo, Y.; Xu, S.; Yang, H.; Shi, J.; Zhang, M.; Jiao, L.; et al. Characteristics of atmospheric inorganic nitrogen wet deposition in coastal urban areas of Xiamen, China. Atmosphere 2021, 12, 1447. [Google Scholar] [CrossRef]
- Huang, J.; Cai, A.; Wang, W.; He, K.; Zou, S.; Ma, Q. The variation in chemical composition and source apportionment of PM2.5 before, during, and after COVID-19 restrictions in Zhengzhou, China. Toxics 2024, 12, 81. [Google Scholar] [CrossRef] [PubMed]
- Wang, Y.; Liu, D.; Xiao, W.; Zhou, P.; Tian, C.; Zhang, C.; Du, J.; Guo, H.; Wang, B. Coastal eutrophication in China: Trend, sources, and ecological effects. Harmful Algae 2021, 107, 102058. [Google Scholar] [CrossRef]
- Xing, J.; Song, J.; Yuan, H.; Wang, Q.; Li, X.; Li, N.; Duan, L.; Qu, B. Water-soluble nitrogen and phosphorus in aerosols and dry deposition in Jiaozhou Bay, North China: Deposition velocities, origins and biogeochemical implications. Atmos. Res. 2018, 207, 90–99. [Google Scholar] [CrossRef]
- Wu, L.; Liu, X.; Li, K.; Xu, W.; Huang, W.; Zhang, P.; Zhao, X.; Liu, C.; Zhang, G.; Liang, L. Wet inorganic nitrogen deposition at the Daheitin reservoir in North China: Temporal variation, sources, and biomass burning influences. Atmosphere 2020, 11, 1260. [Google Scholar] [CrossRef]
- Yu, J.; Yan, C.; Liu, Y.; Li, X.; Zhou, T.; Zheng, M. Potassium: A tracer for biomass burning in Beijing? Aerosol Air Qual. Res. 2018, 18, 2447–2459. [Google Scholar] [CrossRef]
- Chen, H.Y.; Chen, L.D. Importance of anthropogenic inputs and continental-derived dust for the distribution and flux of water-soluble nitrogen and phosphorus species in aerosol within the atmosphere over the East China sea. J. Geophys. Res. Atmos. 2008, 113, D11303. [Google Scholar] [CrossRef]
- Chen, H.Y.; Huang, S.Z. Composition and supply of inorganic and organic nitrogen species in dry and wet atmospheric deposition: Use of organic nitrogen composition to calculate the ocean’s external nitrogen flux from the atmosphere. Cont. Shelf Res. 2021, 213, 104316. [Google Scholar] [CrossRef]
- Wang, J.; Beusen, A.H.W.; Liu, X.; Van Dingenen, R.; Dentener, F.; Yao, Q.; Xu, B.; Ran, X.; Yu, Z.; Bouwman, A.F. Spatially explicit inventory of sources of nitrogen inputs to the yellow sea, East China sea, and South China sea for the period 1970–2010. Earths Future 2020, 8, e2020EF001516. [Google Scholar] [CrossRef]
Disclaimer/Publisher’s Note: The statements, opinions and data contained in all publications are solely those of the individual author(s) and contributor(s) and not of MDPI and/or the editor(s). MDPI and/or the editor(s) disclaim responsibility for any injury to people or property resulting from any ideas, methods, instructions or products referred to in the content. |
© 2025 by the authors. Licensee MDPI, Basel, Switzerland. This article is an open access article distributed under the terms and conditions of the Creative Commons Attribution (CC BY) license (https://creativecommons.org/licenses/by/4.0/).