Abstract
Lateral pipe-soil interaction is crucial for the on-bottom stability design of submarine pipelines, particularly on deep-water sloping silt seabeds. To address this, a mechanical-actuator facility has been specially designed and utilized to simulate the lateral instability process of a pipe on silt slopes (α) ranging from −15° to +15°. In this study, variations in the dimensionless submerged pipeline weight (G = 0.607–1.577) and initial embedment ratios (|e0|/D = 0.01–0.50) are also considered. Experimental results reveal several key findings. First, brittle pipe-soil responses are observed: under embedment ratios larger than 0.05, the breakout soil resistance is dominated by suction due to negative pore pressure generation at the rear of the pipe, whereas under lower embedment ratios, it is primarily governed by interface friction and cohesion. Second, for a constant submerged pipeline weight (G = 1.092), the breakout drag force increases linearly with slope angle, whereas the breakout soil resistance decreases linearly—a difference attributed to the gravitational component Wssinα. Specifically, compared to a horizontal flat seabed, the breakout lateral drag force increases by approximately 33% for upslope instability (α = +15°), but decreases by about 24% for downslope instability (α = −15°). Third, the dimensionless lateral-soil-resistance coefficient on silt increases nonlinearly and monotonically with the slope angle, a trend opposite to that reported for sandy seabeds. Finally, an improved model is proposed that explicitly incorporates silt slope angle, submerged pipeline weight, and embedment ratio. This study aims to offer valuable insights into the stability of pipelines on partially drained continental silt slopes and to support the adoption of slope-specific criteria in future engineering designs.
1. Introduction
In recent years, global offshore oil and gas exploration has progressively shifted from shallow to deep water (water depth ≥ 500 m) and ultra deep water (water depth ≥ 1500 m) environments. Deep-water regions have become critical areas for the growth of global oil and gas exploration and reserves [1]. Notably, more than ten significant deep-water oil and gas fields have been identified in the northern South China Sea [2], including Liwan 3-1 and Lingshui 17-2, where the average operational water depths are approximately 1500 m. The structural integrity of submarine pipelines, which serve as critical infrastructure for subsea transport, is essential for operational safety. These pipelines are typically partially embedded and subjected to hydrodynamic loading from waves and currents, comprising horizontal drag and inertia forces as well as vertical uplift force [3]. If the seabed soil resistance is insufficient to balance these horizontal forces, lateral on-bottom instability may occur, potentially resulting in substantial pipeline displacement—a well-documented challenge in the field [4,5,6,7].
A central and highly uncertain aspect of pipeline stability design is the pipe-soil interaction (PSI) [6,7,8]. Research methodologies have included physical modeling at various scales, centrifuge testing, numerical simulations, and theoretical approaches [9,10,11]. Initial work largely addressed shallow-water, wave-dominated settings, where seabed resistance was frequently modeled as the net vertical force (submerged weight minus uplift force) multiplied by a friction coefficient—often assumed as 0.5 for undrained clay and 0.8 for drained sand. However, early experiments by Lyons [12] indicated that this friction coefficient varies with submerged pipe weight (hence embedment depth) and pipe diameter. Later Joint Industry Projects (JIPs) [13] further demonstrated the importance of embedment depth, drainage conditions, and slip direction in determining ultimate lateral soil resistance. For design cases permitting large displacements, Verley and Sotberg [14] highlighted the dominance of initial embedment and peak “breakout” resistance in the pipe-soil response, with post-breakout resistance playing a secondary role. Subsequent models have accounted for embedment by separating lateral soil resistance into frictional and passive components [15,16]. The effect of slip direction was numerically investigated by Wang et al. [17] for soft clay, showing that larger load angles (i.e., the angle between the pipe’s movement direction and the vertical downward direction) reduce the size of the soil plastic zone and align interfacial shear stresses. The influence of a seabed berm—especially significant at larger embedment—has also been incorporated into soil resistance models via an effective embedment parameter for sandy seabed [7,18,19].
On erodible seabeds, particularly sandy ones, local scour often accompanies lateral pipeline instability [20,21,22,23,24]. Sediment mobility is commonly assessed using the Shields parameter, with transport initiating once critical thresholds are exceeded. Coupled flume experiments have shown how local scour alters the soil-water interface [20,21], and wave-induced oscillation can lead to cumulative settlement alongside sudden lateral displacement. While waves dominate in shallow water, deep-water environments are current-dominated due to wave energy decay with water depth. In these settings, pipelines are also prone to tunnel erosion and free spanning from seepage failure [25]. Numerical studies of coupled flow-seepage-elastoplastic behavior [26,27] have revealed a competitive mechanism between tunnel erosion (favored by shallow embedment) and lateral instability (favored by low pipe weight) on sandy seabeds. By contrast, cohesive soils with low permeability require higher shear stresses for particle mobilization [28] and greater hydraulic gradients for seepage failure, making lightweight pipelines on such soils more vulnerable to current-induced lateral instability, with minimal influence from local scour or tunnel erosion.
As oil and gas exploration progresses into deep-water continental slope regions, pipeline stability on sloping seabeds has emerged as a critical engineering issue, as depicted in Figure 1. Field surveys indicate that seabed slopes can be substantial, with slope angles (α) reaching 11° to 20° in certain areas of the Gulf of Mexico [29] and 6.7° to 17.6° along the western continental slope of the South China Sea [30,31]. Although failure mechanisms of sloping seabeds under gravitational, seismic, and hydrodynamic loads have been widely studied [32,33,34,35], research on the lateral stability of pipelines installed across slopes remains limited. Trenching experiments by Bransby et al. [36] revealed that backfilling efficiency decreases exponentially when seabed slopes exceed 5°, significantly increasing lateral instability risks for unburied pipelines. Under sandy sloping seabed conditions, Gao et al. [37] conducted mechanical loading tests and developed a predictive model for the dimensionless lateral-soil-resistance coefficient as follows:
in which is the dimensionless lateral-soil-resistance coefficient (defined as the ratio of the ultimate soil resistance to the corresponding vertical pipe-soil contact force), is the reference value of under horizontal sandy seabed conditions; α denotes the seabed slope angle (note that it is expressed in radians here); A1 and A2 represent the coefficients of the first-order and second-order terms, respectively; and UI and DI represent upslope and downslope instability modes, respectively (see Figure 1). Building on Gao et al. [37], Peng and Qu [38] used coupled discrete element-finite element method (DEM-FEM) simulations to examine the micromechanical behavior during pipe lateral instability. They found that in downslope motion with anti-rolling pipes, soil-pipe interaction involves reduced settlement and a weak soil berm. In upslope motion, however, anti-rolling pipes follow an arc-shaped settlement path and generate a large frontal berm [38]. Drawing on finite element simulations, Gao et al. [39] proposed that the development of the plastic zone ahead of a laterally moving pipe resembles the failure mechanism in classical passive earth pressure theory. This analogy prompted them to develop a limit-state model aimed at predicting the ultimate lateral soil resistance on sandy sloping seabeds. Subsequently, Shi et al. [40] modified this model to apply to horizontal soft clay seabeds. Centrifuge tests combined with particle image velocimetry on horizontal soft clay [9] have shown that lateral breakout is brittle, with peak soil resistance dominated by tensile resistance (suction) at the rear of the pipe—attributed to negative pore pressure—rather than soil shear strength. Reflecting the role of suction, recommended practices by Det Norske Veritas and Germanischer Lloyd (DNV GL) [7] included an empirical term in the undrained breakout resistance formula, suggesting that suction effects may be considered when the pipe is installed via vertical penetration with good soil contact, or when high lateral resistance is unfavorable.
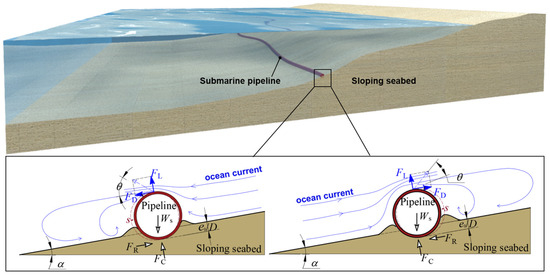
Figure 1.
Schematic of pipeline lateral instability in currents on a sloping seabed.
In regions such as the South China Sea, seabed soils range from medium-fine sand to silt and clay [32], generally exhibiting a fining trend with increasing water depth. Silt—defined by a median grain size d50 < 0.075 mm and plasticity index Ip ≤ 10%—is common on the continental slope. With properties intermediate between sand and clay, silt exhibits complex strength and deformation behavior under loading [41,42]. While sand and clay typically exhibit fully drained and undrained responses, respectively, silt often displays partially drained behavior that evolves over time. Although seabed soils are saturated and their strength depends on effective stress and pore pressure changes, most studies have focused on extreme drainage cases (fully drained or undrained), with limited attention to partially drained conditions or sloping seabeds.
In this study, the lateral instability of pipelines on sloping silt seabeds under unidirectional currents is investigated using a custom-developed pipe-soil interaction testing facility. Dimensional analysis, experimental setup, test conditions, and testing procedure are described in Section 2. Based on the experimental results, characteristic lateral pipe-soil responses, ultimate soil resistance, and corresponding mobilization displacements are analyzed in Section 3. Parametric investigations are further conducted to evaluate the effects of silt slope angle, initial embedment depth, and submerged pipe weight (see Section 3). In Section 4, an improved predictive model incorporating slope effects is developed to estimate the ultimate lateral soil resistance for pipelines on sloping silt seabeds. Concluding remarks are summarized in Section 5.
2. Experimental Modeling
2.1. Dimensional Analysis
As shown in Figure 1, the lateral instability of pipelines on sloping silt seabeds under ocean currents can be classified into two modes: upslope instability (UI) and downslope instability (DI). This process involves complex interactions among hydrodynamic forces, the pipeline, and the surrounding silt soil. The ultimate lateral soil resistance can be expressed as follows:
where FRu is the ultimate lateral soil resistance, which acts in the direction opposite to the pipeline instability (see Figure 1), and is considered a positive value; α is the seabed slope angle; D is the pipe diameter; Ws is the submerged pipe weight per unit length; k is the pipe surface roughness; is the effective unit weight of the silt; d50 is the median particle size; Dr is the relative density; φ is the internal friction angle; c is the soil cohesion; θ is the inclination angle of the resultant hydrodynamic load relative to the seabed; and e0 is the initial embedment depth of the pipe into the soil and is expressed as a negative value (see Figure 1).
A positive seabed slope (α > 0) corresponds to UI, while a negative slope (α < 0) corresponds to DI. To maintain lateral stability, force equilibrium along the seabed surface must satisfy the following:
here FDu is the ultimate lateral drag force, which is aligned with the direction of the applied load on the pipeline and is considered a positive value. Lateral instability occurs when FD > FDu, where FD is the lateral drag force applied to the pipe by ocean currents (see Figure 1). According to DNV GL [7], the ultimate lateral soil resistance FRu on horizontal seabeds is characterized by an equivalent friction coefficient, defined as the ratio of soil resistance to the submerged pipe weight. For sloping silt seabeds, an analogous lateral-soil-resistance coefficient, as presented in Equation (1), is introduced:
in which η is the lateral-soil-resistance coefficient, and FCu is the vertical pipe-soil contact force at which the ultimate lateral soil resistance is attained, i.e., the upward support force exerted by the seabed (see Figure 1). Note that η is applicable provided FCu ≠ 0. Through dimensional analysis, η can be expressed as follows:
where is the dimensionless submerged pipe weight, k/D is the normalized pipe surface roughness, d50/D is the ratio of median particle size to pipe diameter, is the dimensionless soil cohesion, and e0/D is the ratio of the initial embedment to the pipe diameter, also referred to as the initial embedment ratio.
In cases of significant embedment where FCu approaches zero, η becomes undefined. Under such circumstances, an alternative dimensionless parameter is used to quantify ultimate lateral soil resistance as follows:
where represents the dimensionless ultimate lateral soil resistance. To minimize particle size effects in soil-structure interaction experiments, the ratio d50/D should be less than 1/15 [43]. In this study, a pipe diameter of D = 200 mm and silt with d50 = 0.047 mm (Table 1) have been used, giving d50/D = 2.35 × 10⁻⁴, which satisfies this criterion.

Table 1.
Properties of test silt soil.
Section 3 systematically investigates the influence of seabed slope α, dimensionless submerged pipe weight G, and embedment ratio e0/D on lateral pipe-soil response, ultimate soil resistance FRu, and the applicable soil resistance parameter (η or ).
2.2. Experimental Setup
A specialized facility has been designed at the Institute of Mechanics, Chinese Academy of Sciences, to simulate pipe-soil interaction under controlled conditions. The system, shown in Figure 2, comprises an adjustable test flume, a sand-raining device, a servo-driven mechanical loading system, and synchronized measurement instruments. The flume measures 5.0 m in length, 1.0 m in width, and 1.5 m in depth, featuring a 2 m central observation section made of tempered glass for visual monitoring and observation.
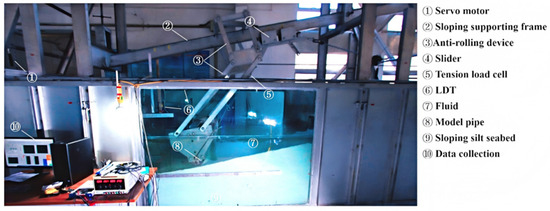
Figure 2.
Mechanical loading system for simulating pipe–soil interaction.
A specially designed large soil box was placed in the middle section of the flume. A saturated silt bed with the target relative density was prepared using this sand-raining device, which features a grooved carrier moving at a controlled speed to deposit soil uniformly under water, thereby achieving the desired slope.
An anti-rolling model pipe with an outer diameter of D = 200 mm and a length of L = 1000 mm was designed and laid on a sloping silt seabed. The anti-rolling mechanism, based on a double parallelogram configuration, restricted rotational degrees of freedom, ensuring pure translational motion (see Figure 2). To minimize boundary effects, a 40 mm gap was maintained between both ends of the pipe and the flume walls.
2.3. Mechanical Loading
The experiments were carried out in a static water environment with a water depth of h = 1.0 m. Tap water, with a density of ρw = 1000 kg/m3, was used and maintained at a controlled temperature of 20 ± 2 °C. The hydrostatic pressure at the pipe level remained constant, calculated as p = ρwgh, where g is the gravitational acceleration, resulting in a pressure of 9.8 kPa. Since the tests were performed without any flow circulation, the inlet and outlet boundary conditions were set to zero velocity.
Hydrodynamic forces acting on the model pipe were simulated via an oblique mechanical loading system. Based on the Morison equation, drag force FD and lift force FL on the pipe (see Figure 1) can be expressed as follows: and , where and are the drag and lift force coefficients, ρw is water density, and U is current velocity. The angle θ between the resultant force and the seabed is as follows:
Guided by previous studies [3,12], a typical angle θ ≈ 53° was maintained. This was achieved using a feedback-controlled pulley system: a servo motor drove two cables—one attached directly to the pipe and a moving pulley, the other routed through a fixed pulley. By adjusting the front cable length and the sloping supporting frame, the loading direction was precisely controlled relative to the seabed slope.
The resultant hydrodynamic force on the pipe was measured using a load cell. Two laser displacement transducers (LDT-1 and LDT 2) tracked pipe movement: LDT-1 measured lateral displacement parallel to the seabed, and LDT-2 recorded vertical settlement.
2.4. Material Properties and Test Conditions
Key properties of the silt seabed are summarized in Table 1. The soil had a median particle size d50 = 0.047 mm, friction angle φ = 27.4°, cohesion c = 6.0 kPa, effective unit weight γ′ = 9.63 kN/m3, and relative density Dr = 0.59. The particle size distribution indicated uniform grading, with uniformity coefficient Cu = 6.01, curvature coefficient Cc = 1.43, and plasticity index Ip = 7.6%, classifying it as low-plasticity silt.
Tests covered seabed slopes α from −15° to +15° (see Table 2), representing typical continental slope conditions. The dimensionless submerged pipe weight ranged from 0.607 to 1.577 by adjusting internal ballast, covering practical engineering values. Two embedment conditions were studied: self-weight penetration and additional penetration via external preloading.
Table 2.
Experimental conditions and results for lateral resistance and mobilization displacement (d50/D = 2.35 × 10⁻⁴, φ = 27.4°, c/γ′D = 3.12, Dr = 0.59).
2.5. Testing Procedure
The test procedure consisted of the following steps:
- (1)
- Silt bed preparation: The sand-raining technique was used to form a saturated silt seabed at the target slope angle.
- (2)
- Initial embedment measurement: The pipe was positioned above the seabed within the water flume, and its submerged weight was calibrated with a load cell. After contact with the silt bed, laser sensors LDT-1 and LDT-2 were activated to record lateral displacement s and vertical initial embedment e0.
- (3)
- Mechanical loading: A servo motor applied an oblique load at 0.45 mm/s to simulate hydrodynamic forcing. Loading continued until lateral instability occurred.
- (4)
- Data acquisition: Force, displacement, and time-series data were synchronously recorded at 100 Hz using a tension load cell, laser sensors, and a high-speed camera.
3. Results and Discussion
Table 2 provides a summary of the test conditions along with the corresponding results. Section 3.1 focuses on the lateral pipe-soil interaction response. Here, the breakout force is defined as the maximum force observed during the response, while the residual force refers to the stable lateral resistance value once it reaches a steady plateau as lateral displacement increases. In Section 3.2, key interaction parameters such as breakout resistance, residual resistance, and their respective mobilization displacements, are examined in detail. Following this, Section 3.3 and Section 3.4 explore the influence of submerged pipe weight and seabed slope angle, respectively.
3.1. Typical Features of Pipe-Silt Response
3.1.1. Cases with Minimal Initial Embedment
Tests S-1 to S-7 (Table 2) involve low initial embedment resulting from self-weight penetration. The initial embedment ratio |e0|/D remains below 0.05 and exhibits negligible dependence on seabed slope α, as shown in Figure 3. Under ideal conditions, the experimental data points presented in Figure 3 are expected to demonstrate symmetry with respect to α = 0°. The observed slight asymmetry is likely attributable to minor experimental inconsistencies, such as inevitable small-scale inhomogeneities arising during seabed preparation and measurement errors. Figure 4 shows the typical relationships between lateral drag force FD and normalized displacement s/D (where s is lateral displacement of pipe). For upslope instability (UI, α > 0; Figure 4a), FD increases rapidly during initial elastic deformation (s/D < 0.005), followed by a nonlinear strengthening phase until peak force FDu is reached at s/D = smob/D (where smob is lateral mobilization displacement of pipe). A subsequent strain-softening phase leads to a residual force FDres. The difference between FDu and FDres is less than 15% across all tests (Table 2). A similar three-phase response occurs in downslope instability (DI, α < 0; Figure 4b). Note that the oscillations observed in the curves result from the combined effects of frictional transitions at the pipe-soil interface, elastic deformation within the loading system, and minor soil heterogeneities.
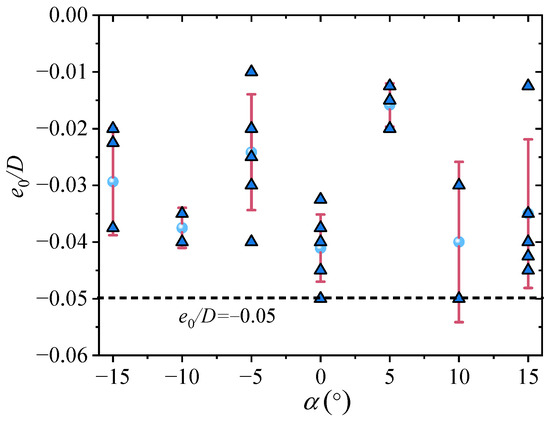
Figure 3.
Variation in initial embedment ratio with seabed slope angle (Tests S-1~S-7: G = 1.092, α = −15°~+15°, |e0|/D ≤ 0.05, d50/D = 2.35 × 10⁻⁴, φ = 27.4°, c/γ′D = 3.12, Dr = 0.59).
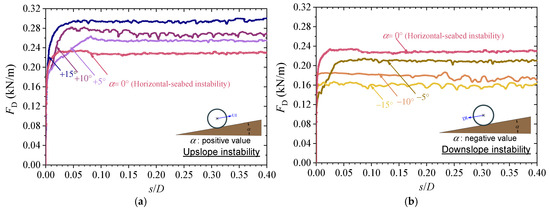
Figure 4.
Evolution of lateral drag force with displacement during pipe instability on sloping silt seabeds: (a) upslope instability UI; (b) downslope instability (DI) (tests S-1~S-7: G = 1.092, α = −15°~+15°, |e0|/D ≤ 0.05, d50/D = 2.35 × 10⁻⁴, φ = 27.4°, c/γ′D = 3.12, Dr = 0.59).
Compared to the values observed on a horizontal seabed (α = 0°), a positive slope angle of α = +15° increases in FDu by 33%, whereas a negative slope angle of α = −15° decreases it by 24%. Slope-induced gravitational components also influence “static equilibrium”: as shown in Figure 5, an initial upward soil resistance FR0 = −Wssinα develops to balance the downslope weight component (Wssinα).
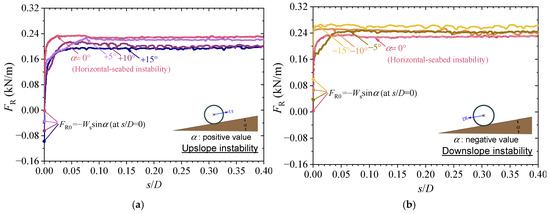
Figure 5.
Development of lateral soil resistance with displacement: (a) UI; (b) DI (tests S-1~S-7: G = 1.092, α = −15°~+15°, |e0|/D ≤ 0.05, d50/D = 2.35 × 10⁻⁴, φ = 27.4°, c/γ′D = 3.12, Dr = 0.59).
In UI scenarios (α > 0; Figure 5a), the lateral soil resistance FR evolves nonlinearly with s/D. Starting from FR0 = −Wssinα (upward direction), FR decreases to zero, then reverses direction and increases in the downward direction. The ultimate soil resistance FRu decreases by approximately 18% as the slope angle α increases from 0° to +15°. The differences between FRu and the residual soil resistance FRres are less than 11% for tests S-1 to S-7 (Table 2).
Figure 6 shows the evolution of the embedment ratio (e/D). |e|/D (absolute value of e/D) decreases overall, while e/D increases with s/D. In contrast to sandy seabeds—where pipe lateral breakout is typically accompanied by additional settlement [37]—on silt seabeds the maximum settlement corresponds to the initial embedment. Furthermore, due to the shallow initial embedment ratio (|e0|/D ≤ 0.05), the evolution shows no clear correlation with the seabed slope.
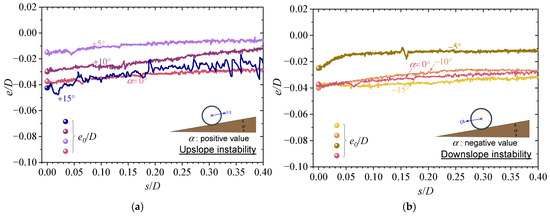
Figure 6.
Change in vertical embedment ratio with lateral displacement: (a) UI; (b) DI (tests S-1~S-7: G = 1.092, α = −15°~+15°, |e0|/D ≤ 0.05, d50/D = 2.35 × 10⁻⁴, φ = 27.4°, c/γ′D = 3.12, Dr = 0.59).
In DI cases (α < 0; Figure 5b), the lateral soil resistance FR increases continuously from FR0 to the peak value FRu, maintaining an upward direction throughout. The ultimate lateral resistance FRu increases by about 26% as the slope angle α changes from 0° to −15°. Moreover, the values of FRu in DI exceed those observed in UI cases under comparable conditions.
3.1.2. Cases with Large Initial Embedment
Tests S-12 to S-14 (Table 2) investigate scenarios involving large initial embedment resulting from external preloading. Under these conditions, the relationship between lateral soil resistance FR, embedment ratio e/D, and normalized lateral displacement s/D exhibits distinctive characteristics, as depicted in Figure 7. Unlike cases with very small initial embedment (e.g., S-1 at α = 0° and S-4 at α = +10°, where |e0|/D ≤ 0.05, see Figure 5), tests with high embedment (e.g., S-12 at α = 0° and S-13 at α = +10°, with |e0|/D = 0.35) show a clear three-stage evolution in the FR~s/D curve as follows:
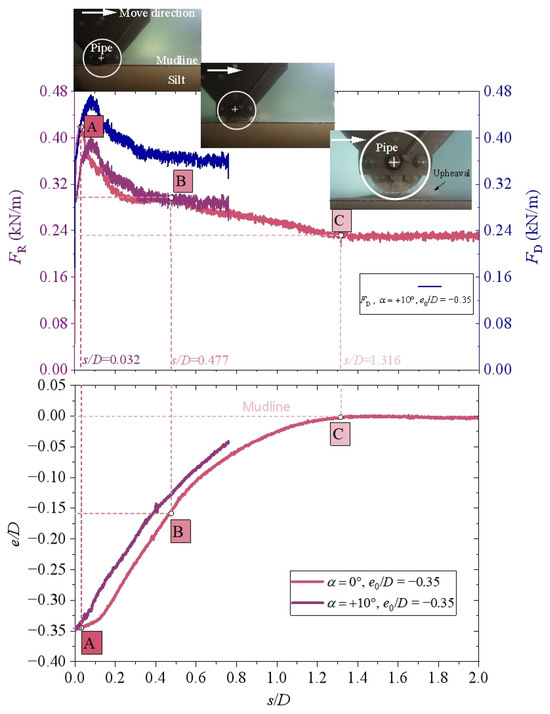
Figure 7.
Pipe-soil interaction response under deep initial embedment (tests S-12 and S-13: G = 1.092, α = 0° and +10°, |e0|/D = 0.35, d50/D = 2.35 × 10⁻⁴, φ = 27.4°, c/γ′D = 3.12, Dr = 0.59).
- Nonlinear growth stage (s/D < 0.1): FR increases rapidly, reaching a peak value FRu at point A (e.g., FRu = 0.42 kN/m in S-12). Notably, no soil heave ahead of the pipe or visible separation behind it is observed, indicating that passive earth pressure remains underdeveloped in silt. This suggests that interfacial adhesion and tensile resistance at the rear of the pipe may constitute the primary mechanisms governing FRu.
- Softening stage (0.1 ≤ s/D ≤ 0.477): At a critical displacement of s/D = 0.477, corresponding to the pipe axis detaching from its initial trench, FR decreases sharply by 28% to point B (e.g., FR = 0.30 kN/m in S-12). Concurrently, e/D reduces significantly from −0.35 to −0.16, and a pronounced soil berm develops ahead of the pipe.
- Residual strength stage (s/D > 0.477): With further displacement (up to s/D ≈ 1.3), FR declines to a residual value FRres at point C (e.g., FRres = 0.23 kN/m in S-12), while e/D approaches the mudline (Figure 7). The value of FRres closely aligns with those measured in cases featuring very small initial embedment (e.g., FRres = 0.21~0.23 kN/m in S-1, see Figure 5).
To further investigate the role of suction at the pipe-soil interface, loading-pause-reloading tests were conducted. As shown in Figure 8 under condition S-12, the initial peak soil resistance FRu (point A) occurs at a very small displacement (s/D = 0.015). When loading is paused (Stage 2), FR drops markedly to point T despite zero displacement. Upon reloading (Stage 3), a second, considerably lower peak FRu2 (point A’) is observed.
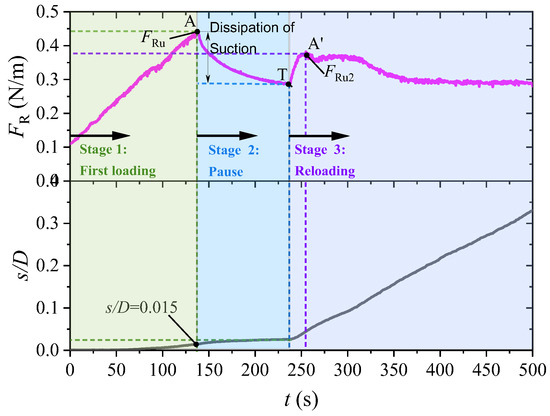
Figure 8.
Time-dependent variation in lateral soil resistance during loading-pause-reloading (test S-12: G = 1.092, α = 0°, |e0|/D = 0.35, d50/D = 2.35 × 10⁻⁴, φ = 27.4°, c/γ′D = 3.12, Dr = 0.59).
Two critical observations help elucidate the underlying mechanisms:
- (1)
- The absence of soil heave in front of the pipe indicates that passive earth pressure does not contribute significantly to FRu;
- (2)
- The near-zero pipe-soil contact force suggests that friction is negligible (see Section 3.2).
The force reduction during the pause (under unchanged displacement) confirms the influence of excess pore pressure: the negative pore pressure generated during Stage 1 dissipates in Stage 2, resulting in a loss of suction. These results demonstrate that the peak soil resistance FRu is governed principally by suction and pipe-soil cohesion. This finding is consistent with earlier centrifuge studies on soft clay [9], which concluded that peak breakout resistance is controlled by tensile resistance at the rear of the pipe—sustained by negative excess pore pressure—rather than by the shear strength of the soil. Furthermore, the magnitude of this negative pore pressure is influenced by factors such as the soil′s permeability, and the degree of pipe-soil bonding, which is affected by interface adhesion. For scenarios involving large initial embedment, two complementary mechanisms enhance the suction effect: (1) improved soil-pipe contact strengthens interface bonding, further resisting detachment and (2) longer drainage paths significantly reduce drainage capacity. These combined effects promote the development of a larger suction force behind the pipe.
3.2. Breakout/Residual Resistance and Mobilization Displacement
Figure 9 presents the relationships between four key dimensionless parameters—breakout drag force (FDu/γ′D2), breakout contact force (FCu/γ′D2), breakout soil resistance (FRu/γ′D2), and residual soil resistance (FRres/γ′D2)—and the initial embedment ratio (|e0|/D).
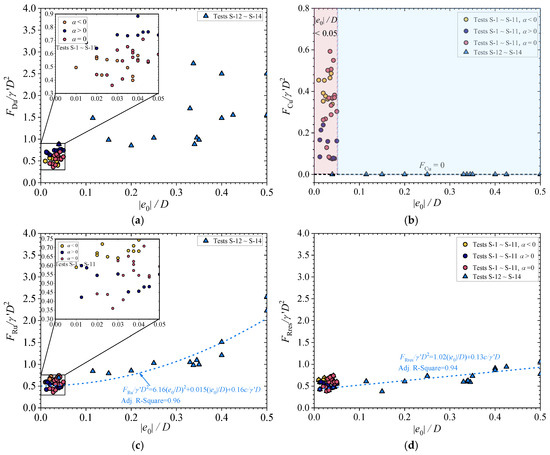
Figure 9.
Relationships between initial embedment ratio of pipe and: (a) FDu/γ′D2; (b) FCu/γ′D2; (c) FRu/γ′D2; (d) FRres/γ′D2 (tests S-1~S-14: G = 0.607~1.577, α = −15°~+15°, |e0|/D = 0.01~0.50, d50/D = 2.35 × 10⁻⁴, φ = 27.4°, c/γ′D = 3.12, Dr = 0.59).
For cases with minimal embedment (|e0|/D ≤ 0.05, Tests S-1~S-7), both FDu/γ′D2 and FRu/γ′D2 show negligible dependence on |e0|/D (Figure 9a,c). This suggests that under shallow embedment conditions, soil resistance is dominated primarily by pipe-soil friction and cohesion.
In contrast, for deeply embedded cases (|e0|/D > 0.05, Tests S-12~S-14), FRu/γ′D2 increases nonlinearly with |e0|/D (Figure 9c). When the vertical contact force is zero (FCu/γ′D2 = 0, Figure 9b), the frictional component is eliminated. Under these conditions, the breakout soil resistance is governed mainly by suction at the rear of the pipe, with secondary contributions from partially mobilized passive earth pressure and interface cohesion (see Figure 7). The following fitting equation is proposed to describe the relationship between breakout soil resistance and initial embedment ratio for |e0|/D > 0.05 as follows:
As shown in Figure 9c, the equation agrees well with experimental data, yielding a coefficient of determination R2 = 0.96. Additionally, Figure 9d shows that residual soil resistance FRres/γ′D2 also increases with |e0|/D, which results from the formation of a soil berm ahead of the pipe.
Figure 10 presents the mobilization displacements smob/D and sres/D required to reach breakout and residual soil resistance, respectively. According to DNV GL [7], recommended values of smob/D for clay soils are:
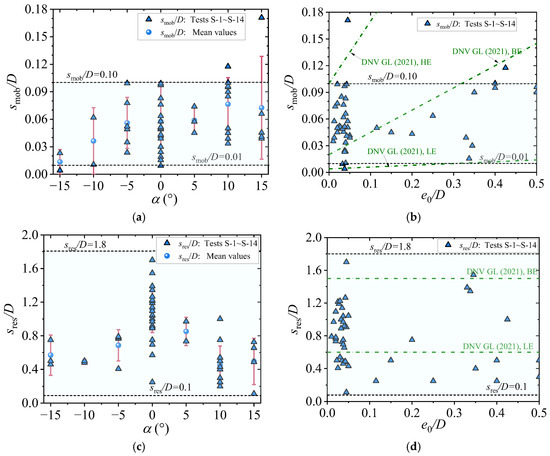
Figure 10.
Mobilization displacement versus initial embedment and slope angle [7]: (a) smob/D vs. α; (b) smob/D vs. |e0|/D; (c) sres/D vs. α; (d) sres/D vs. |e0|/D (tests S-1~S-14: G = 0.607~1.577, α = −15°~+15°, |e0|/D = 0.01~0.50, d50/D = 2.35 × 10⁻⁴, φ = 27.4°, c/γ′D = 3.12, Dr = 0.59).
- Low: 0.004 + 0.02|e0|/D;
- Best: 0.02 + 0.25|e0|/D;
- High: 0.1 + 0.7|e0|/D.
However, measured values of smob/D for silt soils fall within a narrow range of 0.01 to 0.10, showing no clear correlation with |e0|/D or slope angle α (Figure 10a,b).
For the mobilization displacement of residual resistance sres/D, DNV GL [7], provides the following estimates for clay:
- Low: 0.6;
- Best: 1.5;
- High: 2.8.
3.3. Effects of Silt Seabed Slope
For a pipe with fixed submerged weight (Ws = 0.42 kN/m, corresponding to G = 1.092), Figure 11a shows that the lateral breakout soil resistance FRu decreases as α varies from −15° to +15°, whereas the breakout drag force FDu increases nearly linearly. These two quantities are related through Equation (3), which indicates that steeper slopes amplify the difference between FDu and FRu. In alignment with earlier studies on sandy seabeds [37], FRu is consistently higher during downslope instability (DI) than during upslope instability (UI).
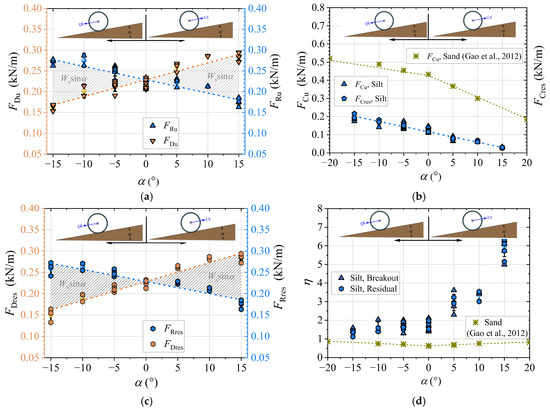
Figure 11.
Effects of seabed slope angle on: (a) FDu and FRu; (b) FCu and FCres; (c) FDres and FRres; (d) η (tests S-1~S-7: G = 1.092, α = −15°~+15°, |e0|/D ≤ 0.05, d50/D = 2.35 × 10⁻⁴, φ = 27.4°, c/γ′D = 3.12, Dr = 0.59; Data for sand are from Gao et al. [37]).
The reduction in FRu is primarily attributed to the decrease in normal contact force FCu, given by Equation (4), as illustrated in Figure 11b. This reduction in FCu reduces the available pipe-soil friction, thereby lowering the overall soil resistance. It is noteworthy that the rate of reduction in FCu is nearly identical for both UI and DI on silt seabeds, whereas sands exhibit a markedly slower reduction rate for DI.
Corresponding trends in residual soil resistance FRres and residual drag force FDres are presented in Figure 11c. The difference between FRu and FRres remains below 15% across all slope angles (refer to Table 2), suggesting that both peak and residual soil resistances are governed by similar mechanisms—predominantly pipe-soil friction and cohesion, with minor influence from soil berms—under the shallow embedment conditions (|e0|/D ≤ 0.05) examined here.
The lateral-soil-resistance coefficient η, encompassing both breakout and residual values, is presented as a function of α in Figure 11d. In contrast to sandy seabeds, where η for both UI and DI exceeds values on horizontal seabeds [37], silt exhibits a nonlinear increase in η with α. Furthermore, η is consistently higher for UI than for DI across all slope conditions.
3.4. Effects of Submerged Pipe Weight
The influence of submerged pipe weight is investigated under horizontal seabed conditions (α = 0°), as shown in Figure 12. Tests are conducted with Ws ranging from 233.7 N/m to 560.9 N/m, corresponding to dimensionless submerged weight G from 0.607 to 1.456. As shown in Figure 12a, both breakout and residual drag forces (FDu and FDres, respectively) increase linearly with G, and remain within 10% of each other across the range of G. This linear relationship is consistent with previous observations on sandy seabeds [44]. However, the absolute values of both FDu and FDres are higher on silt seabed than on sand seabed by a nearly constant margin, due to the additional cohesive resistance present at the pipe-silt interface.
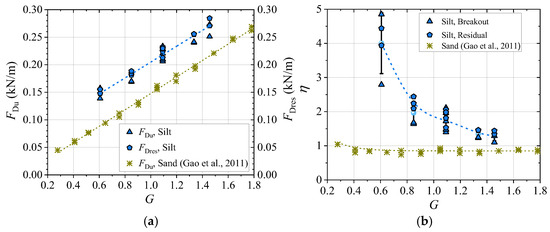
Figure 12.
Effects of dimensionless submerged pipe weight on: (a) FDu and FDres; (b) η (Tests S-8~S-11: G = 0.607~1.456, α = 0°, |e0|/D ≤ 0.05, d50/D = 2.35 × 10⁻⁴, φ = 27.4°, c/γ′D = 3.12, Dr = 0.59; Data for sand are from Gao et al. [44]).
Figure 12b shows the variation in the lateral-soil-resistance coefficient η with G. For both silt and sand seabed, η decreases with increasing G, eventually approaching a stable value. The decrease is marginal for sand [44], where soil resistance is primarily frictional. In contrast, silt exhibits a more pronounced inverse relationship approximating η ∝ 1/G, highlighting the significant role of cohesive resistance. Moreover, the relative contribution of cohesion progressively decreases as G increases.
4. Improved Predictive Model
This section proposes an improved model for predicting the breakout soil resistance of silt seabeds during lateral pipe instability, incorporating the effect of seabed slope. Building upon the data presented in Figure 12, Figure 13 further presents the relationship between the lateral-soil-resistance coefficient η and the dimensionless normal contact force FCu/γ′D2 under various slope conditions (Tests S-1 to S-11, |e0|/D ≤ 0.05), revealing a distinct nonlinear negative correlation.
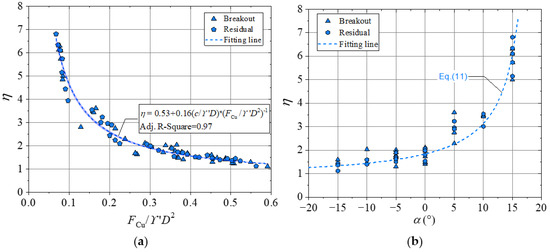
Figure 13.
Variation in η with: (a) FCu/γ′D2; (b) α (tests S-1~S-11: G = 0.607~1.456, α = −15°~+15°, |e0|/D ≤ 0.05, d50/D = 2.35 × 10⁻⁴, φ = 27.4°, c/γ′D = 3.12, Dr = 0.59).
As discussed above, the lateral soil resistance FRu is conceptualized as comprising two components: one proportional to the normal contact force, and another independent of it. Accordingly, the lateral-soil-resistance coefficient η can be formulated as follows:
here, coefficient ≈ 0.53 represents the apparent friction coefficient at the pipe-silt interface, and the coefficient ≈ 0.16 accounts for cohesive resistance and soil berm effects. The parameters of c/γ′D and FCu/γ′D2 represent the dimensionless soil cohesion and the dimensionless normal contact force, respectively. Predictions from Equation (9) show strong agreement with experimental data (Figure 13a).
Next, by substituting Equation (4) into Equation (3b), the vertical normal contact force FCu is given by the following:
Substituting Equation (10) into Equation (9) provides an explicit formula for η in terms of the seabed slope angle α as follows:
The resulting variation in η with α, calculated using Equation (11), is consistent with experimental trends across all slope angles (Figure 13b).
The model is applicable to conditions with shallow embedment (|e0|/D ≤ 0.05, Tests S-1~S-11). For deeper embedment (Tests S-12~S-14, |e0|/D > 0.05), the normal contact force FCu approaches zero (Figure 9b), indicating that frictional resistance becomes negligible. Under these conditions, breakout soil resistance is dominated by suction, partially mobilized passive soil pressure, and cohesive resistance.
Integrating the entire dataset (Tests S-1~S-14), the dimensionless ultimate lateral soil resistance FRu/γ′D2 for pipelines on sloping silt seabeds can be described by the following piecewise function:
Figure 14 compares the predictions from Equation (12) with experimental measurements. The majority of prediction errors are within 25%. Also shown are results from DNV GL [7]. Model 2 for fully drained (sand) and fully undrained (clay) conditions, which are included to represent horizontal sand and clay seabeds, respectively. The comparison clearly demonstrates that accounting for seabed slope significantly improves predictive accuracy.
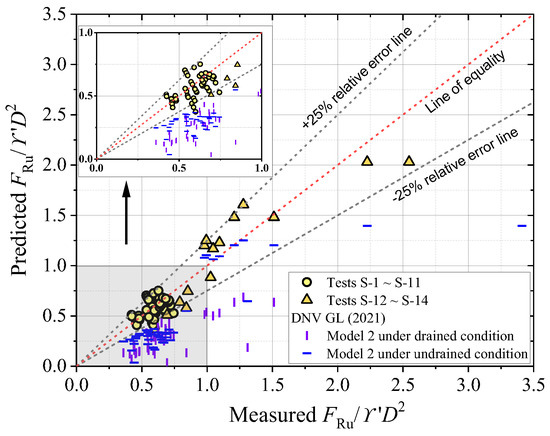
Figure 14.
Comparison between predicted and measured ultimate lateral soil resistance FRu/γ′D2 (tests S-1~S-14: G = 0.607~1.577, α = −15°~+15°, |e0|/D = 0.01~0.50, d50/D = 2.35 × 10⁻⁴, φ = 27.4°, c/γ′D = 3.12, Dr = 0.59; The recommended practice DNV GL-F114 [7] is included for comparison).
5. Conclusions
This study investigates the lateral instability of pipelines on sloping silt seabeds under unidirectional currents using a custom-developed testing facility, with the aim of developing an improved model for predicting lateral soil resistance that incorporates seabed slope effects. The main conclusions are as follows:
- (1)
- In contrast to sandy seabeds, the lateral pipe-soil interaction on silt exhibits more brittle characteristics. The difference between peak and residual soil resistance is closely related to the initial embedment ratio. When the initial embedment ratio is less than 0.05, this difference remains below 15%. Breakout soil resistance is primarily governed by interface friction and cohesion under shallow embedment conditions, while suction becomes the dominant mechanism at greater embedment depths.
- (2)
- For a fixed submerged pipe weight, the ultimate lateral drag force increases linearly with the slope angle, whereas the soil resistance decreases linearly. The difference between these two forces is attributed to the gravitational component Wssinα. The lateral–soil–resistance coefficient on silt follows the sequence: upslope > flat > downslope, a pattern that markedly contrasts with that observed on sandy seabeds. Moreover, the decay rate of this coefficient with increasing dimensionless submerged pipe weight is significantly more pronounced for silt than for sand.
- (3)
- A piecewise model is proposed to predict the ultimate lateral soil resistance, explicitly incorporating the influence of seabed slope. The model shows good agreement with experimental data and offers improved accuracy over existing DNV GL models, particularly for partially drained sloping silt seabeds.
6. Future Work
Based on the present findings, future research will proceed along two primary directions: firstly, performing coupled flume experiments under natural conditions, combined with field monitoring, to validate the mechanisms governing pipe-silt interactions; secondly, conducting fundamental studies on the physical processes of seepage and gap formation behind the pipe, along with their impact on suction development, through coupled pore-elastoplastic numerical modeling. These efforts are expected to offer deeper insights into pipeline stability on partially drained continental silt slopes and to support the incorporation of slope-specific criteria in future engineering design.
Author Contributions
Conceptualization: Y.S.; experiments: D.Z., N.W., J.L. and Y.Z.; data analyses: D.Z., Y.H. and N.W.; writing—original draft: D.Z.; validation, N.W.; review and editing, Y.H. and Y.S. All authors have read and agreed to the published version of the manuscript.
Funding
This work was funded by the National Natural Science Foundation of China (12302506 and 52201346), and Joint Industry Project (Project No. E-0823P107).
Data Availability Statement
The data presented in this study are available upon request from the corresponding author.
Conflicts of Interest
Authors Yang He and Ying Zhang were employed by the company Offshore Oil Engineering Co., Ltd. The remaining authors declare that the research was conducted in the absence of any commercial or financial relationships that could be construed as a potential conflict of interest.
Notations
| A1 | Coefficient of the first-order term in Equation (1) |
| A2 | Coefficient of the second-order term in Equation (1) |
| c | Soil cohesion |
| c/γ′D | Dimensionless soil cohesion |
| Cc | Curvature coefficient of soil |
| CD | Drag force coefficient in Equation (7) |
| CL | Lift force coefficient in Equation (7) |
| Cu | Uniformity coefficient of soil |
| d50 | Mean size of soil grains |
| d50/D | Ratio of median particle size to pipe diameter |
| D | Outer diameter of pipe |
| Dr | Relative density of soil |
| e0 | Initial embedment (settlement) of pipe |
| e0/D | Ratio of initial embedment to pipe diameter |
| |e0|/D | Absolute value of e0/D |
| e/D | Embedment ratio during lateral instability of pipe |
| |e|/D | Absolute value of e/D |
| FC | Vertical pipe-soil contact force or support force of soil |
| FCu | Vertical contact force at which the ultimate lateral soil resistance is attained |
| FCu/γ′D2 | Dimensionless vertical contact force |
| FCres | Vertical contact force at which the residual lateral soil resistance is attained |
| FD | Drag force applied to the pipe by ocean currents |
| FDu | Ultimate (breakout) lateral drag force |
| FDu/γ′D2 | Dimensionless breakout drag force |
| FDres | Residual lateral drag force |
| FL | Lift force applied to the pipe by ocean currents |
| FR | Lateral soil resistance that prevents pipe instability. |
| FR0 | Initial lateral soil resistance against the pipe sliding downward along the seabed due to its submerged weight. |
| FRu | Ultimate (breakout) lateral soil resistance |
| FRu2 | Second peak lateral soil resistance, see Figure 8 |
| FRu/γ′D2 | Dimensionless ultimate lateral soil resistance |
| FRres | Residual lateral soil resistance |
| Dimensionless submerged weight of pipe | |
| g | Gravitational acceleration |
| h | Water depth in the flume |
| Ip | Plasticity index of soil |
| k | Surface roughness of pipe |
| k/D | Normalized pipe surface roughness |
| L | Length of the model pipe |
| p | Hydrostatic pressure |
| s | Lateral displacement of the pipe along the seabed surface |
| smob | Mobilization displacement required to achieve breakout soil resistance |
| sres | Mobilization displacement required to achieve residual soil resistance |
| t | Time |
| U | Current velocity |
| WS | Submerged weight of pipe |
| α | Seabed slope angle |
| Coefficient representing apparent friction coefficient at the pipe-silt interface in Equation (8) | |
| Coefficient representing cohesive resistance and soil berm effects in Equation (8) | |
| Dimensionless lateral-soil-resistance coefficient | |
| A constant in Equation (1) | |
| Effective (buoyant) unit weight of soil | |
| Inclination angle of the resultant hydrodynamic force relative to the seabed in Equation (7) | |
| ρw | Density of water |
| Internal friction angle of soil |
References
- Murawski, S.A.; Ainsworth, C.H.; Gilbert, S.; Hollander, D.J.; Paris, C.B.; Schlüter, M.; Wetzel, D.L. Scenarios and Responese to Future Deep Oil Spills-Fighting the Next War; Springer: Berlin/Heidelberg, Germany, 2020. [Google Scholar]
- Wang, L.X.; Pan, J.P.; Yang, L.L. Present conditions and prospect of global deepwater oil and gas exploration and development. Pet. Sci. Technol. Forum 2020, 39, 31–37. (In Chinese) [Google Scholar] [CrossRef]
- Jones, W.T. On-bottom pipeline stability in steady water currents. J. Pet. Technol. 1978, 30, 475–484. [Google Scholar] [CrossRef]
- Drumond, G.P.; Pasqualino, I.P.; Pinheiro, B.C.; Estefen, S.F. Pipelines, risers and umbilicals failures: A literature review. Ocean Eng. 2018, 148, 412–425. [Google Scholar] [CrossRef]
- Palmer, A.C.; King, R.A. Subsea Pipeline Engineering, 2nd ed.; PennWell Corporation: Tulsa, OK, USA, 2008. [Google Scholar]
- Det Norske Veritas (DNV). DNV-RP-F109: On-Bottom Stability Design of Submarine Pipelines; DNV: Oslo, Norway, 2010. [Google Scholar]
- Det Norske Veritas, Germanischer Lloyd (DNV GL). DNVGL-RP-F114: Pipe-Soil Interaction for Submarine Pipelines; DNV GL: Oslo, Norway, 2021. [Google Scholar]
- Det Norske Veritas, Germanischer Lloyd (DNV GL). DNVGL-RP-F110: Global Buckling of Submarine Pipelines Due to High Temperature/High Pressure; DNV GL: Oslo, Norway, 2018. [Google Scholar]
- Dingle, H.R.C.; White, D.J.; Gaudin, C. Mechanisms of pipe embedment and lateral breakout on soft clay. Can. Geotech. J. 2008, 45, 636–652. [Google Scholar] [CrossRef]
- White, D.J.; Dingle, H.R.C. The mechanism of steady friction between seabed pipelines and clay soils. Géotechnique 2011, 61, 1035–1041. [Google Scholar] [CrossRef]
- Youssef, B.S.; Tian, Y.; Cassidy, M.J. Centrifuge modelling of an on-bottom pipeline under equivalent wave and current loading. Appl. Ocean Res. 2013, 40, 14–25. [Google Scholar] [CrossRef]
- Lyons, C.G. Soil resistance to lateral sliding of marine pipelines. In Proceedings of the Fifth Annual Offshore Technology Conference, Houston, TX, USA, 28 April–1 May 1973; Volume OTC1876, pp. 479–484. [Google Scholar]
- Wagner, D.A.; Murff, J.D.; Brennodden, H.; Sveggen, O. Pipe-soil interaction model. J. Waterw. Port Coast. Ocean. Eng. 1989, 115, 205–220. [Google Scholar] [CrossRef]
- Verley, R.L.P.; Sotberg, T. A soil resistance model for pipelines placed on sandy soils. J. Offshore Mech. Arct. Eng. 1994, 116, 145–153. [Google Scholar] [CrossRef]
- Fredsøe, J. Pipeline–seabed interaction. J. Water. Port Coast. 2016, 142, 03116002. [Google Scholar] [CrossRef]
- Cai, J.; Grognec, P.L. Lateral buckling of submarine pipelines under high temperature and high pressure—A literature review. Ocean Eng. 2022, 244, 110254. [Google Scholar] [CrossRef]
- Wang, N.; Qi, W.G.; Gao, F.P. Predicting the instability trajectory of an obliquely loaded pipeline on a clayey seabed. J. Mar. Sci. Eng. 2022, 10, 299. [Google Scholar] [CrossRef]
- Wang, L.; Liu, R. The effect of a berm on the lateral resistance of a shallow pipeline buried in sand. Ocean Eng. 2016, 121, 13–23. [Google Scholar] [CrossRef]
- Liu, R.; Guan, Y.Z.; Li, C.F.; Sun, X.; Liu, Y.N.; Yu, Z. Study on the lateral breakout resistance of submarine pipelines in the sand wave area. Ocean Eng. 2025, 329, 121126. [Google Scholar] [CrossRef]
- Gao, F.P.; Gu, X.Y.; Jeng, D.S.; Teo, H.T. An experimental study for wave-induced instability of pipelines: The breakout of pipelines. Appl. Ocean Res. 2002, 24, 83–90. [Google Scholar] [CrossRef]
- Gao, F.P.; Yang, B.; Yan, S.M.; Wu, Y.X. Occurrence of spanning of a submarine pipeline with initial embedment. In Proceedings of the 6th International Offshore and Polar Engineering Conference, Lisbon, Portugal, 1–6 July 2007. [Google Scholar]
- Gao, F.P. On-Bottom Stability of Submarine Pipelines. In Encyclopedia of Ocean Engineering; Springer: Berlin/Heidelberg, Germany, 2020. [Google Scholar]
- Wang, F.Y.; Zhang, J.S.; Guo, Y.K.; Chen, H.; Zhang, Y.C.; Wang, G.H.; Zhang, Q.B. On the scour characteristics of submarine flexible cable in three-dimensional flow. Ocean Eng. 2025, 322, 120458. [Google Scholar] [CrossRef]
- Zhao, M. A comprehensive review of the research on local scour below subsea pipelines under steady currents and waves. Ocean Eng. 2025, 318, 120114. [Google Scholar] [CrossRef]
- Gao, F.P.; Luo, C.C. Flow-pipe-seepage coupling analysis of spanning initiation of a partially-embedded pipeline. J. Hydrodyn. 2010, 22, 478–487. [Google Scholar] [CrossRef]
- Shi, Y.M.; Gao, F.P. Lateral instability and tunnel erosion of a submarine pipeline: Competition mechanism. Bull. Eng. Geol. Environ. 2018, 77, 1069–1080. [Google Scholar] [CrossRef]
- Shi, Y.M.; Gao, F.P.; Wang, N.; Yin, Z.Y. Coupled flow-seepage-elastoplastic modeling for competition mechanism between lateral instability and tunnel erosion of a submarine pipeline. J. Mar. Sci. Eng. 2021, 9, 825. [Google Scholar] [CrossRef]
- Zang, Z.P.; Chen, Y.F.; Zhang, J.F.; Tian, Y.H.; Esteban, M.D. Experimental study on local scour and onset of VIV of a pipeline on a silty seabed under steady currents. Appl. Ocean Res. 2021, 109, 102560. [Google Scholar] [CrossRef]
- Coleman, J.M.; Bouma, A.H.; Prior, D.B.; Roberts, H.H. Near-surface geology of the Gulf of Mexico continental slope. In Proceedings of the 21st Annual Offshore Technology Conference, Houston, TX, USA, 1–4 May 1989. [Google Scholar]
- Zhou, Q.J.; Dong, Y.K.; Liu, L.J.; Li, X.S. Sedimentation characteristics of surficial sediments in baiyun canyon area, northern south China sea. Cont. Shelf Res. 2024, 282, 105342. [Google Scholar] [CrossRef]
- Shi, Y.M.; Wang, N.; Gao, F.P.; Qi, W.G.; Wang, J.Q. Anti-sliding capacity for submarine pipeline walking on a sloping sandy seabed. Ocean Eng. 2019, 178, 20–30. [Google Scholar] [CrossRef]
- Ye, Y.C.; Lai, X.H.; Pan, G.F.; Li, Q.T.; Zhuang, Z.Y.; Liu, D.J.; Chen, X.L.; Wei, Y.J.; Chen, J.R.; Hu, T.J.; et al. Marine Geo-Hazards in China; China Ocean Press: Beijing, China, 2017. [Google Scholar]
- Rafiei, A.; Rahman, M.S.; Gabr, M.A. Coupled analysis for response and instability of sloping seabed under wave action. Appl. Ocean Res. 2019, 88, 99–110. [Google Scholar] [CrossRef]
- Feng, A.; Magee, A.R.; Price, W.G. Two dimensional wave-current-structure interaction with flat or sloping seabed environment in a linearized framework. Ocean Eng. 2019, 173, 732–747. [Google Scholar] [CrossRef]
- Xu, L.Y.; Zhang, J.; Wang, L.; Chen, W.Y.; Cai, F.; Xue, Y.Y.; Chen, G.X. Wave-induced liquefaction analysis of mildly sloping sandy seabed. Soil Dyn. Earthq. Eng. 2024, 185, 108873. [Google Scholar] [CrossRef]
- Bransby, M.F.; Barlow, D.T.; Brown, M.J.; Davidson, J.; Brankin, S.; Robinson, S. The performance of pipeline ploughs traversing seabed slopes. Ocean Eng. 2018, 148, 125–135. [Google Scholar] [CrossRef]
- Gao, F.P.; Han, X.T.; Cao, J.; Sha, Y.; Cui, J.S. Submarine pipeline lateral instability on a sloping sandy seabed. Ocean Eng. 2012, 50, 44–52. [Google Scholar] [CrossRef]
- Peng, Y.; Qu, L. Micromechanical analysis of lateral pipe–soil interaction instability on sloping sandy seabeds. J. Mar. Sci. Eng. 2024, 12, 225. [Google Scholar] [CrossRef]
- Gao, F.P.; Wang, N.; Li, J.H.; Han, X.T. Pipe-soil interaction model for current-induced pipeline instability on a sloping sandy seabed. Can. Geotech. J. 2016, 53, 1822–1830. [Google Scholar] [CrossRef]
- Shi, Y.M.; Gao, F.P. Analytical model for predicting lateral instability of a submarine pipeline on the soft clayey seabed. Period. Ocean Univ. China 2017, 47, 141–147. (In Chinese) [Google Scholar]
- Craig, R.F. Craig’s Soil Mechanics, 7th ed.; Taylor & Francis Group: London, UK, 2004. [Google Scholar]
- Xu, K.; Gao, F.P.; Qi, W.G. Sliding-rolling mechanism for lateral stability of the pipeline on a silty seabed. In Proceedings of the 13th Pacific-Asia Offshore Mechanics Symposium, Jeju, Republic of Korea, 14–17 October 2018. [Google Scholar]
- Taylor, R.N. Geotechnical Centrifuge Technology; Taylor & Francis Group: London, UK, 1995. [Google Scholar]
- Gao, F.P.; Yan, S.M.; Yang, B.; Luo, C.C. Steady flow-induced instability of a partially embedded pipeline: Pipe-soil interaction mechanism. Ocean Eng. 2011, 38, 934–942. [Google Scholar] [CrossRef]
Disclaimer/Publisher’s Note: The statements, opinions and data contained in all publications are solely those of the individual author(s) and contributor(s) and not of MDPI and/or the editor(s). MDPI and/or the editor(s) disclaim responsibility for any injury to people or property resulting from any ideas, methods, instructions or products referred to in the content. |
© 2025 by the authors. Licensee MDPI, Basel, Switzerland. This article is an open access article distributed under the terms and conditions of the Creative Commons Attribution (CC BY) license (https://creativecommons.org/licenses/by/4.0/).