Abstract
As offshore wind power moves into deeper waters, large-scale electrical platforms are key to efficient power transmission. However, their heavy topside modules create major installation challenges. As traditional lifting methods are inadequate, the float-over method has become a viable solution for installing topside modules, but it is essential to study the structural responses to collisions during the process to ensure construction and equipment safety. This study establishes a physical model of the offshore converter station at a 1:65 scale based on the elastic force-gravity similarity principle. Assuming the barge carrying the topside module descends at a constant speed, the study investigates the dynamic response of the platform during the float-over mating process. Float-over collision tests are conducted to obtain the platform’s acceleration, strain, and displacement responses and to analyze the effects of collision speed, offset position, and Leg Mating Unit (LMU) stiffness on the dynamic structural response characteristics. The results show that as collision speed increases from 10 mm/s to 50 mm/s, the topside acceleration response increases up to 5.7 times. Beam strain remains mostly unchanged, and displacement increases first, then decreases. Under fixed descent velocity, x-offset increases jacket strain and converter valve acceleration, while y-offset raises platform acceleration and reduces valve acceleration by approximately 20 percent. At 50 mm/s, higher LMU stiffness causes the acceleration response to first drop, then rise. These findings support safe float-over installation.
1. Introduction
Amid accelerating electricity demand and the spread of net-zero commitments, offshore wind has expanded rapidly and is emerging as a core decarbonization technology [1]. Numerous companies worldwide are actively entering the offshore wind power sector, driving the preparation and improvement of the industry chain. A large number of offshore wind farms have already been put into operation, and the industry has formed a large-scale market that continues to grow rapidly [2,3]. As nearshore wind resources become increasingly saturated, offshore wind farms are gradually expanding into deeper waters. The construction of large-scale offshore converter station platforms can enhance the power transmission efficiency and energy utilization of offshore wind farms, thereby technically reducing power generation costs [4]. These platforms feature topside modules weighing up to ten thousand tons, posing great installation challenges and high construction risks. Therefore, it is crucial to complete the installation of the converter station topside module while ensuring the safety of both its structure and electrical equipment. Traditional lifting methods are not suitable for installing such massive topside modules. Given extensive evidence that float-over installations are safe and stable in offshore oil and gas practice, the method is a viable option for mating large offshore converter-station topside modules to jacket foundations [5].
In 1983, the Philips Maureen Project successfully used the float-over method to install the topside modules of an offshore platform, marking the world’s first offshore production platform installed using this technique. Since then, the advantages of the float-over method have been recognized, and many scholars both in China and abroad have devoted efforts to its research and application. D. Edelson et al. [6,7] provided a systematic introduction to the float-over method and gave a brief summary of the related hydrodynamic issues. Hong et al. [8] explored the technical, operational, and economic aspects of floating offshore wind farm installation, providing a comprehensive overview of the advanced technologies at that time. Through a critical analysis of the complexities involved in the installation process, they identified key research areas to promote the widespread application and efficiency of floating wind power technologies. They emphasized the importance of standardized foundation design, advanced installation methods, and collaboration between academia and industry. Traditional float-over installations require the jacket structure to have a groove at the top in either the longitudinal or transverse direction to accommodate barge entry. The direction of the groove is crucial, as it significantly affects the float-over installation of the topside module. O’Neill et al. [9,10,11,12,13] investigated the structural integrity of typical jackets under float-over conditions and compared them with traditional lifting methods. They highlighted that proper selection of mooring and fender system parameters is critical for controlling the relative motion and impact loads between the topside module and the lower jacket. Duquesnay et al. [14] emphasized the importance of the mating process in float-over installations. They examined the influence of construction weather standards on float-over operations and discussed the effects of mooring lines and component stiffness on the performance of the installation system.
At present, numerous studies on float-over installation are being conducted by scholars, primarily using numerical simulations and physical model tests. These studies cover various types of platforms, including jacket platforms and Spar platforms, and provide a relatively comprehensive analysis of motion responses and load characteristics during the float-over mating process. Chu et al. [15] developed and evaluated the float-over installation design for the Wandoo B integrated deck using both numerical simulation and physical model testing. Through time-domain analysis, they studied mooring line forces, impacts between barge fenders and the concrete gravity structure (CGS), and the loads on the LMU and DSU. Koo et al. [16,17] investigated the float-over installation of Spar platforms using model tests and numerical simulations. They presented the motion responses and load characteristics of the float-over installation under random seas, regular waves, and three wave directions (beam seas, head seas, and oblique seas). Jung et al. [18] conducted numerical simulations of float-over installation using SESAM software with a quasi-static analysis method. The simulation process was divided into phases—entry, load transfer, and exit—evaluated at 0%, 50%, and 100% time points. In their model, the LMU and DSU were represented by springs with constraints in three directions, while fender and mooring line stiffnesses were considered nonlinear. Jung et al. [19] further applied time-domain analysis to verify the safety of float-over operations across all load transfer phases. They modeled components such as the DSU, LMU, fenders, and mooring lines to study interactions among the barge, topside, and jacket. Berhault et al. [20] carried out a numerical study of float-over installation for a jacket platform topside module in a specific sea area. Their model included the mooring system, LMU, DSU, and fenders. Mooring lines and chains were computed using a quasi-static catenary method, while the LMU, DSU, and fenders were simplified using linear spring stiffness. However, due to slow computational speed, the study could only capture general trends in multibody coupled motion and was not sufficient for engineering design guidance. Tahar et al. [21] used MLTSIM and WAMIT software to study dual-barge float-over installation via numerical simulations and model tests. They simplified the load transfer process using time-domain theory and used WAMIT’s Green function method to calculate radiation and diffraction potentials on the mean wetted surface. This yielded frequency-domain hydrodynamic parameters such as added mass, damping coefficients, first-order wave force transfer functions, and second-order mean drift forces. MLTSIM was then used to solve motion differential equations in the time domain. Ji et al. [22] studied float-over installation of a Spar platform in West African sea conditions using MLTSIM for time-domain simulations. They obtained six-degree-of-freedom motions and multibody interaction forces of the barge and topside module. Based on these results, they designed the stiffness of the LMU and DSU and selected appropriate configurations by comparing coupled responses. Tan et al. [23] focused on the LMU and DSU used during float-over operations, analyzing the loads they experienced during load transfer. Liu and Li [24] proposed a two-step mode expansion methodology for offshore jacket structures, which took into account the modeling errors between the finite element model and the tested structure and estimated them within the range of physical significance. Liu et al. [25] proposed an improved modal strain energy method for damage localization in jacket-type offshore wind turbines by defining a series of stiffness correction factors. Byle [26] provided an overview of float-over system components and their functions for offshore platforms and analyzed potential design risks including both obvious high-consequence failures and hidden performance deficiencies, ultimately proposing a sample specification. Hamilton [27] studied float-over mooring systems, discussing their dynamic characteristics under marine environmental conditions and analyzing fender collisions and barge-to-jacket clearances. Xia et al. [28] conducted tank model tests to simulate float-over installation of small offshore platform topside modules, using springs to measure collision forces between the barge and the jacket. Kim et al. [29] performed experimental studies focused on installation of semi-submersible platforms. Although many engineering projects have adopted the float-over method and related studies are abundant, most remain numerical in nature. To accommodate computational constraints, numerical models often simplify the platform and the installation process, which limits the engineering guidance value of their results. Only a few physical model tests have focused on the forces and load transfer of local components such as the LMU and mooring lines. This study uses systematic physical model tests to examine, at the whole-structure level, how collision speed, offset, and LMU stiffness affect the platform’s dynamic response. Particular attention is given to the vibration sensitivity of electrical equipment at the corresponding locations. This study fills a gap in the existing literature and provides a more comprehensive theoretical basis and experimental data for the safe implementation of float-over installation of offshore power platforms.
This study conducts physical model tests on a large-scale offshore converter station platform, using the elastic–gravity similarity principle with a geometric scale ratio of 1:65. A six-degree-of-freedom motion platform is used to carry the topside module model, which is mated with the jacket model at different descent velocities. The tests analyze the platform’s acceleration, strain, and displacement responses during the float-over collision process. The study focuses on the dynamic structural response characteristics under varying descent velocities and further investigates the effects of topside horizontal offset and Leg Mating Unit (LMU) stiffness. The results aim to provide theoretical support and experimental reference for the safe float-over installation of large-scale offshore converter station platforms.
2. Experiments
2.1. Similarity Criterion
During the float-over collision process, various components of the converter station platform primarily undergo bending vibrations. In order to maintain similarity in inertial forces, elastic restoring forces, and external forces, the model must first satisfy the elastic-force similarity law [30]. The similarity relationship can be expressed as:
where λ, λρ, λA, λt, λu, λE, and λI represent the geometric similarity ratio, mass density ratio, cross-sectional area ratio, time scale ratio, deformation ratio, elastic modulus ratio, and moment of inertia ratio, respectively.
In the case of bending vibration of structural components, a more flexible approach can be adopted-strict geometric similarity is not required. Instead, the requirements on cross-sectional dimensions can be relaxed, and it is sufficient to maintain similarity in sectional stiffness. Therefore, the following relationship holds:
where λr denotes the similarity ratio of the radius of gyration of the cross-section.
The model satisfies the similarity law between elastic force and gravity [31], and the corresponding similarity relationship is given by:
To facilitate model fabrication, the density similarity ratio is set to 1.0. Therefore, the final similarity relationships for model construction are as follows:
2.2. Physical Model
The experiment takes a 10,000-ton offshore converter station platform as the research object. Based on the elastic–gravity similarity criterion, a geometric scale ratio of 1:65 was selected for the physical model construction. As shown in Figure 1, the model consists of two main parts: the topside module and the jacket structure. The jacket is equipped with Leg Mating Units (LMUs), which buffer collisions as load is transferred from the barge to the jacket during float-over mating. In terms of geometry, the stabbing cone is mounted on the underside of the topside module, and the receiver is mounted on the top of the jacket; the receiver has a conical recess that mates with the cone. During float-over mating, the cone enters the recess under self-weight and guiding constraints; the conical interface provides a self-centering effect that converts small horizontal offsets and minor angular misalignments into normal contact forces along the cone surface, thereby guiding and aligning the module. In this study, the LMU was simplified for modeling (see Figure 1b): the shell, receiver, and cone were 3D-printed in fiber-reinforced nylon, and the internal buffering was represented by springs selected to match the prototype’s vertical stiffness (approximated by piecewise-linear segments). The lengths of tubular and beam members were scaled according to the geometric similarity ratio, while cross-sectional dimensions were designed based on similarity of the moment of inertia. To satisfy mass similarity, lead blocks and lead rings were used as counterweights [32]. The topside module and jacket were fabricated from acrylic (PMMA).
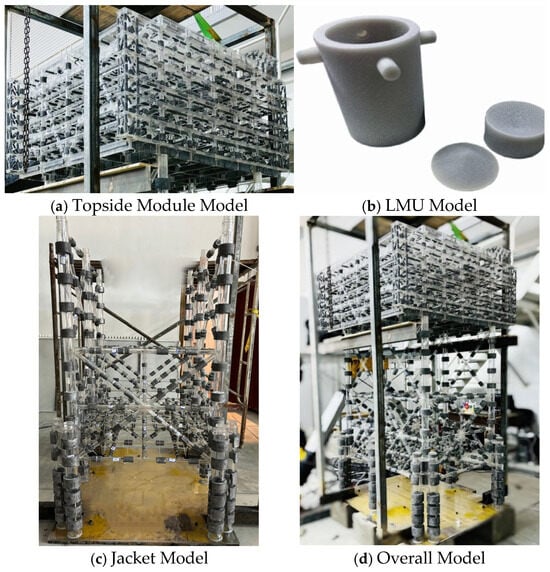
Figure 1.
Offshore converter station platform model.
During model fabrication, all beam members with different cross-sections were replaced by rectangular beams to satisfy the similarity of the radius of gyration, while some slender tubular members were substituted with solid circular rods. The topside module model measures 1.25 m × 1.15 m × 0.70 m (length × width × height), with the corresponding prototype dimensions of 81.25 m × 74.75 m × 45.50 m; the jacket model measures 1.27 m × 0.95 m × 1.70 m, with prototype dimensions of 82.55 m × 61.75 m × 110.50 m. Using the P1650 × 52 member as an example, the similarity relations and numerical ratios of the relevant physical quantities are summarized in Table 1. The structural parameters of selected components in the topside module model are listed in Table 2.

Table 1.
Model design basic parameter similarity relations (using P1500 × 30 member as an example).
Table 2.
Cross-sectional dimension parameters of components in the topside block section.
Due to differences in material properties between the prototype and the model, as well as variations in weight distribution on the platform, lead sheets were used to adjust the weight of individual components in the model structure. For structural components, the mass was scaled according to the mass similarity ratio. For non-structural mass, such as equipment weight, scaling was based on the force similarity ratio. As a result, both gravitational and elastic similarity requirements were satisfied. The weight of the topside module model is approximately 215.8 kg, the jacket model weighs about 161.3 kg, and the total weight of the offshore converter station platform model is approximately 377.1 kg.
2.3. Experimental Setup
The docking collision test focuses on the impact that occurs during the mating process between the stabbing cone of the topside module and the LMU on the jacket structure. The topside module model is hoisted and released at a certain velocity (as shown in Table 3) using a six-degree-of-freedom (6-DOF) motion platform to achieve docking with the jacket model. Due to spatial constraints, the platform surface was extended, and the extended portion was considered an integral part of the motion platform. The overall experimental setup is shown in Figure 2 and Figure 3.
Table 3.
Test groups with different collision velocities.
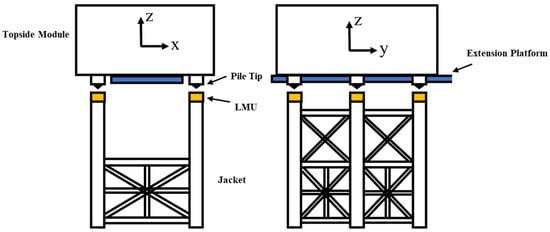
Figure 2.
Schematic diagram of the experimental setup.
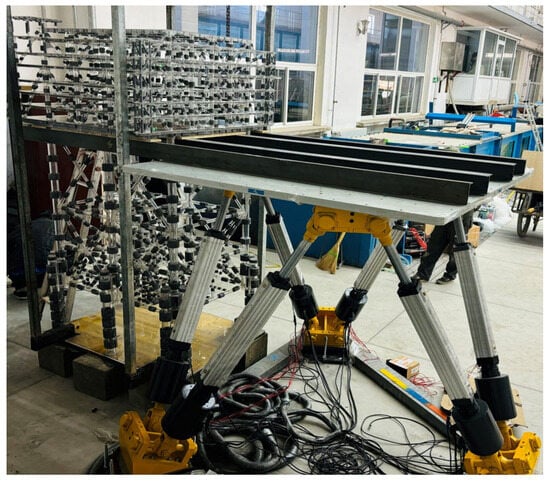
Figure 3.
Experimental setup.
The physical quantities measured in the experiment include the acceleration, strain, and displacement at key locations of the topside module; the acceleration and strain at the LMUs; and the strain on the main legs of the jacket structure. An NI (National Instruments, TX, USA) data acquisition system was employed, in combination with strain gauges, to collect strain data at critical structural locations. Type-II non-waterproof accelerometers were used to measure acceleration responses at key points. These sensors offer a measurement accuracy of up to 0.3%, a sampling frequency of up to 1000 Hz, and provide high stability and strong anti-interference capability. Displacement responses were measured using the FZ-Motion optical motion capture system. This system features high-speed, high-resolution imaging sensors (up to 12 megapixels), a working distance of up to 40 m, and a maximum frame rate of 500 FPS.
Considering that important electrical equipment needs to be installed on the first deck of the platform (as shown in Figure 4a), where all lines in the figure denote beams, three accelerometers and six strain gauges were installed at central locations on the deck, with all sensors mounted on the beams. The strain gauges were placed on the beam aligned with the x-axis and at positions midway between the two beams aligned with the y-axis. Additionally, four acceleration sensors were placed at the edges of different platform levels (as shown in Figure 4b), and one acceleration sensor was installed at each LMU. Two main legs were selected, with four strain gauges placed around the circumference at the top and mid-height of each leg (as shown in Figure 4c). Finally, three displacement measurement points were arranged on one side of the topside module (as shown in Figure 4d) to monitor its displacement variation.
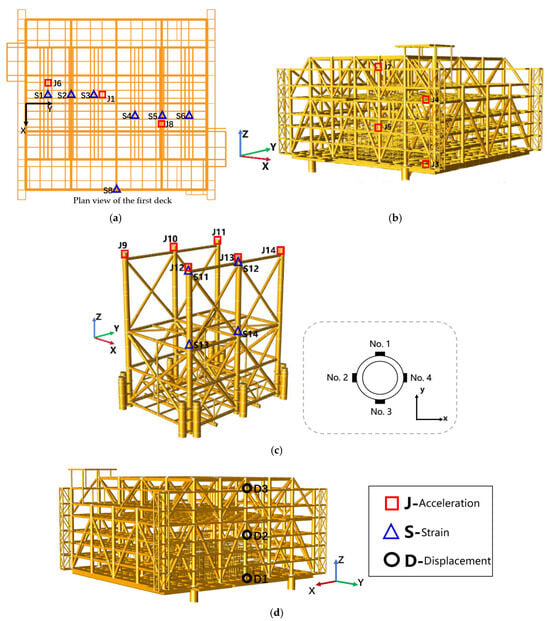
Figure 4.
Sensor arrangement. (a) Plan view of measurement points on the first deck; (b) Topside module model and accelerometer locations; (c) Jacket model and sensor locations; (d) Displacement measurement points on the topside module.
2.4. Test Conditions
According to the design basis, the test conditions were classified into four groups. Group A involved frontal collisions at varying velocities, where the model impact velocity increased in 2.5 mm/s increments from 10 mm/s to 50 mm/s, corresponding to prototype velocities ranging from 0.08 m/s to 0.40 m/s. Group B investigated combinations of lateral offsets and collision velocities, with all offset distances set at 4 mm from the center (equivalent to 0.25 m in the prototype). Group C examined different LMU model stiffness values coupled with varying drop velocities. All tests were conducted in triplicate to reduce random errors. It should be noted that not all test results are presented in the following sections; similar conditions yielded comparable conclusions, and conditions with no significant patterns were analyzed but not reported in order to avoid excessive redundancy. All test conditions conducted in this study are summarized in Table 3, Table 4 and Table 5. All tests used the same topside module and jacket model. The collision velocity and topside offsets were controlled by the six-degree-of-freedom motion platform, and the LMU stiffness was varied by replacing internal springs of different stiffness.
Table 4.
Test groups with different offset situations.
Table 5.
Test groups with different LMU stiffness.
3. Results
The experiments were carried out based on the test conditions listed in Table 3, Table 4 and Table 5. Acceleration, strain, and displacement response data of the electrical platform were obtained under this group of conditions. The experimental data were processed to generate time-history curves, peak value variation plots, and other related graphs to investigate the dynamic response characteristics of the electrical platform during the float-over collision process, as well as the influence of collision velocity, offset position, and LMU stiffness parameters on these responses. Unless otherwise specified in the following analysis, acceleration responses refer to the Z-direction, and displacement responses refer to the X-direction.
3.1. Effect of Collision Velocity
The peak acceleration responses at each measurement point under Condition Group A were obtained. Since each condition was tested three times, the average of the three peak values was used. The variation in peak acceleration response with increasing collision velocity was plotted as a point-line graph, as shown in Figure 5. Figure 5a,b represent the acceleration responses of the topside and the six LMUs, respectively. As shown in the figures, acceleration responses increase with rising collision velocity. In some velocity ranges, a decrease followed by an increase is observed, but overall, the structural acceleration response of the electrical platform shows an increasing trend. At a drop velocity of 50 mm/s, the maximum acceleration response among the topside measurement points is 0.58 g, while the maximum acceleration at the LMUs is 2.65 g. In addition, the acceleration response at the LMUs is greater than that of the topside due to their direct contact with the collision interface. When the collision velocity increases from 10 mm/s to 50 mm/s, the measurement point J8 on the topside shows the largest increase—up to 5.7 times. For the LMUs, point J11 exhibits the highest increase, up to 20.6 times.
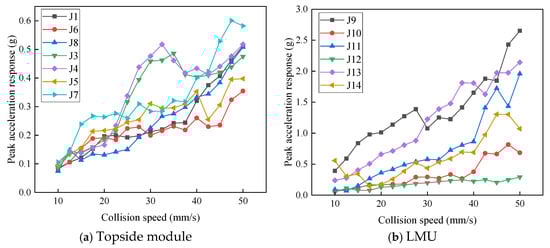
Figure 5.
Effect of collision velocity variation on acceleration response.
The acceleration responses at three measurement points on the first deck of the platform were compared by averaging the results from three repeated tests and calculating the standard deviation as error bars, as shown in Figure 6. The figure shows that at lower collision velocities, the peak acceleration responses of the three points are similar. However, as the collision velocity increases, the peak responses at points J1 and J8 become greater than that at J6. J1 and J8 are located closer to the center of the platform, indicating that acceleration response peaks tend to be higher near the platform center. This phenomenon is related to the structural design and weight distribution of the first deck. Under impact loads such as those from collisions, vibrations tend to be more intense at the central area of the platform, resulting in higher acceleration responses at nearby points. The observed experimental errors are random in nature and are difficult to reduce through test plan optimization. Instead, repeated testing can help lower the impact of such errors. Among the three points, J1 has the smallest average relative error at 6%, while J6 and J8 have higher average relative errors of 9% and 9.8%, respectively.
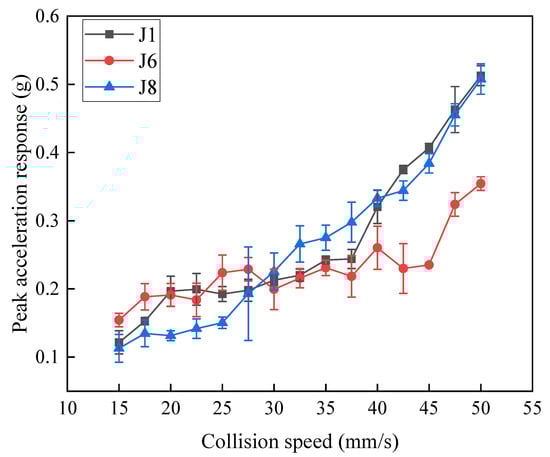
Figure 6.
Comparison of acceleration responses at different positions on the first level of the platform.
As the collision velocity increases, the variation in peak strain response on the first deck of the topside is shown in Figure 7. Due to the randomness inherent in collision tests, each condition was tested three times. Line graphs with error bars were plotted, showing that measurement points with higher peak strain values tend to exhibit greater random error. Among the points, S6 has the highest average peak strain response, reaching a maximum of 49.58 με. A one-way ANOVA was performed to assess the uniformity of the strain peak values [33]. Using point S6 as an example, an F-test was conducted to evaluate the significance of the effect of collision velocity on the peak strain response. The results, shown in Table 6, indicate that there is no statistically significant difference in peak strain values under different collision velocities at a 0.05 significance level. The same uniformity analysis was carried out for the other three measurement points, yielding the same conclusion. Therefore, it is considered that the peak strain response on the first deck of the topside does not change significantly with increasing collision velocity.
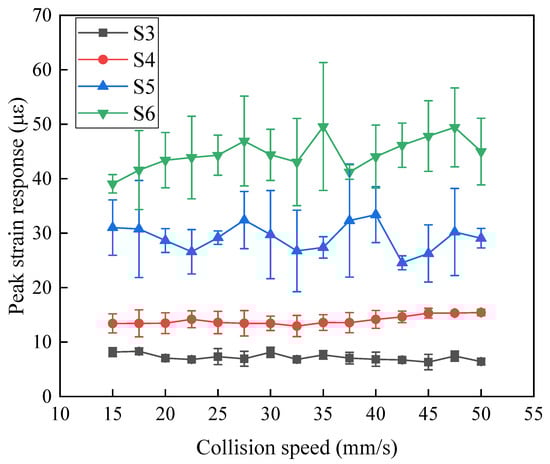
Figure 7.
Effect of collision velocity variation on strain response.
Table 6.
Uniformity check of strain response peaks.
As the collision velocity increases, the variation in the peak displacement response of the topside is shown in Figure 8. It can be observed that the peak displacement response first increases and then decreases with increasing collision velocity, with a turning point at 42.5 mm/s. Additionally, point D3 is located on the topmost level of the topside, while D1 is on the first level. Therefore, the higher the layer within the topside structure, the greater the peak displacement response.
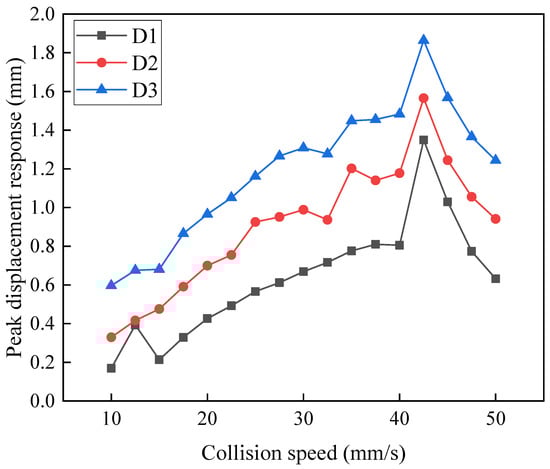
Figure 8.
Effect of collision velocity variation on displacement response.
3.2. Effect of Topside Offset
The experiments were conducted based on the test conditions listed in Table 4 to obtain acceleration, strain, and displacement response data of the electrical platform under this group of conditions. The aim was to investigate the effect of float-over collision in an offset posture on the dynamic structural response characteristics of the topside.
Taking condition B14 as an example, the topside module is offset by 4 mm in the positive x-direction, with an impact velocity of 40 mm/s. The time-history curves of structural acceleration response under this condition are shown in Figure 9. In the figure, J1 and J7 represent acceleration responses in the z-direction, while J10 and J11 exhibit acceleration responses in both the x- and z-directions. Under offset conditions, the acceleration time-history curves of J1 and J7 are similar to those under central (non-offset) collisions, showing a sudden jump at the moment of impact followed by gradually stabilizing oscillations. However, when the module is offset along the x-axis, the response at J1 exhibits periodic fluctuations with a certain frequency. J10 and J11 are located on the LMUs. Due to the x-direction offset of the topside module, their x-direction acceleration responses show regular oscillations, with a longer response duration compared to the z-direction.
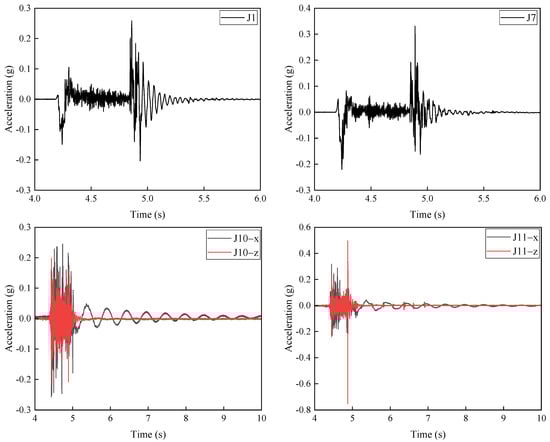
Figure 9.
Time history curve of structural acceleration response for the topside module under x-axis offset.
In the B-group test conditions, the topside module is offset in eight different directions, with each offset direction having a distance of 4 mm from the docking center. The peak acceleration responses at selected measurement points on the topside module were extracted under various impact velocities for all eight offset directions and plotted in a radar chart, as shown in Figure 10. In the legend, “J1-40” denotes the peak acceleration response at point J1 under different offset directions with an impact velocity of 40 mm/s. Overall, offsets along the y-axis and in the negative x-direction have the most significant influence on the acceleration response.
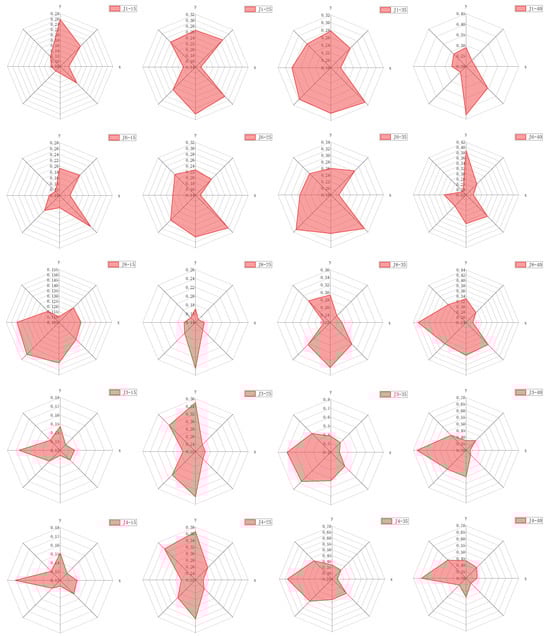
Figure 10.
Radar chart of acceleration response for the topside module under different offset conditions.
Taking impact velocities of 35 mm/s and 40 mm/s as examples, the variation in peak strain responses at point S14 under different offset conditions is analyzed, as shown in Figure 11. When the topside module is offset along the x-axis, the peak strain at S14 increases, with strain gauges No. 2 and No. 4 showing a greater increase compared to No. 1 and No. 3. When the module is offset along the y-axis, strain No. 4 at S14 decreases, while the other strain readings do not exhibit a clear trend. Overall, in terms of the maximum strain at S14, x-axis offsets lead to an increase in response, whereas y-axis offsets result in a decrease.
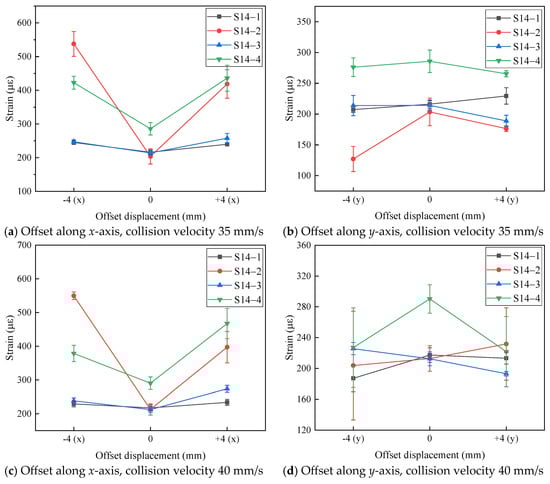
Figure 11.
The influence of different offset conditions on strain response of jacket.
Taking the impact velocity of 40 mm/s as an example, the time-history curves of structural displacement responses under both offset and central collision conditions are compared, as shown in Figure 12. Figure 12a shows the displacement response when the topside module is offset by 4 mm in the positive x-direction, while Figure 12b presents the response under central (non-offset) collision.
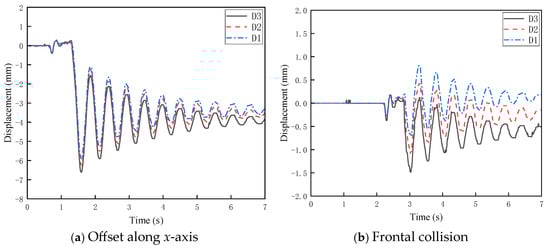
Figure 12.
Time history curves of structure displacement response for the topside module under both offset and orthogonal collision conditions.
It can be observed that the displacement fluctuations under the x-axis offset condition are larger than those in the central collision case. Additionally, in Figure 12a, the curve exhibits a baseline shift of –4 mm at the end, indicating that the topside module returned to an aligned position after the collision. The pronounced vibrations at the three measurement points in the x-direction suggest that the structure may have relatively low stiffness along the x-axis, making it more susceptible to large displacements.
3.3. Effect of LMU Stiffness
The experiments were carried out based on the test conditions listed in Table 5 to investigate the dynamic response characteristics of the electrical platform under float-over collision conditions, as well as the relationship between LMU stiffness and the platform’s dynamic response.
The variations in acceleration responses at measurement points J1, J8, J10, and J11 under different impact velocities are shown in Figure 13. In the legend, “J1-25” refers to the peak acceleration response curve at point J1 under an impact velocity of 25 mm/s. As the LMU stiffness parameter increases, the acceleration responses at J1 and J8, which are located on the first deck of the platform, exhibit a significant upward trend. Mechanism analysis indicates that higher LMU stiffness results in smaller deformation required to store the same amount of energy and a shorter interaction duration. According to the impulse-momentum theorem, the LMU exerts a greater reaction force on the topside module under these conditions. Consequently, the topside module experiences a stronger force over a shorter time span, leading to higher acceleration responses.
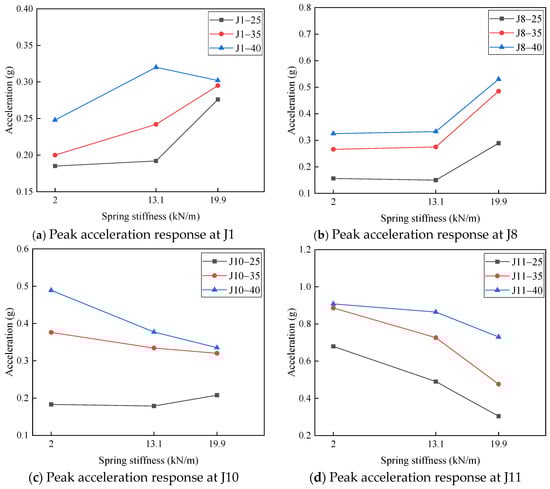
Figure 13.
Relationship between LMU stiffness and structure acceleration response.
Notably, the acceleration responses at J10 and J11, which are located on the LMU, show an opposite trend: their response amplitudes decrease as the LMU stiffness increases. This inverse behavior can be attributed to the enhanced energy storage capacity of the LMU system resulting from increased stiffness in its internal linear spring elements. These phenomena, to a certain extent, reveal the coupling mechanism between the dynamic response of offshore platform structures and the stiffness parameters of the LMU.
The influence of LMU stiffness on the peak strain response at leg strain point S14 under different impact velocities is shown in Figure 14. At impact velocities of 25 mm/s, 35 mm/s, 40 mm/s, and 50 mm/s, the four strain gauges on S14 exhibit similar trends with varying LMU stiffness. When the stiffness reaches its maximum value, the peak responses of strains 14-1, 14-3, and 14-4 decrease significantly, while strain 14-2 shows a slight increase, exhibiting an opposite trend.
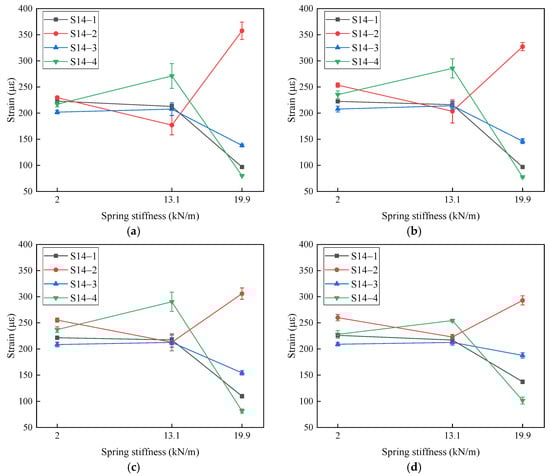
Figure 14.
Relationship between LMU-stiffness and structure strain response. (a) S14—Collision velocity 25 mm/s; (b) S14—Collision velocity 35 mm/s; (c) S14—Collision velocity 40 mm/s; (d) S14—Collision velocity 50 mm/s.
The effect of LMU stiffness on strain responses during contact-collision experiments is relatively complex, as different structural locations exhibit different response patterns. Observing the four strain gauges arranged circumferentially around the S14 tubular member, it can be seen that the differences between strain values increase with higher LMU stiffness. This is because increased LMU stiffness leads to more uneven compression in the leg structure.
The influence of LMU stiffness on the peak displacement response of the topside module under different impact velocities is shown in Figure 15. As illustrated in the figure, when the impact velocity is relatively high, the peak displacement response first increases and then decreases with increasing LMU spring stiffness in the range of 2 kN/m to 19.9 kN/m. This indicates that increasing the spring stiffness within a certain range amplifies the displacement response; however, once a critical stiffness threshold is exceeded, the displacement response begins to decrease.
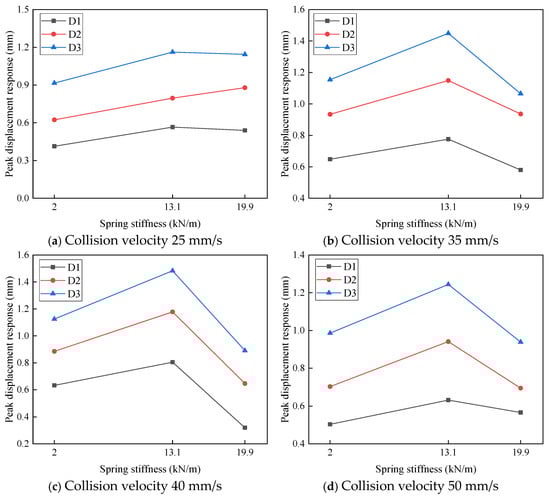
Figure 15.
Relationship between LMU stiffness and structure displacement response.
This phenomenon can be attributed to the dual role of the spring stiffness. At moderate stiffness levels, the springs provide some buffering effect while still allowing the topside module to sway, thus increasing the displacement response. However, when the stiffness is further increased—for example, up to 19.9 kN/m—the spring coils become thicker and more tightly wound, restricting the swaying motion of the module and thereby reducing the displacement response.
4. Discussion
This study reveals the impact of collision velocity, offset position, and LMU stiffness on the dynamic response of the offshore converter station platform during the float-over installation process through experimental analysis. First, collision velocity plays a critical role in the platform’s dynamic response, particularly in terms of acceleration. As collision velocity increases, the platform’s acceleration response significantly increases, indicating the need to control the descent speed during installation to reduce the impact on the structure and electrical equipment.
Next, the offset position also has a significant effect on the platform’s dynamic response. Offsets along the x-axis lead to increased strain on the jacket legs and greater displacement fluctuations on the platform, while y-axis offsets affect the acceleration response on the first deck of the platform. This indicates that during actual installation, offset should be minimized, especially along the x-axis, to ensure the stability of the installation process. The offset during the installation process reflects the impact of waves on the barge’s movement. Due to the influence of waves, the barge is difficult to keep stationary during the actual operation, making it challenging to align accurately for the collision. Therefore, it is recommended to perform the operation during periods of calmer sea conditions. Additionally, during the installation process, the platform’s offset should be continuously monitored, with particular attention given to avoiding excessive x-axis displacement, in order to minimize fluctuations in dynamic response and ensure the stability and safety of the installation process.
Finally, the impact of LMU stiffness on the platform’s response is more complex. Higher LMU stiffness increases the acceleration response at the top of the platform but mitigates the response at the LMU connection. Excessively high LMU stiffness can reduce the platform’s displacement response, suggesting that an appropriate stiffness should be selected during LMU design to achieve optimal buffering effects. The recommended stiffness range is 13.1–19.9 kN/m, which effectively reduces displacement while maintaining sufficient energy absorption capacity during collisions. Furthermore, LMUs should be made from materials with high elasticity, corrosion resistance, and durability to withstand repeated dynamic loading during installation.
5. Conclusions
This study conducted physical model tests to investigate the dynamic characteristics of a 10,000-ton offshore converter station platform and its electrical equipment during float-over docking collisions. Based on the elastic–gravity similarity law, integrated structural models were established with geometric scales of 1:65 for the platform and 1:25 for the converter valve. The tests analyzed dynamic responses under varying impact velocities, tilt and offset conditions of the topside module, and different LMU stiffness values. Acceleration, displacement, and stress responses were obtained under contact collision scenarios. The effects of impact velocity, docking alignment, and LMU stiffness on the structural dynamic behavior were systematically examined.
(i) Within a descent-velocity range of 10–50 mm/s, the platform’s acceleration response increases with velocity: the maximum peak at the topside-module measurement points reaches 0.58 g at 50 mm/s, while the LMU region reaches 2.65 g. At topside-module point J8, the peak increases by a factor of 5.7 from 10 mm/s to 50 mm/s, and at LMU point J11 the increase is by a factor of 20.6. For displacement, the x-direction peak first increases and then decreases, with a turning point around 42.5 mm/s; at the same velocity, higher levels (e.g., D3) exhibit larger displacement peaks.
(ii) Under fixed descent velocity, different offset directions of the topside module during contact with the jacket affect the structural response. When offset along the x-axis, the strain peak on the jacket legs increases, acceleration response on the first deck decreases, and displacement fluctuations in the topside module become more pronounced. In contrast, y-axis offset leads to reduced strain on jacket legs but increased deck acceleration. X-direction offset also increases acceleration response of the converter valve while slightly reducing strain at some positions. For Converter Valve No. 8, acceleration increases under x-axis offset and decreases under y-axis offset, with consistent reductions of approximately 20% across different height levels. During the installation process, minimizing offsets, especially along the x-axis, is crucial for ensuring stability.
(iii) The acceleration response on the first deck increases with higher LMU stiffness, while the acceleration at the LMU connection between the topside module and the jacket generally decreases as stiffness increases. At section S14, when stiffness reaches its maximum (19.9 kN/m), the strain peaks at 14-1/14-3/14-4 decrease significantly, while 14-2 shows a slight increase, indicating non-uniform compression. For displacement, at higher impact velocities (≥35–50 mm/s), the topside module’s peak displacement first increases and then decreases as stiffness rises, suggesting an optimal buffering range. For the converter valve, acceleration increases with stiffness at low velocities but shows a non-monotonic trend at high velocities. A stiffness range of 13.1–19.9 kN/m should be considered for optimal buffering and structural stability, particularly under higher impact velocities.
The stiffness of the LMU should inherently be nonlinear, but in this study, it is approximated as piecewise linear and controlled by multiple springs. Additionally, this study assumes that the topside module falls at a fixed velocity, following the barge, and collides with the jacket structure without considering the effects of waves on both the jacket and the barge. First, the stiffness of the LMU can be modeled more accurately using a nonlinear approach, considering material properties and large deformations under dynamic loading conditions. Secondly, the effects of sea states on the barge and jacket during the installation process, including wave motion and wind forces, should be taken into account to better simulate real-world conditions. Additionally, advanced numerical simulations and full-scale testing can be used to validate these studies and improve the design guidelines for offshore platform installation.
Author Contributions
Conceptualization, Y.W., B.Z., Z.S. (Zongjun Shan), J.C. and Z.S. (Zhenzhou Sun); methodology, Y.W. and Z.S. (Zongjun Shan); validation, X.J. and Z.S. (Zhenzhou Sun); formal analysis, J.C.; investigation: Y.W.; resources, Y.W. and Z.S. (Zhenzhou Sun); data curation, Z.S. (Zongjun Shan), J.C., B.Z. and X.J.; writing—original draft preparation, Y.W., X.J. and B.Z.; writing—review and editing, C.B. and G.D.; supervision, C.B. and G.D.; project administration, G.D. All authors have read and agreed to the published version of the manuscript.
Funding
This research was funded by the Major Scientific and Technological Project of Power China Huadong Engineering Corporation Limited (grant no. KY2023-ZD-06) and the National Key Research and Development Program of China (grant no. 2021YFB2400605).
Data Availability Statement
The original contributions presented in this study are included in the article. Further inquiries can be directed to the corresponding author.
Conflicts of Interest
Authors Yinfeng Wang and Zongjun Shan were employed by the China Power Construction (Wenzhou) Green Energy Development Co., Ltd. Author Zhenzhou Sun was employed by the Power China Huadong Engineering Corporation. The remaining authors declare that the research was conducted in the absence of any commercial or financial relationships that could be construed as a potential conflict of interest.
References
- Su, X.; Wang, X.; Xu, W.; Yuan, L.; Xiong, C.; Chen, J. Offshore Wind Power: Progress of the Edge Tool, Which Can Promote Sustainable Energy Development. Sustainability 2024, 16, 7810. [Google Scholar] [CrossRef]
- Global Wind Energy Council. Global Offshore Wind Report 2020; GWEC: Brussels, Belgium, 2020; Volume 19, pp. 10–12. [Google Scholar]
- Guo, X.; Chen, X.; Chen, X.; Sherman, P.; Wen, J.; McElroy, M. Grid Integration Feasibility and Investment Planning of Offshore Wind Power under Carbon-Neutral Transition in China. Nat. Commun. 2023, 14, 2447. [Google Scholar] [CrossRef] [PubMed]
- Zhao, S.X.; Bi, C.W.; Sun, Z.Z. Engineering Analysis of the Dynamic Characteristics of an Electrical Jacket Platform of an Offshore Wind Farm under Seismic Loads. Appl. Ocean Res. 2021, 112, 102692. [Google Scholar] [CrossRef]
- Qin, L.C.; Bai, X.D.; Luo, H.B.; Li, H.L.; Ding, H.Y. Review on Recent Research and Technical Challenges of Floatover Installation Operation. Ocean Eng. 2022, 253, 111378. [Google Scholar] [CrossRef]
- Edelson, D.; Luo, M.Y.H.; Halkyard, J.; Smiley, D.; McFadyen, M.K. Kikeh Development: Spar Topside Floatover Installation. In Proceedings of the Offshore Technology Conference (OTC), Houston, TX, USA, 5–8 May 2008. Paper OTC-19639-MS. [Google Scholar]
- Edelson, D.; Halkyard, J.; Chen, L.; Chabot, L. Floatover Deck Installation on Spars. In Proceedings of the International Conference on Offshore Mechanics and Arctic Engineering, San Diego, CA, USA, 10–15 June 2007. Paper OMAE2007-29640. [Google Scholar]
- Hong, S.H.; McMorland, J.; Zhang, H.X.; Collu, M.; Halse, K.H. Floating Offshore Wind Farm Installation, Challenges and Opportunities: A Comprehensive Survey. Ocean Eng. 2024, 304, 117793. [Google Scholar] [CrossRef]
- O’Neill, L.A.; Fakas, E. Sensitivity Analysis of the Constraining Parameters of a Floatover Deck System. In Proceedings of the ISOPE International Ocean and Polar Engineering Conference, Perth, Australia, 23–28 May 2004. [Google Scholar]
- O’Neill, L.A.; Pinna, R.; Fakas, E.; Pinna, R.; Walsh, T. Floatover Deck Installation: Case Study—Structural Efficiency of Longitudinally and Transversely-Recessed Structures. In Proceedings of the International Conference on Offshore Mechanics and Arctic Engineering, Vancouver, BC, Canada, 20–25 June 2004. [Google Scholar]
- O’Neill, L.A.; Shaun, O.; Fakas, E. Parametric Investigation of the Stability of Vessels for Float-Over Deck Transportation. In Proceedings of the International Conference on Offshore Mechanics and Arctic Engineering, Oslo, Norway, 23–28 June 2002. [Google Scholar]
- O’Neill, L.A.; Fakas, E.; Cassidy, M. A Methodology to Simulate Floating Offshore Operations Using a Design Wave Theory. J. Offshore Mech. Arct. Eng. 2006, 128, 304–313. [Google Scholar] [CrossRef]
- O’Neill, L.A.; Fakas, E.; Cassidy, M. A Novel Application of Constrained NewWave Theory for Floatover Deck Installations. In Proceedings of the International Conference on Offshore Mechanics and Arctic Engineering, Vancouver, BC, Canada, 20–25 June 2004. [Google Scholar]
- Duquesnay, J.; Baldwin, J.; Rains, J.W. Docking and Undocking Considerations for Floatover Analyses and Operations. In Proceedings of the International Conference on Ocean, Nantes, France, 9–14 June 2013. [Google Scholar]
- Chu, N.; Cochrane, M.; Mobbs, K.; Mitchell, D. Results Comparison of Computer Simulation, Model Test and Offshore Installation for Wandoo Integrated Deck Float Over Installation. In Proceedings of the Offshore Technology Conference, Houston, TX, USA, 4–7 May 1998. Paper OTC-8614-MS. [Google Scholar]
- Koo, B.; Magee, N.; Lambrakos, N.; Beyko, E.; Sablok, A. Prediction of Motions and Loads for Floatover Installation of Spar Topsides. In Proceedings of the International Conference on Offshore Mechanics and Arctic Engineering, Shanghai, China, 6–11 June 2010. Paper OMAE2010-20591. [Google Scholar]
- Koo, B.; Magee, A.; Lambrakos, K.; Beyko, E.; Sablok, A. Model Tests for Floatover Installation of Spar Topsides. In Proceedings of the International Conference on Offshore Mechanics and Arctic Engineering, Shanghai, China, 6–11 June 2010. Paper OMAE2010-20590. [Google Scholar]
- Jung, J.J.; Lee, W.S.; Shin, H.S.; Kim, Y.H. Evaluating the Impact Load on the Offshore Platform during Float-Over Topside Installation. In Proceedings of the ISOPE International Ocean and Polar Engineering Conference, Osaka, Japan, 21–26 July 2009. [Google Scholar]
- Jung, S.J.; Kwak, H.U.; Oh, S.H.; Kwon, Y.J.; Nam, B.W.; Kim, N.W. Mating Analysis for Float-Over Installation of a Large Topside in Various Load Transfer Stages. In Proceedings of the ISOPE International Ocean and Polar Engineering Conference, Sapporo, Japan, 10–15 June 2018; pp. 944–948. [Google Scholar]
- Berhault, C.; Gubrin, P.; Foulhoux, L. Optimization of an Integrated Deck Installation Process Using a Fully Coupled Hydro-Structures Time-Domain Analysis. In Proceedings of the Offshore Technology Conference, Houston, TX, USA, 4–7 May 1998. Paper OTC-8617-MS. [Google Scholar]
- Tahar, A.; Halkyard, J.; Steen, A.; Finn, L. Float Over Installation Method: Numerical and Model Test Data. In Proceedings of the International Conference on Offshore Mechanics and Arctic Engineering, Vancouver, BC, Canada, 20–25 June 2004. [Google Scholar]
- Ji, C.; Halkyard, J. Spar Deck Float-Over Feasibility Study for West Africa Environment Condition. In Proceedings of the International Conference on Offshore Mechanics and Arctic Engineering, Hamburg, Germany, 4–9 June 2006; pp. 151–159. [Google Scholar]
- Tan, B.S.; Sahasrabudhe, S.; Haney, J.A.; Leow, B.L. Arthit Field Development: Float-over Hardware Design and Issues. In Proceedings of the Offshore Technology Conference, Houston, TX, USA, 5–8 May 2008. Paper OTC-19300-MS. [Google Scholar]
- Liu, F.; Li, H. A Two-Step Mode Shape Expansion Method for Offshore Jacket Structures with Physical Meaningful Modelling Errors. Ocean. Eng. 2013, 63, 26–34. [Google Scholar] [CrossRef]
- Liu, F.; Li, H.; Li, W.; Wang, B. Experiment Study of Improved Modal Strain Energy Method for Damage Localization in Jacket-Type Offshore Wind Turbines. Renew. Energy 2014, 72, 174–181. [Google Scholar] [CrossRef]
- Byle, S. Potential Failure Mechanisms in Floatover Deck Mating Systems. In Proceedings of the Offshore Technology Conference, Houston, TX, USA, 30 April–3 May 2007. Paper OTC-19047-MS. [Google Scholar]
- Hamilton, J.; French, R.; Penman, A.D. Topsides and Jacket Modeling for Floatover Installation Design. In Proceedings of the Offshore Technology Conference, Houston, TX, USA, 5–8 May 2008. Paper OTC-19227-MS. [Google Scholar]
- Xia, J.; Hayne, S.; Macfarlane, G.; Field, D.; Drobyshevski, Y. Investigation into Float-Over Installations of Minimal Platforms by Hydrodynamic Model Testing. In Proceedings of the International Conference on Offshore Mechanics and Arctic Engineering, Halkidiki, Greece, 12–17 June 2005. [Google Scholar]
- Kim, N.W.; Nam, B.W.; Kwon, Y.J.; Park, I.B.; Cho, S.K.; Sung, H.G. An Experimental Study on the Float-over Installation of a Semi-Submersible. In Proceedings of the International Conference on Offshore Mechanics and Arctic Engineering, Halkidiki, Greece, 12–17 June 2019. [Google Scholar]
- Gao, L.; Zhu, T.; Lin, B. Similarity Techniques in Structural Dynamic Model Testing. J. Dalian Univ. Technol. 2000, 40, 1–8. [Google Scholar]
- Zhu, T. Similarity Issues in Structural Dynamic Models and Structural Dynamic Testing Techniques. Ph.D. Thesis, Dalian University of Technology, Dalian, China, 2004. [Google Scholar]
- Sun, Z.Z.; Bi, C.W.; Zhao, S.X.; Dong, G.H.; Yu, H.F. Experimental Analysis on Dynamic Responses of an Electrical Platform for an Offshore Wind Farm under Earthquake Load. J. Mar. Sci. Eng. 2019, 7, 279. [Google Scholar] [CrossRef]
- Kim, T.K. Understanding One-Way ANOVA Using Conceptual Figures. Korean J. Anesthesiol. 2017, 70, 22–26. [Google Scholar] [CrossRef] [PubMed]


Disclaimer/Publisher’s Note: The statements, opinions and data contained in all publications are solely those of the individual author(s) and contributor(s) and not of MDPI and/or the editor(s). MDPI and/or the editor(s) disclaim responsibility for any injury to people or property resulting from any ideas, methods, instructions or products referred to in the content. |
© 2025 by the authors. Licensee MDPI, Basel, Switzerland. This article is an open access article distributed under the terms and conditions of the Creative Commons Attribution (CC BY) license (https://creativecommons.org/licenses/by/4.0/).