1. Introduction
Fires aboard passenger ships are among the most alarming occurrences that could happen, with the potential for causing severe injuries/fatalities not just for the passengers but also for the crew members working onboard. Surprisingly, ship fire accidents have not decreased in recent years, in contrast to other types of accidents [
1,
2,
3]. Fires aboard passenger and cruise ships can be particularly devastating because of the high number of people on board. Based on a recent statistical analysis [
4], approximately 800 serious casualty accidents were reported on passenger and cruise ships between the years 2000 and 2021. According to the same analysis, fire and explosion accidents ranked third among the seven accident categories identified for cruise ships, while ranked sixth for all passenger ships. According to [
1], faulty electrical wiring, overheating engines/motors, fuel leaks in the presence of a hot surface, galley incidents, and equipment malfunctions are among the most common causes of fires aboard ships. Following the introduction of Regulation 17 in Chapter II-2 of the SOLAS Convention 1974, with amendments, researchers are dedicating their efforts to investigating the efficacy of various fire modelling tools in predicting the outcomes of pertinent fire scenarios.
Mathematical models used for fire and smoke propagation simulation come in two types: field models and zone models. These models can be employed to replicate the behaviour of fires within enclosed spaces. Their distinction lies in how they partition the fire enclosure and the equations employed to depict heat and smoke propagation. The zone model is less complex compared to the field model. It partitions the fire enclosure into a small number of large zones, such as the plume and the hot smoky gas layer beneath the ceiling. It relies on well-established empirical relationships to model the transfer of heat and smoke between these zones. A zone model can operate with greater speed and demands fewer computational resources than a field model, but it might not accurately represent certain crucial aspects of fire behaviour, such as localised variations in velocity, temperature, and species concentrations. In contrast, the field model subdivides the compartment into numerous cells (control volumes) and computes the heat and fluid movement between these cells using the fundamental laws of physics. While a field model offers a higher level of precision and comprehensive insights into fire behaviour, it demands a greater computational capacity and may necessitate a longer runtime compared to a zone model. Additionally, a field model requires a more extensive set of input data and parameters, including turbulence models, radiation models, boundary conditions, and mesh distributions. Each of these types of models comes with its own strengths and weaknesses, making them suitable for various applications depending on the sophistication of the fire scenario and the required level of precision. Examples of some notable fire field models include FDS, Kameleon FireEx (KFX), SMARTFIRE, and PHOENICS. On the other hand, examples of zone models include CFAST, OZONE, and B-Risk [
5,
6,
7,
8,
9,
10,
11].
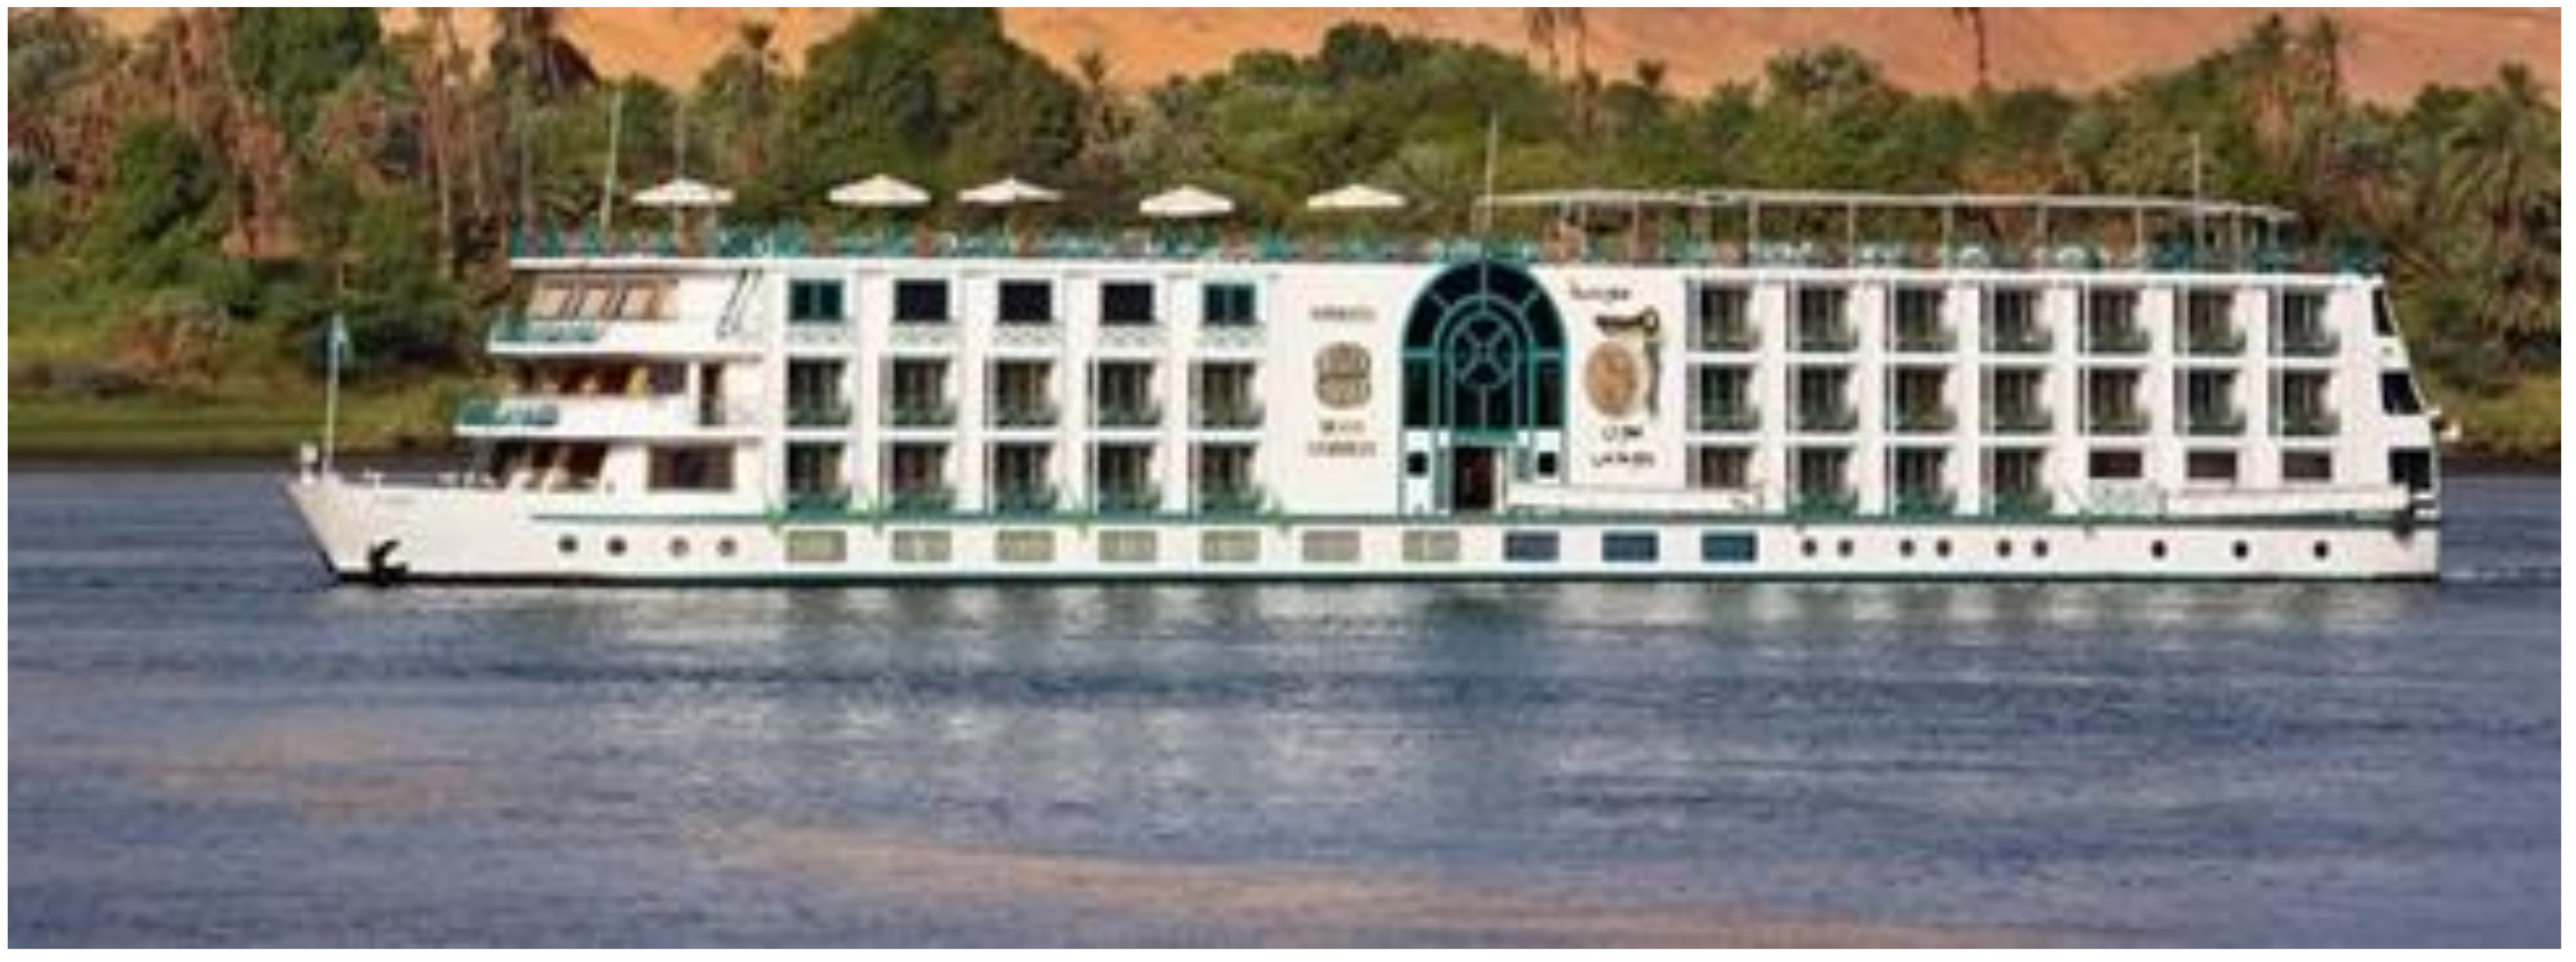
The present work aims to provide a direct application of two different fire modelling for the specific case of Nile cruise ships. Nile cruise ships are highly favoured by tourists visiting Egypt, offering the easiest and most convenient means to explore a wide array of classic historical sites and to visit the Nile Valley Temples and Tombs in the southern regions of Egypt. These cruise ships essentially function as floating hotels, providing their services in the serene surroundings of the Nile River. They offer both short cruises from Luxor to Aswan and extended journeys from Aswan to Cairo (see
Figure 1). Recognised by the Egyptian government as one of the foremost contributors to foreign currency, any disruption to this industry would have a substantial economic impact [
12].
Recently, approximately 297 cruise ships are actively sailing on the Nile River [
14]. Numerous reports [
15,
16,
17,
18,
19] indicate that, unfortunately, this vital fleet is susceptible to various types of ship accidents. These accidents not only threaten Egypt’s income generation but also compromise the safety of its people, a matter of utmost importance. Several literature sources [
16,
20] have documented that 80 to 85% of ship accidents are attributable to human error, encompassing factors such as negligence, fatigue, stress, disregard for safety and quality, and misinterpretation of instructions.
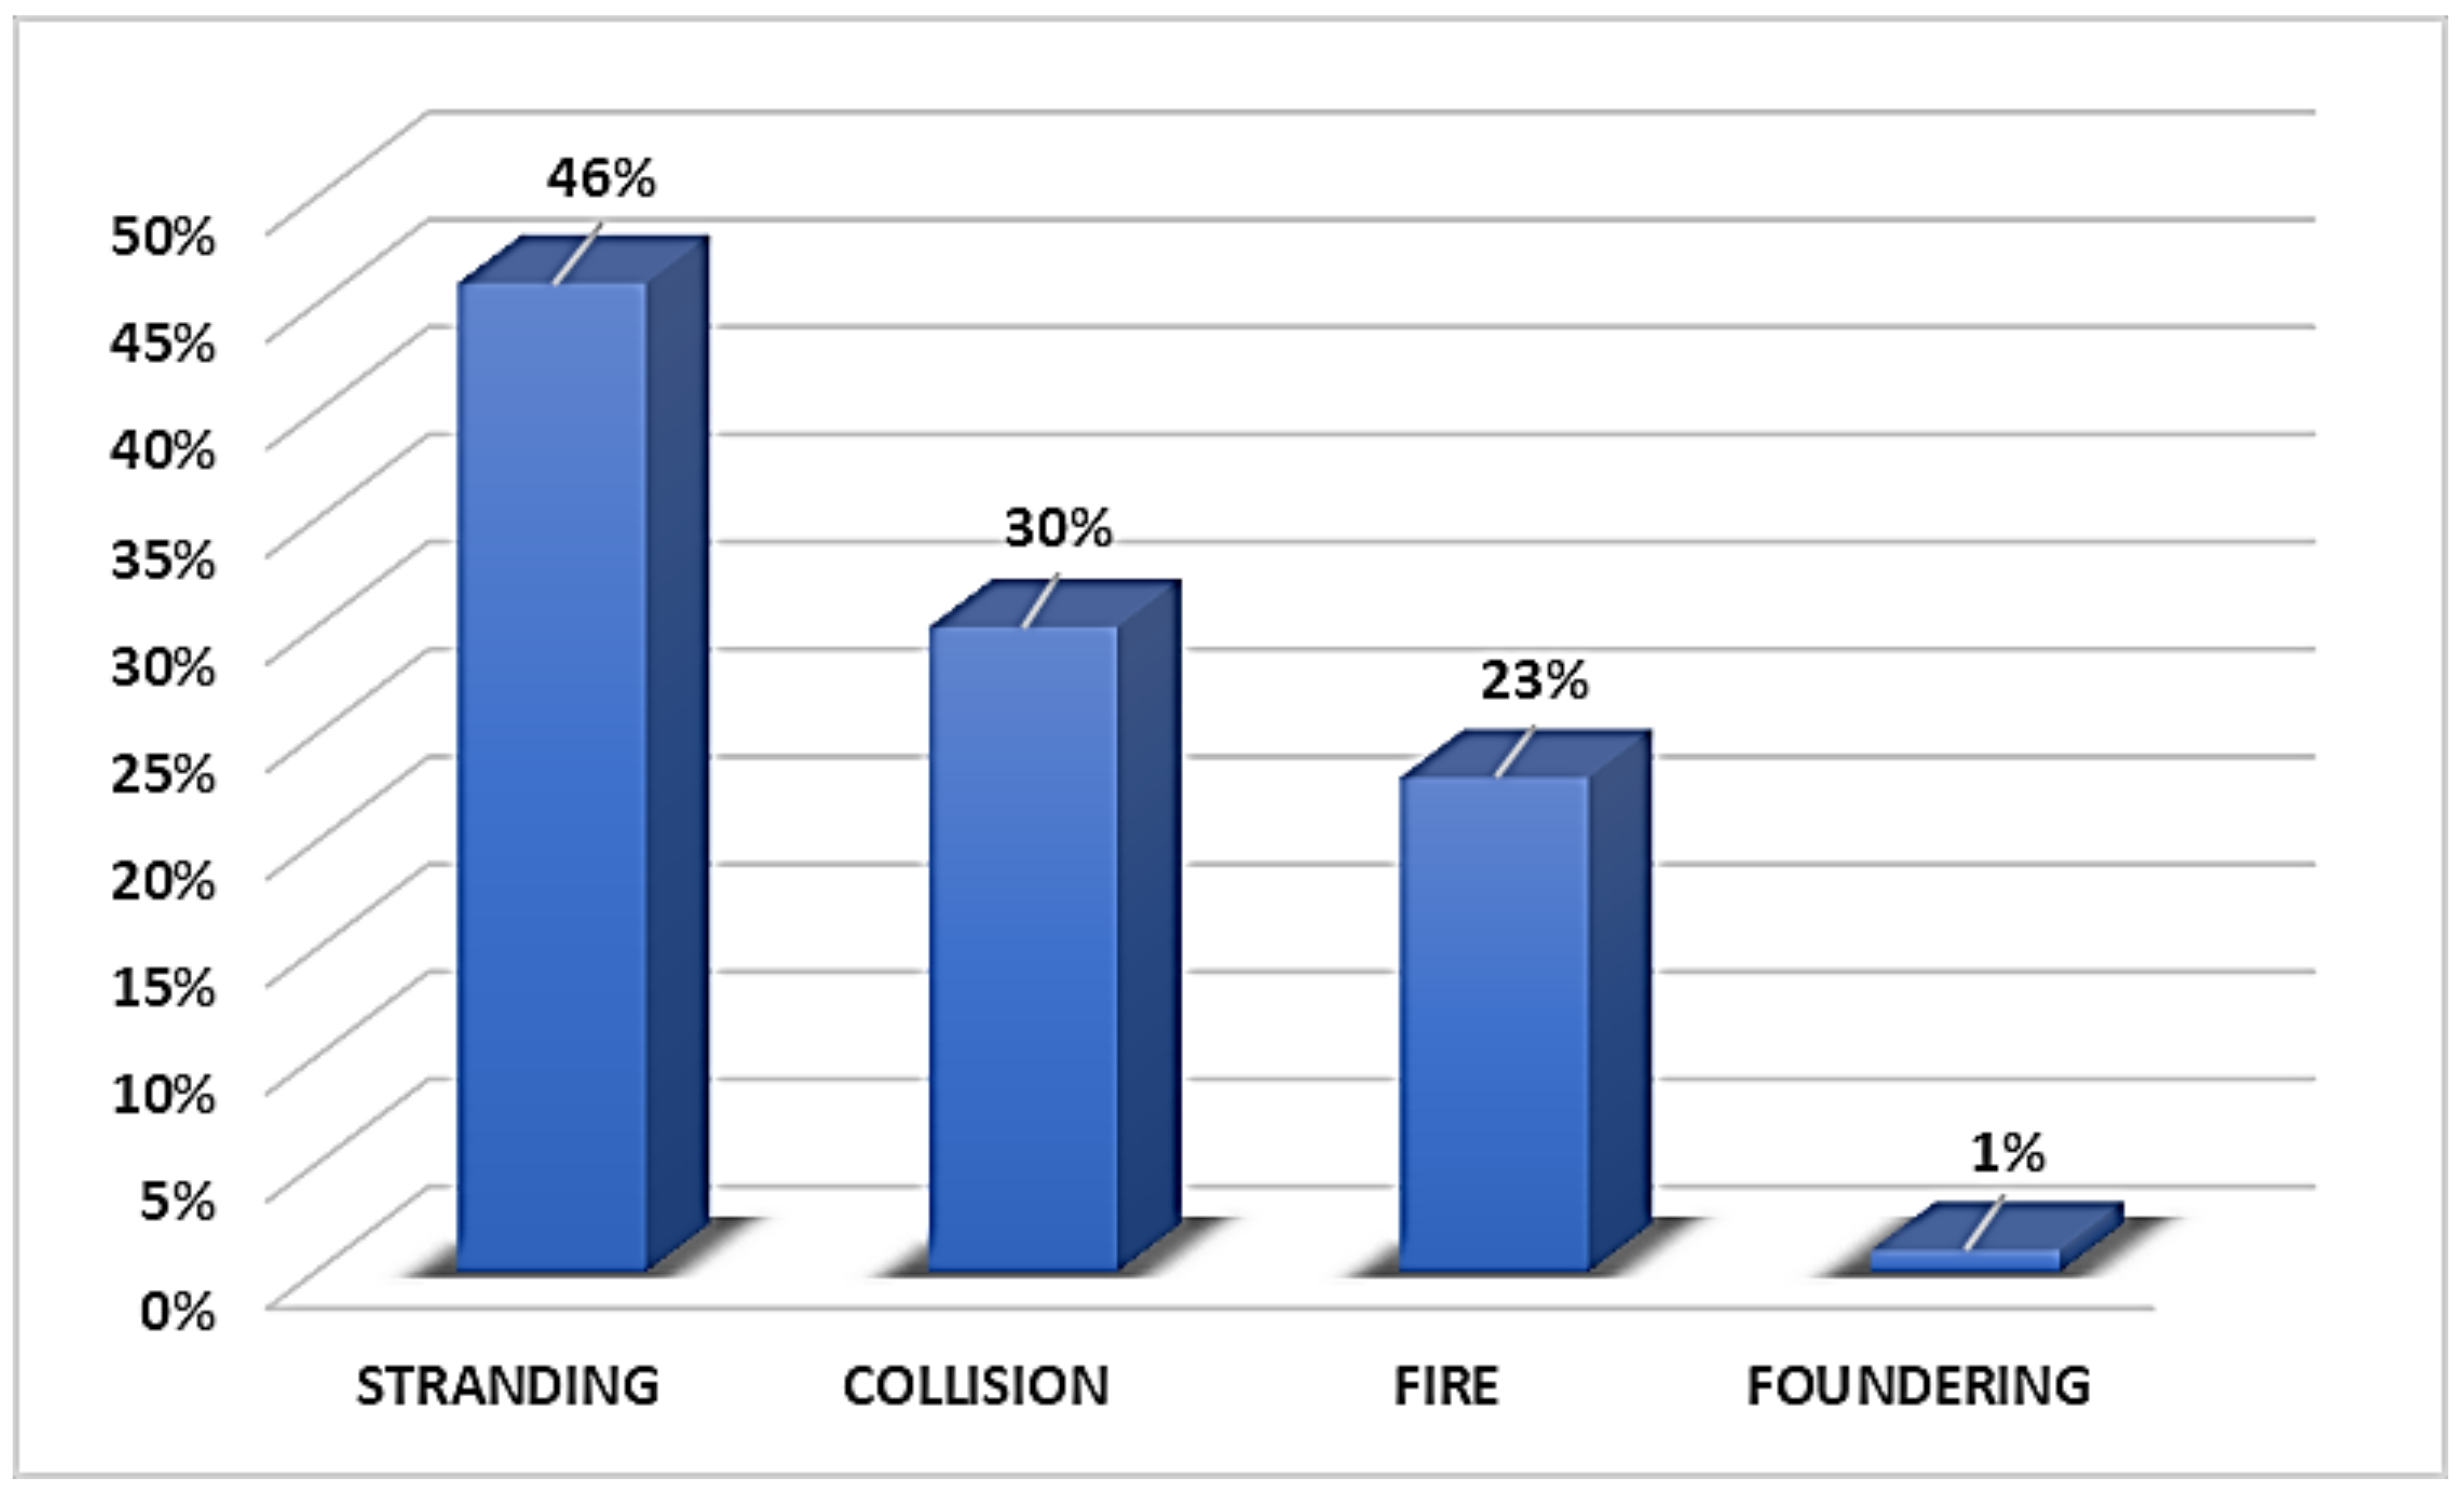
Salem et al. [
12] conducted a statistical analysis of reported previous Nile cruise ship accident data between 2002 and 2014 and identified four primary categories into which all Nile cruise ship accidents fall: stranding, collision, fire, and foundering (refer to
Figure 2).
While ranked third in occurrence, a fire incident involving a multitude of crew members and passengers aboard a Nile cruise ship represents a potential catastrophe. Fire has the capacity to swiftly propagate from its point of origin to adjoining compartments within a brief time span. Amin [
15] highlights that the composition of furnishings and decorative materials on Nile cruise ships, coupled with wind speed during navigation, can expedite the spread of fire, impeding or delaying the evacuation process for both crew and passengers. Furthermore, Amin [
15] underscores that careless smoking, smoking in bed, the combination of smoking and alcohol consumption, smoking in storage and workspaces, use of non-maritime electrical cables, utilisation of non-retardant fire materials, overheating of frying pan fats, and arson constitute primary factors contributing to fire accidents aboard Nile cruise ships.
Over the years, fires occurring on Nile cruise ships have resulted in fatalities and injuries among crew members and passengers. It is important to note that sizeable fires occurring in various ship locations might involve arduous efforts for containment, yet fatalities and injuries could be minimal. Conversely, due to the rapid diffusion of toxic smoke, smaller fires brought under control swiftly can lead to numerous casualties. Such fatal instances are often concentrated in spaces linked by short, narrow passageways and corridors, notably accommodation areas. Here, the potential for toxic smoke to saturate the entire space within a brief timeframe is significant [
21].
Consequently, to enhance safety levels in accommodation spaces, the fire safety design for these spaces necessitates improvement. This can be achieved through a comprehensive analysis of fire consequences within these areas, proposing alternative designs or arrangements that integrate diverse risk reduction measures [
22,
23]. Additionally, the implementation of a robust fire safety management system is vital [
24]. Fire accidents cannot be entirely prevented on ships, but numerous measures can be implemented to mitigate their impact, thereby offering safer alternative ship designs. These safer designs can then be assessed for fire safety using fire consequence analysis tools, in comparison to established accepted designs.
Several comprehensive fire modelling tools have been validated and employed in various studies pertaining to fire safety design for Ro-Pax vessels and passenger ships within a comparative research framework, following the incorporation of Regulation II-2/17 of the SOLAS Convention 1974, as amended [
25,
26,
27,
28]. The findings from these investigations have indicated that the available fire modelling tools can effectively assess the degree of fire safety in both existing and newly proposed alternative designs. These modelling tools are widely utilised in fire research and prove particularly valuable in identifying fire hazard zones and calculating appropriate fire protection equipment during the design phase [
26,
29].
A range of fire modelling techniques exist, including zone modelling and field modelling. Zone models, despite their rapidity, are somewhat constrained by their generalised nature and the associated level of uncertainty in results [
30]. Field models, on the other hand, represent the most sophisticated method for studying fire behaviour, encompassing the dynamics of smoke movement influenced by fire, wind, and ventilation [
31]. However, the main limitations of field models are cost and time constraints [
30].
Despite the availability of different modelling techniques for the study of fire development in internal ship areas, a fair and detailed comparison between results achievable with model zones methods and field models is in fact missing for passenger ships. Therefore, the main purpose of this paper is to cover this gap, providing a comparison between CFAST and FDS fire simulations. In the present study, the FDS simulations are considered the benchmark case, as the code has been already validated in previous studies for fire simulations onboard ships, specifically on RoPax vessels [
25,
28].
The present work initially describes in
Section 2 the different modelling methodologies employed in the study, namely the zone model and the field model. Afterwards,
Section 3 gives a specific example of a fire scenario onboard a Nile Cruise ship, highlighting the modelling of the internal layout of the deck according to the two codes employed for the simulations. The section also reports the results of the simulations, comparing parameters linked to fire, smoke, and life safety.
Section 4 proposes a detailed analysis of the results, showing a detailed comparison between the fire developing across the modelled zones.
The agreement between CFAST and FDS results gradually weakens when continuous spaces are modelled as contiguous compartments like in connected corridors. In such a case, the further corridor from the fire origin shows the most divergent outcome. The differences in any case are tolerable for the application of the methods in an early stage of design, when multiple configurations can be compared and evaluated through an extensive safety risk analysis.
2. Fire Engineering Tools
Zone and field models represent two distinct methodologies within the realm of fire modelling. Zone models offer swifter and more cost-effective results, yet their principal drawback lies in the inherent uncertainty and generality of their outcomes [
30]. On the other hand, field models stand as the most advanced tools employed for the analysis of fire behaviour and its effluents. These models simulate the three-dimensional movement of smoke, accounting for factors such as fire, wind, ventilation, and other pertinent conditions that influence smoke propagation [
31].
Among the 56 zone models documented in [
25], a widely employed choice for numerous practical applications is a specific zone model. This model stands out due to its capability to manage multi-connected compartments, its accessibility to all, and its consistent updates up to the present time. This zone model, known as CFAST, excels in representing fire and smoke propagation across up to 30 multi-connected compartments and belongs to the “two-zone” family of zone models. In January 2023, the most recent version of CFAST, designated as “CFAST 7.7.4”, was introduced, and the authors chose to employ this version for the ongoing analysis.
In this analysis, the authors opted for the extensively utilised field model “FDS”. This choice is rooted in FDS’s use of a technique known as Large Eddy Simulation (LES) to simulate turbulence within the fluid dynamics model. LES is acknowledged for its computational efficiency in determining fluid flow and temperature during fire scenarios. Furthermore, FDS possesses the capability to compute the average smoke layer height, alongside the average upper- and lower-layer temperatures, through the methodology expounded in [
32]. This distinctive feature empowers the execution of the ongoing analysis and facilitates comprehensive comparisons between the outcomes derived from FDS and the predictions made by CFAST. The foundation for these comparisons lies in the notion that the LES field model (FDS) yields plausible predictions due to its finer discretisation of the fire domain and the precise representation of its underlying physics.
Both CFAST and FDS were developed by the Building and Fire Research Laboratory at the National Institute of Standards and Technology (NIST). CFAST is a fire simulation programme designed to simulate a fire scenario and predict the effects of fire and smoke propagation within an enclosure. It operates based on the two-zone fire model concept, essentially dividing the fire domain into two distinct regions (zones): the upper-layer zone containing the hot and smoky gases and the lower-layer zone comprising the cooler and cleaner air. CFAST can predict variables such as temperature, smoke concentration, and gas composition within each of these zones. It also models heat transfer and ventilation interactions between the two zones within the enclosure of fire origin and any interconnected enclosures. Additionally, CFAST can simulate how a fire affects various aspects, including enclosure components, occupants, and fire protection systems [
6].
In the following, a brief overview is presented of some of the key models and sub-models in CFAST:
Fire Model: The fire model in CFAST simulates the growth and spread of fires. It considers parameters like heat release rate, fire size, and fire growth rate.
Compartment Model: This model defines the geometry and characteristics of the compartments within a building, including their size, shape, and ventilation conditions.
Zone Model: CFAST uses a two-zone fire model. It divides the compartments into an upper layer with hot, smoky gases and a lower layer with cooler, cleaner air. This model calculates temperature, smoke concentration, and gas composition in each zone.
Ventilation Model: The ventilation model simulates the movement of air within and between compartments. It considers factors like door and window openings, ventilation systems, and natural flow.
Heat Transfer Model: This model calculates heat transfer between compartments and between the upper and lower layers of the fire zones. It considers conduction, convection, and radiation.
Smoke and Gas Transport Model: CFAST models the transport of smoke and gases within the compartments, including their movement, distribution, and concentration.
Material Properties Model: This model defines the properties of building materials, such as their thermal conductivity, heat capacity, and fire ignition properties.
Fire Protection Systems: CFAST can model the effects of fire protection systems, such as sprinklers and fire alarms, on fire development and smoke movement.
Detector and Suppression System Model: This sub-model simulates the response of fire detectors and the activation of fire suppression systems in the presence of fire.
Pressure and Flow Model: This considers the pressure and flow of gases in the system, which can affect smoke and gas movement.
Radiation Model: This sub-model calculates radiant heat transfer, accounting for the impact of thermal radiation on surfaces and objects.
FDS is an open-source Computational Fluid Dynamics (CFD) model used to simulate fluid flows driven by fire. This software employs numerical methods to solve a modified version of the Navier–Stokes equations tailored for slow, thermally induced flows. It includes sub-models that offer approximate representations of combustion reactions and the formation of soot. Turbulence is described using the Large Eddy Simulation (LES). In this approach, the significant swirling motions responsible for most of the mixing are accurately computed from the fluid dynamics equations, while smaller-scale eddies are addressed through a sub-grid scale model [
5].
The combustion model applied in this work is based on the idea of a mixture fraction, which is a conserved scalar quantity representing the proportion of gas that originates as fuel in a specific area within the domain. Calculations for thermal radiation were carried out using a finite volume method on the same grid as the flow solver. The solution for the radiation transport equation concerning grey gas was achieved by dividing the radiation spectrum into a relatively small number of bands. The derivatives of the conservation equations were estimated using finite differences, and the solution was continuously updated on a three-dimensional, rectilinear grid that conformed with the geometric characteristics of the scenario.
3. Application on a Reference Nile Cruise Ship
In order to demonstrate the ability of zone models to predict the fire consequences of a given scenario onboard a Nile cruise ship, detailed comparisons between CFAST and FDS were conducted. The fire scenario being considered is one that could potentially occur in a standard cabin on one of the accommodation decks of a typical Nile cruise ship.
Only variables directly relevant to life and property safety were predicted and compared in these analyses. These variables include smoke layer height, upper- and lower-layer temperatures, concentrations of CO, CO2, and O2, as well as the fractional effective dose (FED).
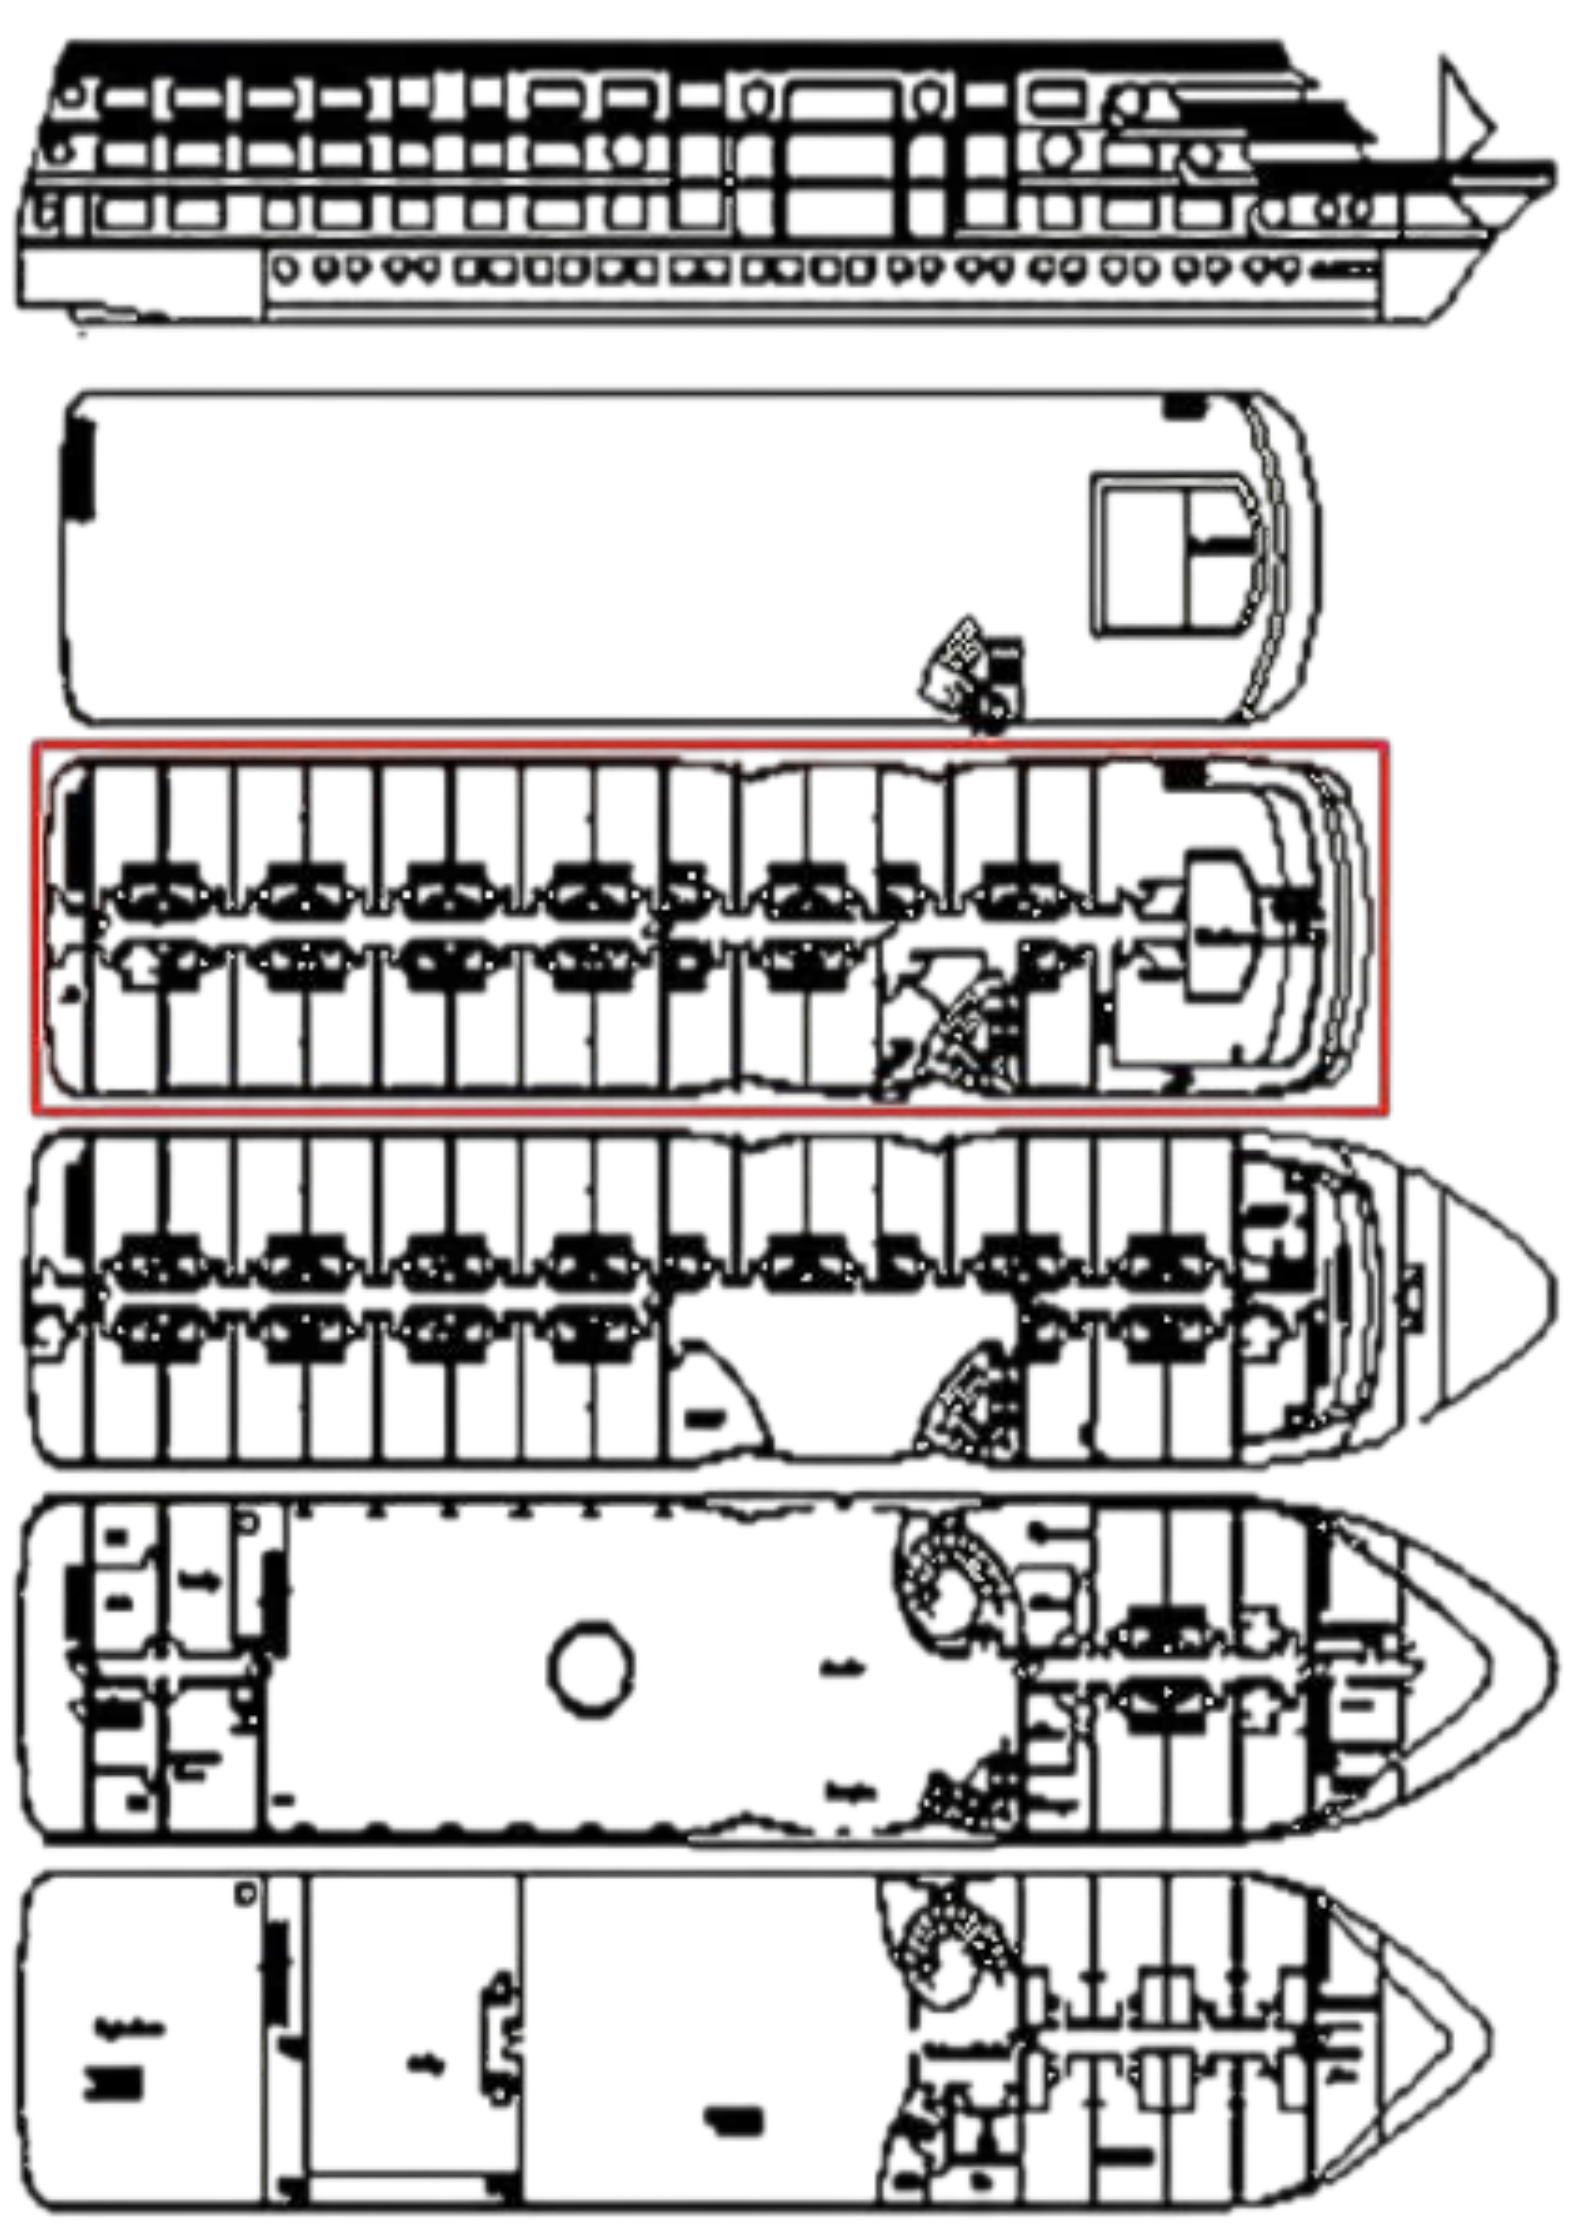
The vessel under consideration comprises 5 decks, including the Sun Deck, and accommodates 158 passengers on board.
Table 1 outlines the crucial characteristics of the representative Nile cruise ship, while
Figure 3 illustrates its general layout. Additionally,
Figure 4 provides an image of the interior of one of its standard cabins.
3.1. Aspects of the Accommodation Deck
The accommodation space considered in this analysis measures 56.4 m in length, 14.2 m in beam, and 2.4 m in height. It consists of 26 standard cabins and two luxury suites connected by a central corridor with a clear width of 0.9 m, as depicted in
Figure 5.
Each standard cabin encompasses a floor area of 23 m
2, while each luxury suite comprises a floor area of 32 m
2. All boundaries consist of three layers: PVC paint, galvanised steel, and Rockwool insulation.
Table 2 outlines the thermal properties of the utilised materials. The doors connecting the cabins and suites to the corridor all measure 0.9 m in width and 2 m in height.
3.2. Description of the Considered Design Fire Scenario
A fire was assumed to erupt on the accommodation deck of the Nile cruise ship, where even minor fires can present a substantial threat to all individuals on board. These fires can be triggered by passenger negligence, power outages, or acts of vandalism. The fire was assumed to initiate in a bed mattress within a standard cabin, specifically Cabin 1, as indicated in
Figure 5. The mattress occupies a surface area of 2 m
2 and is elevated 0.6 m above the floor. The door connecting Cabin 1 to the corridor was presumed to remain open, while the cabin’s window was considered closed. Consequently, the smoke will rapidly propagate into the adjoining corridor, leading to the most adverse conditions within Cabin 1 and the corridor. Along with the ventilation scenario assumed earlier, the proximity of Cabin 1 to one of the main exits on the accommodation deck would render this fire scenario the worst-case scenario that could occur in such an accommodation setting.
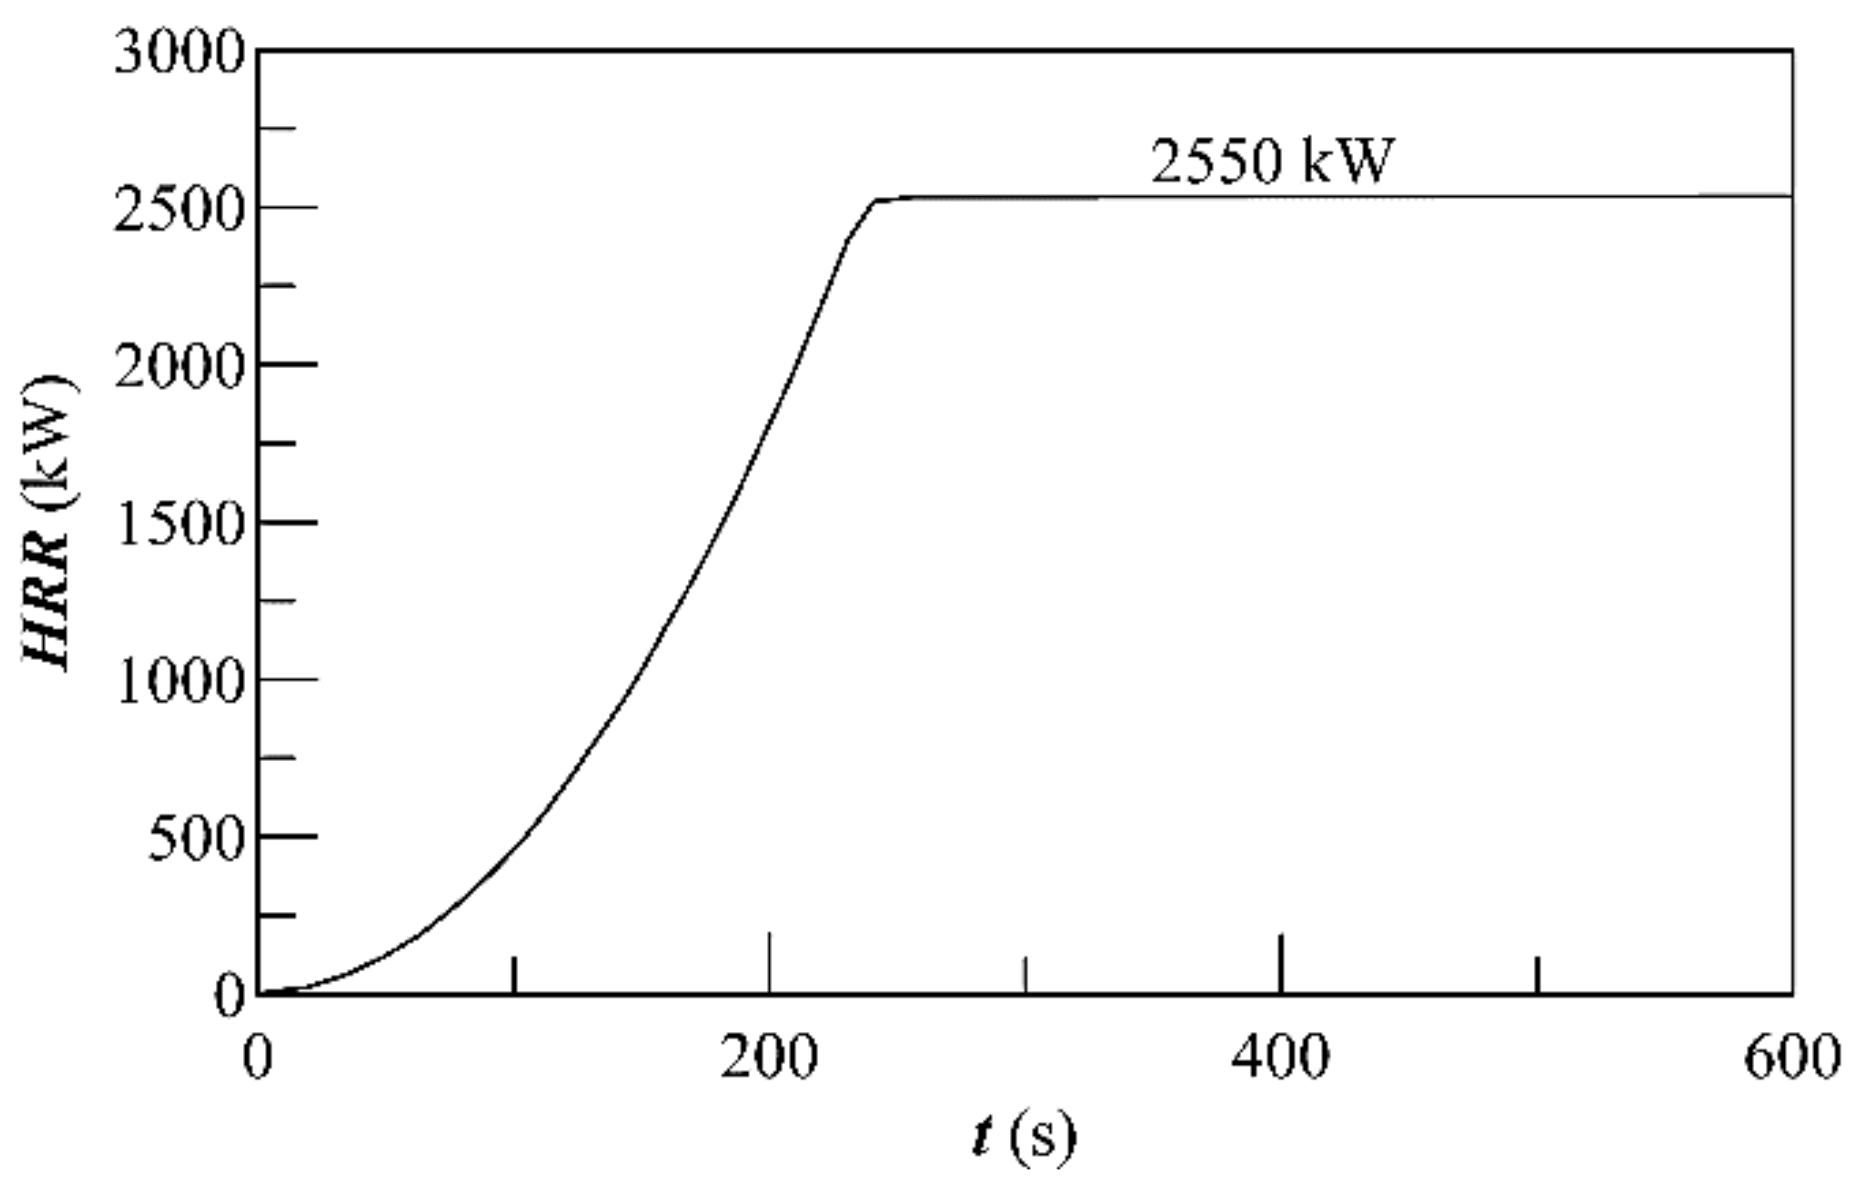
As per Themelis and Spyrou [
27], the essential primary inputs to define any design fire scenario include the heat release rate (HRR) and the fire effluent yields, such as soot and CO. In accordance with references [
33,
34], the HRR stands out as the most critical input parameter for any fire consequence analysis. In this study, a standard “t-square” fire growth curve, depicting the HRR of a “fast growth fire”, was employed. The peak HRR value was set at 2550 kW [
35,
36]. The selected HRR curve for the present scenario is illustrated in
Figure 6. Furthermore, in line with [
37,
38], soot and CO yields were assumed to be 0.19 g/g and 0.09 g/g, respectively, corresponding to polyurethane foam. Considering that the mechanical ventilation system automatically shuts down during a fire and that ventilation openings become obstructed by smoke, it was assumed that the system had no impact on the fire’s progression.
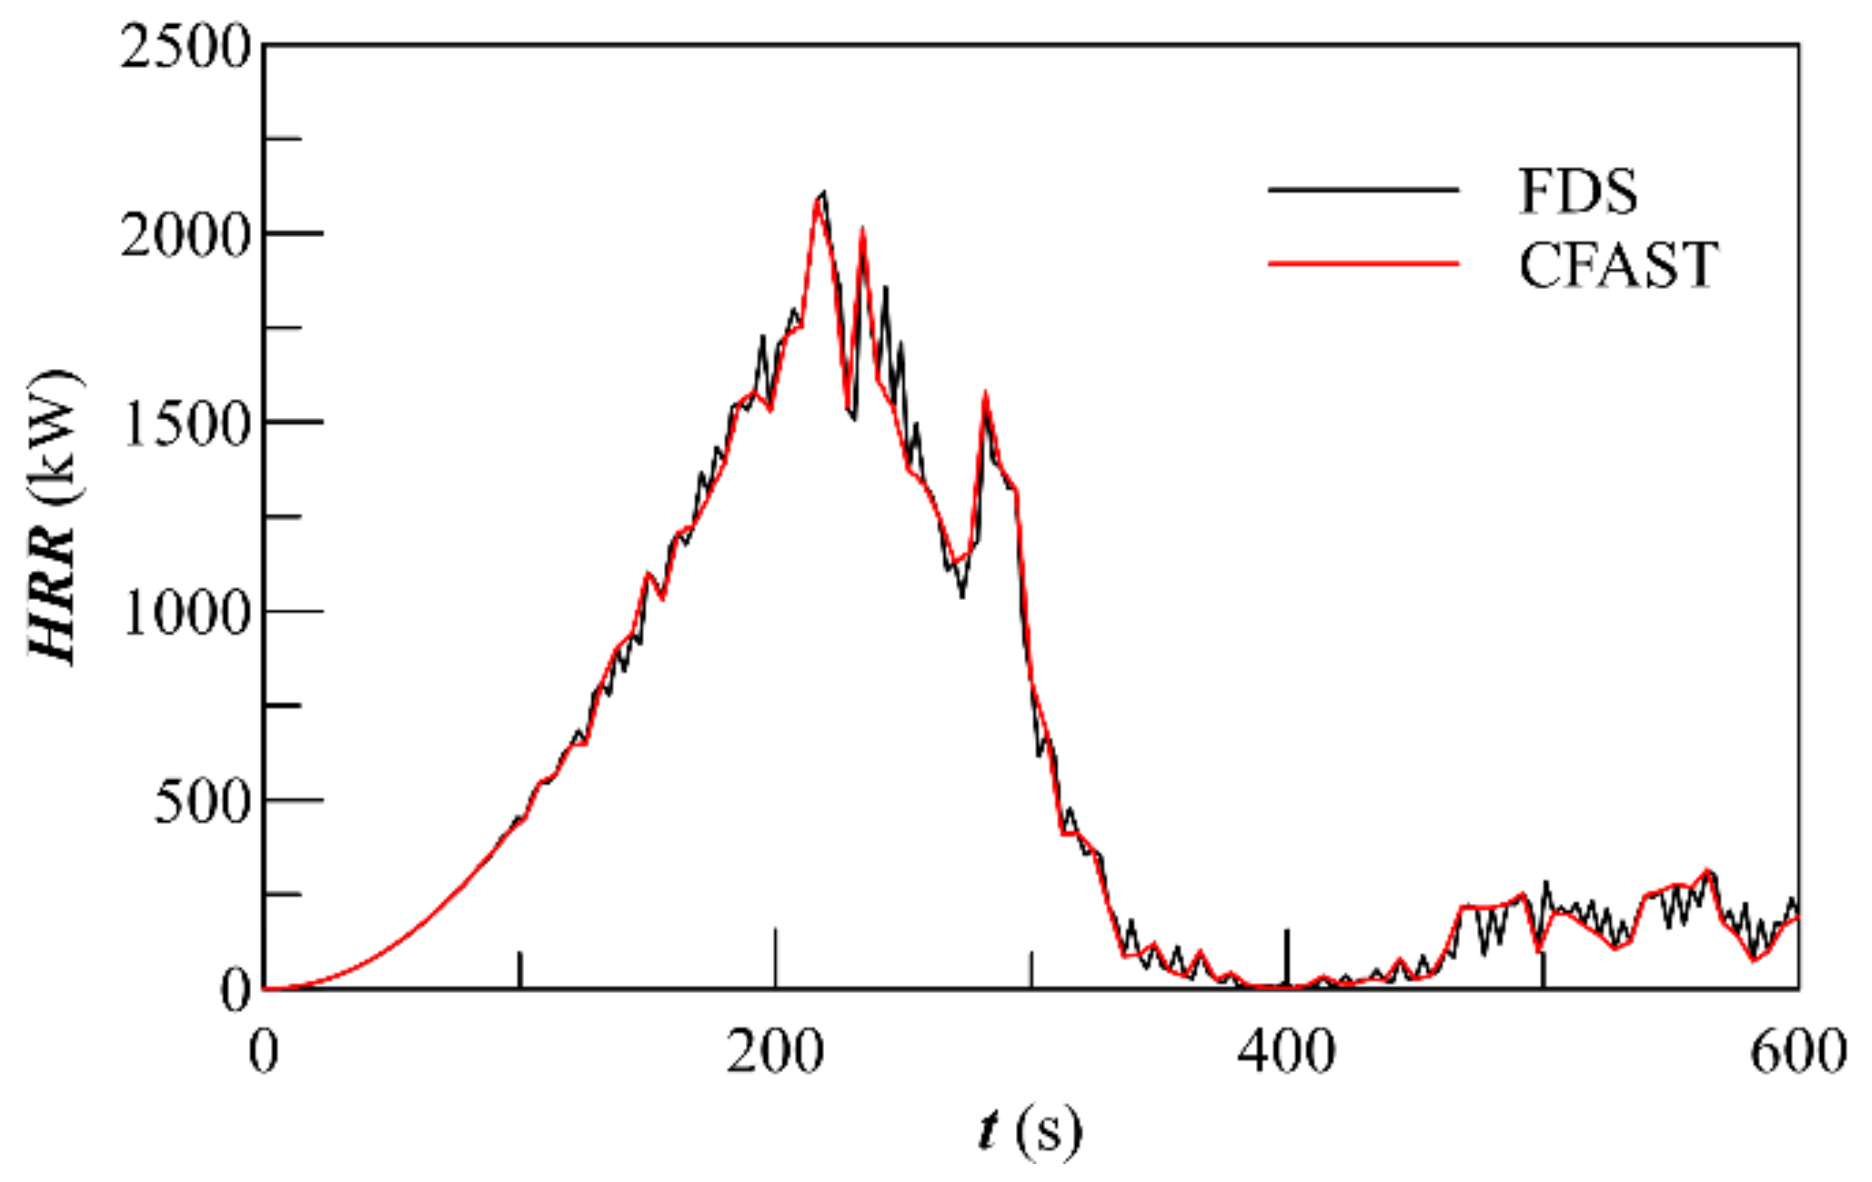
3.3. HRR in CFAST
To ensure the replication of an indistinguishable fire scenario within CFAST for subsequent comparison with FDS predictions, it is essential to eliminate any discrepancies in the input parameters of the two modelling techniques. As highlighted by [
39,
40], zone models like CFAST utilise simplified data sources for simulating the heat release rate (HRR) of a given fire scenario, while field models like FDS rely on approximations of fundamental laws and material-effective properties. In order to comprehensively and accurately analyse the distinct outcomes of each modelling technique, it becomes crucial to incorporate these variations in the input parameters as inherent components of the realistic fire modelling process. Consequently, it was determined that the FDS-calculated HRR would be employed as an input for CFAST. This decision ensures an equitable comparison between the two distinct modelling approaches, as illustrated in
Figure 7.
3.4. Comparison between CFAST and FDS Predictions
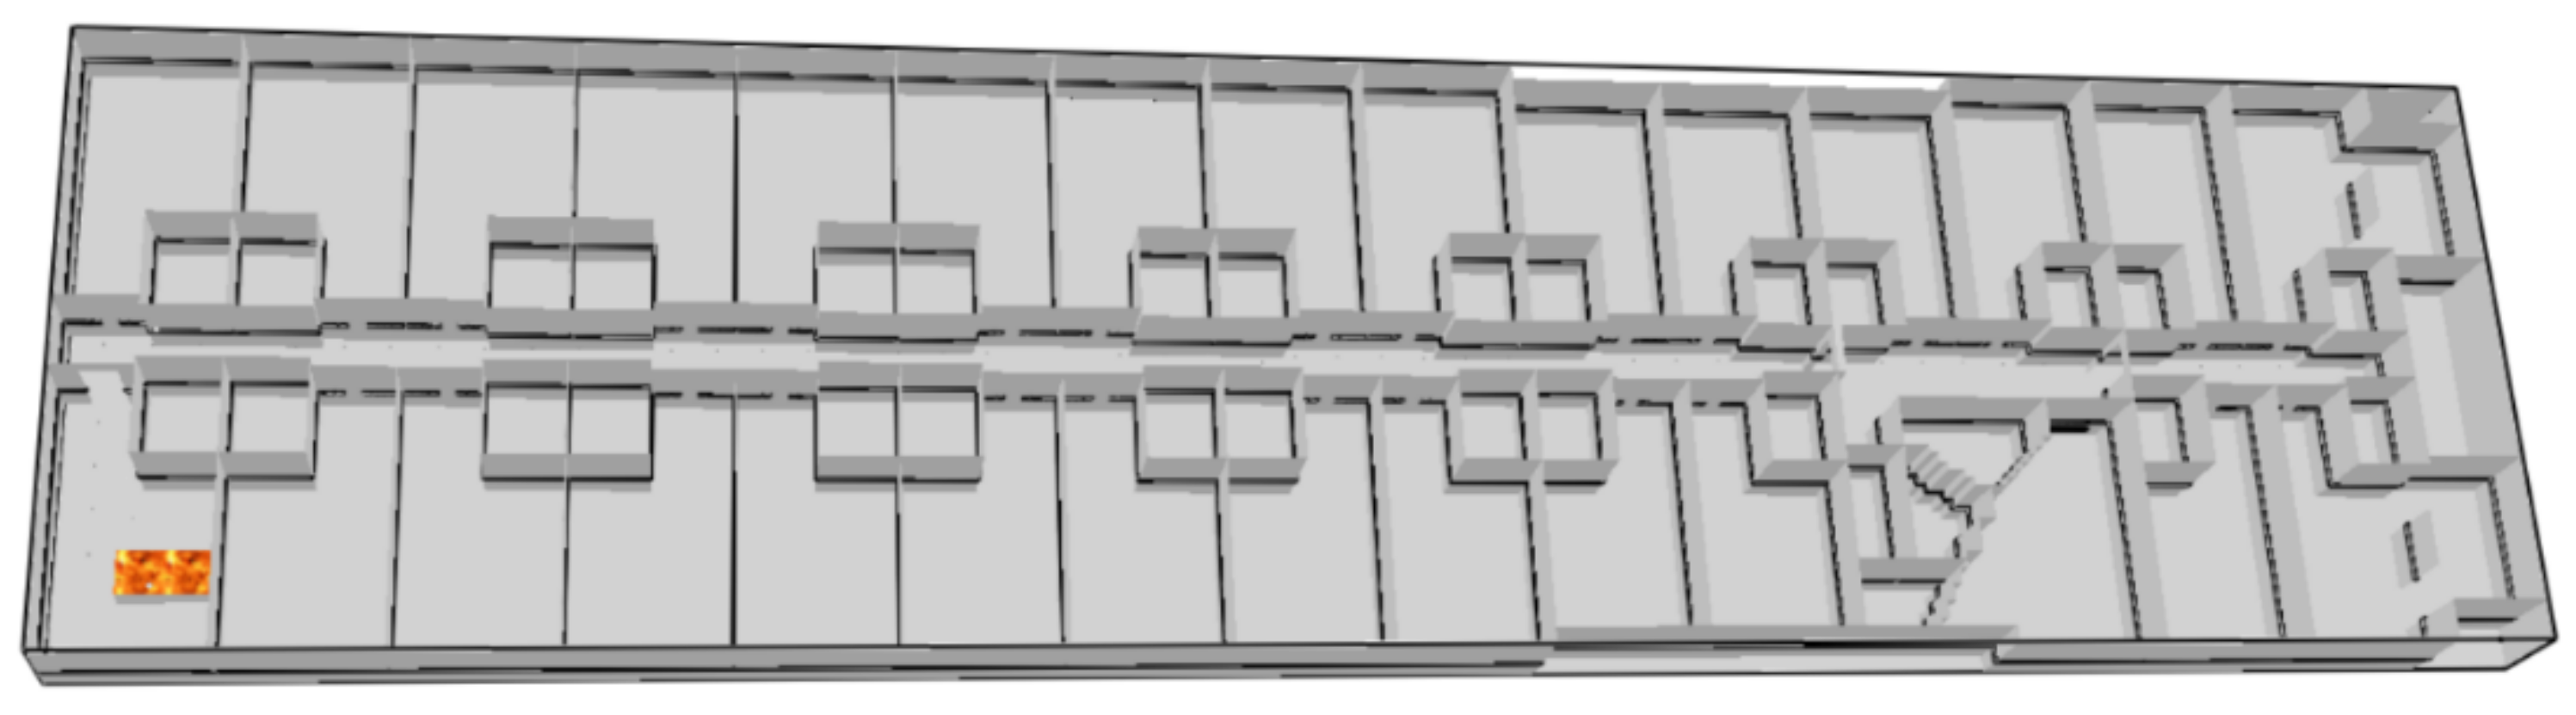
A thorough comparison between CFAST and FDS predictions was conducted, focusing on a representative layout of an accommodation deck found aboard a Nile cruise ship. This comparison specifically encompassed the prediction and comparison of parameters essential for evaluating the fire safety status of such areas. It is important to clarify that the arrangement of the accommodation deck was intentionally simplified for the purpose of facilitating a more realistic and manageable comparison between CFAST and FDS.
Below, a concise depiction of the simplified “Cabin–Three Corridors” arrangement and the outcomes of the comparative analysis are provided. The “Cabin–Three Corridor” arrangement consists of a cabin linked to three coaxially connected corridors, forming a section of an accommodation deck on an existing Nile cruise ship. The cabin’s simplified dimensions are 6.6 m in length, 3.6 m in width, and 2.4 m in height. It is arranged to connect with Corridor No. 1 through an open door measuring 0.8 m wide and 2.0 m high. Corridor 1 spans 39.6 m in length, 1.0 m in width, and 2.4 m in height. Corridor 2 is 7.2 m long, 1.6 m wide, and 2.4 m high. Corridor 3, on the other hand, is 7.2 m long, 1.0 m wide, and 2.4 m high.
The three corridors are aligned along the same axis and are interconnected by two open doors, each measuring 0.8 m in width and 2.0 m in height (as depicted in
Figure 8). In FDS, distinct meshes are assigned to each compartment. Mesh 1 subdivides the cabin into 55,296 cells, mesh 2 divides Corridor 1 into 95,040 cells, mesh 3 segments Corridor 2 into 27,648 cells, and mesh 4 partitions Corridor 3 into 18,720 cells. Each individual cell occupies a volume of 0.1 × 0.1 × 0.1 m
3.
The input files outlining the presumed fire scenario within the analysed arrangement were created as inputs into both “FD” and “CFAST”. Subsequently, these models were executed on a Core i7 PC equipped with a 2.6 GHz processor and 8 GB of RAM. It is worth noting that to accomplish a simulation duration of 600 s, the execution took approximately 9 h in FDS and merely 3 s in CFAST.
The outcomes extracted from the simulations using FDS and CFAST were put side by side and visually represented for comparison. These results are presented in
Figure 9,
Figure 10,
Figure 11 and
Figure 12.
4. Discussion of the Results
After performing the whole set of simulations, the comparison of the results obtained with CFAST and FDS solvers reveals the main observations reported in the following sub-sections for each one of the spaces considered in the simulations. Afterwards, general concluding remarks on the modelling strategies are given.
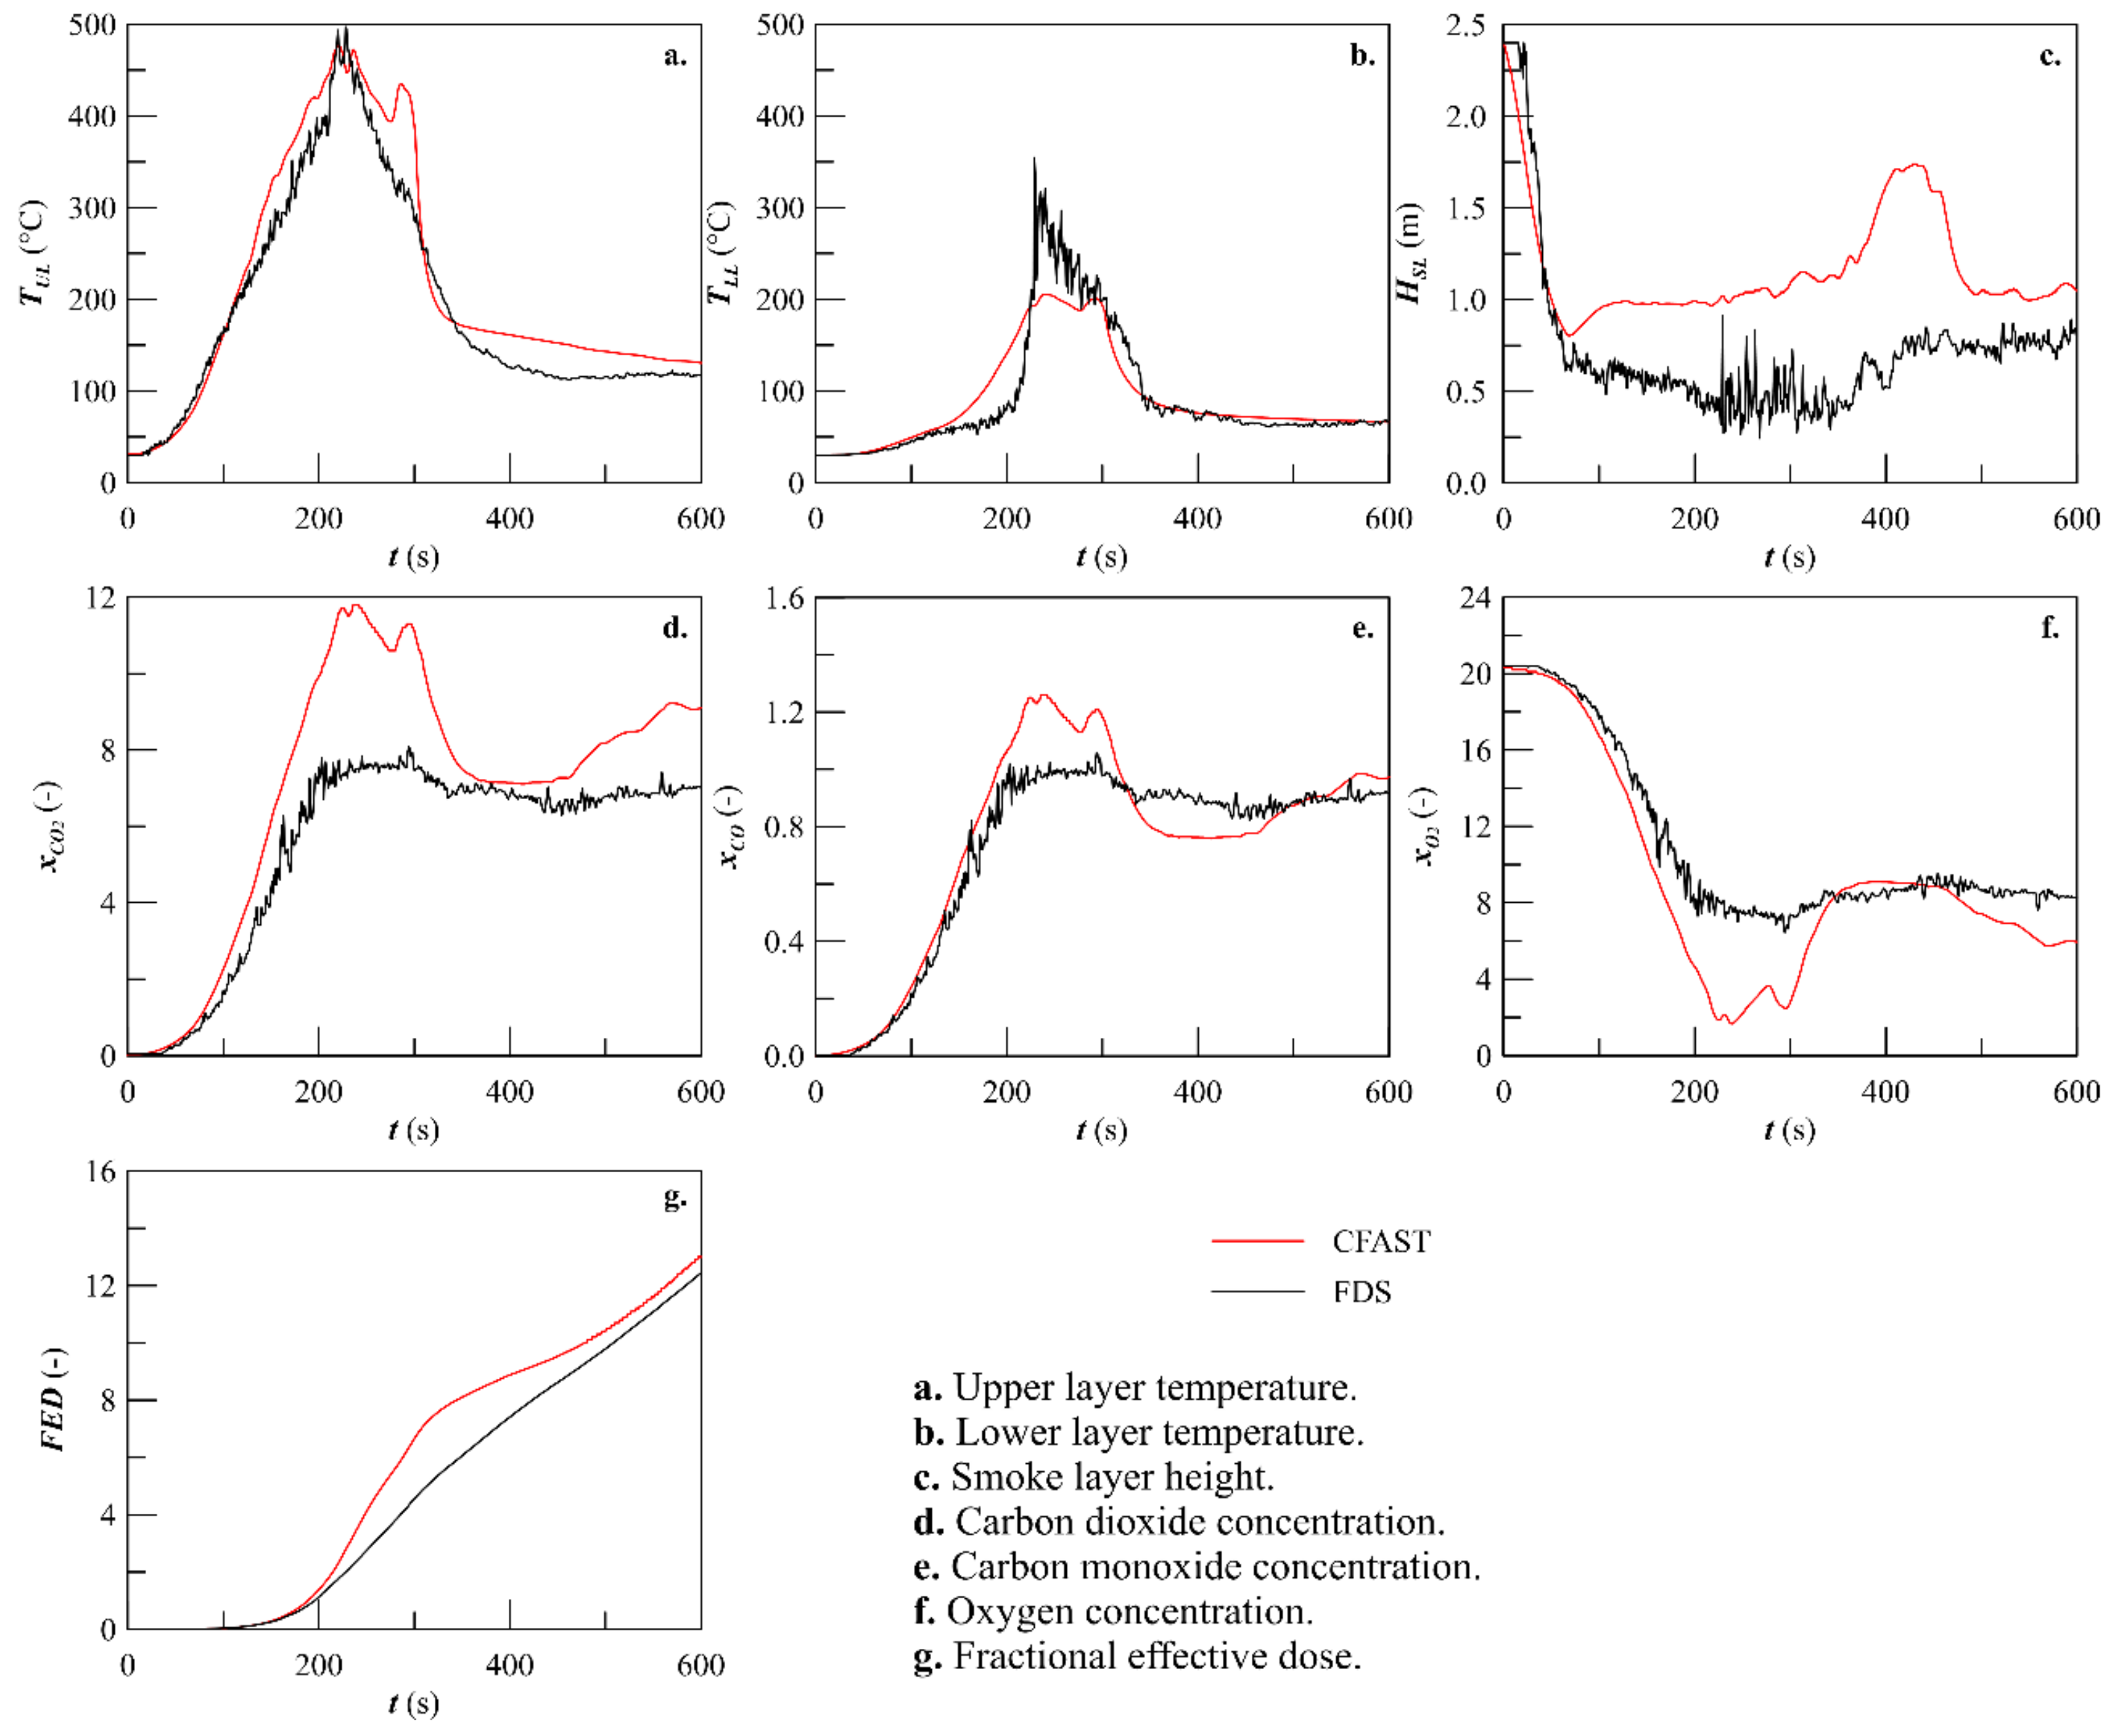
4.1. Cabin Room
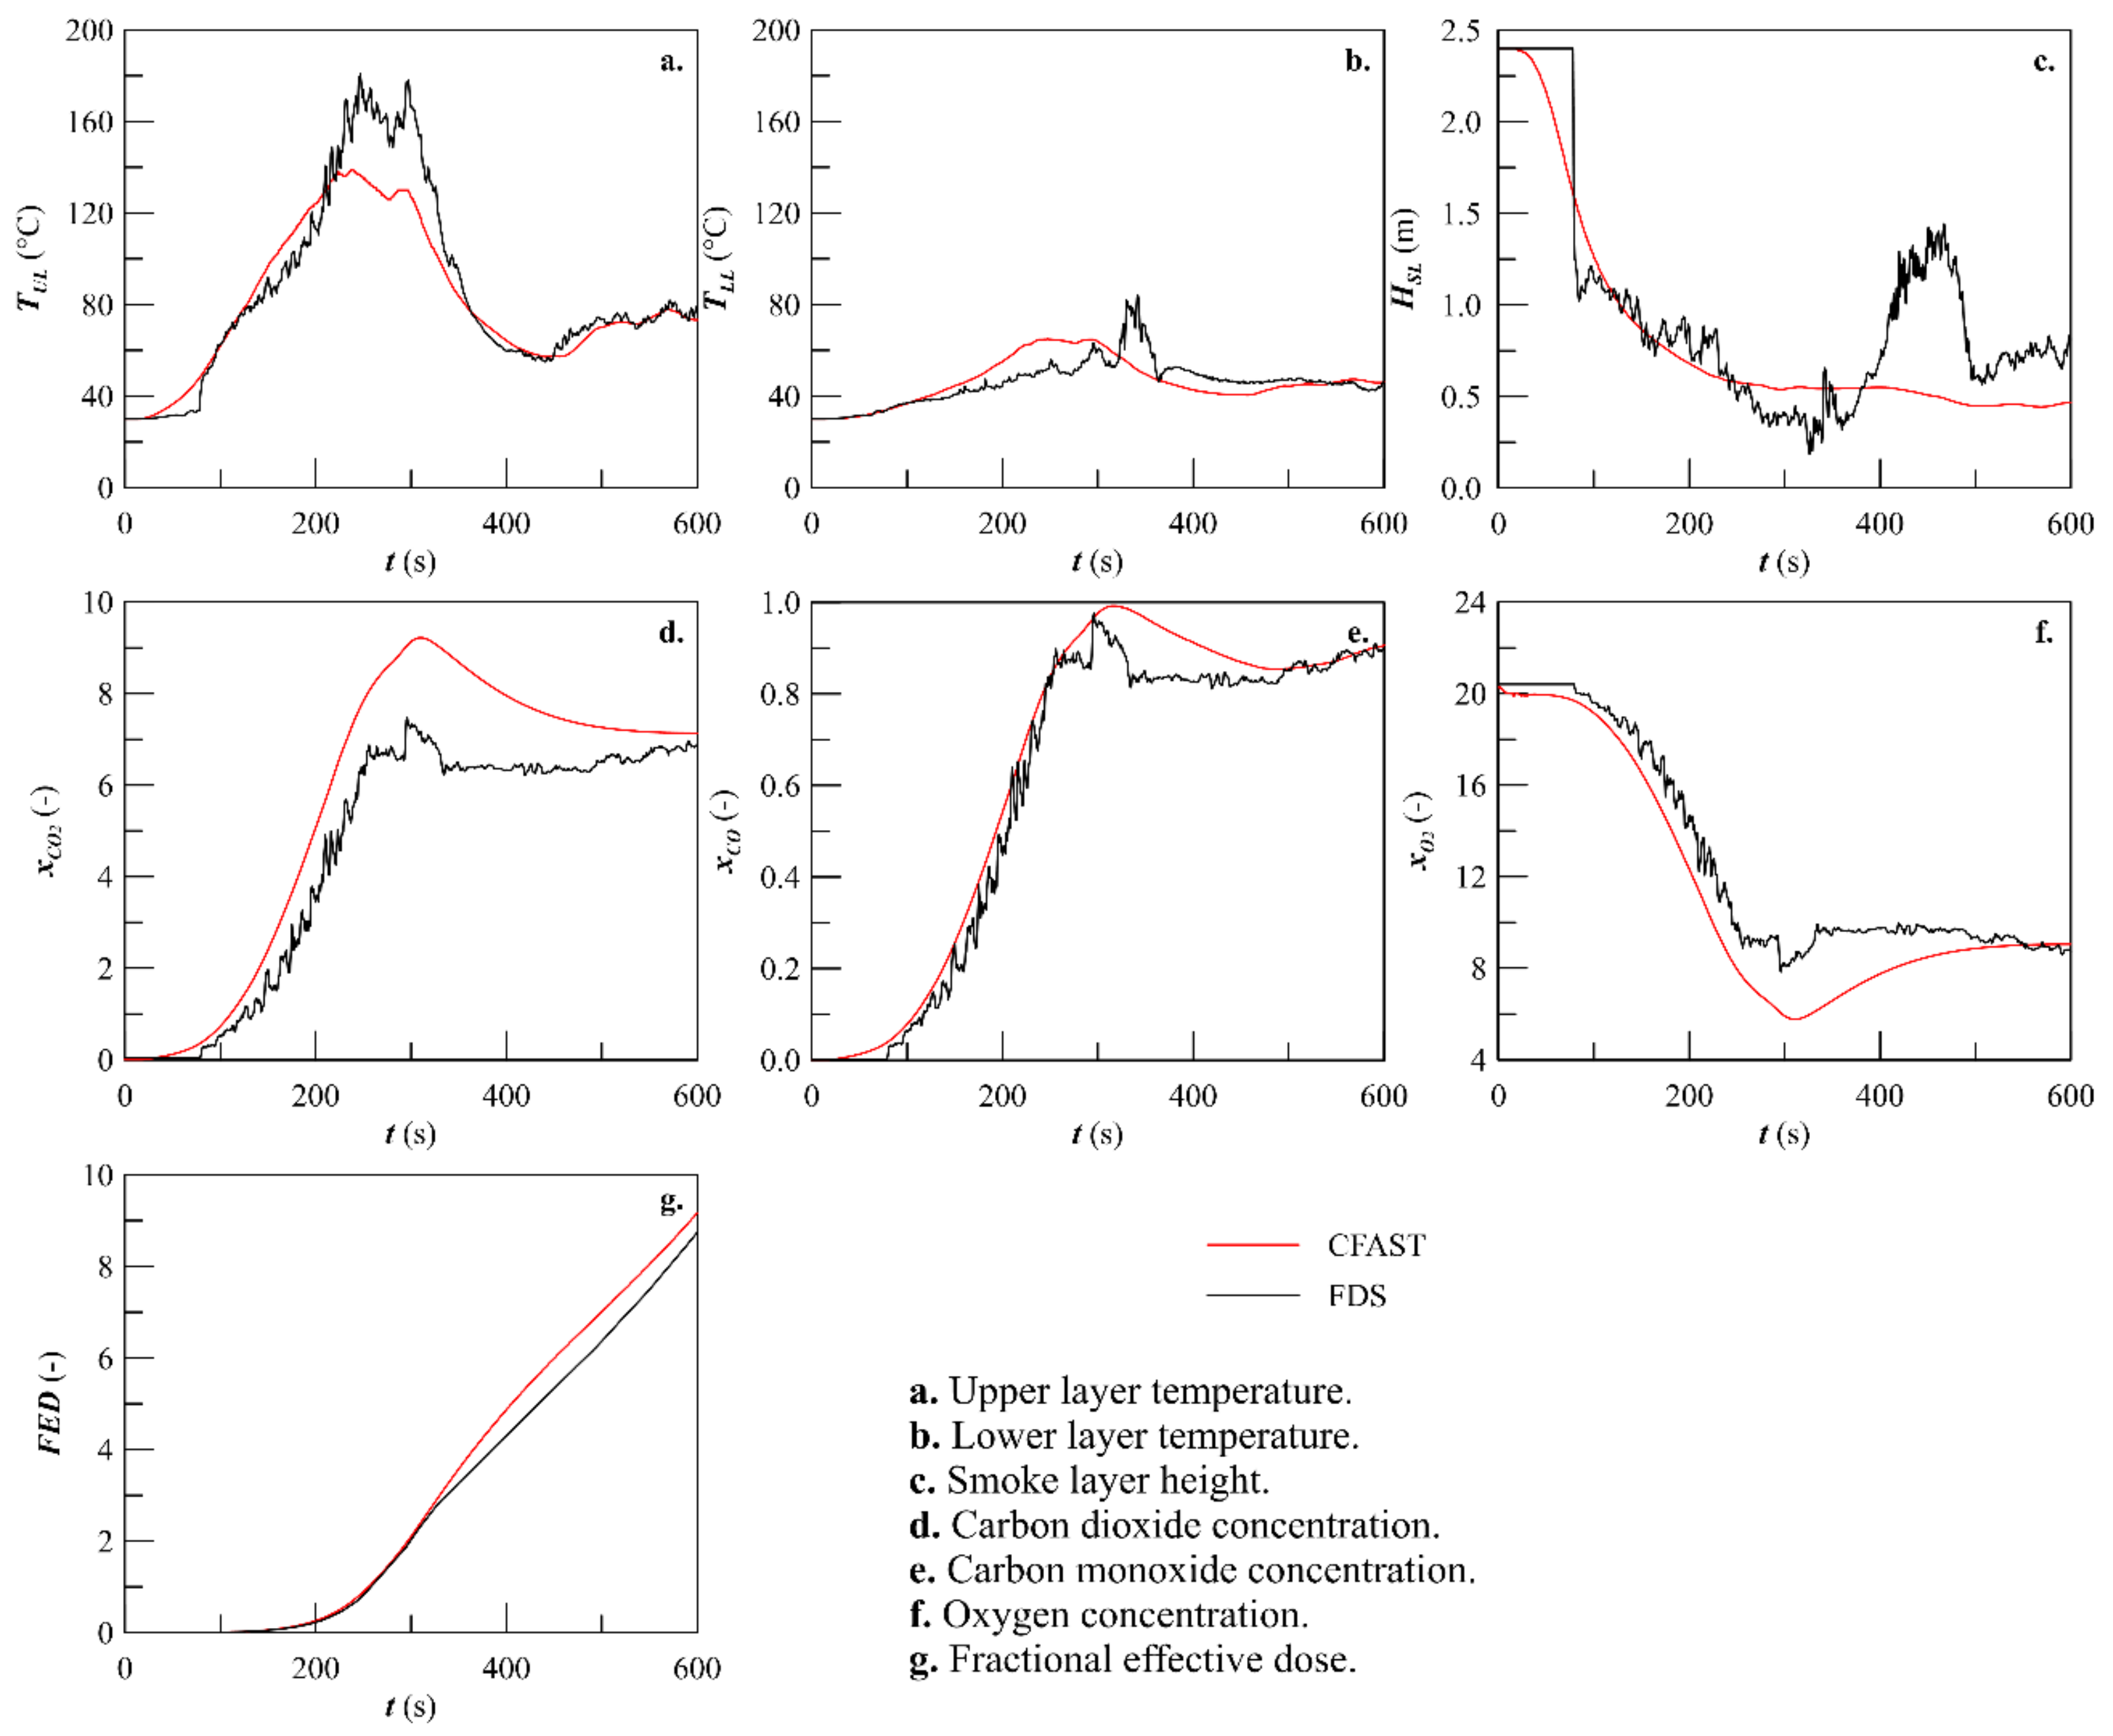
Within the cabin (the room of fire origin), the CFAST results for upper-layer temperature demonstrated remarkable agreement with the predictions made by FDS. While CFAST encountered challenges in estimating the peak value of the lower-layer temperature, it managed to generate a similar profile with almost identical results for the initial 140 s and the final 250 s of the simulation. In terms of smoke layer height, CFAST produced comparable forecasts to FDS during the initial 75 s of the simulation. However, as the simulation progressed, CFAST encountered difficulties in replicating FDS predictions, leading to an underestimation of smoke layer height during this period. Regarding upper species concentrations, CFAST generally performed well in predicting these concentrations for most of the simulation duration, except during peak and decay periods. During these phases, CFAST tended to overestimate the upper species concentrations when compared to FDS predictions. With regard to fractional effective dose (FED) predictions for narcotic gas incapacitation, CFAST exhibited strong agreement with FDS forecasts within the first 200 s of the simulation. However, beyond this point, CFAST’s predictions began to show an overestimation of FED values.
Figure 13 provides an overview of the differences between the two codes.
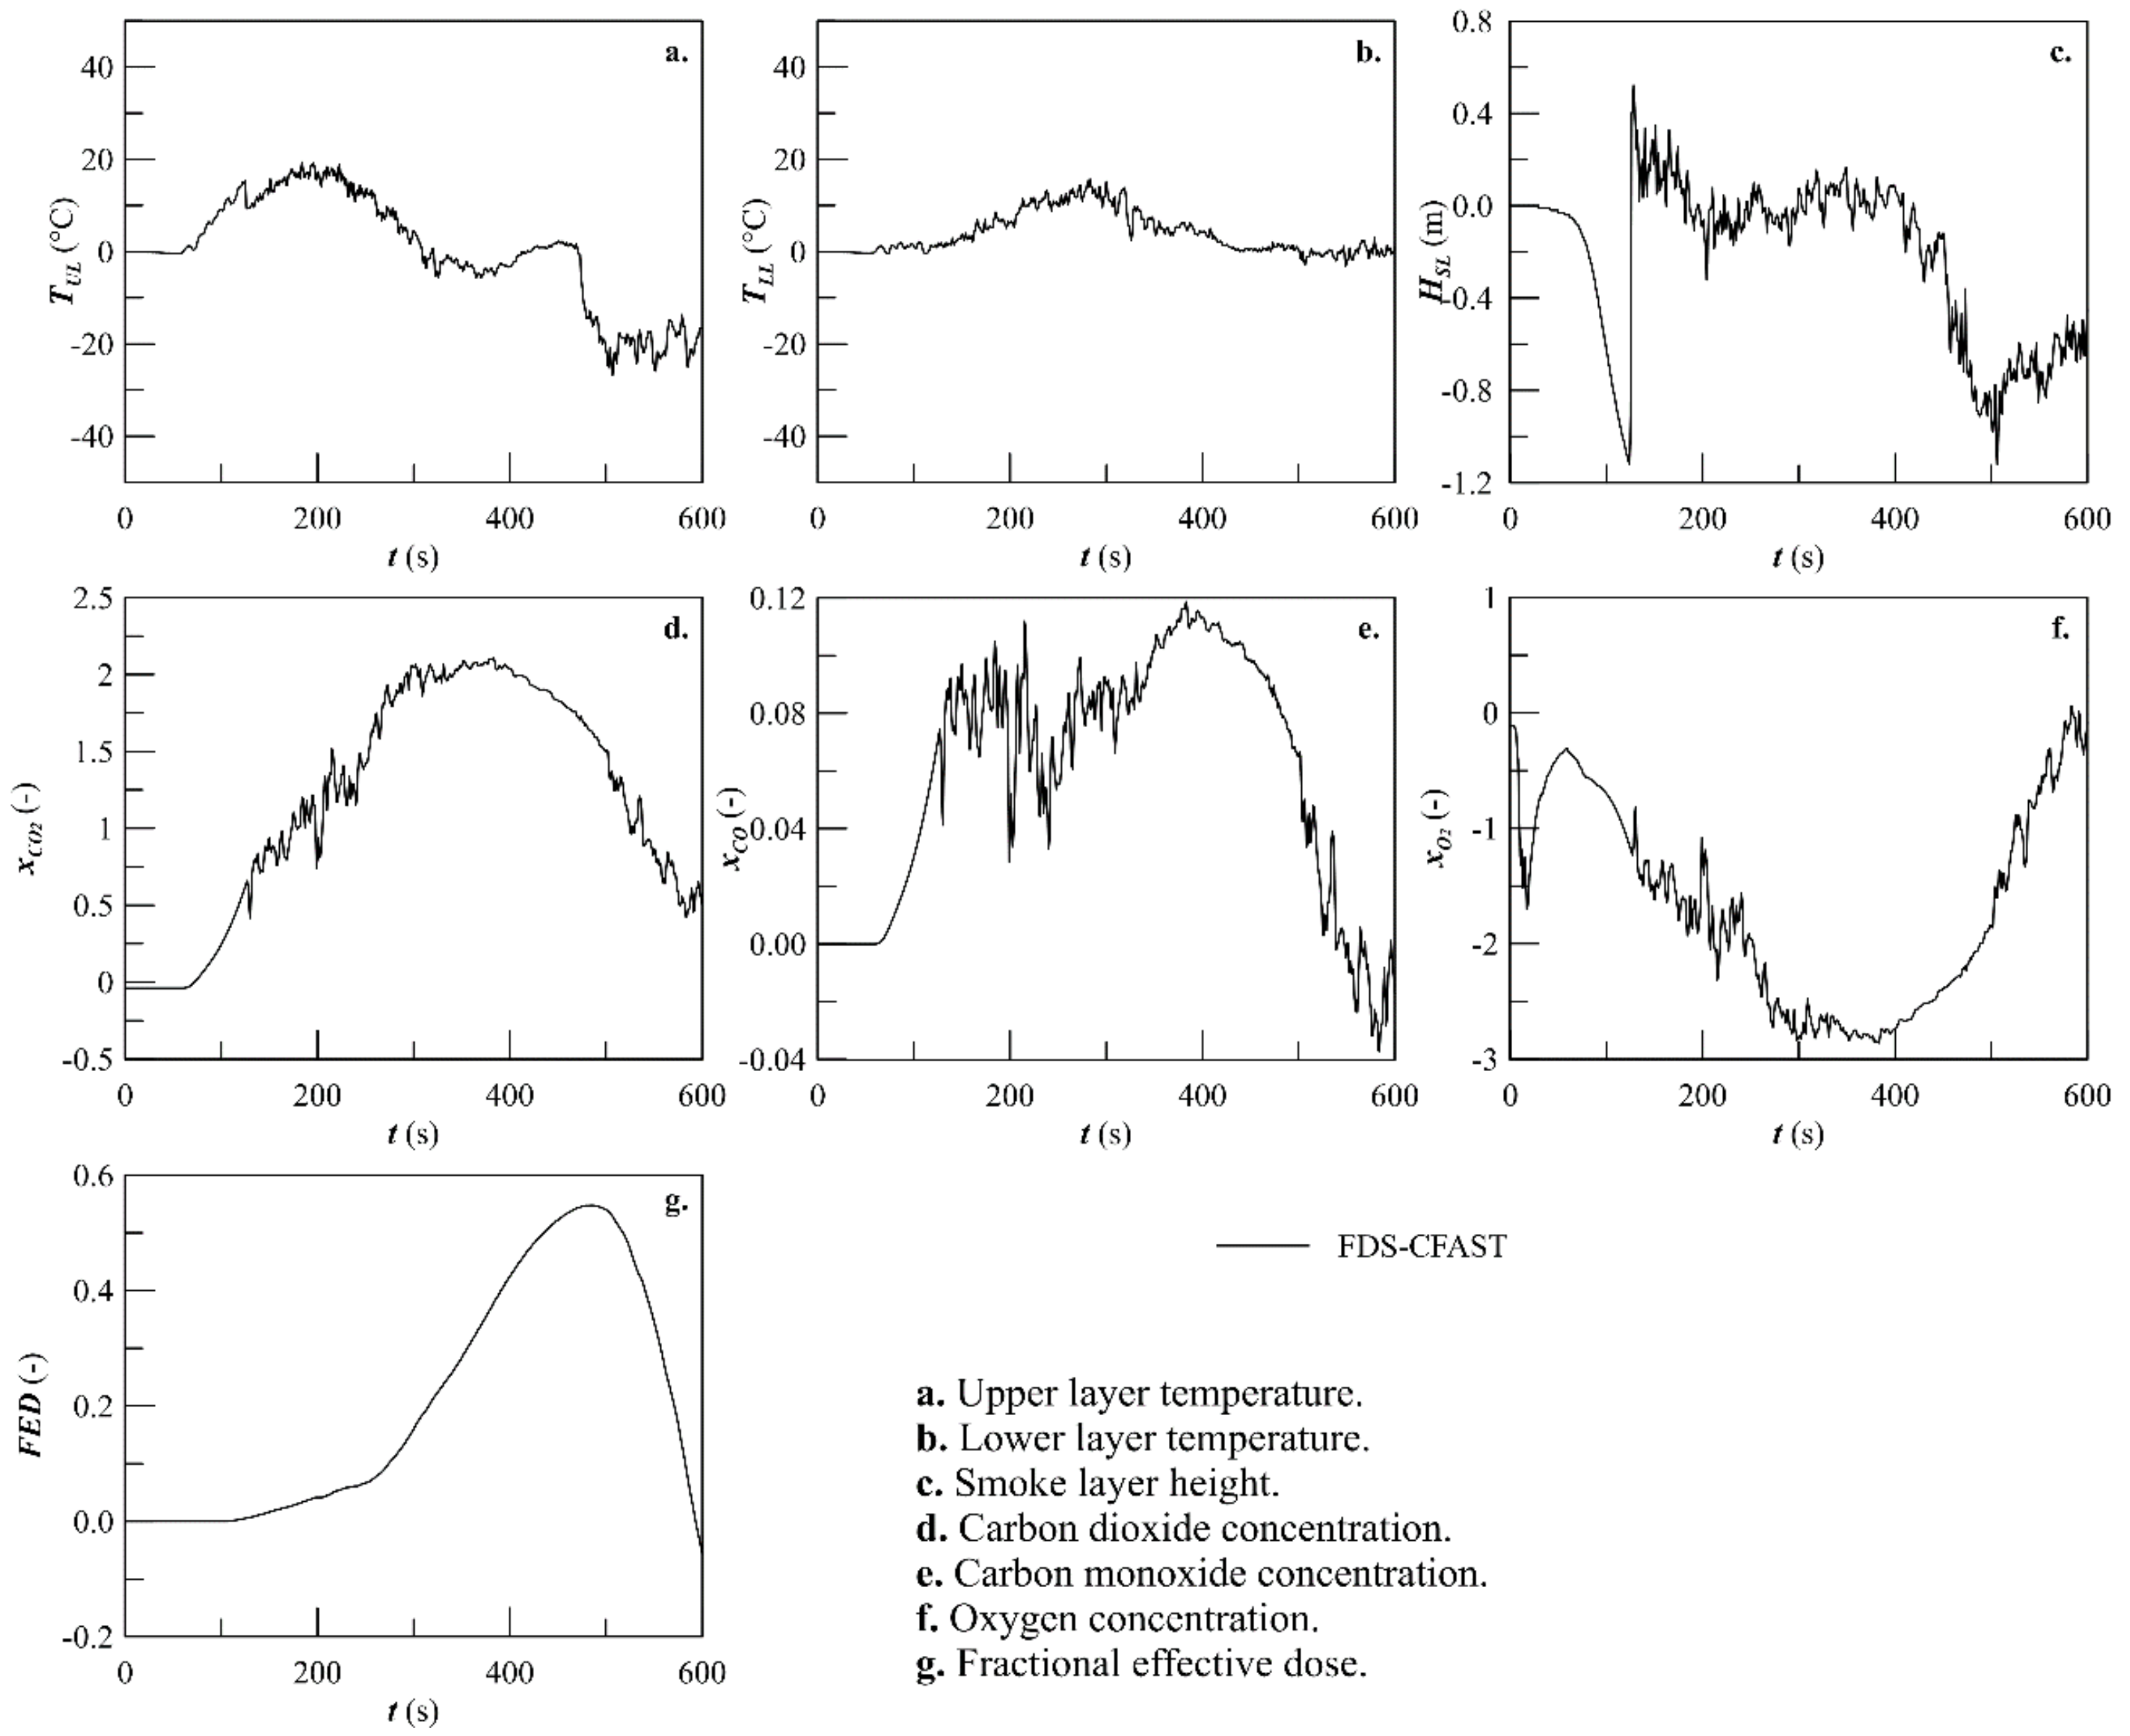
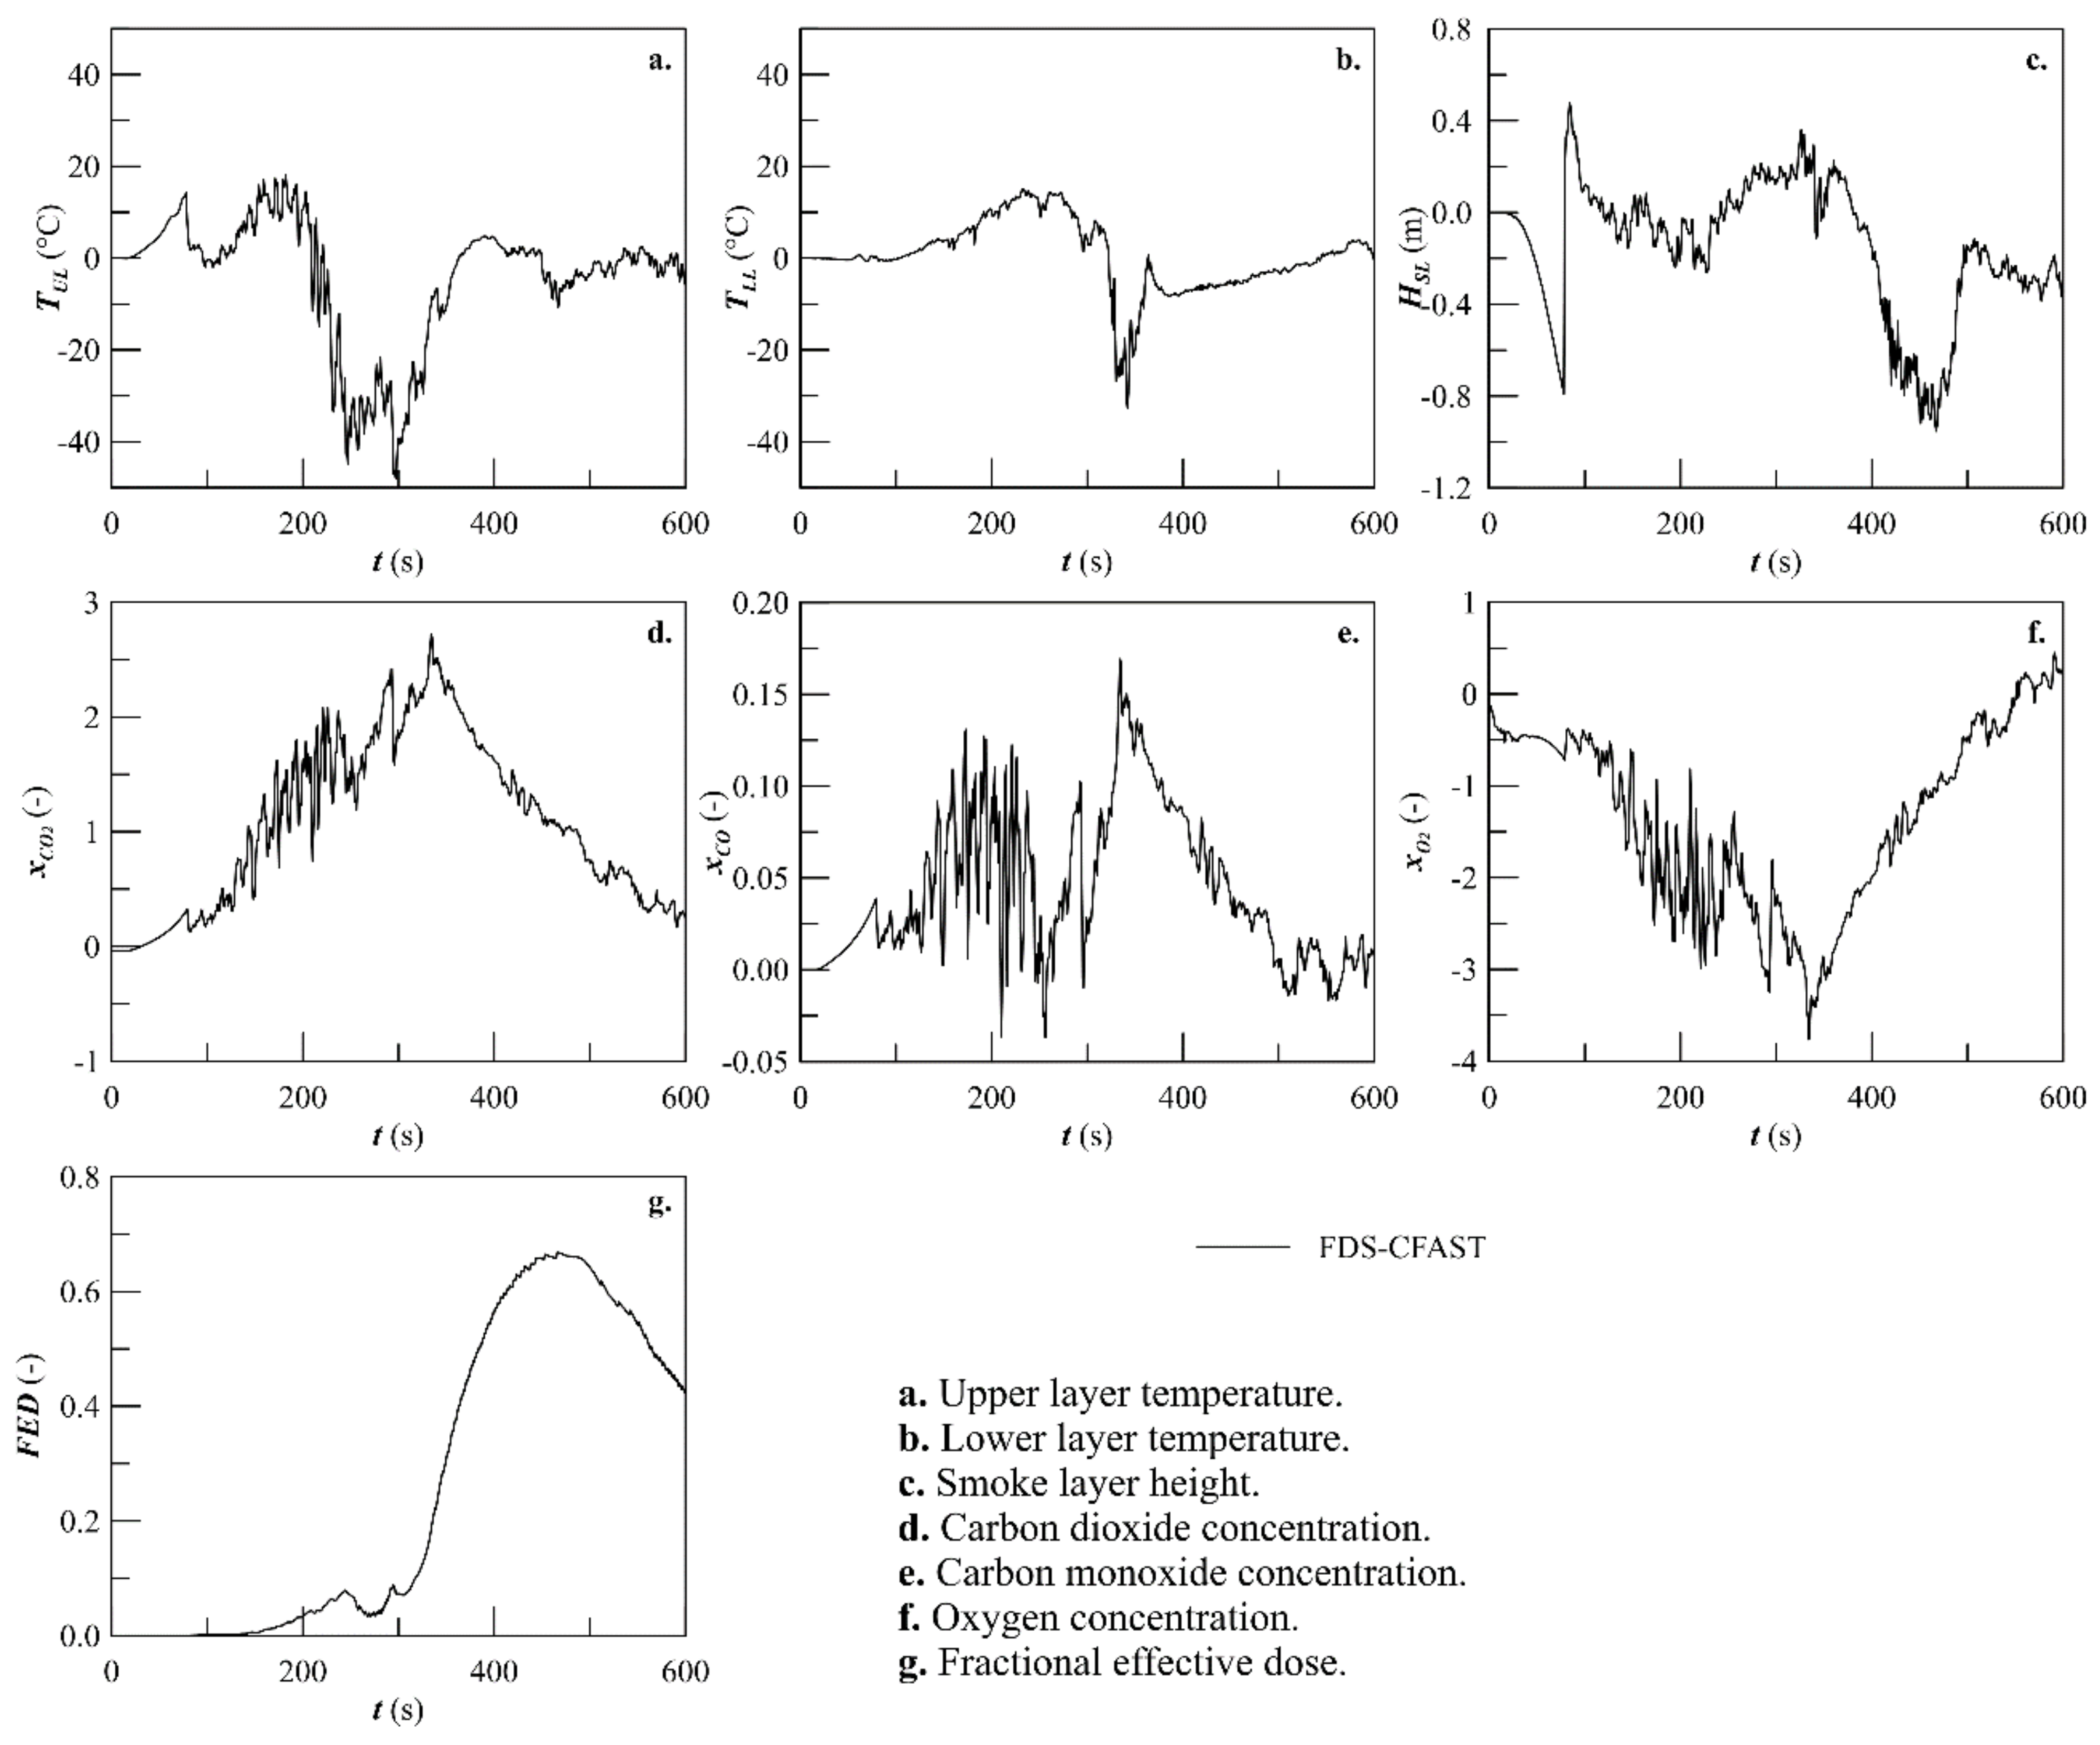
4.2. Corridor 1
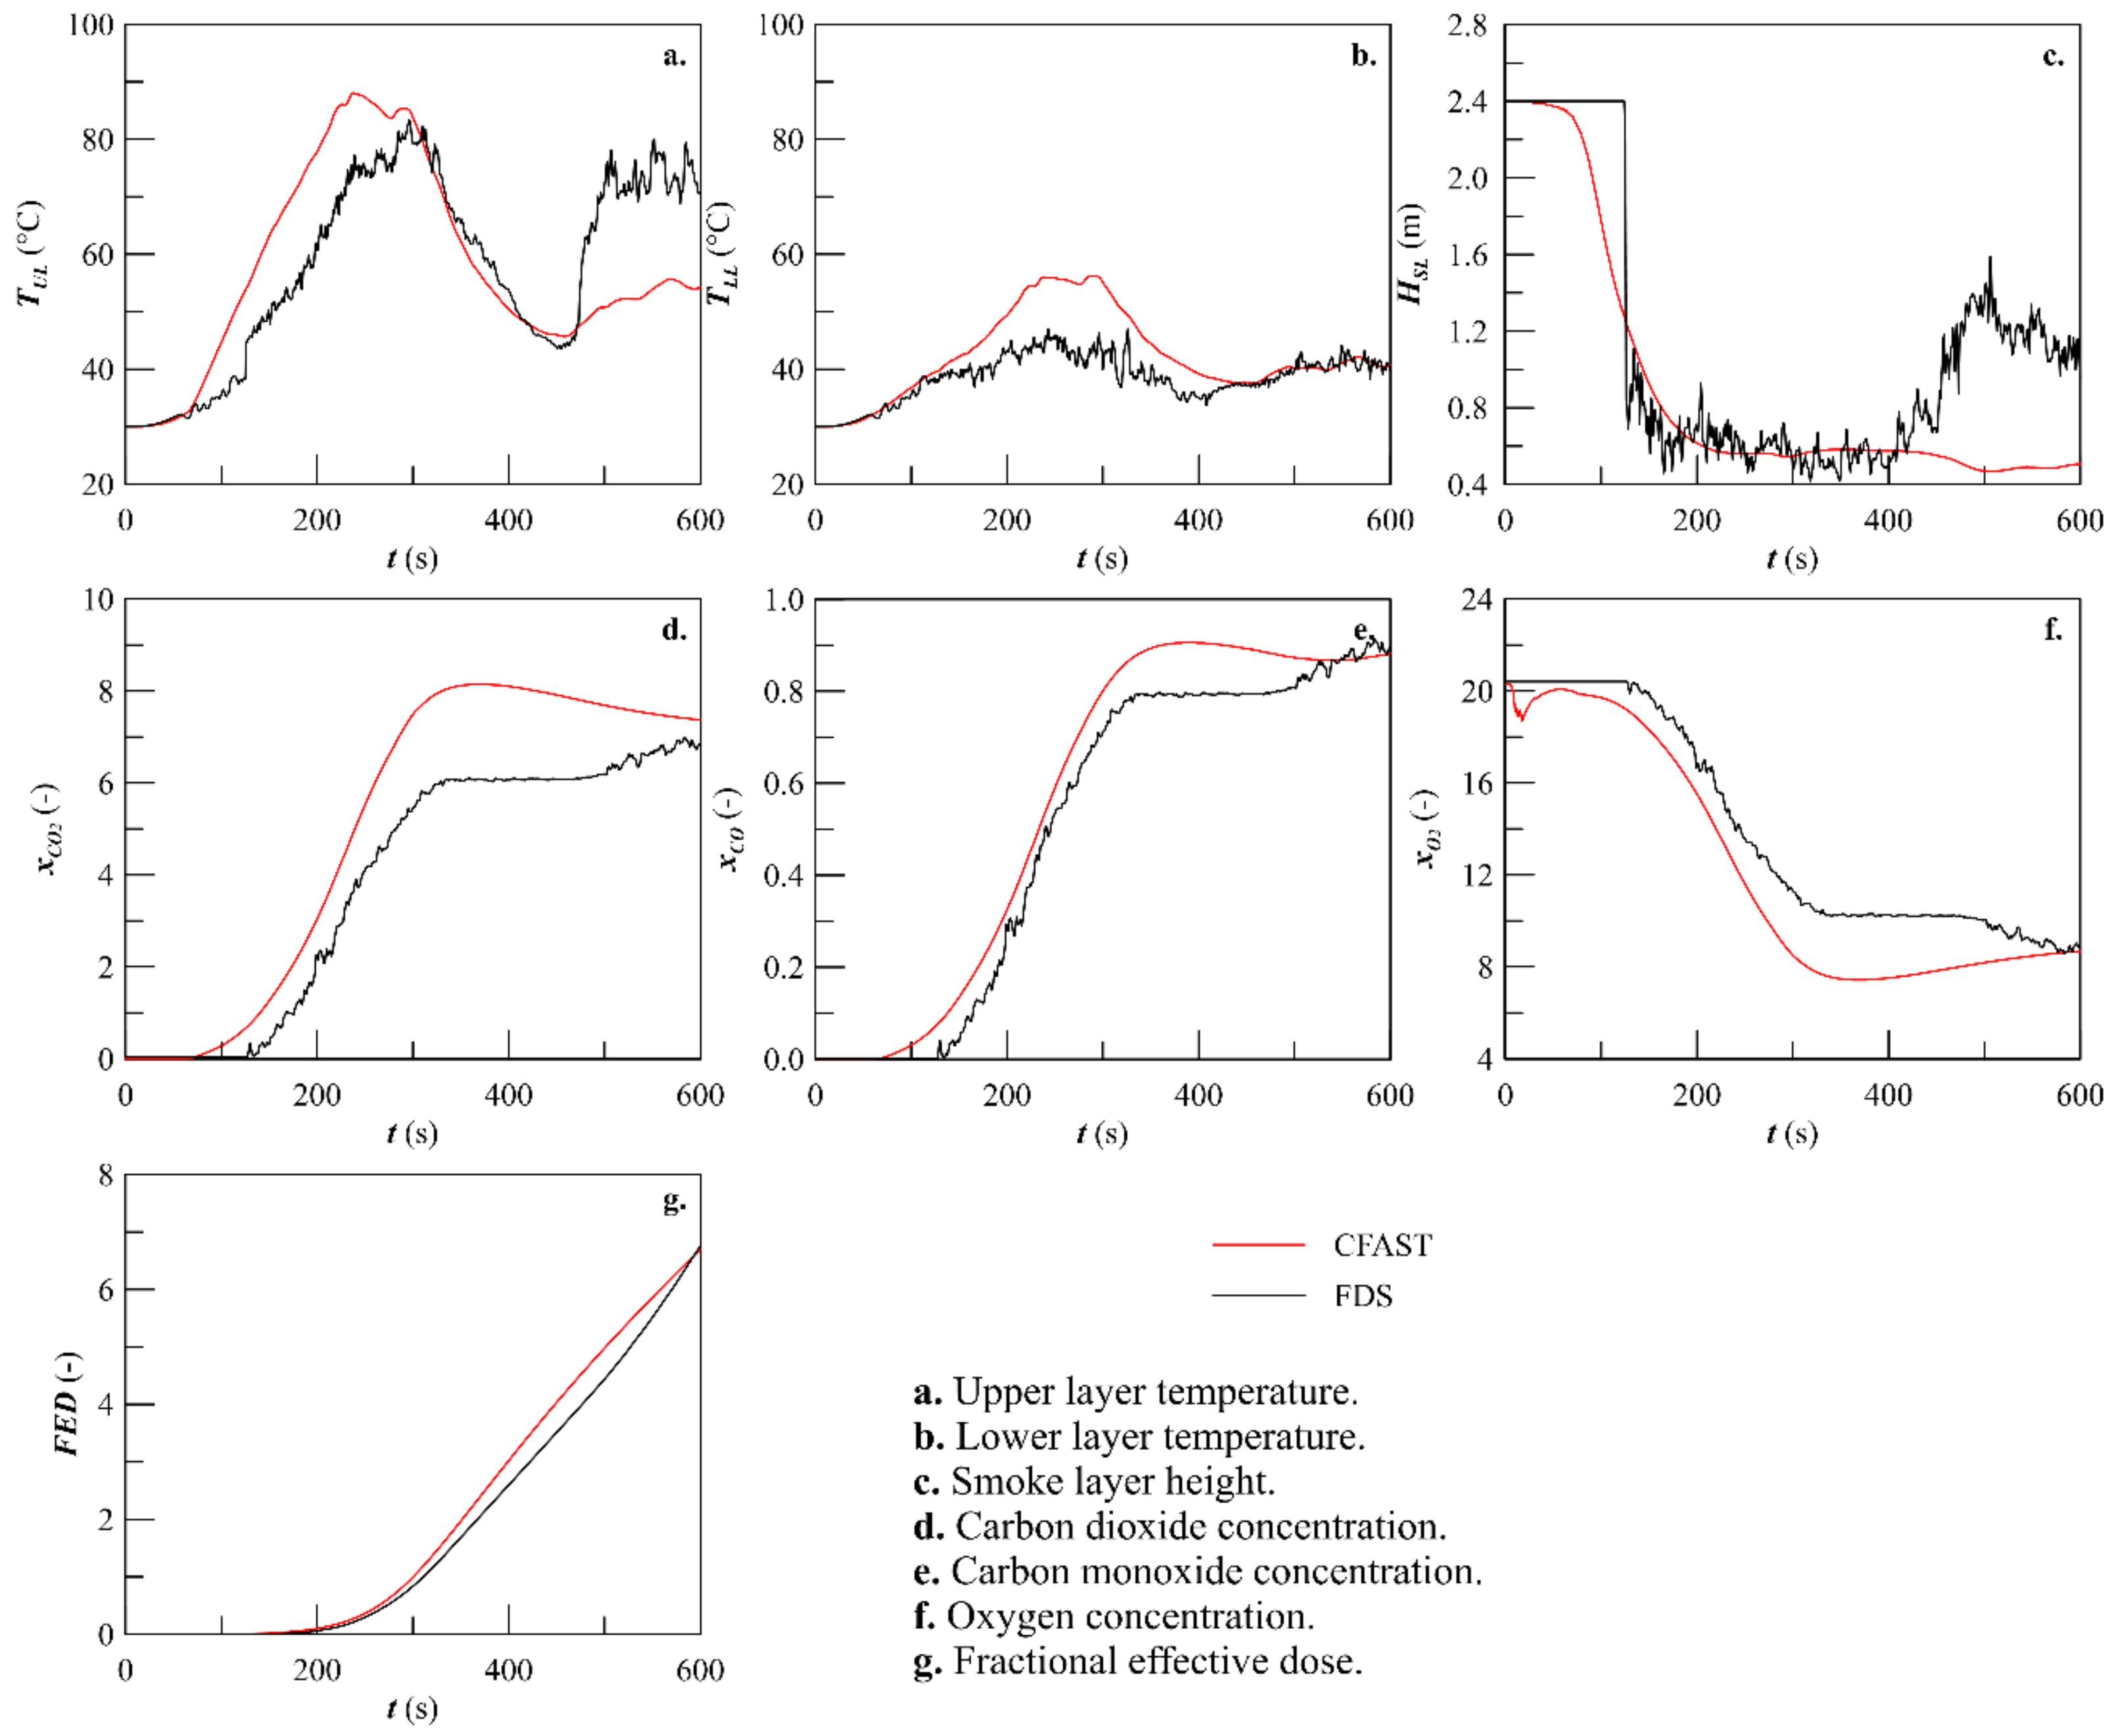
In Corridor 1, CFAST showed that upper-layer temperature results followed the same pattern of the FDS results but had some difficulties in predicting the peak value, as the model showed a prediction of about 40 °C less than the value predicted by FDS. With regard to the lower-layer temperature results, CFAST managed to achieve the same results as FDS during the first 100 s of the simulation and then began to follow a different pattern with a peak value of about 20 °C lower and around 100 s earlier than FDS predictions. In view of the smoke layer height results, CFAST showed a good average prediction of the layer height during most of the simulation period. Regarding the results of the upper species concentrations, CFAST generally displayed very good predictions of these concentrations during most of the simulation period. Concerning the results of the fractional effective dose (FED) for incapacitation due to narcotic gases, CFAST showed predictions in excellent agreement with FDS predictions. In Corridor 1, CFAST exhibited upper-layer temperature results that generally mirrored the pattern of FDS results. However, CFAST encountered difficulties in predicting the peak value, deviating by approximately 40 °C compared to FDS’s prediction. For lower-layer temperature results, CFAST initially matched FDS predictions during the first 100 s of the simulation. Subsequently, it diverged from FDS, with a peak value approximately 20 °C lower and occurring about 100 s earlier than FDS predictions. Regarding smoke layer height, CFAST provided satisfactory average predictions throughout most of the simulation period. Concerning upper species concentrations, CFAST consistently produced highly accurate predictions during most of the simulation timeframe. In terms of fractional effective dose (FED) predictions for narcotic gas-induced incapacitation, CFAST’s predictions displayed exceptional agreement with those of FDS in Corridor 1.
Figure 14 provides an overview of the difference between the two codes.
4.3. Corridor 2
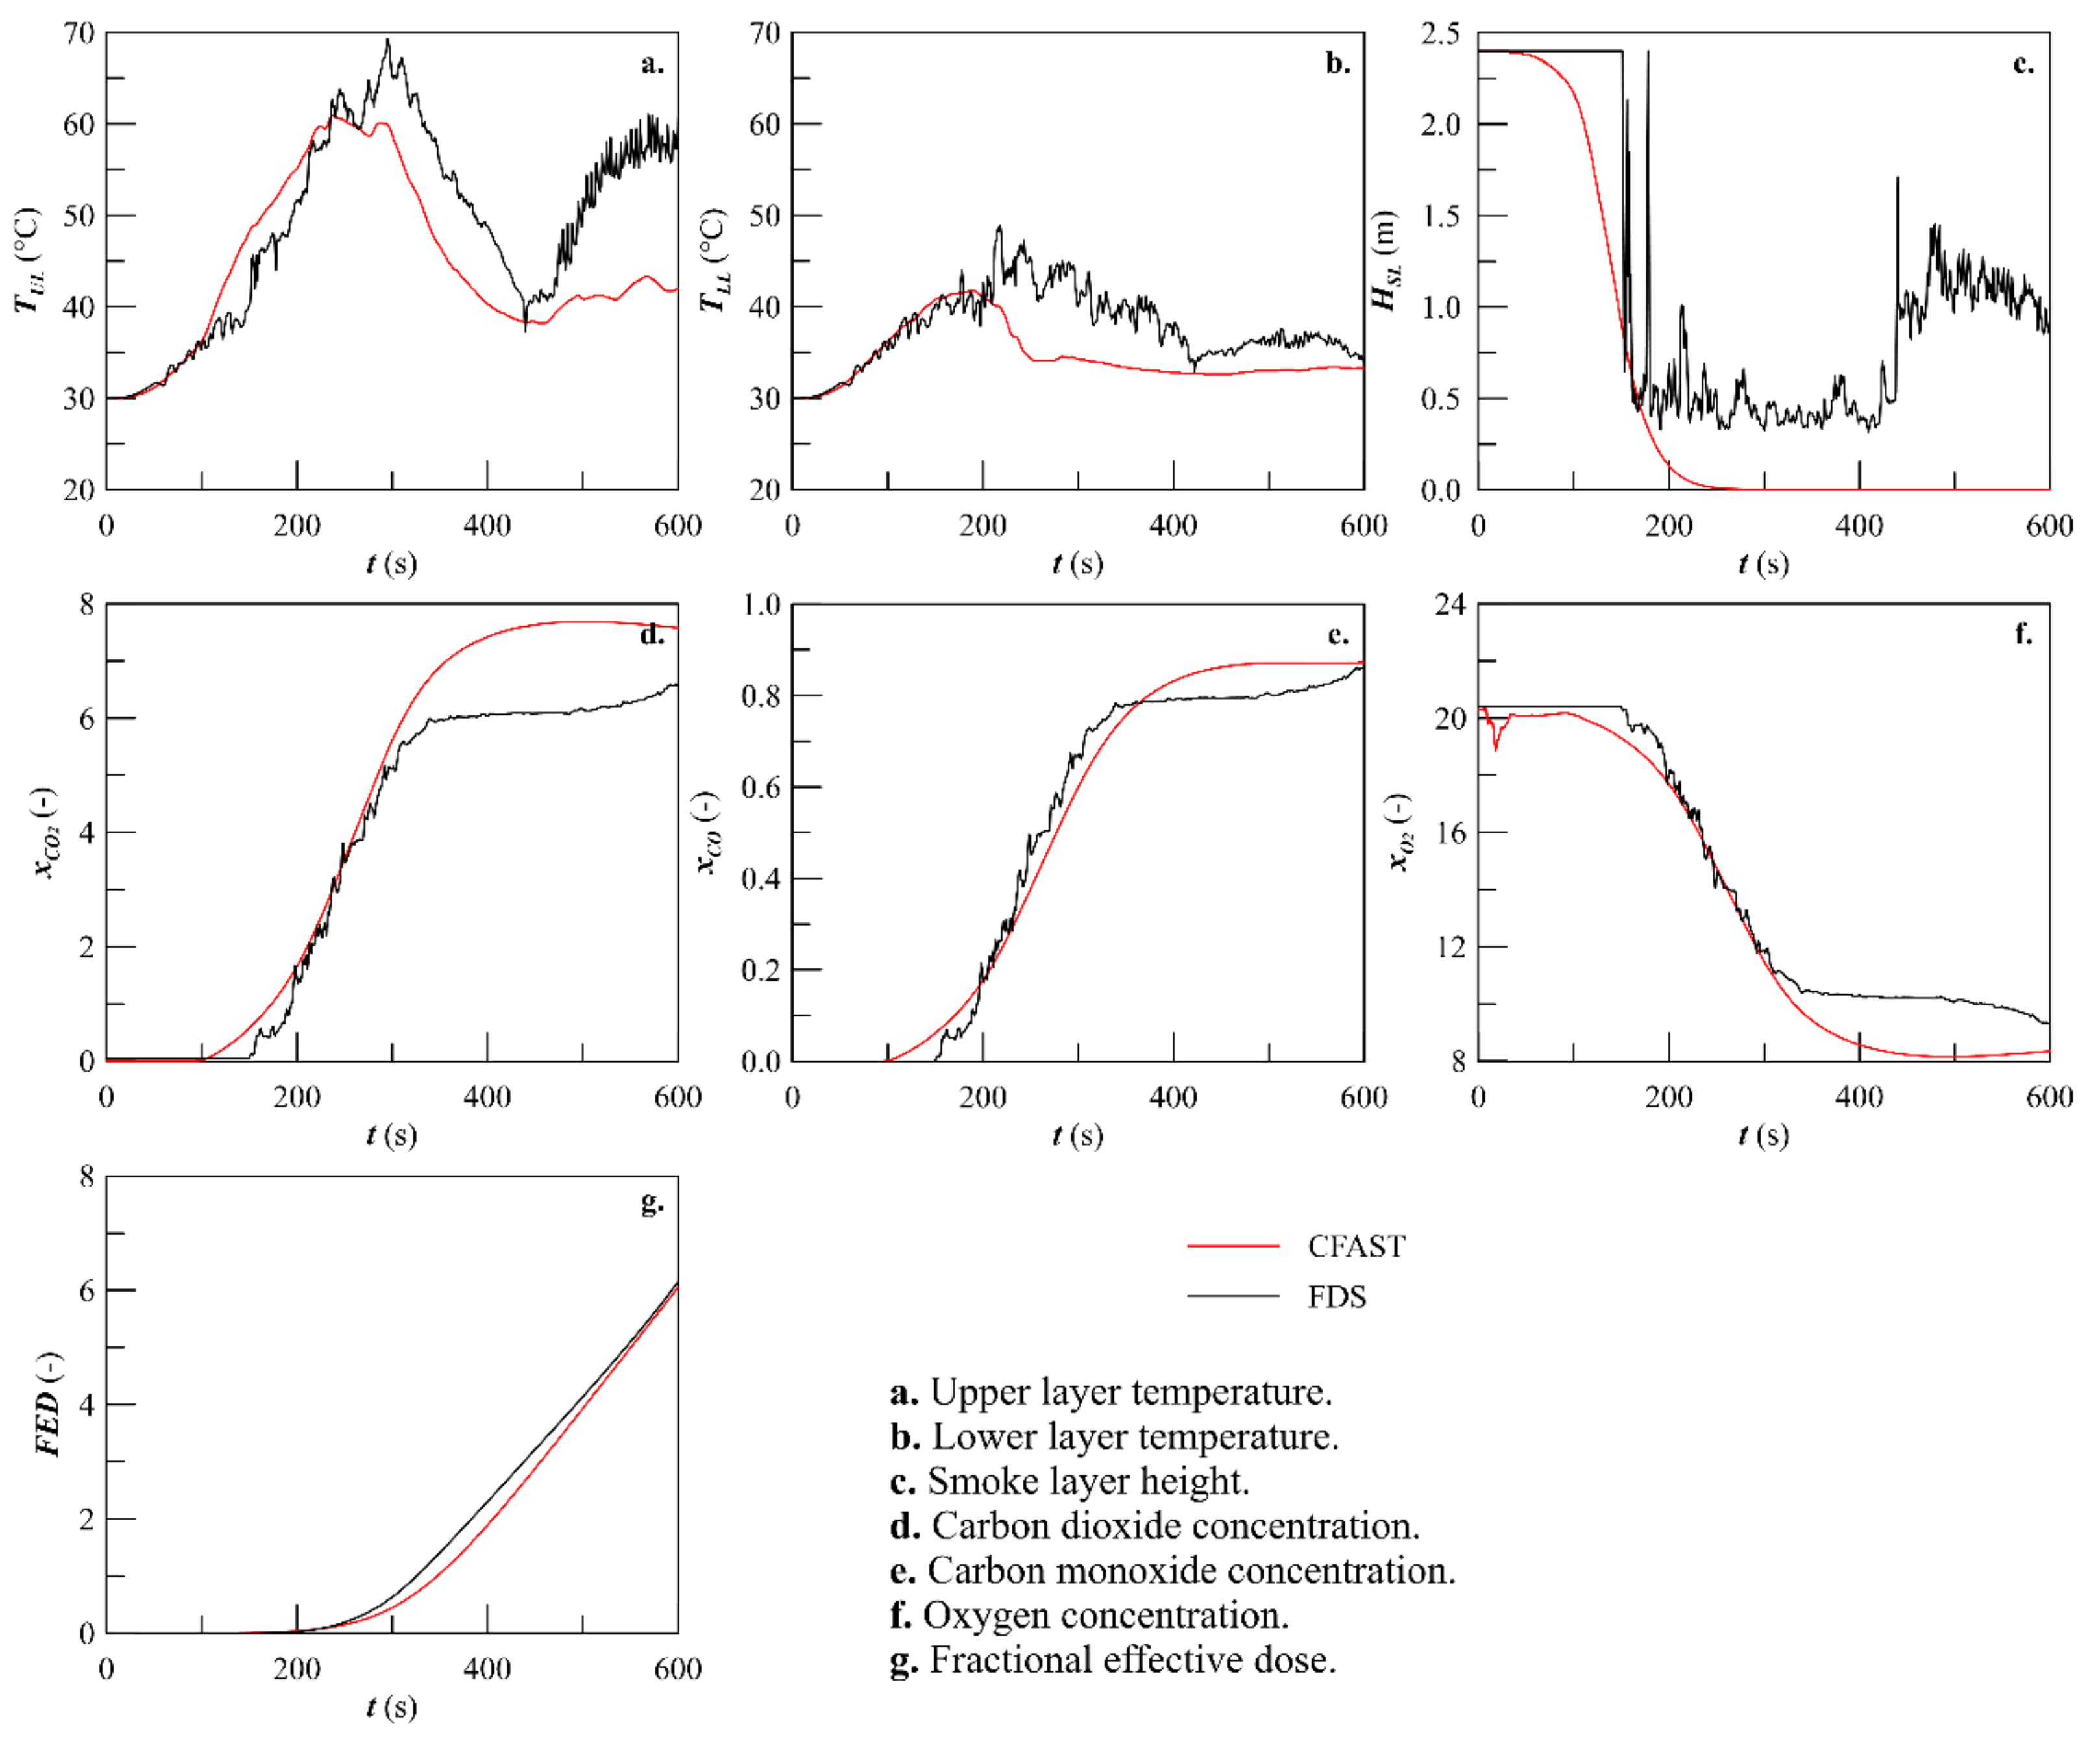
In Corridor 2, CFAST’s upper-layer temperature results were closely aligned with the values predicted by FDS. In terms of lower-layer temperature results, CFAST encountered challenges in estimating the peak value. However, it generally replicated the same profile with nearly identical results during the fire growth phase and the initial stages of the decay period. Regarding smoke layer height, CFAST demonstrated over-predicted results during the fire growth phase and the early decay period. However, it managed to produce results very close to FDS predictions during the steady-state phase and the later stages of the decay period. Concerning upper species concentrations, CFAST exhibited slight overestimations during most of the simulation’s timeframe, except for the end of the decay period, during which it displayed excellent agreement with FDS predictions. In relation to fractional effective dose (FED) predictions for narcotic gas-induced incapacitation, CFAST’s predictions closely matched FDS predictions for the initial 250 s and the final 20 s of the simulation. However, it showed slight over-predictions between these two periods.
Figure 15 shows an overview of the difference between the two modelling options.
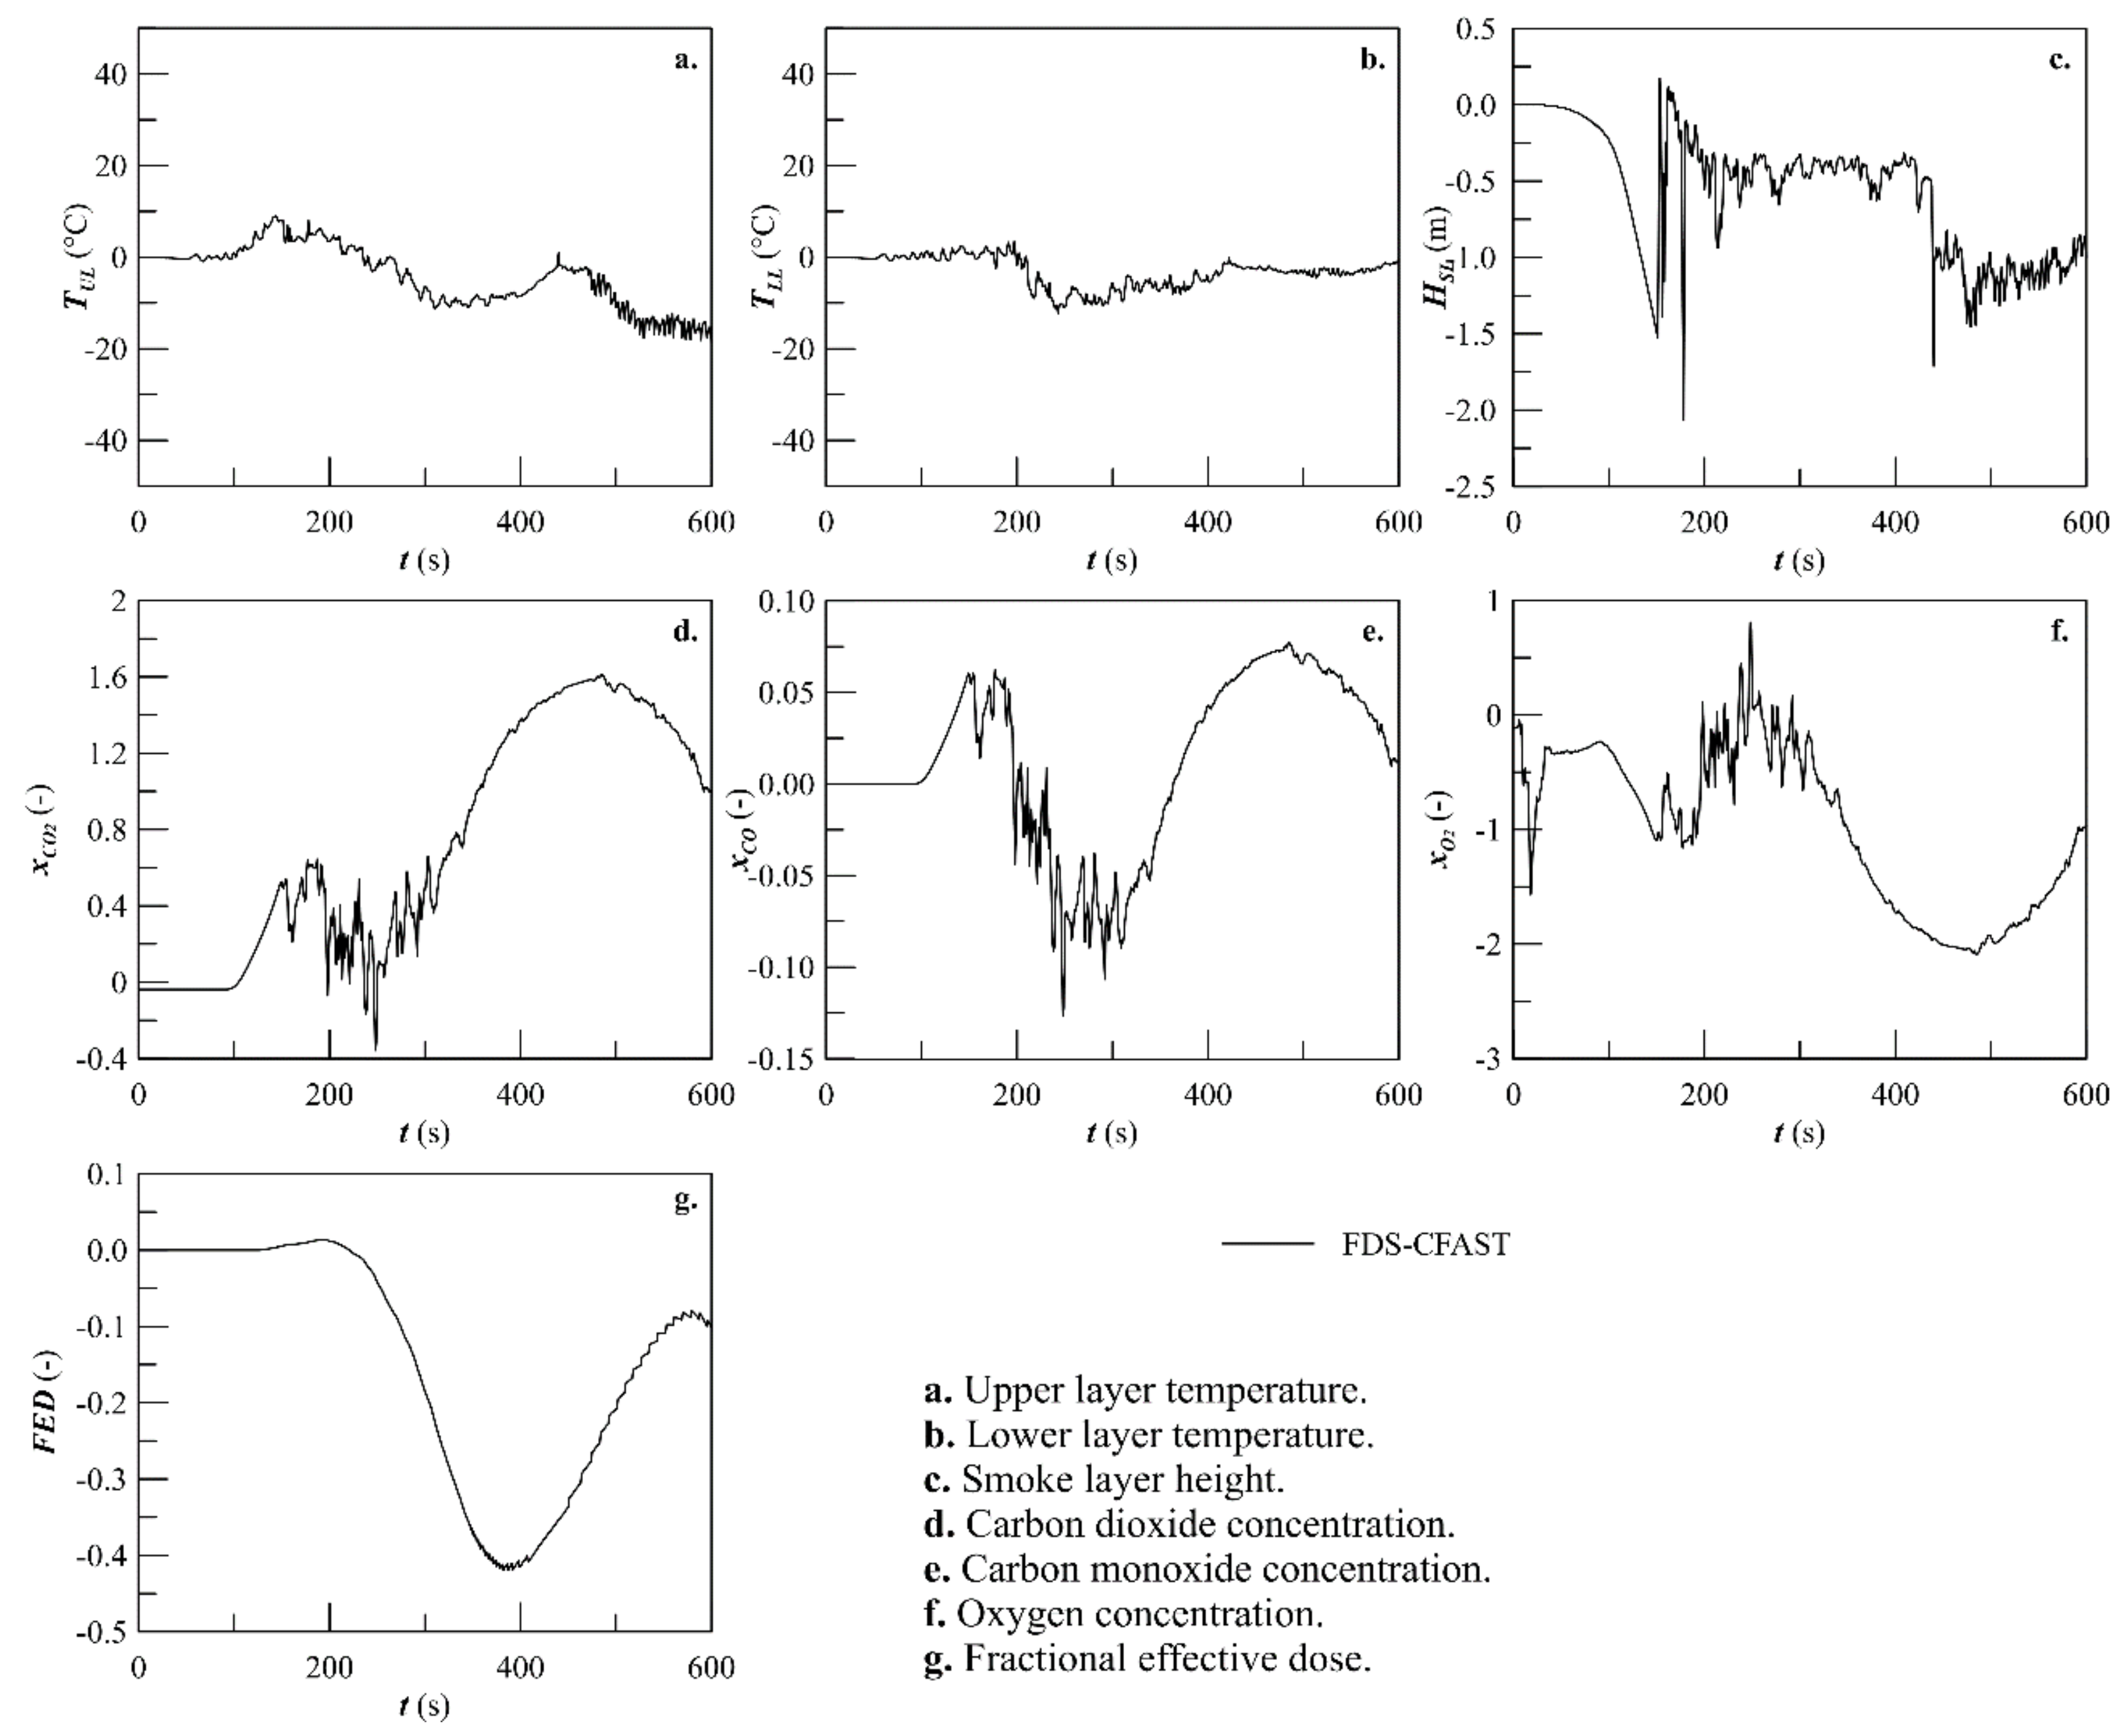
4.4. Corridor 3
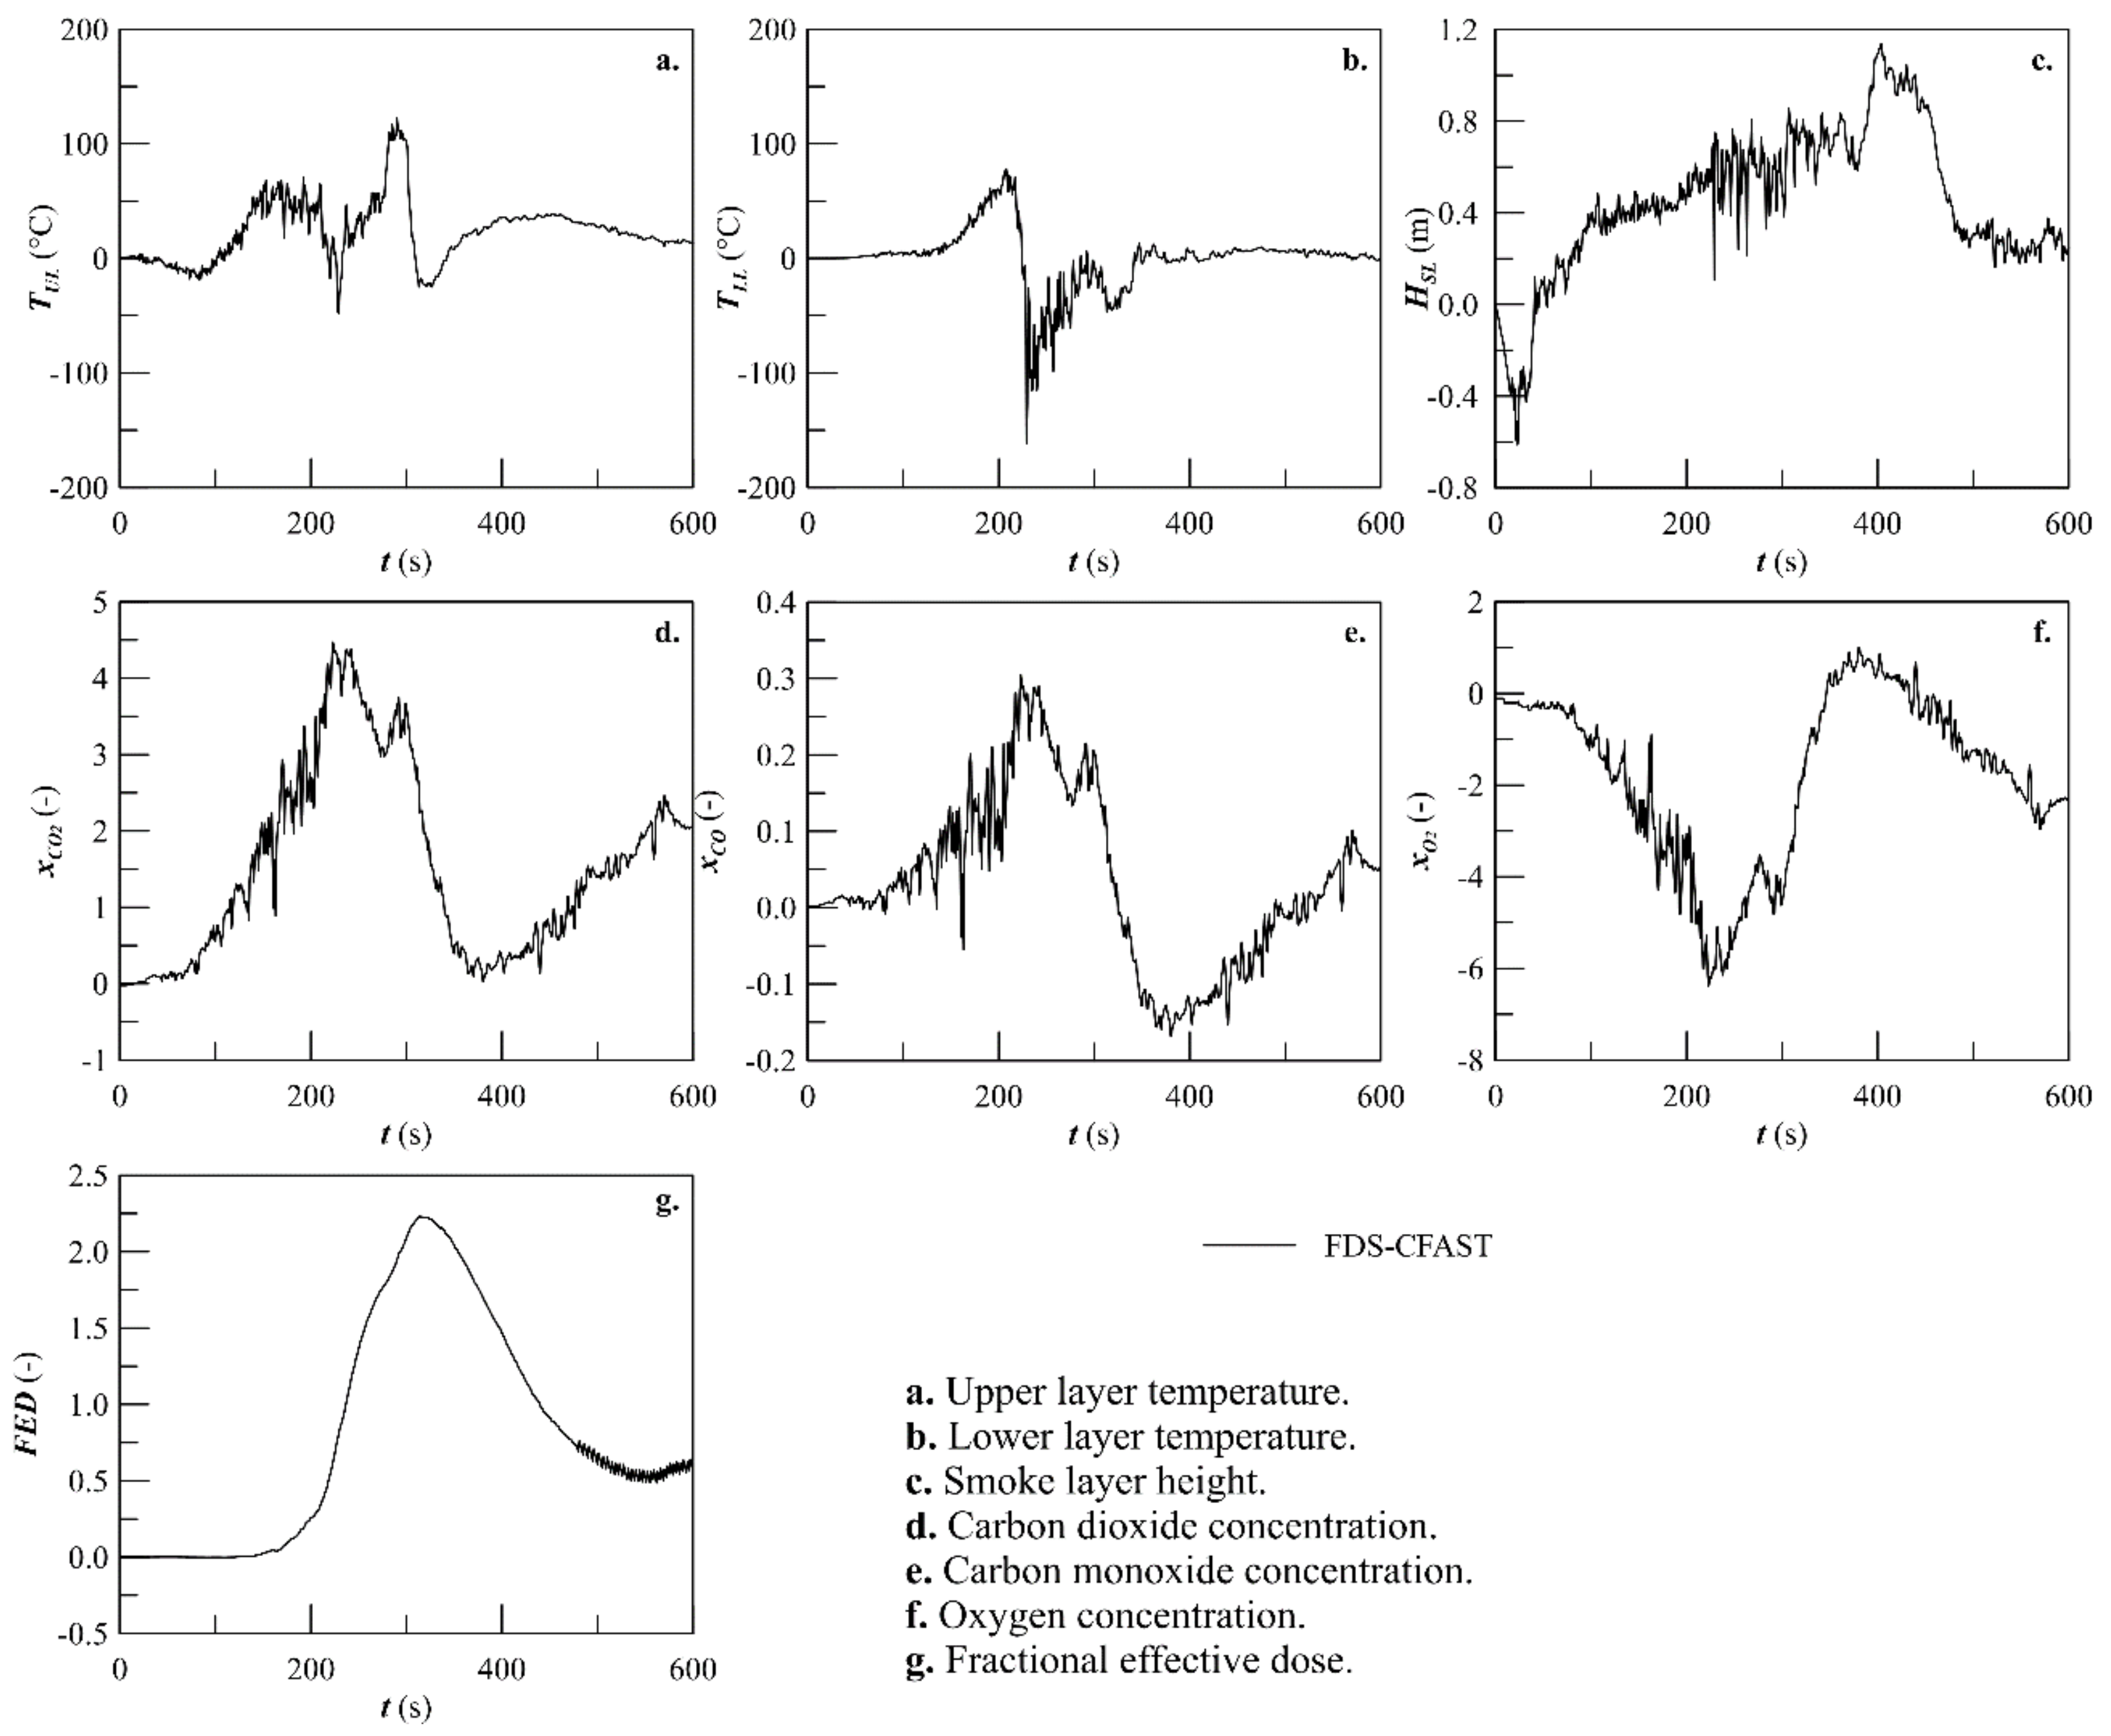
In Corridor 3, CFAST’s upper-layer temperature results generally aligned well with the values predicted by FDS, particularly during the initial 100 s. With respect to the lower-layer temperature results, CFAST demonstrated excellent agreement with FDS predictions, especially in the first 200 s, effectively replicating the same temperature profile as FDS. In terms of smoke layer height, CFAST tended to over-predict results compared to FDS, especially during the decay period. In this phase, CFAST exhibited a complete filling of the compartment with smoke, which was not reflected in the FDS results. Regarding upper species concentrations, CFAST offered good predictions for the majority of the simulation duration, with slight overestimations during the decay period compared to FDS predictions. Concerning fractional effective dose (FED) predictions for narcotic gas-induced incapacitation, CFAST’s predictions closely matched FDS forecasts within the first 250 s. However, beyond this point, CFAST began to slightly under-predict FED values.
Figure 16 shows the differences between the two modelling options.
4.5. Concluding Remarks
The above observations emphasize the strengths and limitations of each modelling technique in capturing various aspects of the fire scenario. The highlighted similarities and discrepancies between the two different fire modelling techniques represented by both FDS and CFAST emphasize the importance of meticulous consideration when interpreting their results, and the necessity for a well-balanced assessment and an understanding of the specific contexts in which each model is most applicable.
While both CFAST and FDS demonstrated strengths in certain aspects of fire modelling, it is evident that each model has its specific areas of challenge. CFAST generally performed well in predicting upper-layer temperature, smoke layer height, species concentrations, and FED within the initial stages of the simulations particularly in the room of fire origin and in the closest connected compartments to the room of fire origin. However, as the simulations progressed, discrepancies, particularly in smoke layer height and FED predictions, emerged, especially in the compartments far from the room of fire origin.
Such considerations highlight that the simulations performed with CFAST can offer to passenger ship designers a valuable tool for estimating the main parameters of fire progression. In fact, the simulations performed with CFAST are extremely fast to perform (3 s for the tested scenario), and the difference in the main parameters of the fire scenario, especially for the fire origin, are not that discordant to prefer a complex simulation method instead of a simplified one for a preliminary investigation on the safety of passenger ships. It is thus possible to suggest the usage of zone models for preliminary investigations on safety onboard. In fact, the adoption of a fast simulation tool may allow for testing a considerable amount of possible fire cases and, consequently, to evaluate the risk profile of passenger ships concerning fire. Such an approach may allow for directly comparing fire safety with other aspects of risk, for example flooding, giving a global risk assessment of an actual project. With this method, it is also possible to study with relatively small calculation effort different design alternatives, providing a ranking between alternative design solutions from a risk perspective.
Furthermore, the extremely fast calculation time necessary to simulate a fire event with CFAST may also suggest the applicability of the method for the simulation of a fire event in real time, giving the possibility to incorporate fire emergency in an onboard decision support system for passenger ships. However, due to the simplified nature of the simulations, further studies are needed for increasing the reliability of the simplified simulation outcomes, as, currently, as already mentioned in the introduction, only results derived from complex simulations have been validated against experimental results [
25,
33].
5. Conclusions
The present study investigates the feasibility of utilising zone models in predicting the consequences of a potential fire scenario occurring within an accommodation deck of a passenger ship. To achieve this, a series of comparisons are carried out between CFAST, a representative zone model, and FDS, a representative field model as a benchmark, already validated in previous studies on RoPax vessels. The comparison is performed for the specific case of a Nile River cruise ship where the internal layout of an accommodation deck is modelled to perform simulations with both simulation codes.
The principal findings of this study can be briefly summarized as follows:
Fire models play a crucial role in aiding ship designers to evaluate the consequences of specific fire scenarios and assess the level of safety of new designs during the early stages. These models can be categorised into zone models and field models. While field models excel in accuracy, zone models surpass field models in terms of time and cost efficiency.
The following general conclusions can be drawn from the outcomes of the comparison between CFAST and FDS:
CFAST yielded upper- and lower-layer temperature results in the cabin of fire origin that closely corresponded to FDS results.
During the fire growth phase, CFAST effectively predicted most of the parameters within both the cabin of fire origin and the interconnected corridors.
The congruence between CFAST and FDS results gradually diminished in the interconnected corridors, with the farthest corridor from the cabin of fire origin displaying the greatest deviations.
The differences in calculation time between the two methods were considerable (9 h against 3 s for the same scenario).
These findings collectively underline the advantages and limitations of each modelling approach in assessing fire scenarios. It is evident that CFAST and FDS offer valuable insights, allowing for careful consideration and a contextual understanding when interpreting their results. Therefore, the choice between CFAST and FDS may depend on the specific requirements of the simulation and the critical parameters under consideration.
However, the significant difference in calculation time between the two simulation codes suggests that zone modelling is extremely useful for applications in the early design stage of passenger ships, where a considerable amount of calculations can be performed in a reasonable amount of time without losing much reliability in the final estimation of the main parameters of the fire progression. Such a consideration is extremely important to determine the safety profile of a project, possibly comparing different design solutions without too much editing and calculation effort.
In any case, further research and validation may be necessary to enhance the accuracy and reliability of both models, especially in scenarios involving prolonged simulations or specific conditions where deviations are observed. This study suggests that CFAST can serve as a tool for conducting a conservative comparison between established rule-based designs and potential alternative designs, particularly concerning life safety considerations.


