1. Introduction
The interaction between offshore platforms and ice in polar regions is one of the most critical safety concerns for platform structures. It has been reported that numerous offshore platforms worldwide have encountered significant vibration responses induced by ice [
1,
2,
3], posing serious safety risks to the platform structure. To mitigate these risks, it is crucial to conduct extensive research on ice-induced vibration and develop design approaches for offshore platforms in cold regions to mitigate ice-induced vibration.
Research on ice loads has been mainly carried out through experiments and numerical simulations. Early studies primarily relied on experimental methods, with the first detection of ice-induced vibration on an offshore platform occurring in 1964 [
4]. Matlock et al. [
5] developed mathematical models based on forced vibration theory to analyze the vibration of offshore platform structures. Timco et al. [
6] analyzed the ice load of caisson structures in the Beaufort Sea, Canada. Hammer et al. [
7] replicated the interaction of an idle and operational 14 MW turbine with ice representative of a 50-year return period in Southern Baltic Sea conditions at scale. Lemström et al. [
8] conducted laboratory-scale experiments on shallow-water ice–structure interaction processes by pushing a 10 m-wide ice sheet onto a tilted structure with an identical width.
Experimental methods offer direct observations, but they are costly and challenging to standardize. Advancements in numerical simulation technology have significantly expanded the limited observations from experiments by improving the understanding of ice loads on offshore platforms. Various numerical methods, such as the discrete element method (Tang et al. [
9]; Jang et al. [
10]; Long et al. [
11]; Liu et al. [
12]; Ji et al. [
13]), extended finite element method (Guo et al. [
14]; Xu et al. [
15]; Li et al. [
16]), and cohesive element method (CEM) (Liu et al. [
17]; Liu et al. [
18]; Wang et al. [
19,
20]; Patil et al. [
21]; Feng et al. [
22]; Zhan et al. [
23]), have been developed to simulate the force process of sea ice. These methods have been used to investigate ice-induced vibration and fracture mechanisms in different scenarios, and simulation models have been validated against experimental data, providing insights into ice–offshore-platform interactions. Xu et al. [
15] examined the fracture mechanism of horizontal ice based on the extended finite element method, revealing that collision velocity and structural inclination influence fracture modes by altering deformation and stress distribution in horizontal ice. Wang et al. [
24] established a coupling model using a discrete element method and finite element method approach to investigate ice-induced vibrations in a sea-ice-jacket platform model, employing cohesive contact between spherical discrete elements of equal size to simulate secondary actions of sea ice.
Previous studies have also explored various methodologies to simulate the interaction between ice and offshore platforms. Wang et al. [
19,
20] incorporated an elastoplastic linear softening constitutive model into the regular triangular prism element to characterize micro-cracking in ice sheets. Patil et al. [
21] proposed a composite formula for cohesive elements to simulate the structural interaction of an ice gravel field, but the hexahedral mesh failed to accurately represent the actual crack pattern. Feng et al. [
22] developed the CEM model to simulate ice–structure interaction and investigated the sensitivity of parameters defining stress–strain curves for block elements and Traction–Separation Law (TSL) parameters defining cohesive elements. Zhan et al. [
23] employed the CEM to simulate interactions between horizontal ice and conical vertical cylinders and showed that the ice load on columns was closely related to ice-breaking cone angles.
Some studies have replaced ice with a series of elastic brittle elements that can only explain the phenomenon of ice-excited vibration under a particular condition, while others had limitations in calculation speeds or accuracy. To address these issues, this paper proposes a new CEM-based sea-ice–offshore-platform interaction model that employs tetrahedral grid units, which accurately capture crack failure modes. The proposed model considers the speed of ice-induced vibration and the direction of ice impact on the offshore platform. By incorporating these factors, the proposed model provides a more comprehensive understanding of the dynamics of ice–offshore-platform interactions, contributing to the design of structures that are resistant to icy conditions.
This paper presents a numerical model and CEM to study ice–offshore-platform interactions, validated against an ice-breaking experiment. A coupling model is established to investigate motion response and test the effectiveness of an ice-breaking cone on an ice-jacket platform. Through evaluation, optimal cone angles for ice-breaking cone prevention are determined. The research contributes to understanding ice–offshore-platform interactions and provides insights for designing structures that can withstand icy conditions.
2. Cohesive Element Model
The main motivation behind the various simulation methods is to describe the behavior of ice. The finite element technique implemented in Dassault Systèmes® Abaqus 2021 program combines both computational effectiveness and mathematical robustness in solving the continuous medium problem. In the present study, the cohesive element model is introduced in ABAQUS to consider discontinuous problems such as ice-breaking characteristics. The cohesive zone model offers an effective means of simulating fatigue crack development, building on concepts first introduced by Dugdale [
25] and Barenblatt [
26] concerning yield in steel plates and fracture theory. The cohesive zone model eliminates the unrealistic stress singularity of the crack tip and views crack propagation as a gradual process of material degradation [
27]. The CEM extends the cohesive zone model to the finite element approach [
28]. As an improved method of the traditional finite element method, it not only has the advantages of the finite element method, such as the diversity of simulated materials and the ability to deal with nonlinear problems, but also avoids the stress discontinuity in the fracture process.
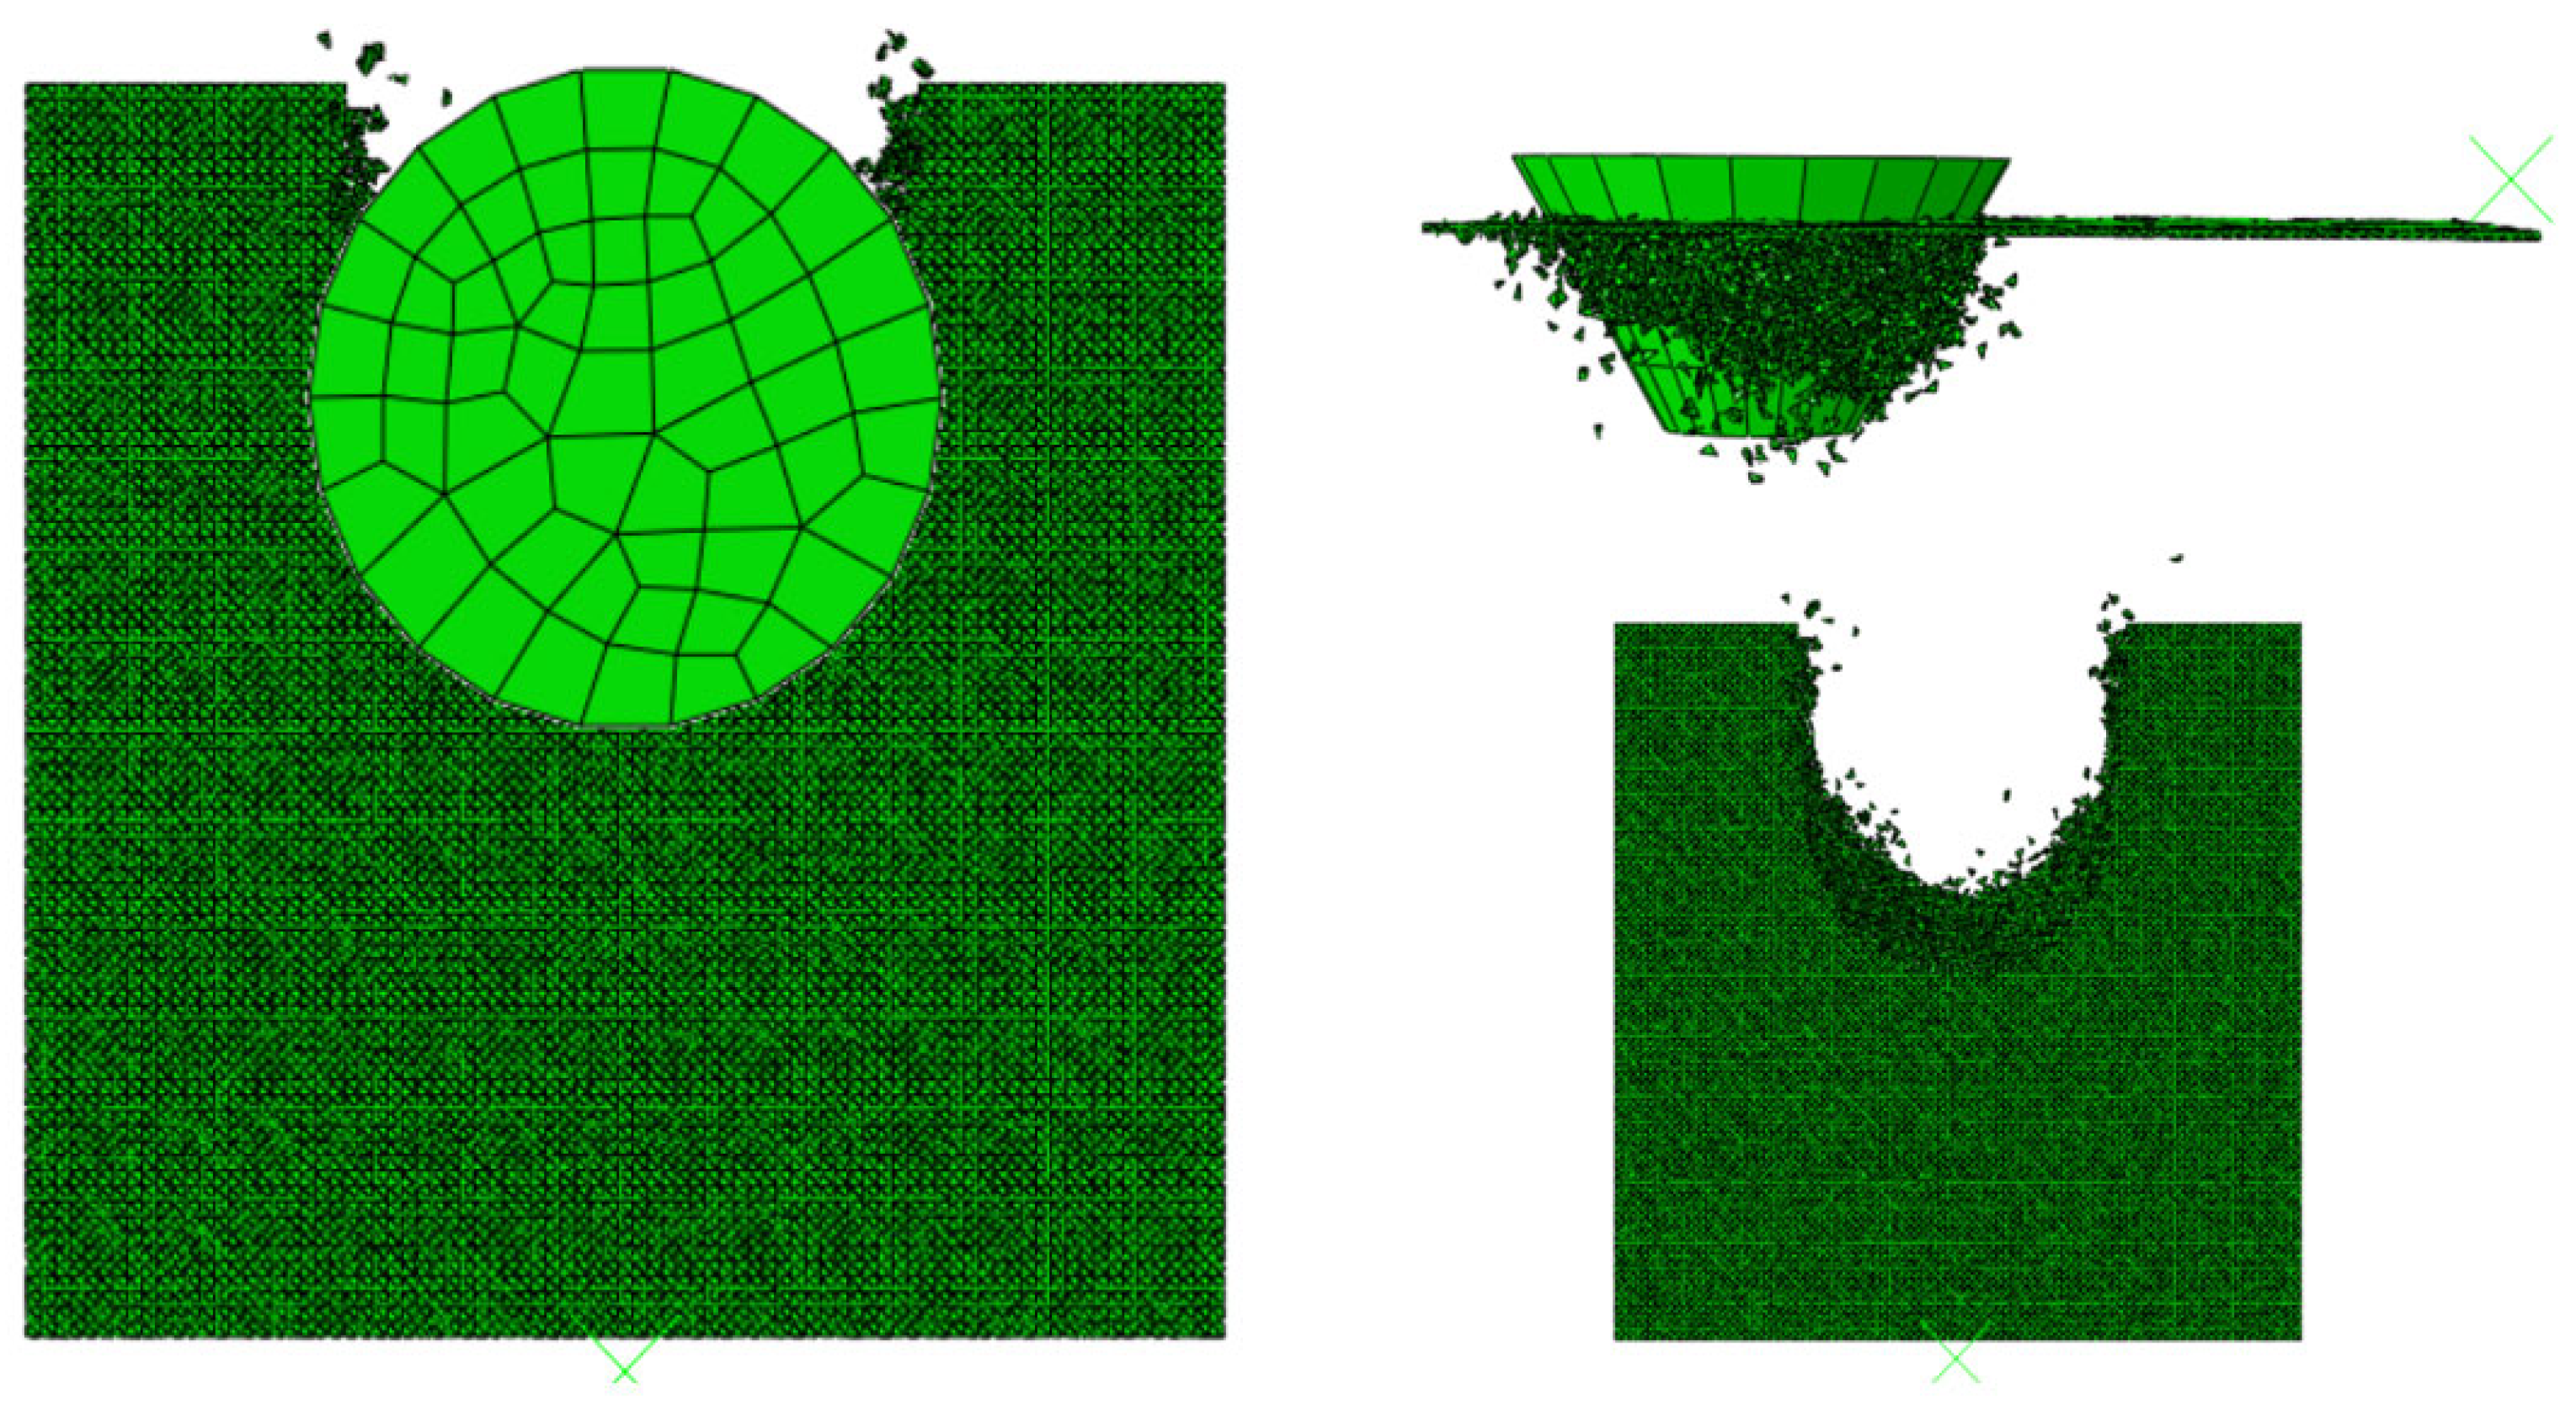
When sea ice collides with structures, the cohesive elements separate under the applied force. When they reach the damage threshold, they fail and are subsequently removed from the numerical model. The accumulation and propagation of failed cohesive elements along the interface results in macroscopic cracking during interactions between sea ice and structures, as shown in
Figure 1. During this process, some solid ice units break off from the whole body due to falling cohesive elements, causing collisions and forming broken ice. In numerical calculations, these broken pieces of ice can collide with structures again, resulting in secondary crushing.
In crack propagation calculation, the behavior of the cohesive element can be described by a traction–separation law [
30]. This law assumes that the cohesive element initially exhibits linear elastic behavior, which is followed by damage and separation as traction develops. There are three commonly used types of engineering tractor-separation curves: bilinear softening, exponential softening, and trapezoidal softening (see
Figure 2). For brittle materials like ice, linear traction–separation curves are often employed to represent the softening characteristics [
31]. The traction–separation curve consists of three components: the initial stress of the crack, fracture energy (i.e., the area under the curve and coordinate axis or the energy required to produce a unit surface), and curve shape (i.e., softening characteristics).
3. Validation of the Cohesive Element Method
3.1. Hamburg Ship Modeling Pool (HSVA) Ice-Breaking Experiment
This section compares the simulation results of CEM with the experimental findings of the HSVA ice-breaking experiment [
33]. The aim is to validate the reliable and feasible simulation of collisions between level ice and a conical structure using CEM.
The simulation was conducted in ABAQUS software, with a model of the conical ice-breaking device built based on the dimensions mentioned in reference [
33]. Material parameters for the device are presented in
Table 1. The simulation represents the interaction between an ice sheet and a stationary conical ice-breaking structure at a constant speed of 1.202 m/s. In order to consider the boundary effects, we incorporate the elastic beam theory proposed by Qissab [
34]. The boundary length of
can be determined using the following formula:
In the equation,
is the characteristic coefficient,
is the bending rigidity,
is the density of water,
is the gravitational acceleration and
is the effective contact width. Based on the calculation formula, the influence of ice sheet length shrinking to more than
on the solution is relatively insignificant. To optimize computational efficiency, a
ice sheet is employed in this simulation. The simulation results are stable when the interval of the cohesive elements distribution is about two times the ice thickness [
35]. In this simulation experiment, the ice thickness is 0.33 m, and the grid is chosen to be divided by 0.6 m intervals.
Figure 3 illustrates the interaction between the cone and the ice sheet.
3.2. Sea-Ice Model Parameters
To account for the random occurrence of cracks caused by ice–structure collisions, the tetrahedral elements with irregular cohesive element interfaces are employed in a sea-ice model. The material parameters in the model are provided in
Table 2, derived from previous studies [
35,
36,
37].
3.3. Contact Setting
The penalty function method is employed to ensure an accurate representation of friction in contact attributes [
38]. This approach employs a tangential friction coefficient of 0.2 for establishing frictional forces and enforces hard contact for normal forces. During the simulation, certain ice solid units that undergo brittle damage upon contacting the structure are removed from the model.
Apart from the collision surface with the cone, horizontal constraints are applied in the x direction on the other three sides of the sea ice. In considering the collision process between the ice sheet and cone, besides accounting for the material properties of the ice sheet itself, buoyancy and gravity effects are incorporated using ABAQUS’ VDLOAD subroutine [
39].
3.4. Verification Results and Discussion
Figure 3 illustrates the bending damage and accumulation of ice fragments resulting from the collision between ice sheets and cones, simulated using CEM. As the ice sheets interact with the cone structure, a cyclic process of climbing, bending, breaking, and subsequent climbing is observed. This continuous cycle causes fluctuations in the ice load, resulting in a twisted shape in the time–history curve shown in
Figure 4a.
CEM accurately approximates the average ice force as 105.7 kN, as presented in
Table 3, compared to the measured average ice force of 111.9 kN, with a difference of 5.54%. This indicates that CEM closely approximates the actual ice load. However,
Figure 4a reveals that the simulated ice load has higher peak values and fluctuation amplitudes than the measured data. This is likely due to the larger grid-scale used in the simulation, which represents the minimum fracture length considered when simulating collisions. When the simulated minimum fracture length exceeds the actual length, the peak values and fluctuation amplitudes of ice loads increase accordingly. However, the average ice load is not significantly affected.
Figure 4a and
Table 3 compare the simulation results with the ice-breaking experimental results from the Hamburg Ship Modeling Pool (HSVA) [
33]. The time–history curves of both the numerical simulation and experimental data are then subjected to the Fast Fourier Transform (FFT), producing the spectrum shown in
Figure 4b for the first 20 s. Notably, there is a favorable agreement between the numerical simulation and experiment in terms of result comparison and spectrum distribution. This validates the feasibility and reliability of using the CEM to simulate sea-ice collision processes.
4. Simulation of Ice-Induced Vibration of Jacket Platform
4.1. Numerical Model
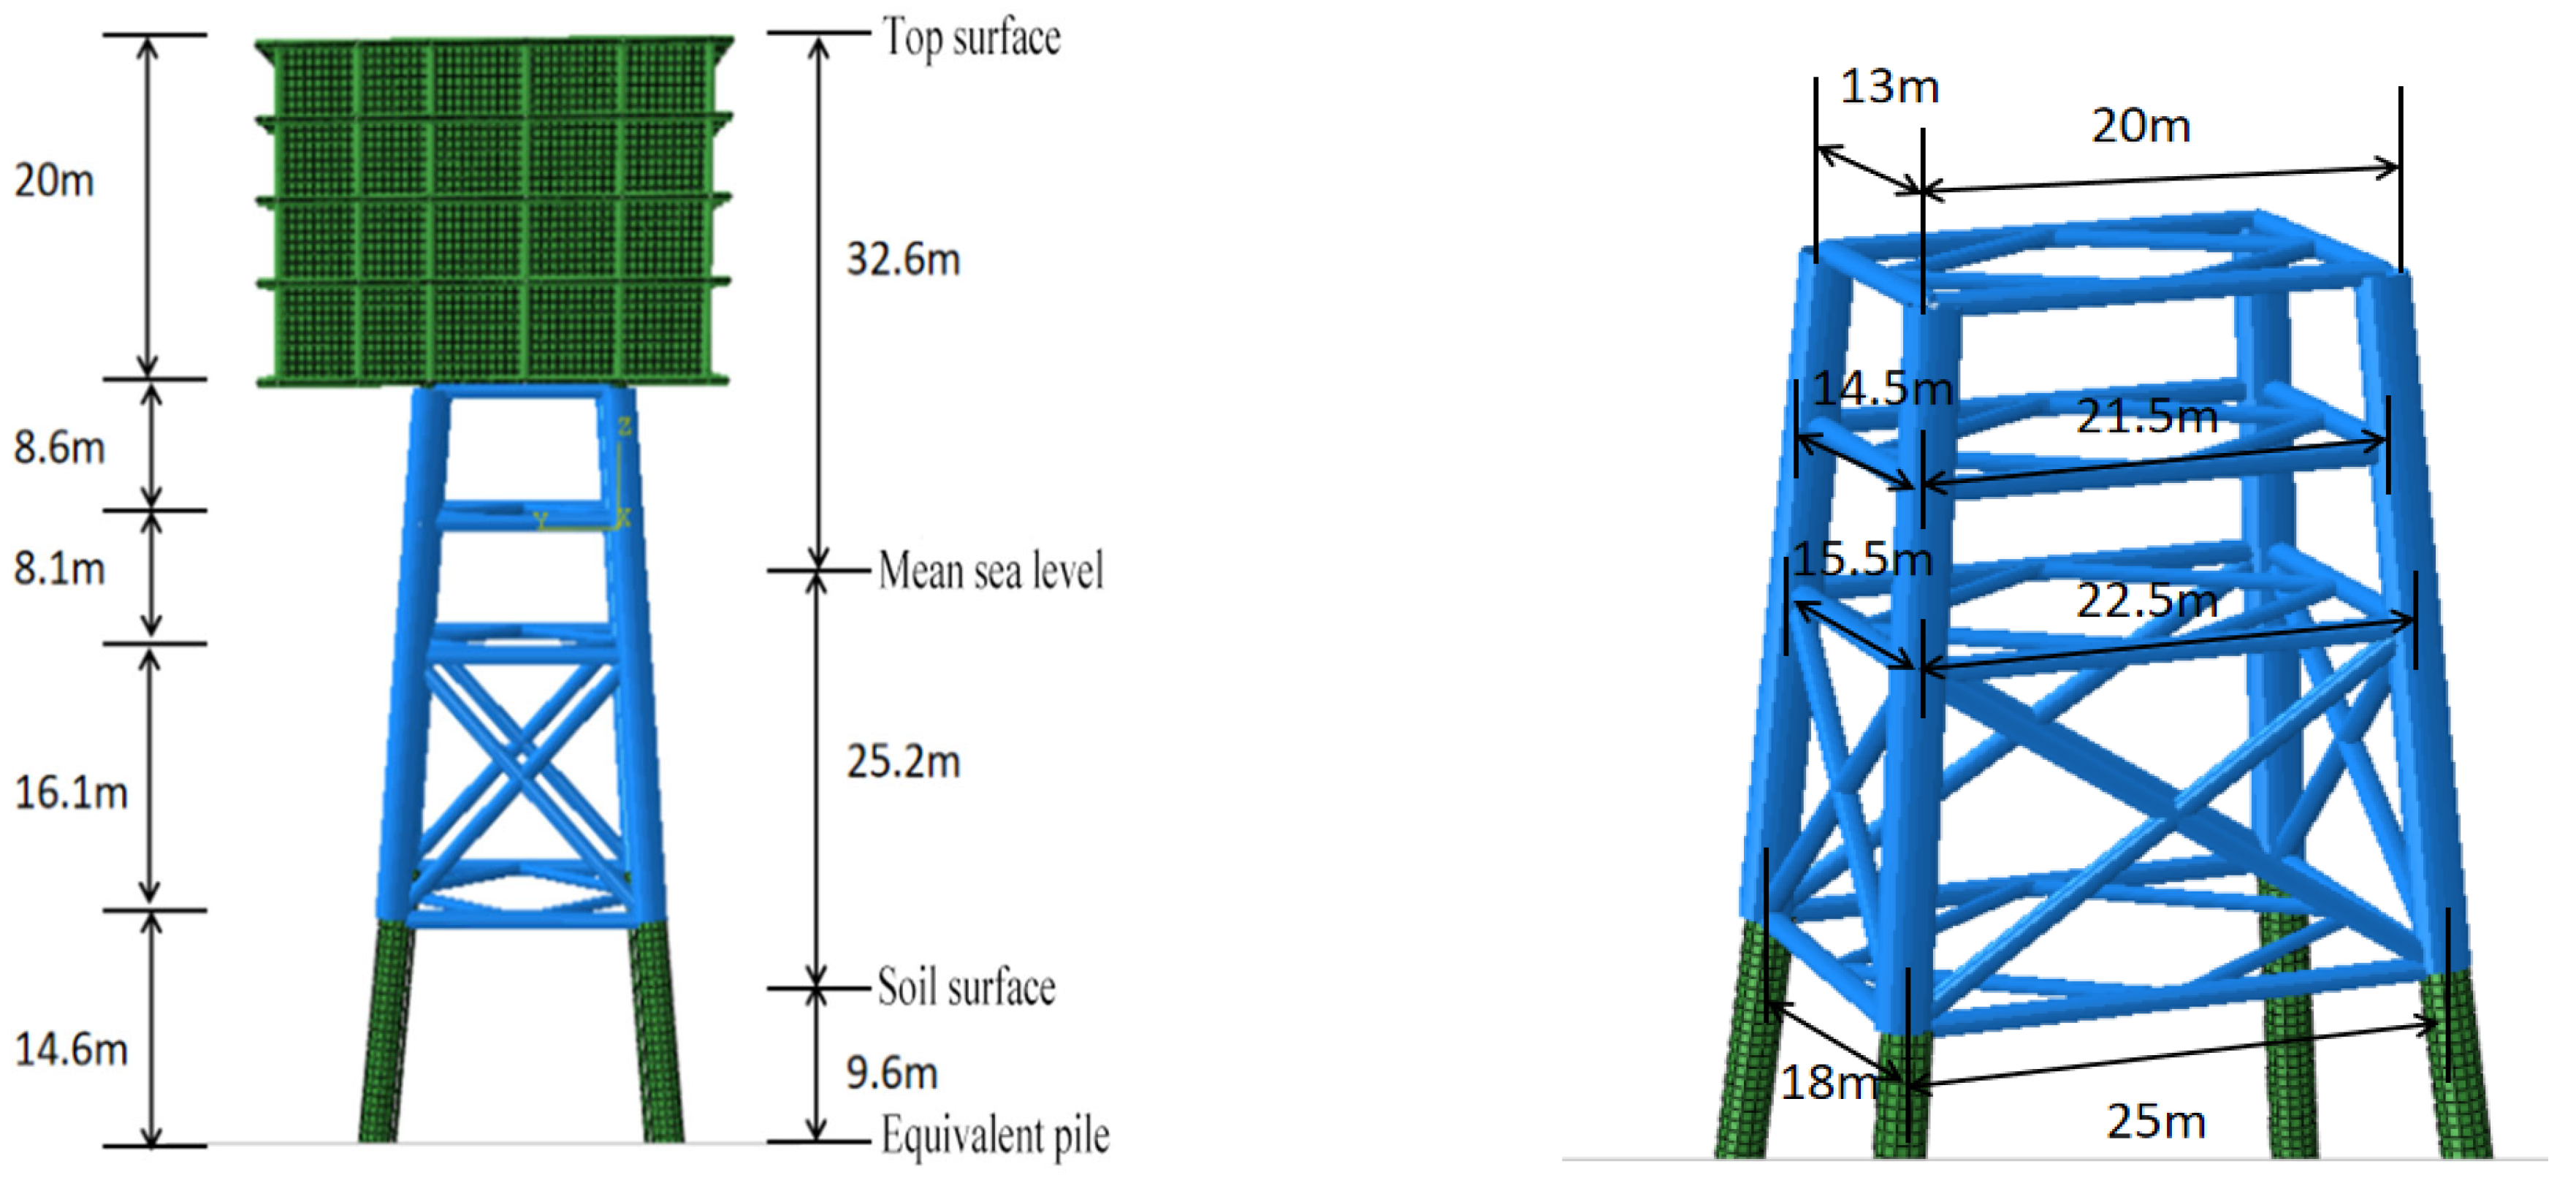
This section investigates ice-induced vibrations of the offshore jacket platform in the Bohai Sea. A finite element model (
Figure 5) is developed to simulate ice-jacket interaction with structural and material parameters listed in
Table 4 and
Table 5. To simplify the simulation of pile-soil-structure interactions, we have adopted the equivalent pile method to model the constraint of pile legs [
40]. The equivalent pile method involves making a section of a beam based on the pile-soil properties so that the beam end stiffness is equivalent to the pile top stiffness. This section of the beam is then added to the structural calculation model to replace the role of the pile so that the whole structure becomes a completely linear structure, thus avoiding the complex structure-pile iterative calculations [
41]. In this finite element model, based on the literature [
42], we rigidly fixed the pile diameter eight times below the mud surface to accurately simulate the pile-soil-structure interaction.
4.2. Analysis of Ice-Induced Vibration
In this section, the jacket platform of the marine booster station subjected to ice loads is analyzed, and the effects of varying ice velocity on the angles of the jacket platform are investigated.
Figure 5 is the schematic diagram of the marine booster station platform.
4.2.1. Effect of Ice Velocity on Ice-Induced Vibrations on the Platform
In accordance with the code Q/HSn3000-2002 [
43], the average ice velocity in China’s seas is approximately 0.5 m/s. In this study, sea ice with a thickness of 0.33 m was selected to investigate the random vibration characteristics. The Jacket platform structure without a protective device was subjected to impacts from ice loads with velocities of 0.3 m/s, 0.6 m/s, 0.9 m/s, and 1.2 m/s, respectively.
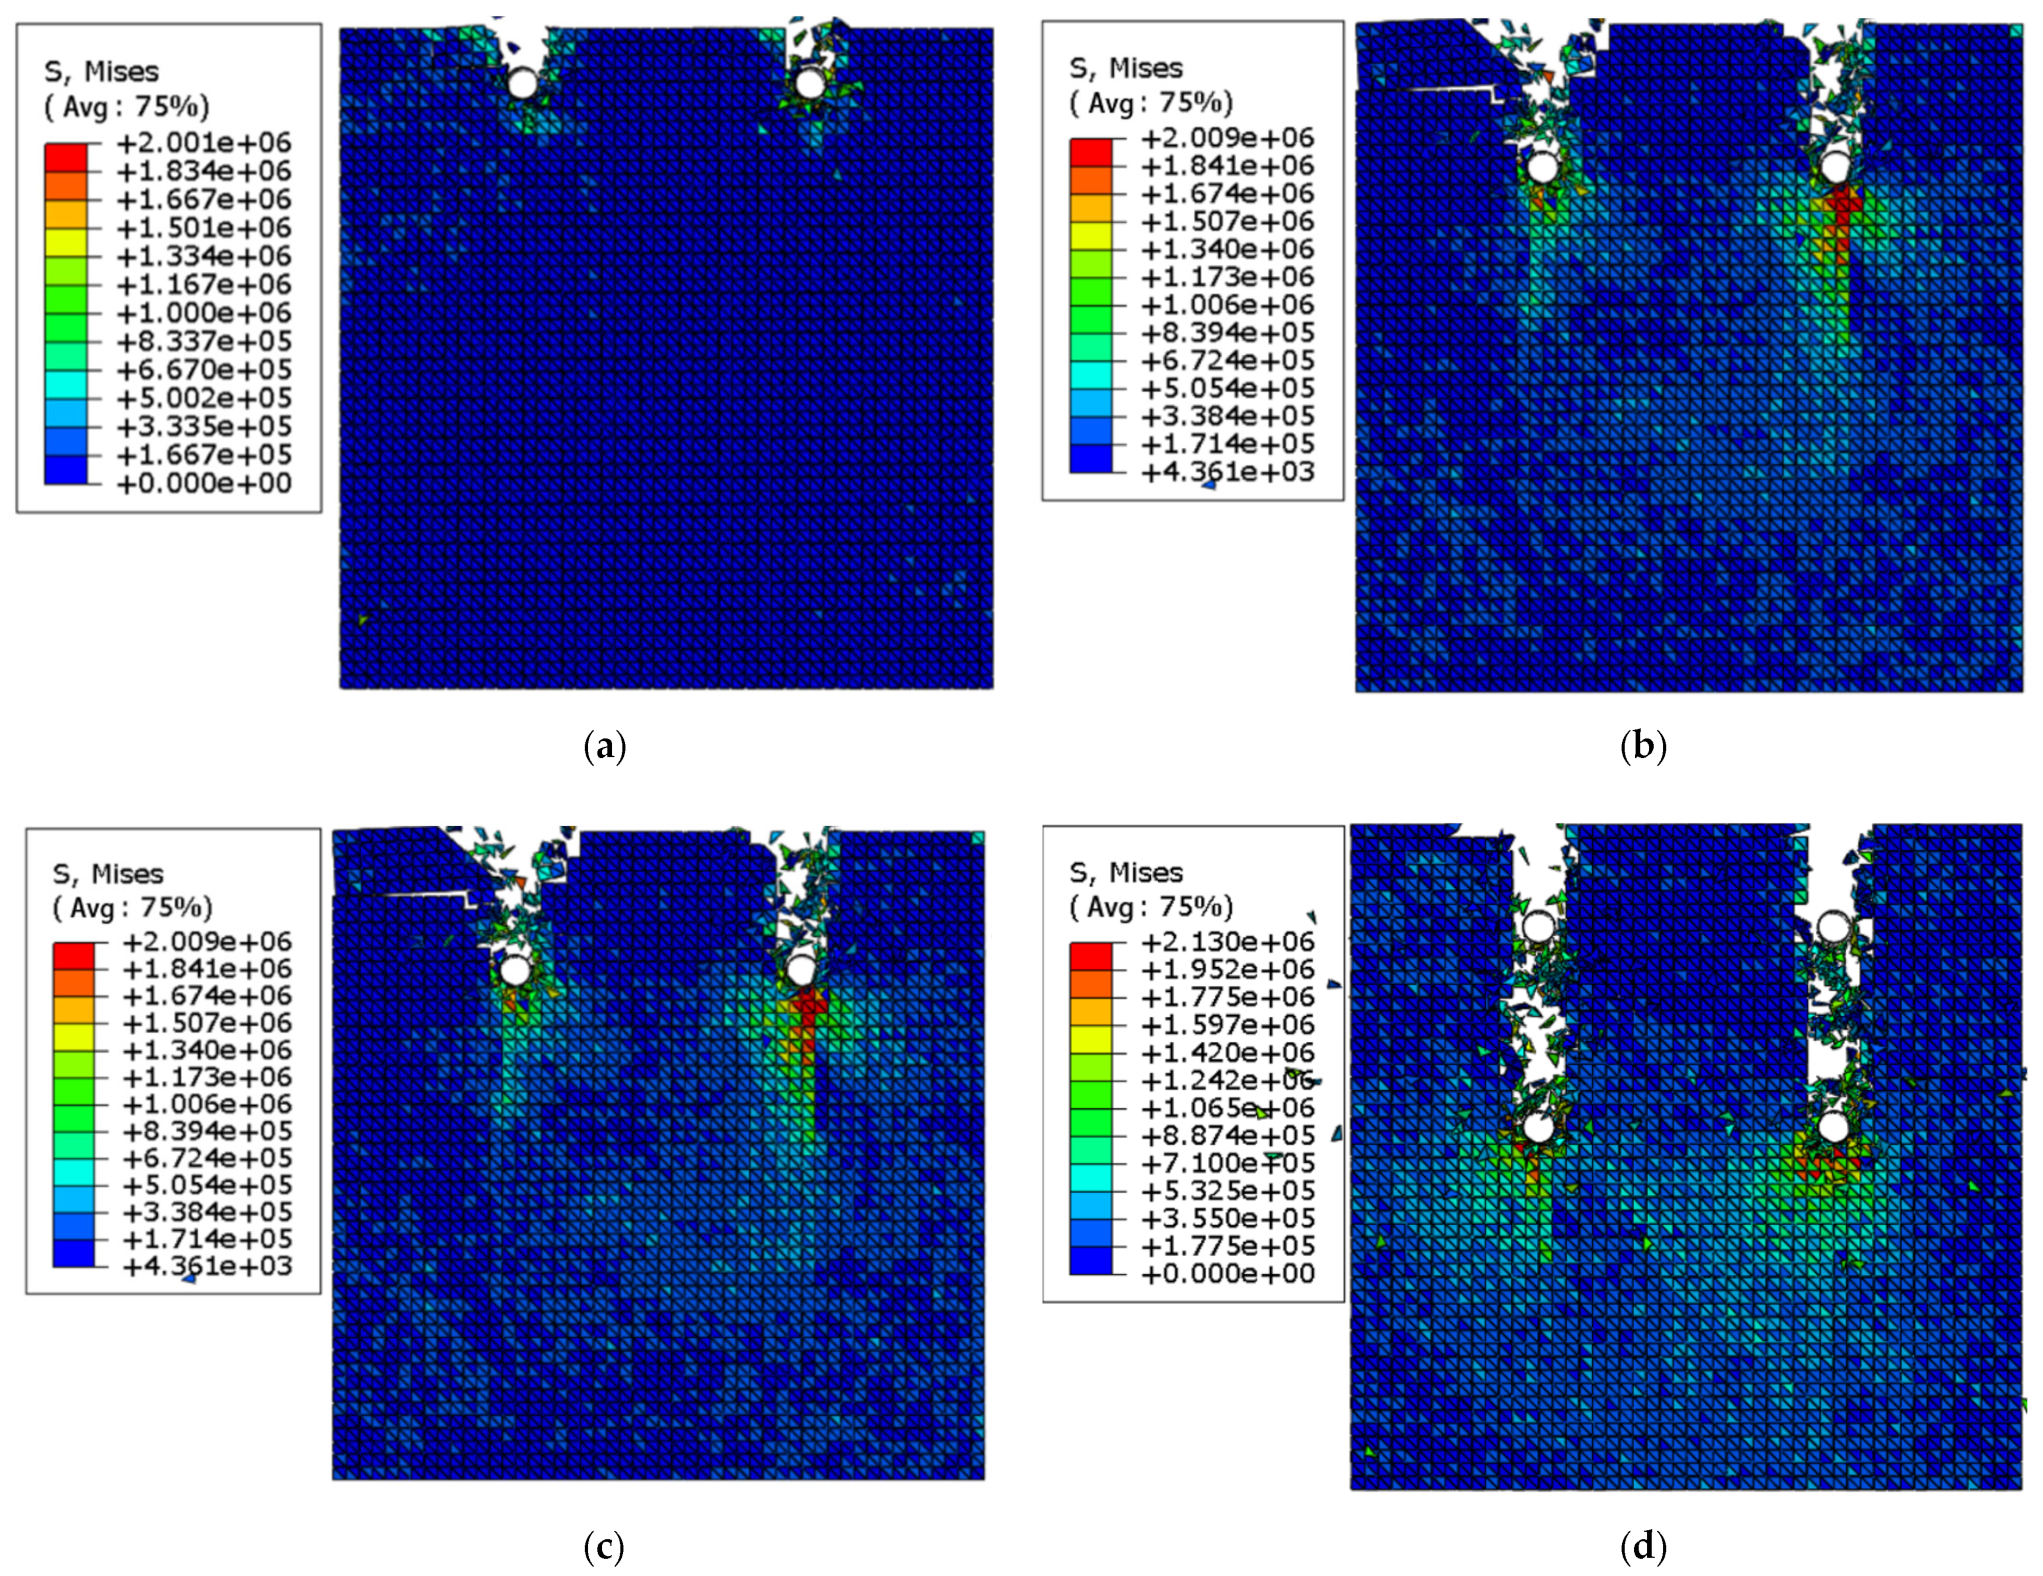
Figure 6 illustrates the squeezing and breaking process of sea ice as well as the time–history curve of ice load.
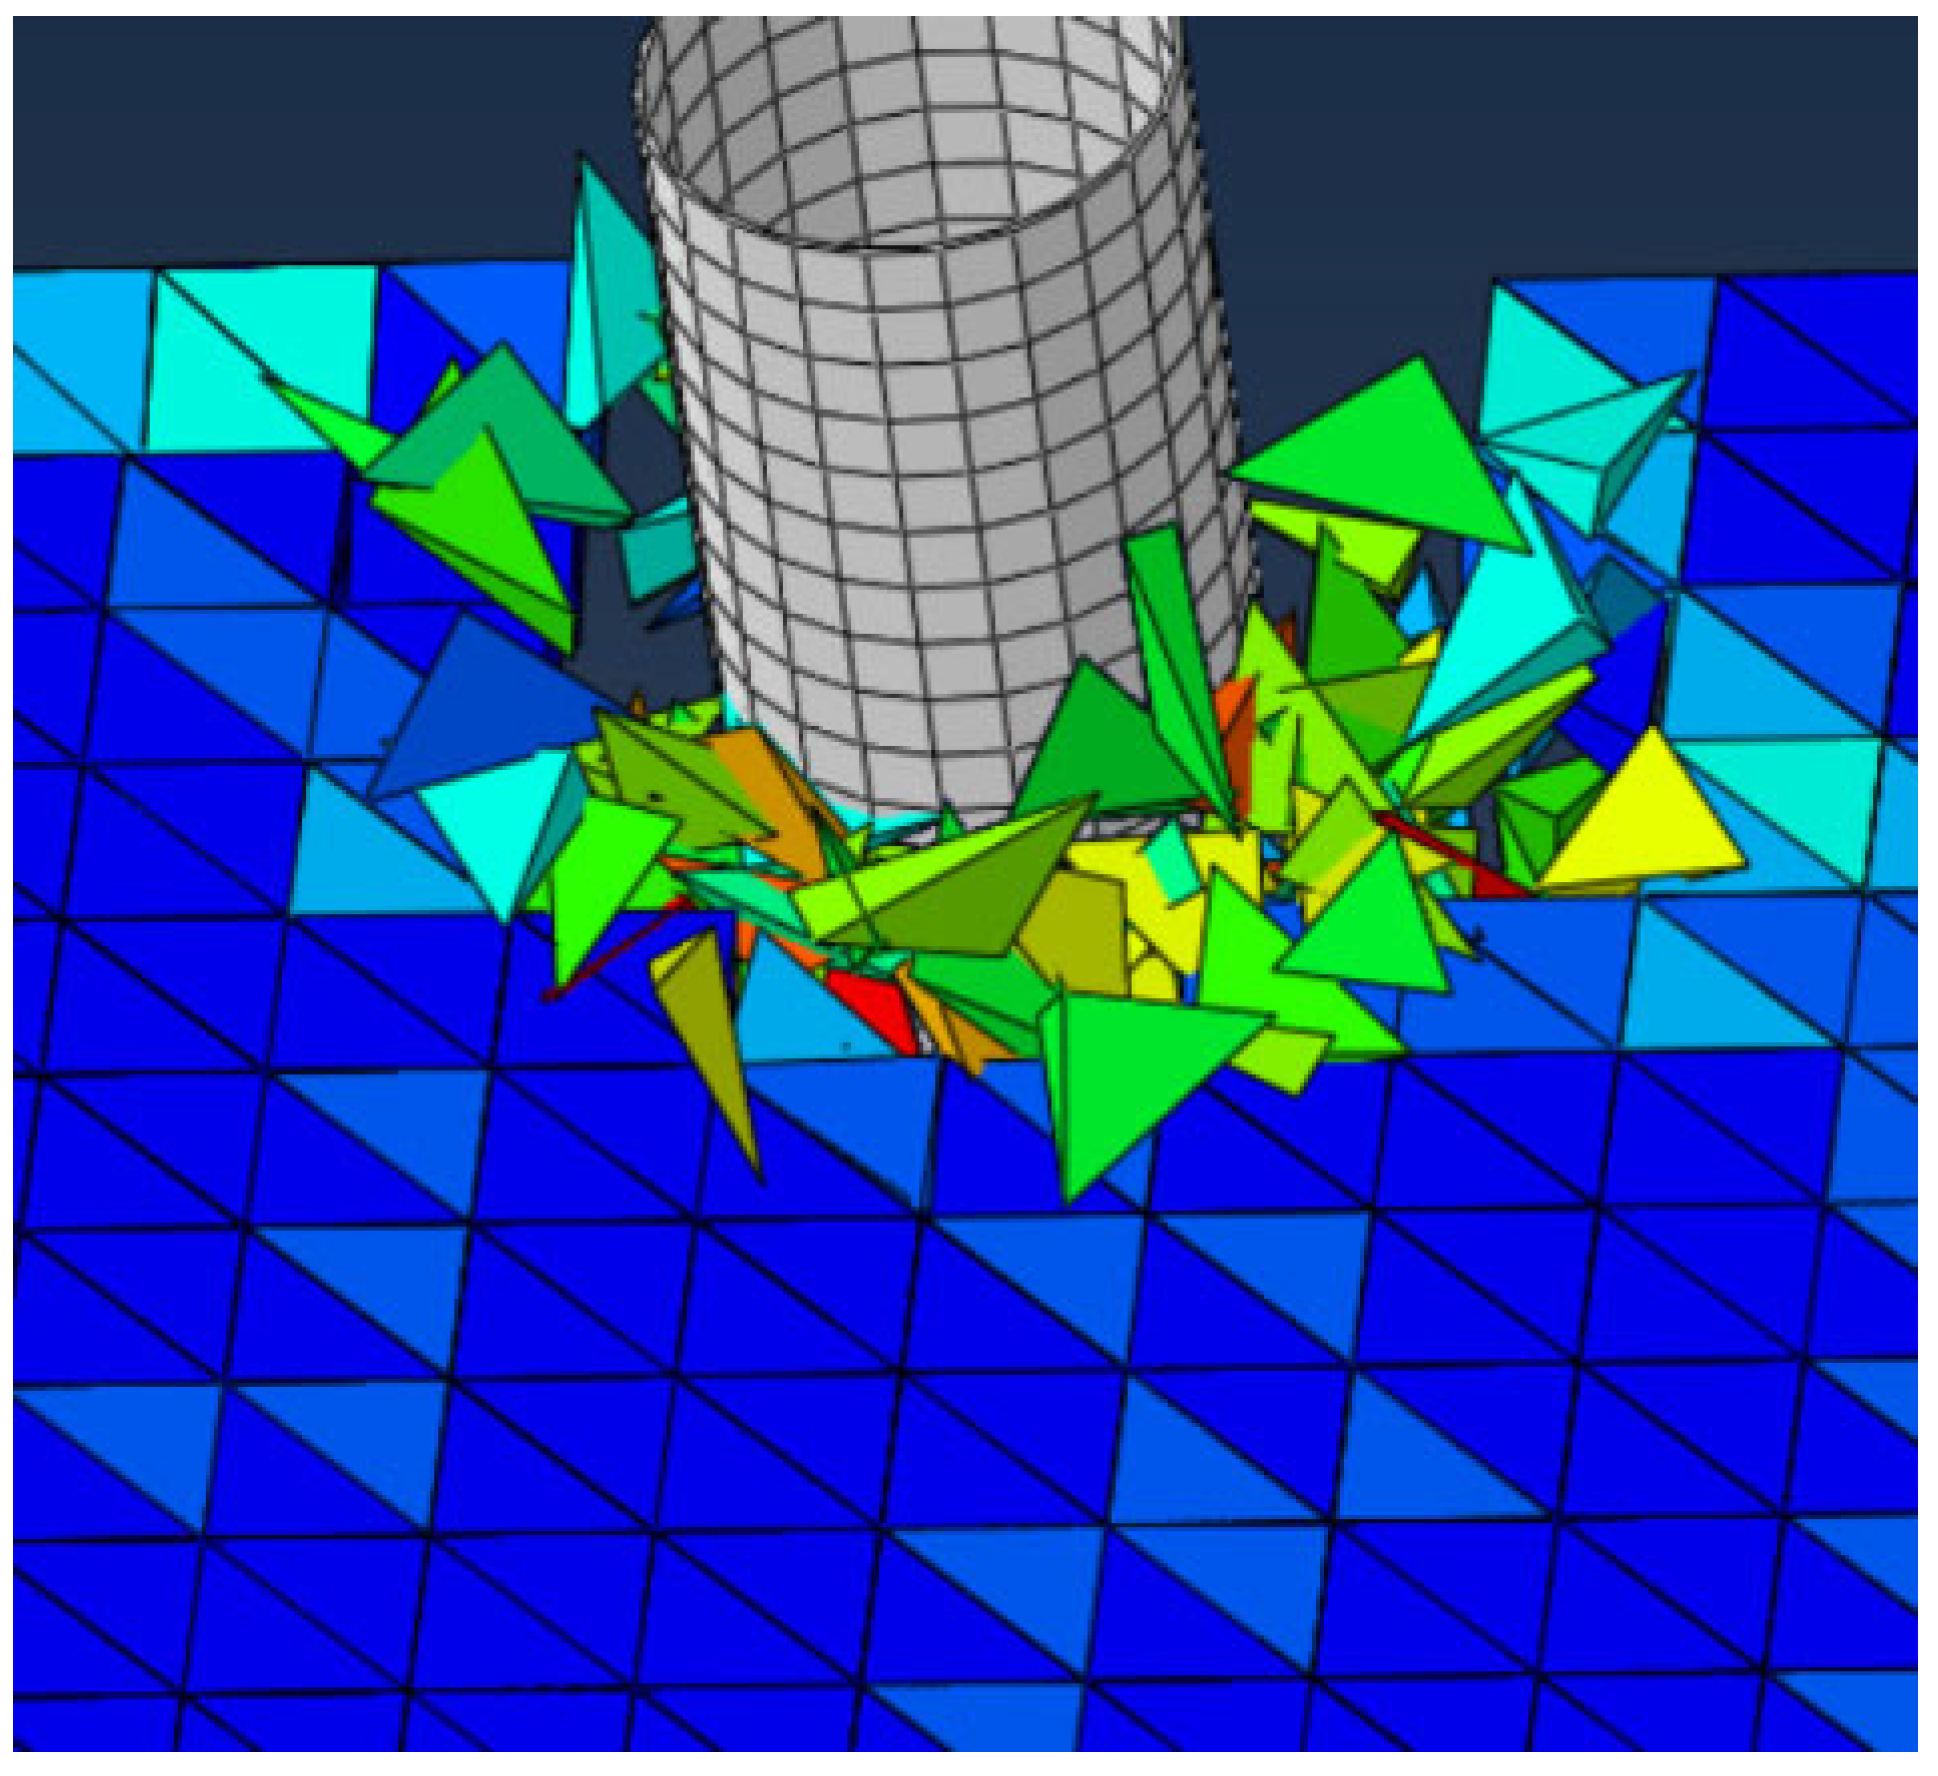
Figure 6 shows the simulation results of sea ice being crushed due to compression under varying ice velocities. The damage process of sea ice remains consistent with the distance traveled directly proportional to the speed of sea ice and an increase in the average width of pile breakage as ice speeds increase. Continuous brittle compression damage occurs upon collisions between the ice sheet and jacket platform, resulting in powder-like damage to the sea ice upon contact with structures mixed with larger pieces having diameters equal to that of the ice thickness. Broken sea ice is then extruded from contact surfaces, leading to sustained interaction between sea ice and structures, as shown in
Figure 7.
Analyzing the ice load time–history curves for different ice velocities (as shown in
Figure 8), it is observed that the curves gradually transit from sparse to dense as the ice velocity increases. During the simulation process using the CEM, collisions and extrusions between the ice mass and structure cause brittle damage to specific ice solid units. These damaged units are subsequently removed, creating a gap between the ice and the structure. Higher ice velocities result in shorter re-contact intervals between ice solid units and the structure, leading to denser ice load time–history curves. Furthermore, the brittle extrusion processes that cause fragmentation at the contact surface between the ice and structure, coupled with significant fluctuations in non-periodic ice loads, induce forced random vibrations within the structural system. These random vibrations arise due to the irregular forces exerted by the ice on the structure during the interaction process.
During the actual collision process, the sea ice can be fragmented into very small pieces by the structure. When the ice velocity is high, the sea ice can be in constant contact with the structure, and the crushing and squeezing ice force is always greater than zero. However, in the simulation using the cohesive element method, the minimum fragment size is considerably larger than the actual fragment size due to the exponential increase in computational resource requirements. In this simulation, the smallest fragment of sea ice is modeled as a tetrahedron with a short side length of 0.3 m, and a relatively large gap is formed after fragmentation occurs. In the simulation process, there are instances of brief separation between the sea ice and the structure, resulting in an ice force of zero, as shown in
Figure 8. These moments occur when the ice fragments are temporarily disengaged from the structure due to the dynamic interaction between them.
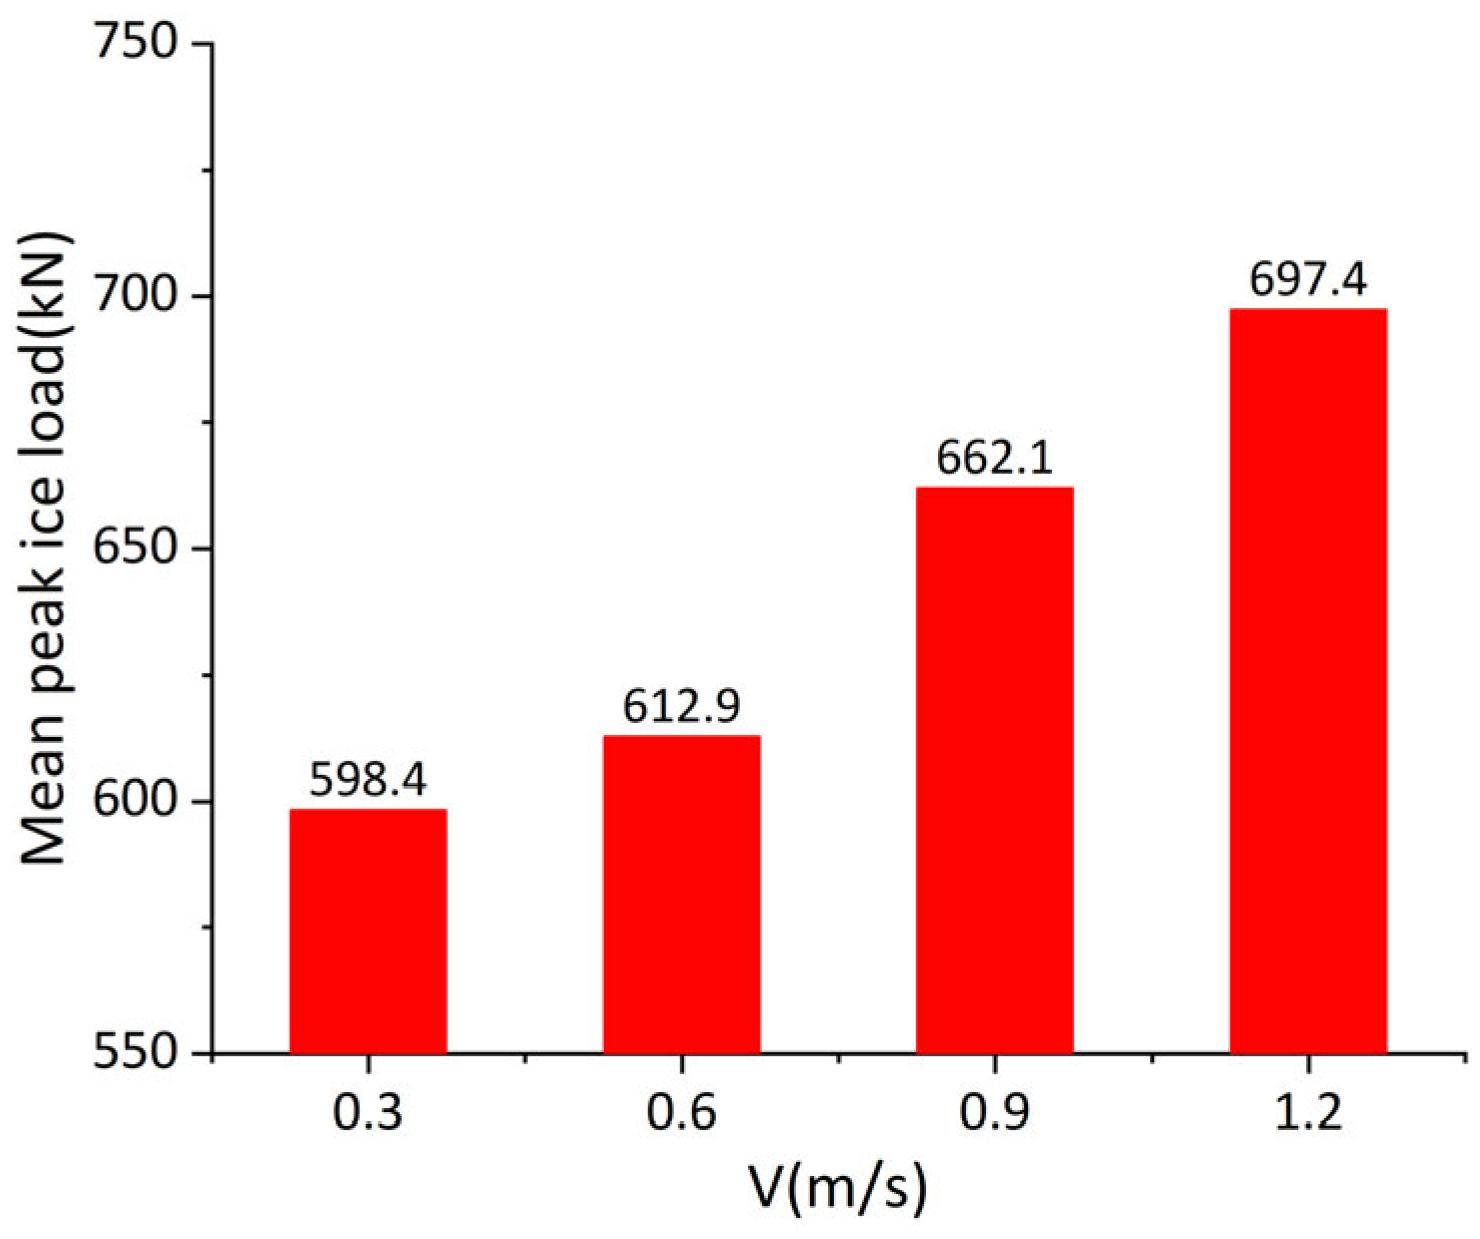
As shown in
Figure 9, the average peak value of the horizontal ice load on the structure increases as the ice velocity increases. Specifically, when comparing sea ice with an ice velocity of 1.2 m/s to sea ice with an ice velocity of 0.3 m/s, the average peak value of the horizontal ice load is found to be 16.5% higher. This indicates that higher ice velocities result in greater horizontal ice forces exerted on the structure during the interaction process.
Table 6 shows the peak standard deviation of horizontal ice load at different ice velocities.
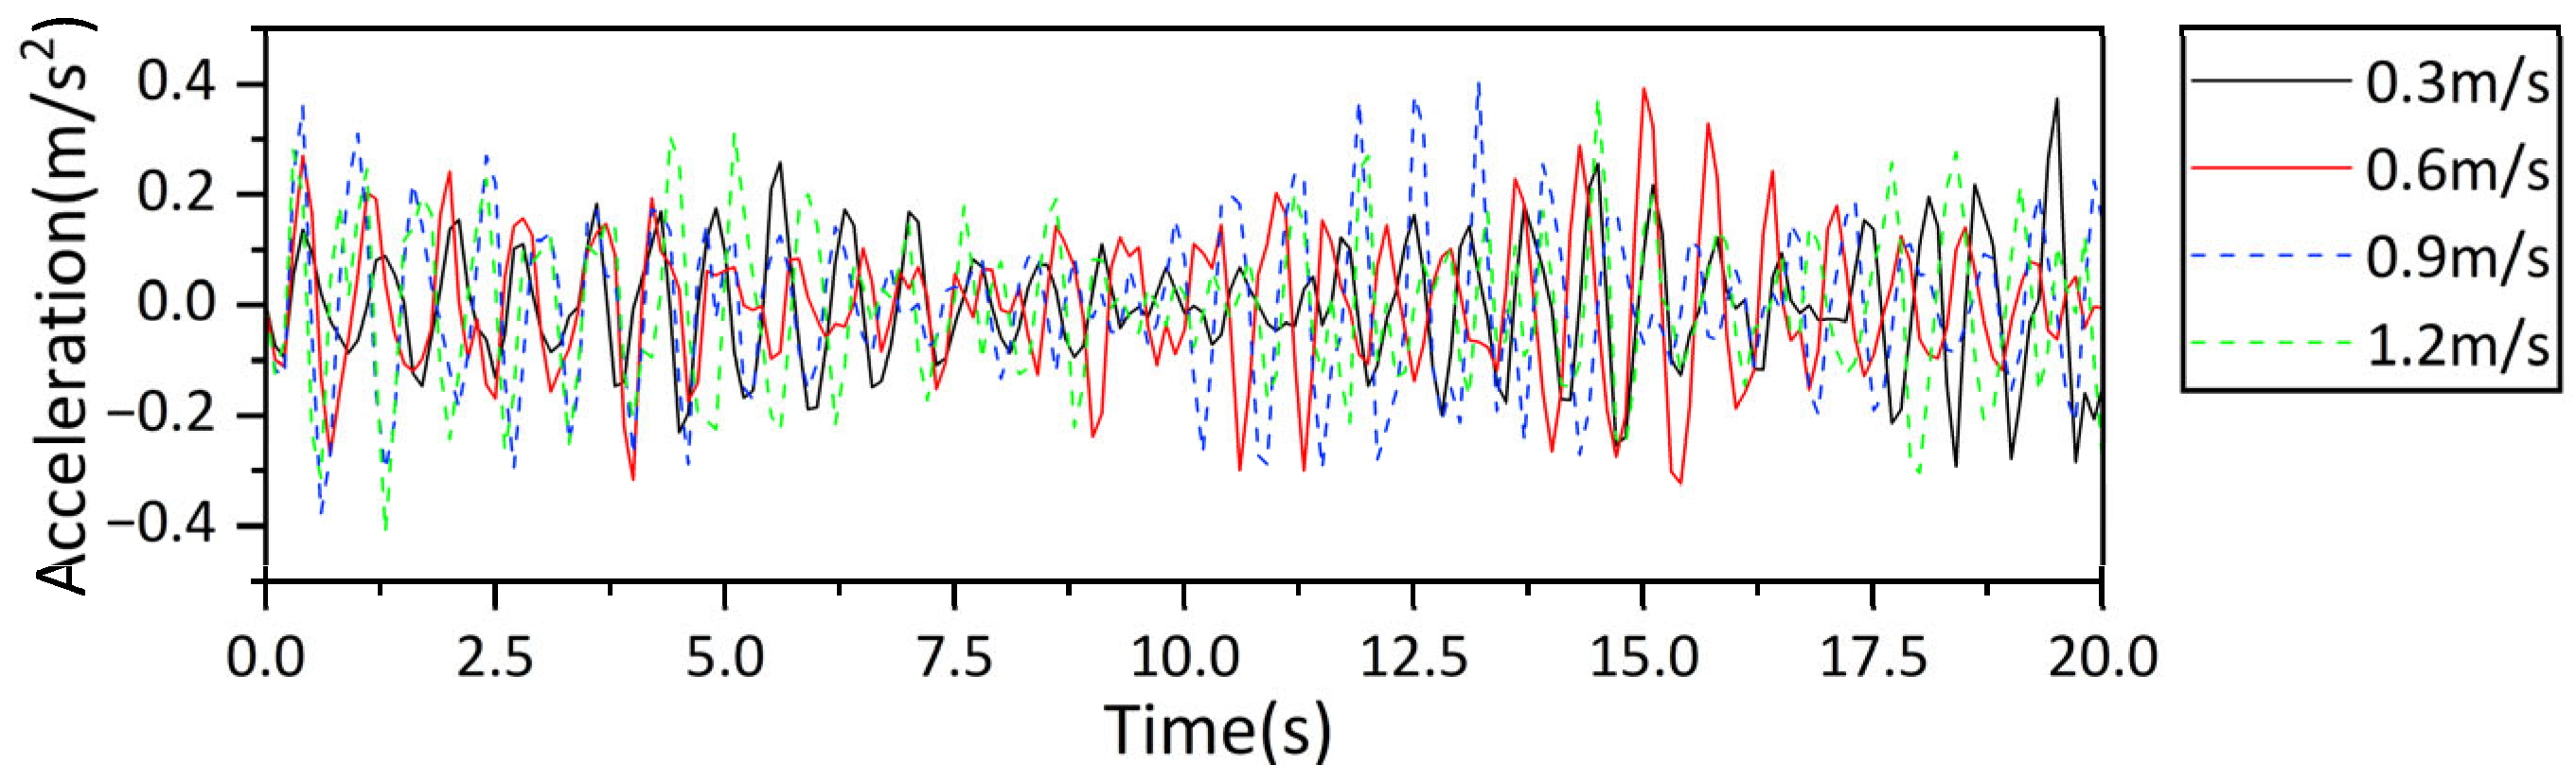
Figure 10 illustrates the horizontal acceleration of the top deck of the platform under different ice velocities, showing a positive correlation between the maximum horizontal acceleration and ice velocity.
Table 7 further demonstrates that as the ice velocity increases, there is a gradual increase in the maximum horizontal acceleration of the deck. The maximum horizontal acceleration at an ice speed of 1.2 m/s is 10.5% greater than that at an ice speed of 0.3 m/s, and the ice speed of the former is four times that of the latter. Considering findings from previous experimental measurements [
27], it can be concluded that under conditions of fast ice velocity, sea-ice velocity is the least sensitive to the vibration caused by the offshore platform.
4.2.2. The Influence of Ice Directions on Ice-Induced Vibrations on the Platform
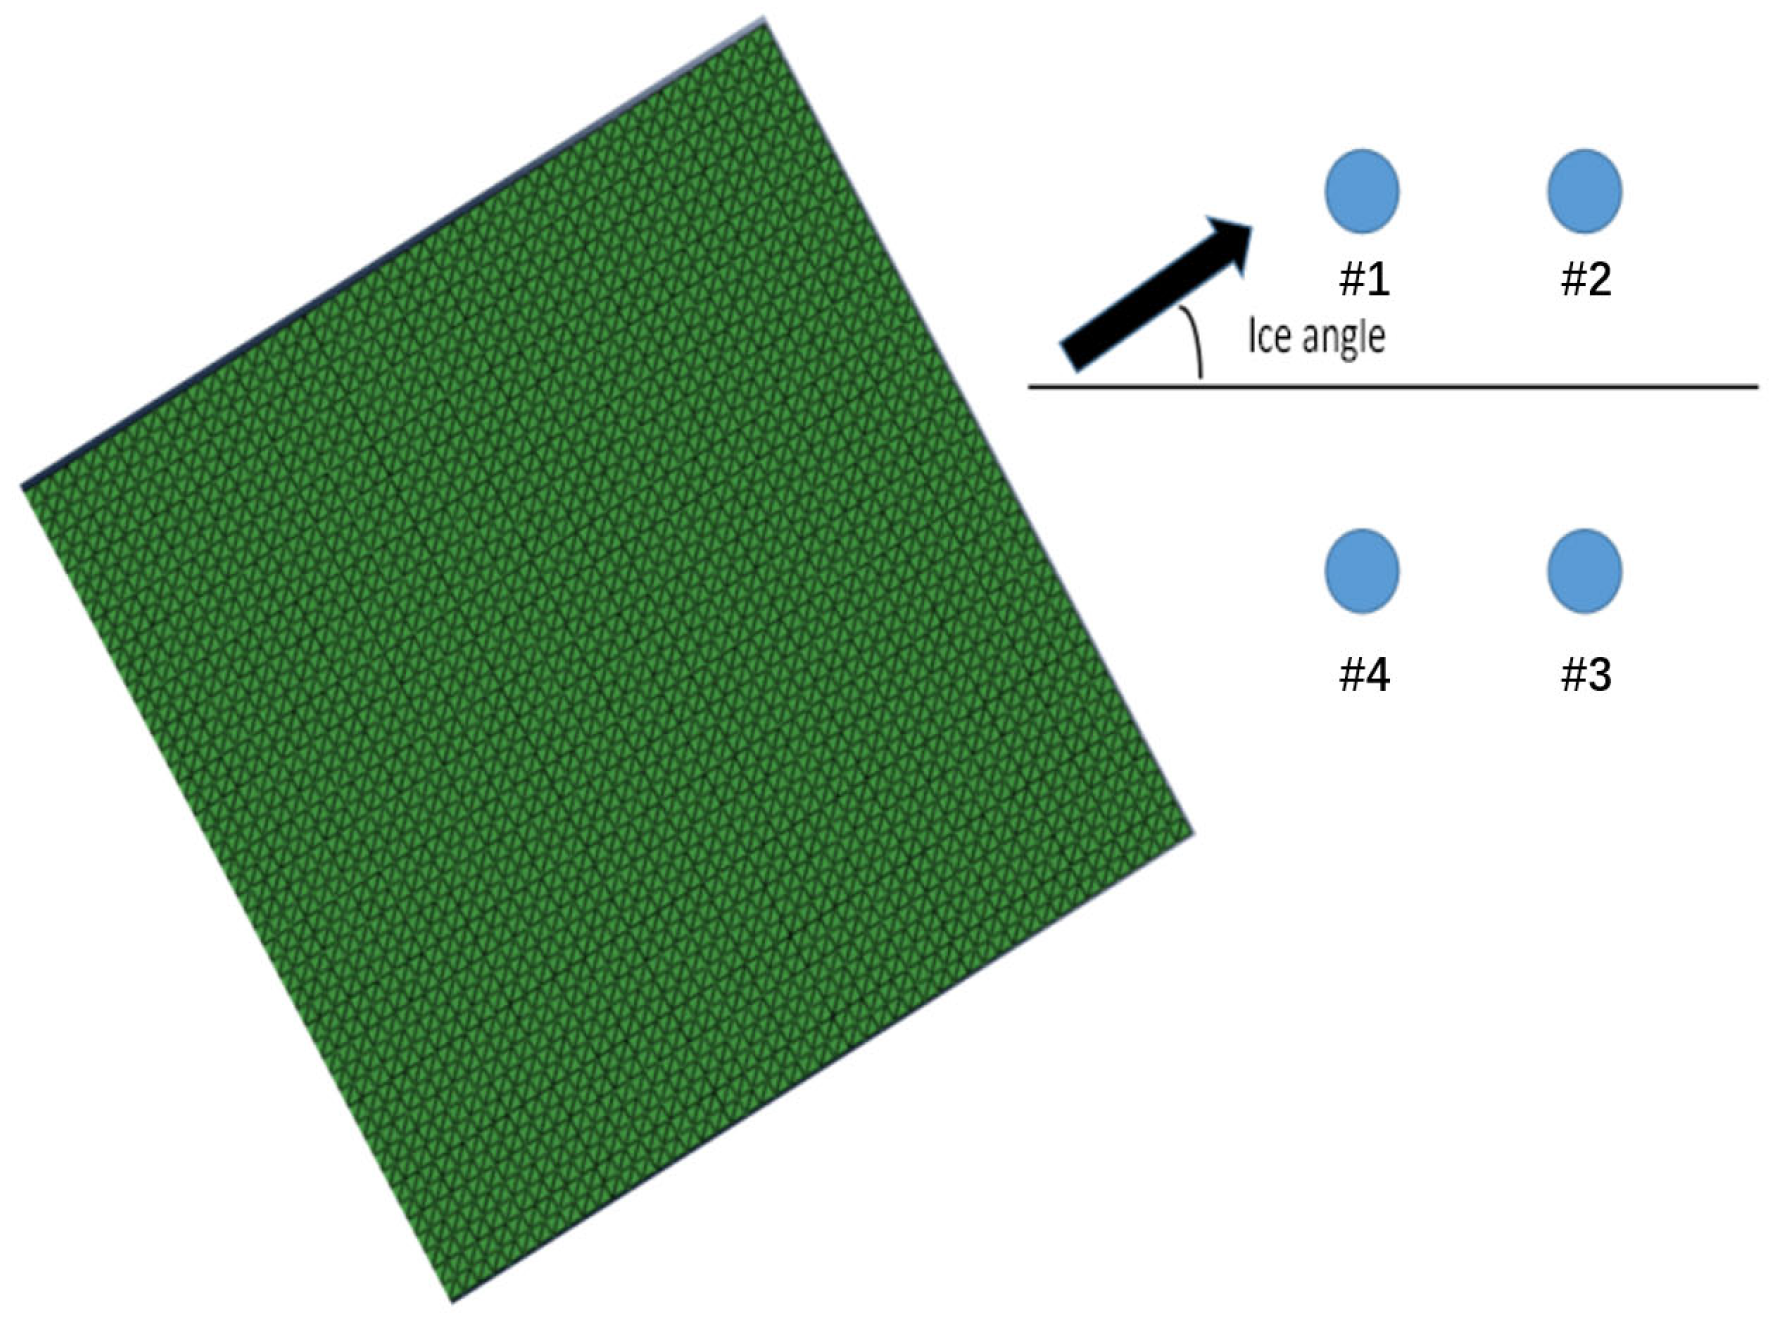
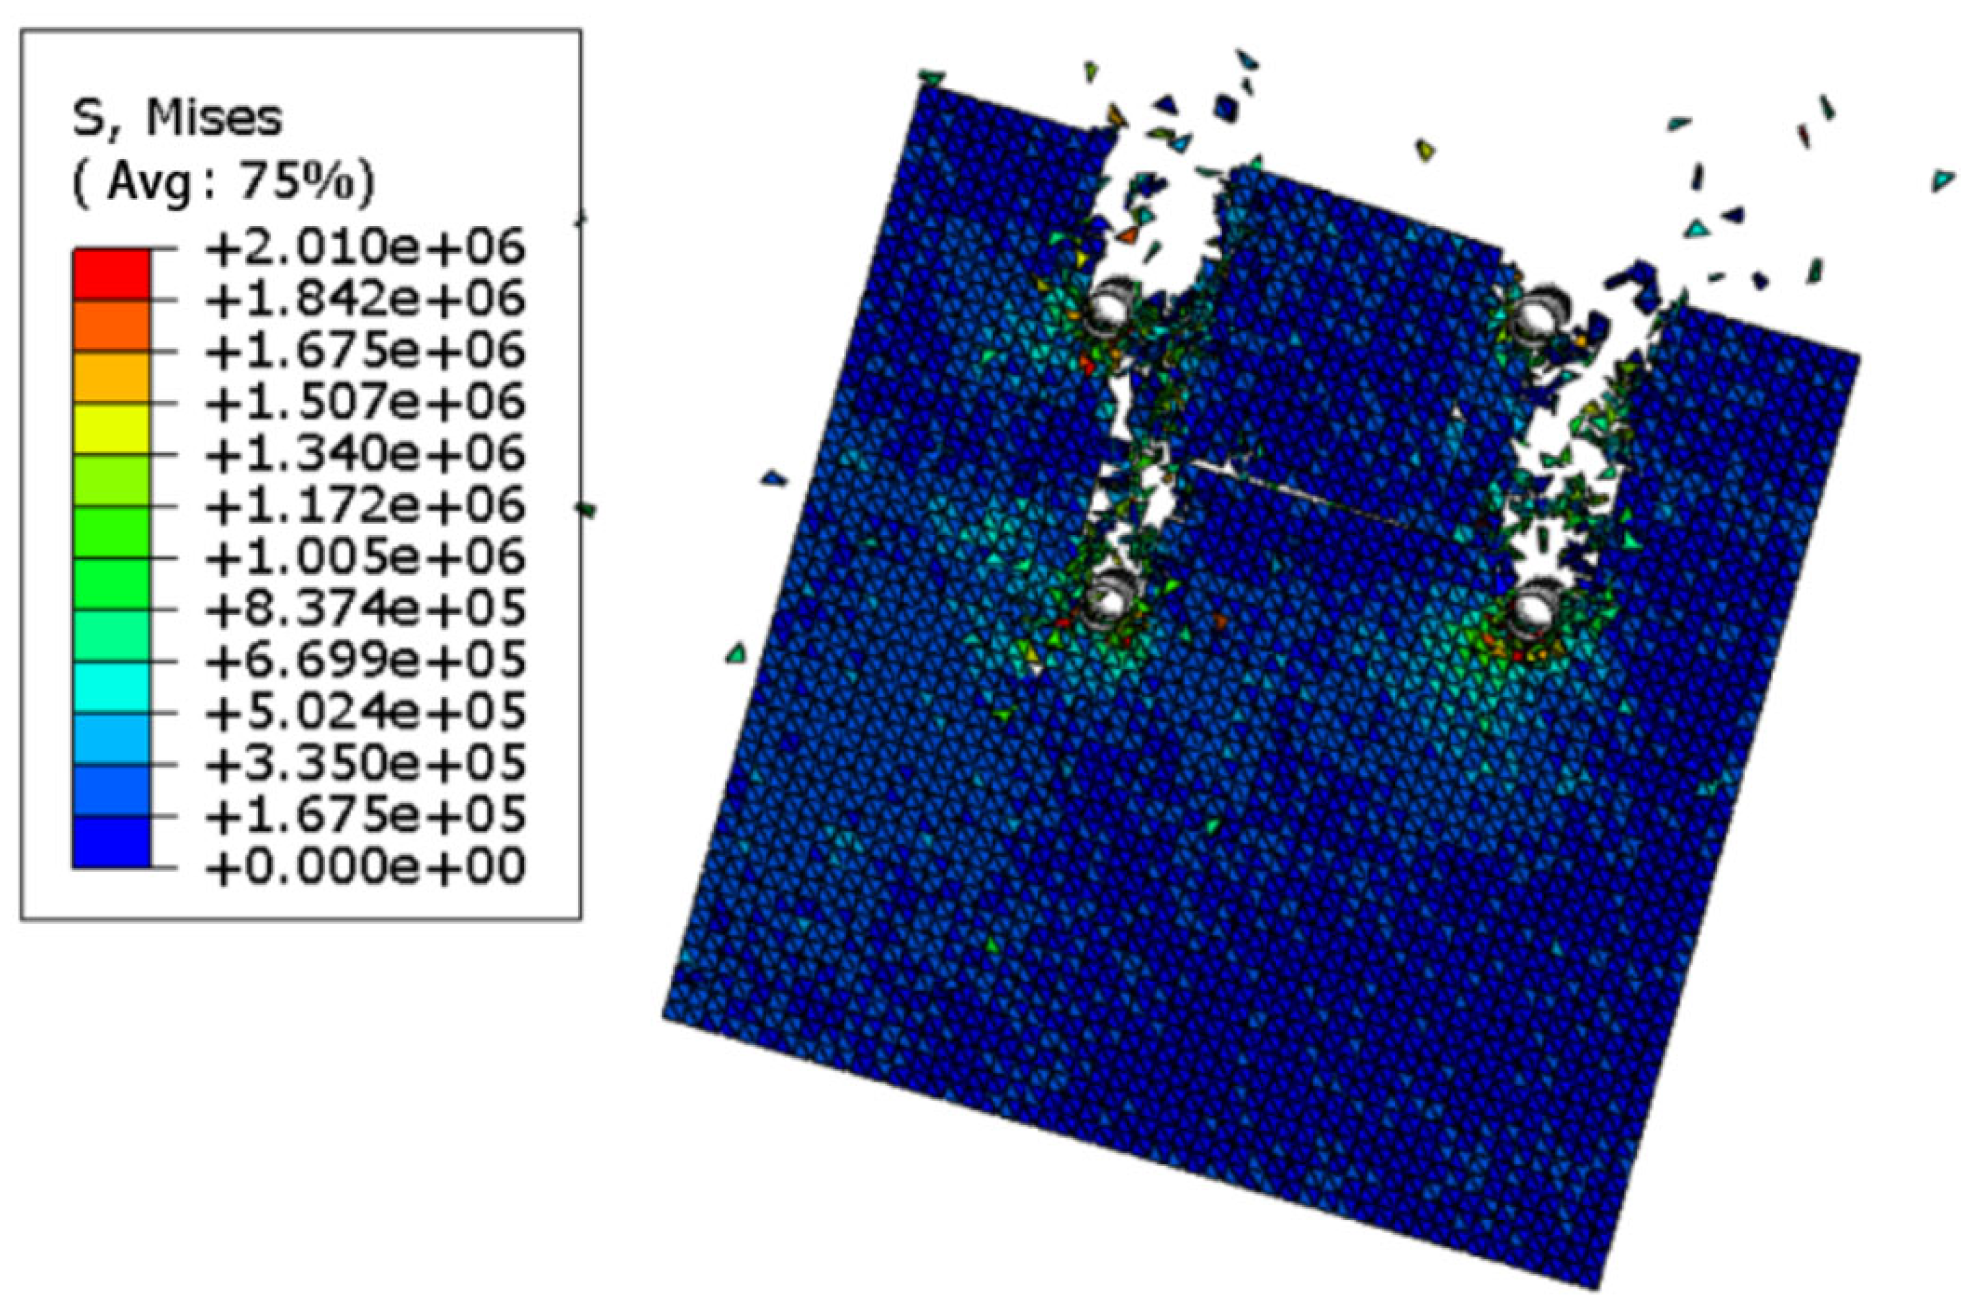
Figure 11 presents a schematic diagram illustrating the interaction between sea ice and the four-pile jacket platform, specifically focusing on the impact of various ice angles on ice-induced vibrations. The piles are numbered clockwise, starting from pile #1, which is located in the lower left corner.
The shielding effect occurs when the interaction between sea ice and the front pile leg reduces the ice load on the back pile leg within the broken track range.
Figure 12 shows this effect with an ice direction of 15°. Pile #4 and pile #1 exhibit a shielding effect on piles #3 and #2, resulting in different ice load durations for each pile leg due to varying trajectories under different ice directions. The dynamic response of the jacket platform varies significantly depending on the ice direction, considering the combined influence of the shielding effect and the inherent structural characteristics of the jacket itself.
The calculated pile ice load is applied to the jacket, yielding the acceleration time–history curve of the deck. Subsequently, the horizontal acceleration in both x and y directions is processed to derive the absolute horizontal acceleration time–history curve of the deck.
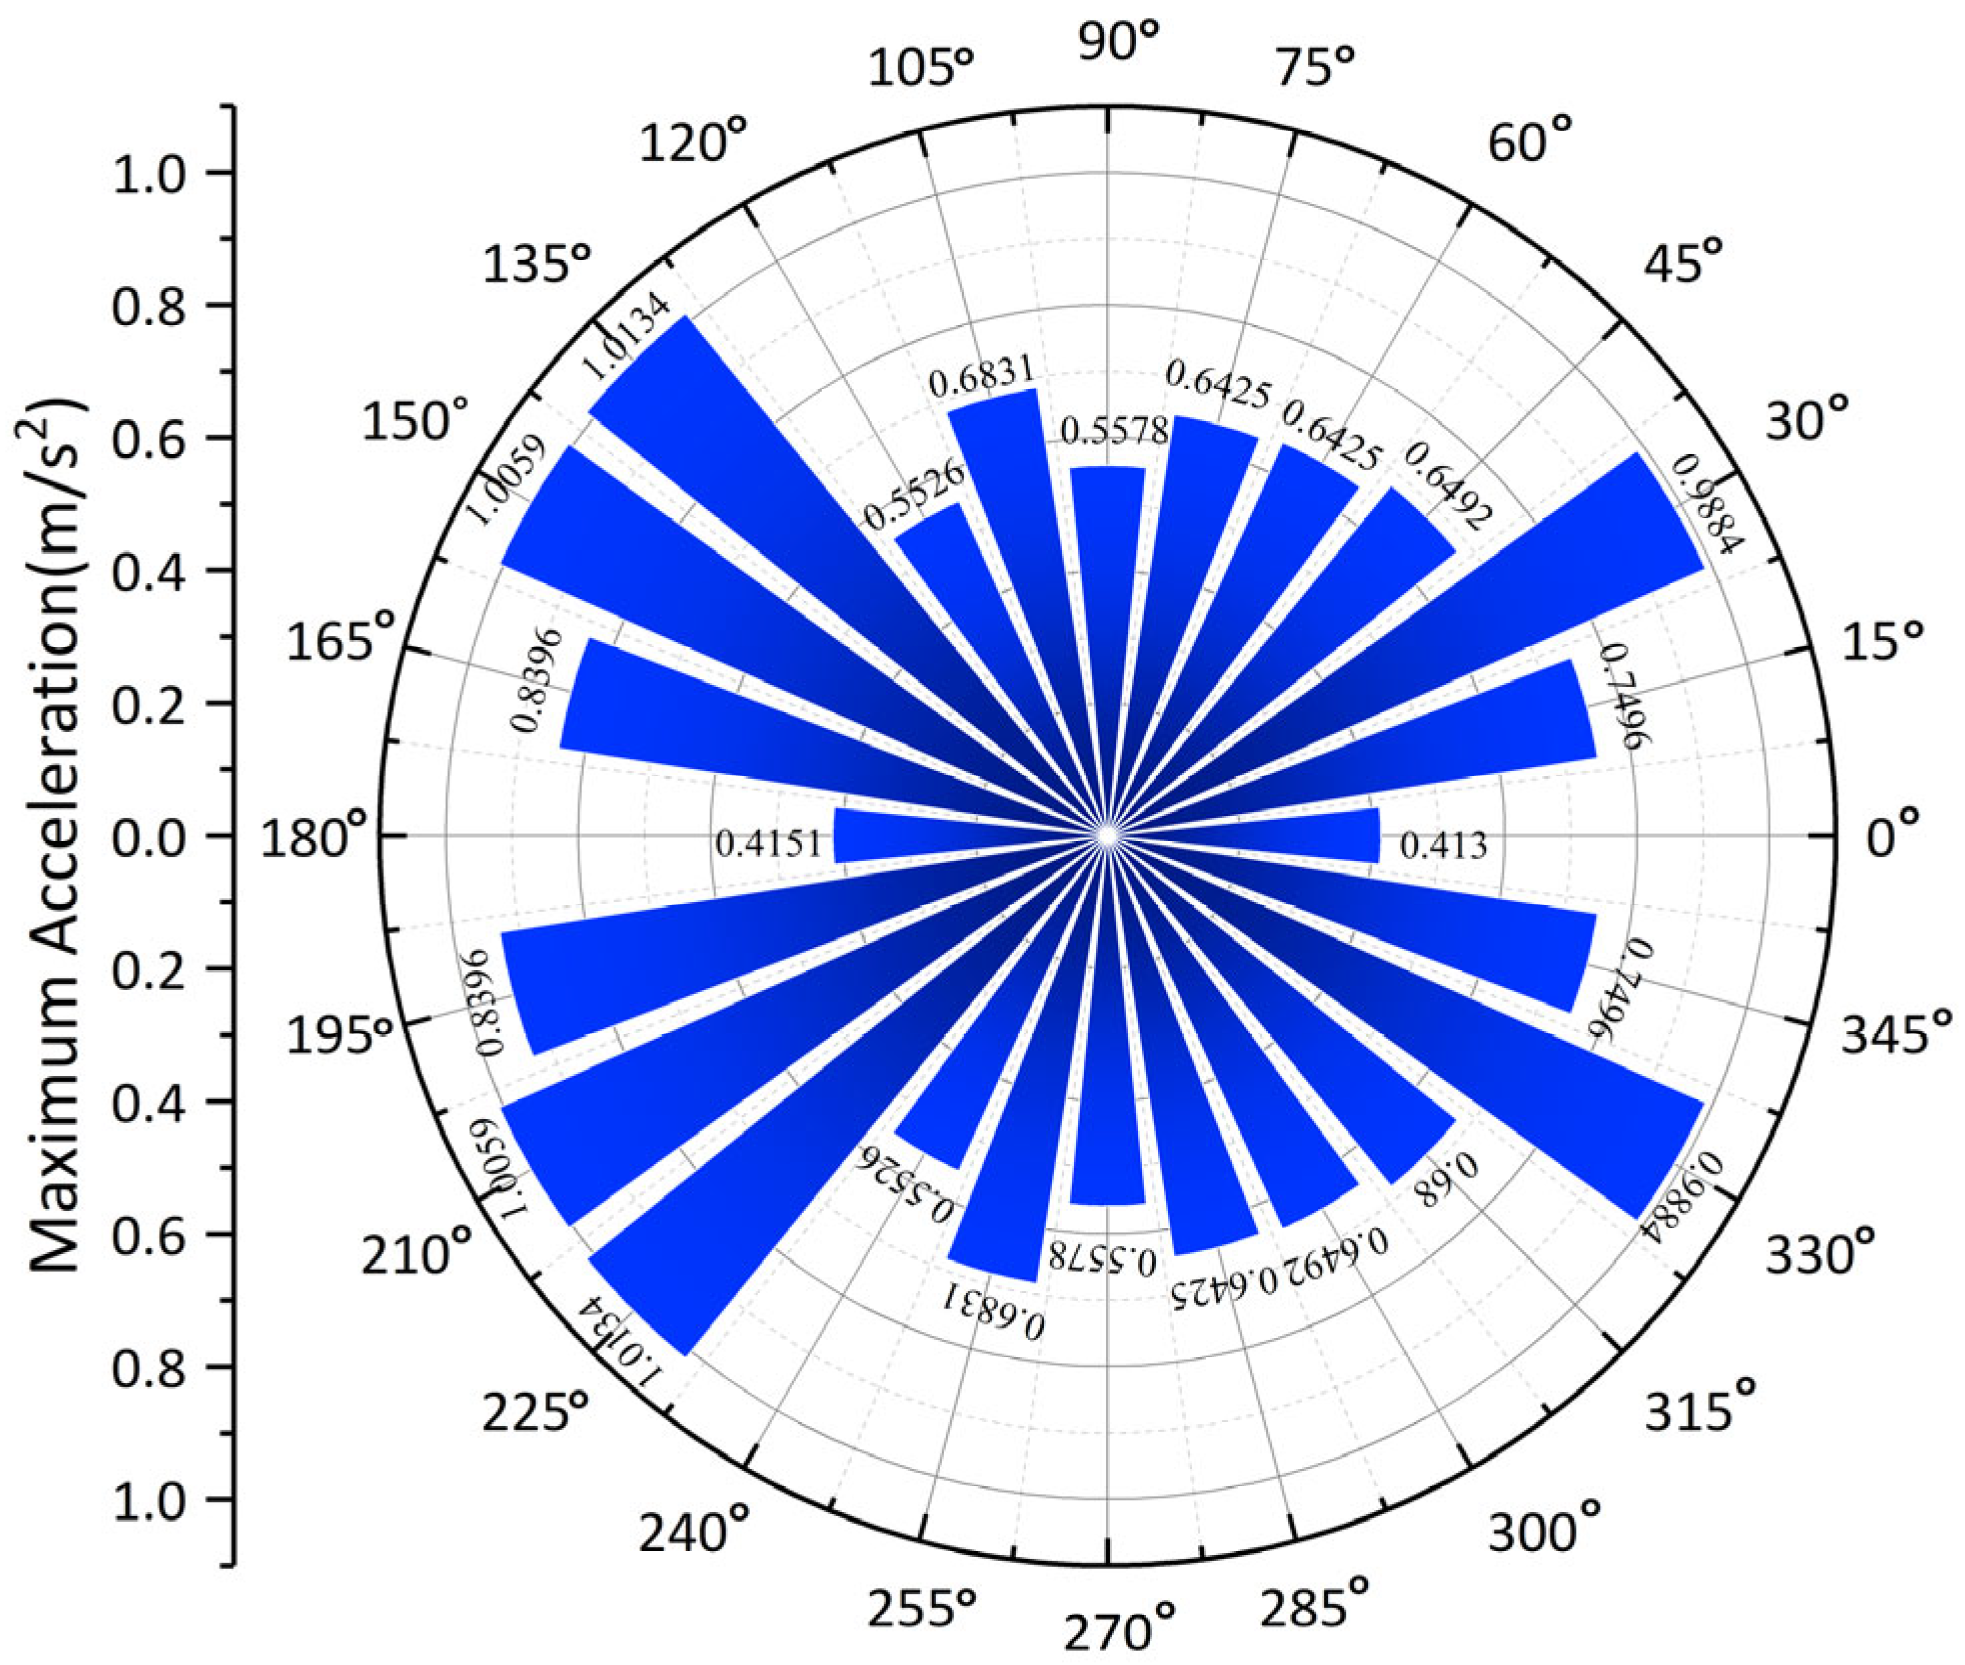
Figure 13 illustrates the maximum horizontal acceleration of the booster station’s jacket platform under different downward ice directions. Due to the symmetry of the jacket platform about the x-axis (
Figure 11), the maximum horizontal acceleration from 0° to 180° is symmetrical to that from 180° to 360°. The acceleration reaches its maximum value of 1.0134 m/s
2 at 135 degrees and its minimum value of 0.4130 m/s
2 at 0 degrees. The time–history curve for horizontal acceleration in the ice direction shows that the acceleration at 135 degrees not only has the highest magnitude but also the greatest average value. Therefore, it can be inferred that an ice direction of 135 degrees poses the most critical threat to the booster station’s jacket platform.
4.3. Effect of the Ice-Breaking Cones on Ice-Induced Vibrations on Offshore Platforms
In this section, the impact of incorporating an ice-breaking cone on ice-induced vibrations of offshore platforms is further investigated. The collision between a single cone and level ice with identical cone diameters but varying cone angles is analyzed to evaluate the resulting damage state of the level ice and the effectiveness of different cone angles in preventing collisions. This analysis provides a recommendation for selecting the optimal cone angle with superior ice-breaking capabilities.
4.3.1. Horizontal Ice Loads of a Single Cone at Different Cone Angles
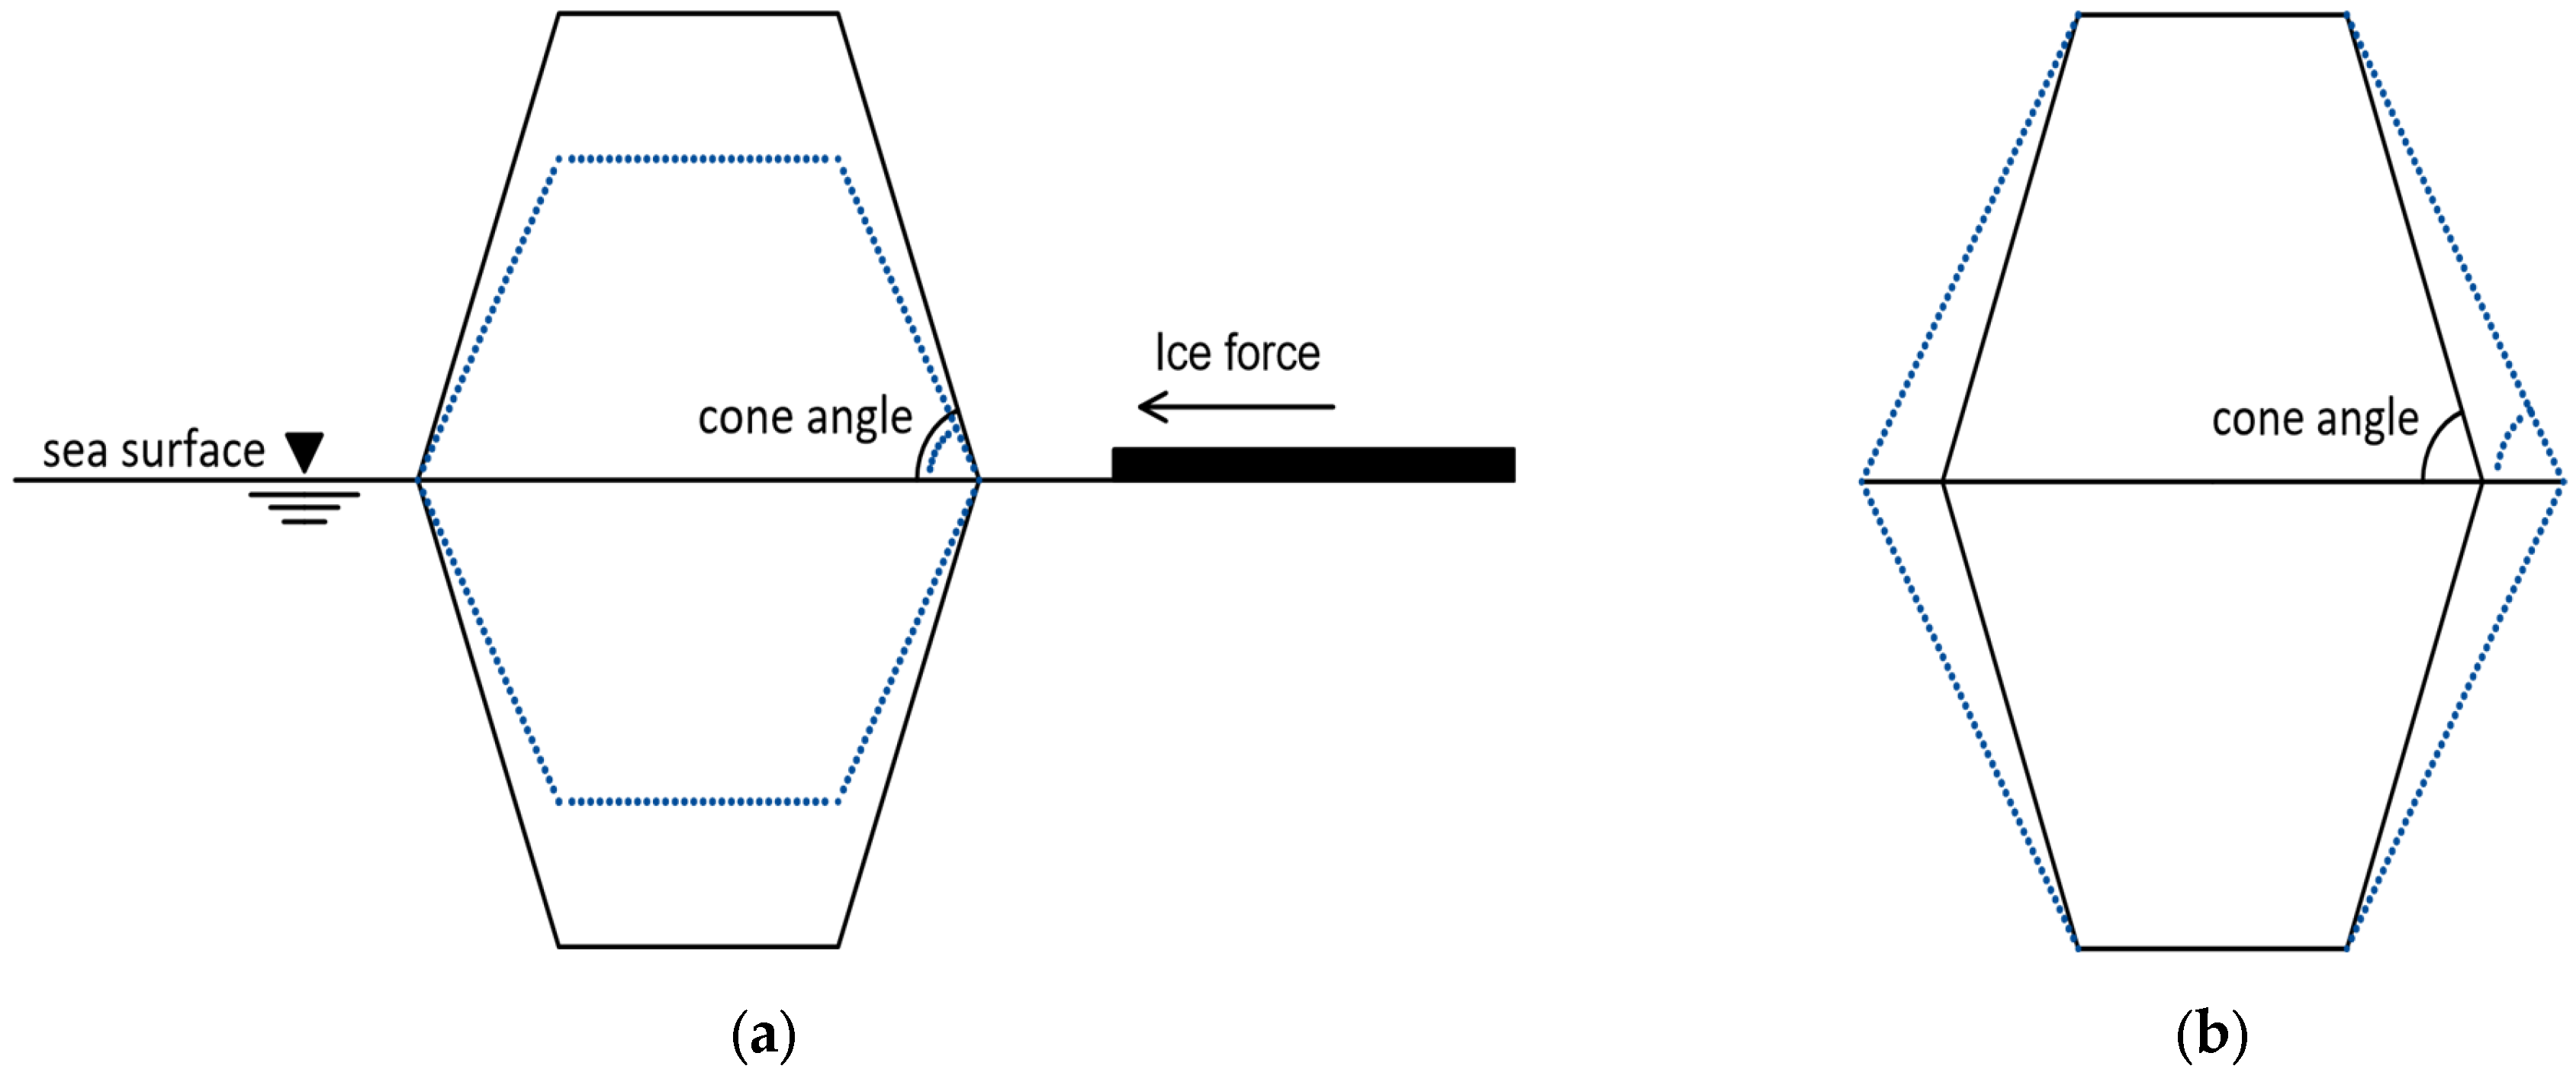
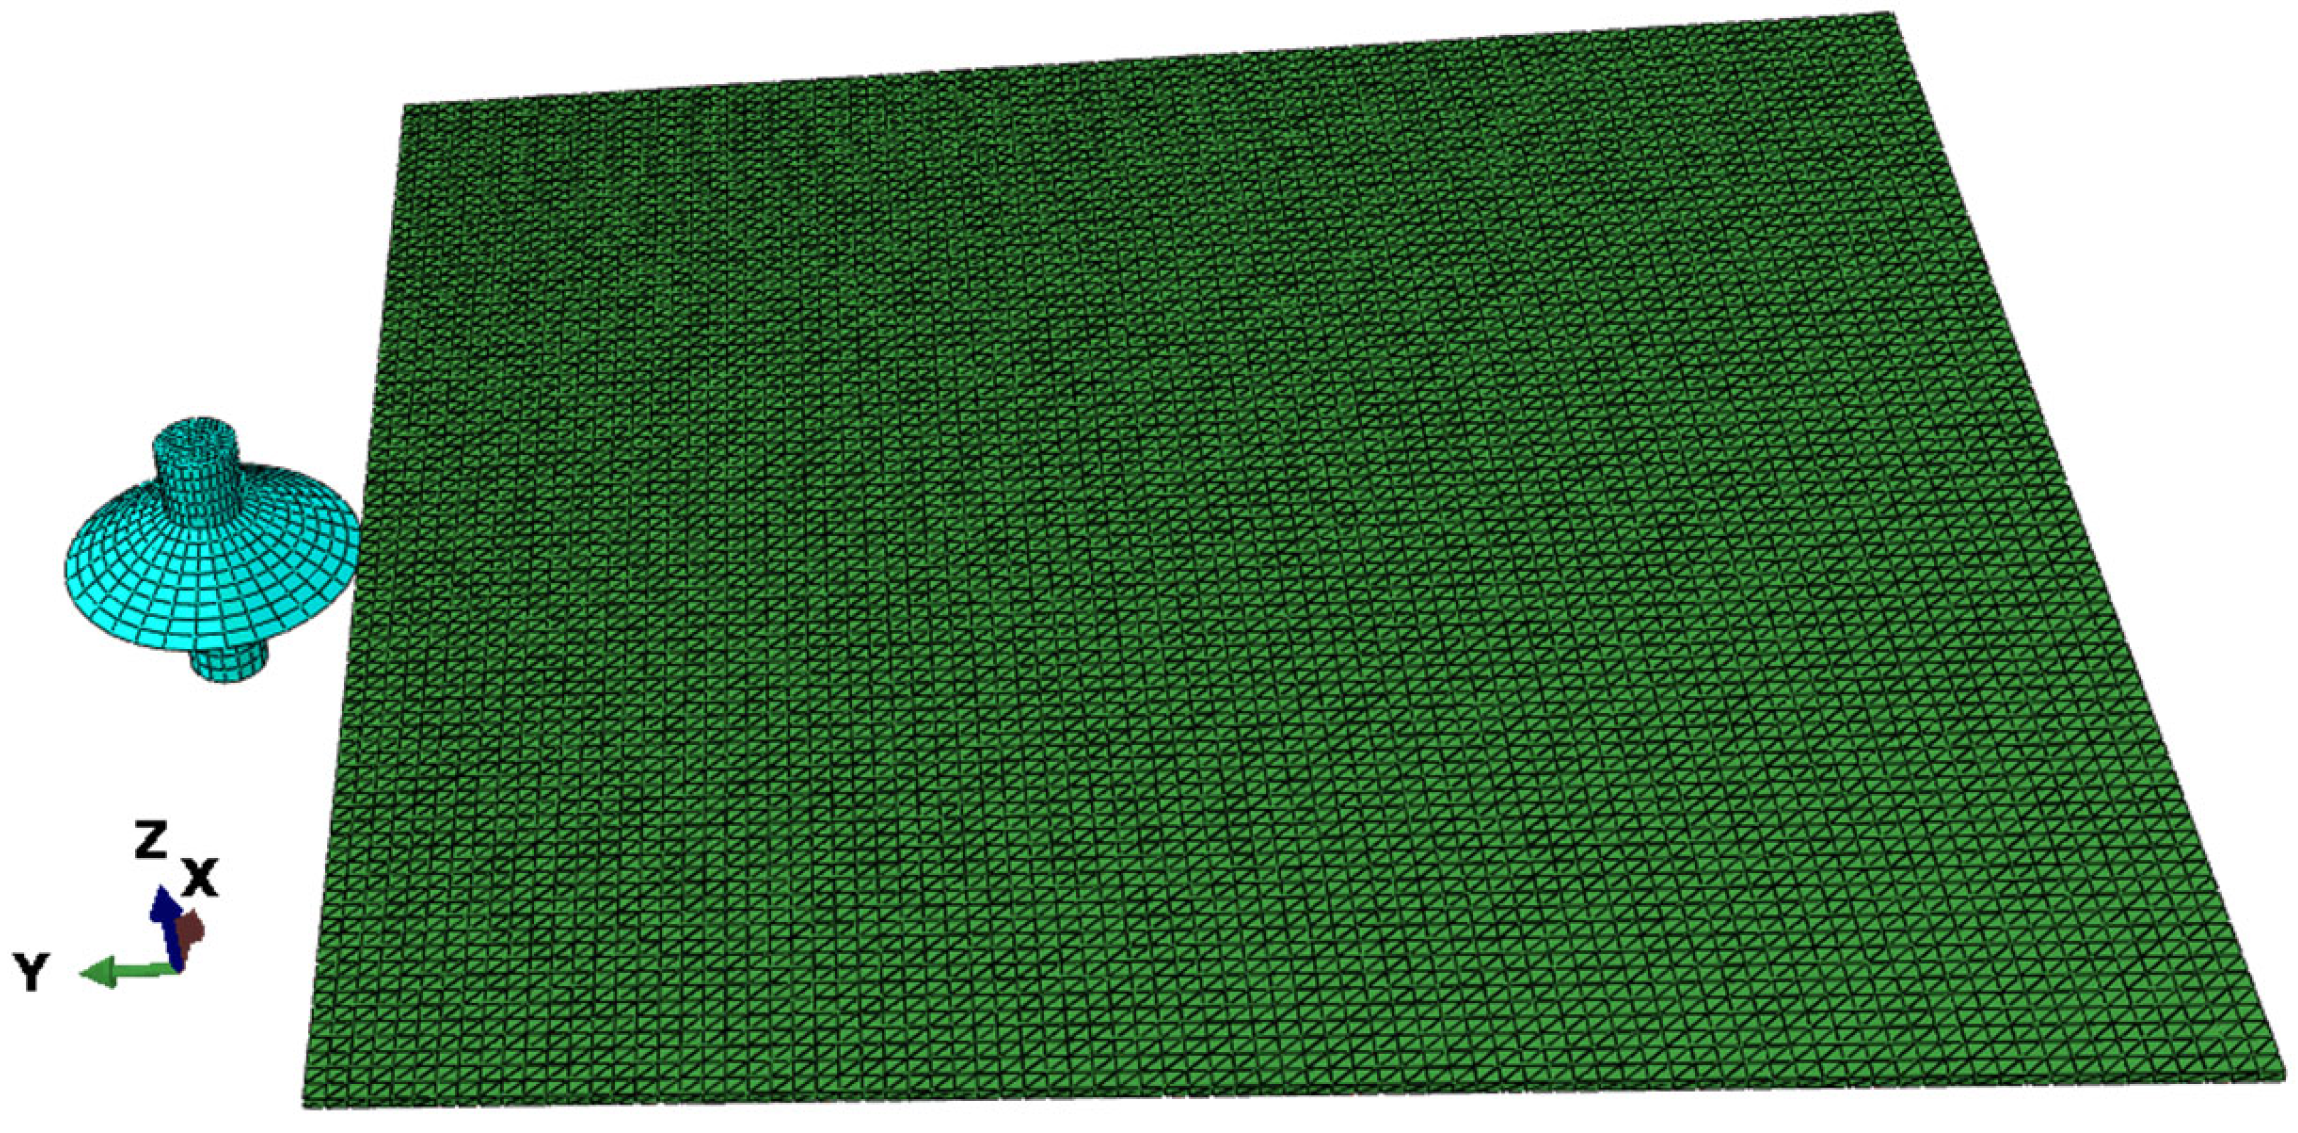
The cone diameter at the waterline was not varied and maintained at 9.6 m, as shown in
Figure 14a. Five different working conditions were considered, with cone angles of 30 degrees, 45 degrees, 60 degrees, 75 degrees, and 90 degrees. The sea-ice model parameters and contact settings remained consistent with those used in the experimental verification discussed in
Section 3. An impact speed of 0.6 m/s was applied to the cone ice-breaking device.
Figure 15 shows the finite element model at a 30-degree cone angle.
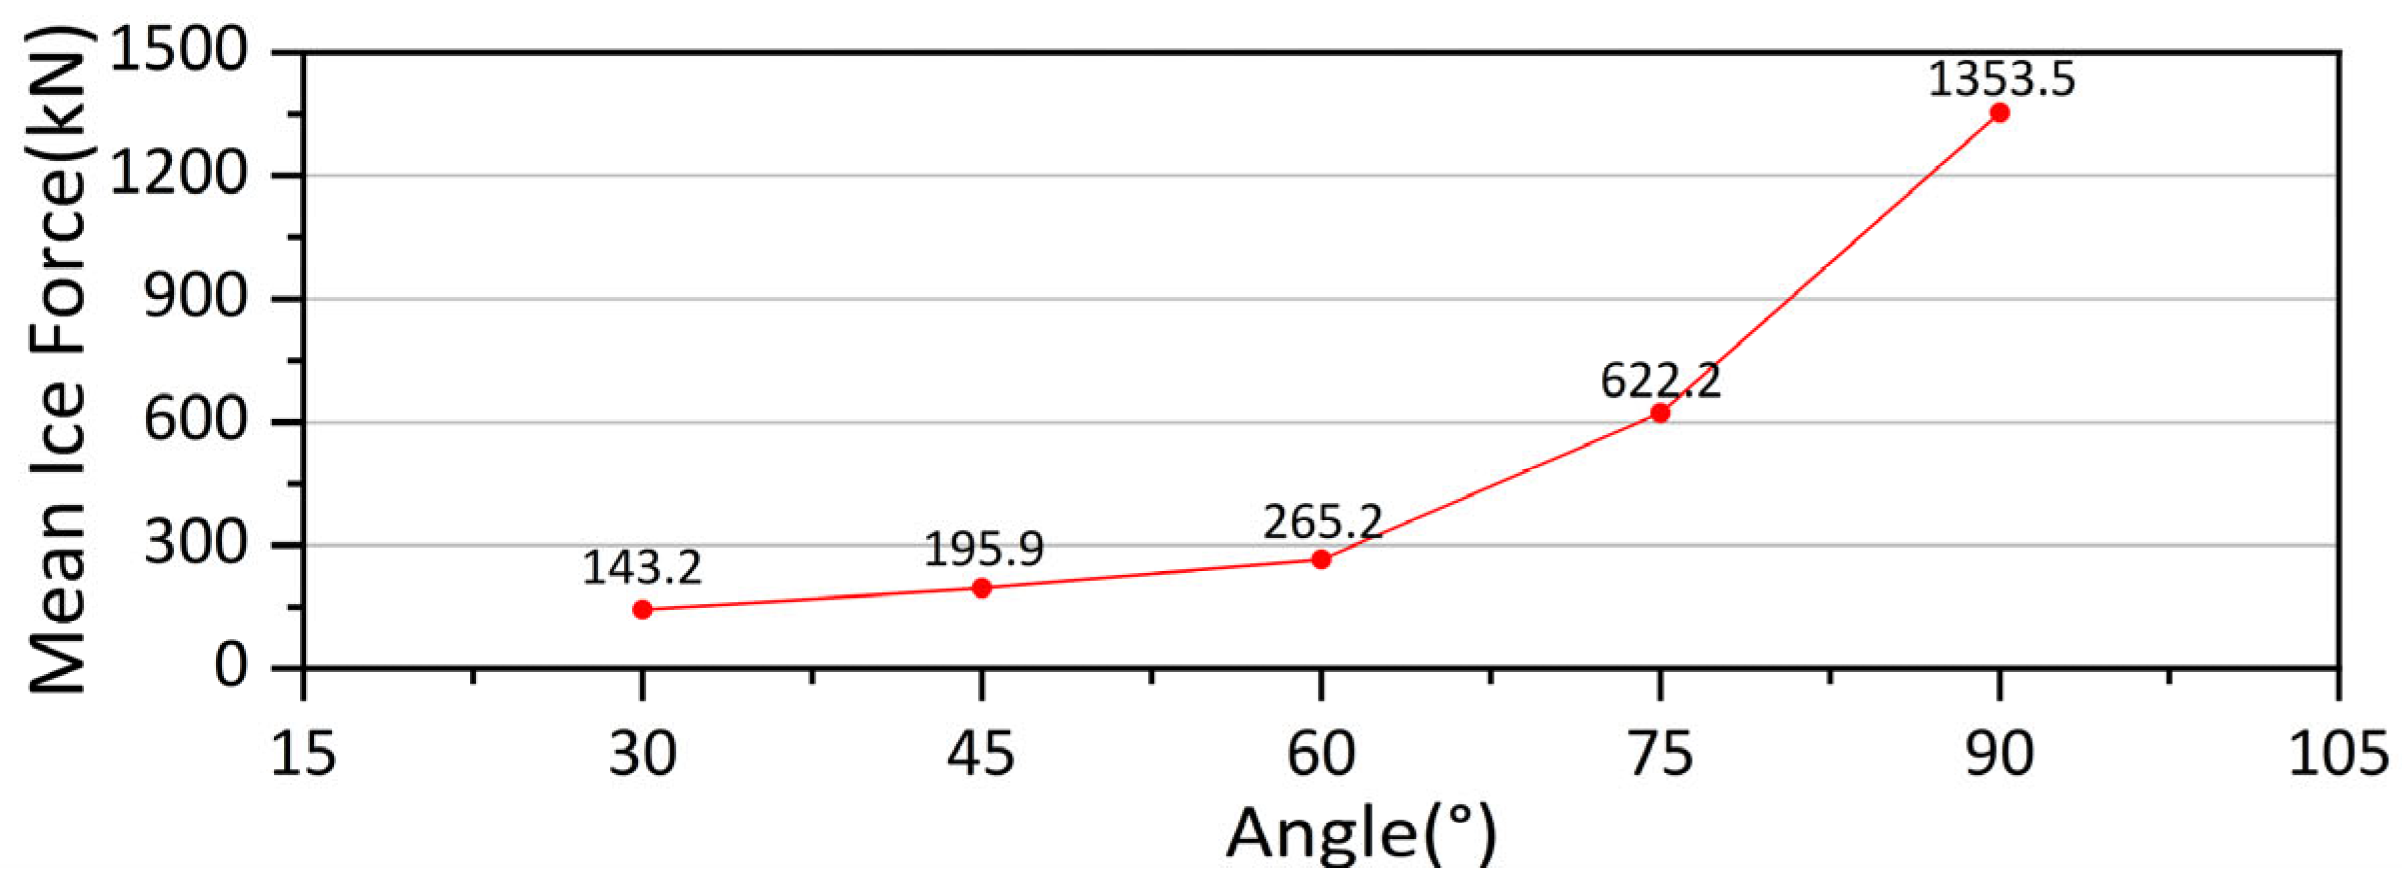
Figure 16 presents a comparison chart of the average ice load obtained through simulation calculations for different cone angles under the same cone diameter. It is evident that as the cone angle increases, both the average and maximum horizontal ice loads on the ice-breaking cone also increase.
Figure 17 illustrates the time–history curve of ice load for both the upper and lower cone surfaces interacting with level ice. Unlike the collision between the upper cone surface and the level ice, when the lower cone surface interacts with the level ice, the broken ice experiences both buoyancy and gravity. As a result, the resultant force obtained by subtracting these two forces is relatively small. This mitigates excessive interference from broken ice to a certain extent while having minimal impact on the horizontal component force on the cone and bending damage caused by rear-entering ice.
After the lower cone face collides with the level ice and reaches its maximum load, the broken ice is almost completely unloaded, resulting in no further contact between the cone face and the ice until the next occurrence.
Figure 17 illustrates that the upper cone face experiences a significantly higher ice load compared to the lower cone face. Considering only the effect of the upper cone face can greatly save time when evaluating maximum ice-induced vibrations.
4.3.2. Analysis of Ice-Excited Vibrations on the Platform at Different Cone Angles
Considering the size limitation of the jacket platform and the feasibility of construction, we limit the cone height. In order to further investigate the influence of the ice-breaking cone angle on ice-induced vibrations, a 6 m-high ice-breaking cone structure was utilized. Based on the relevant research results on the influence of cone angle on ice load and ice breaking length, the cone angles considered were 30 degrees, 37.5 degrees, 45 degrees, 52.5 degrees, 60 degrees, and 67.5 degrees, respectively, as shown in
Figure 14b.
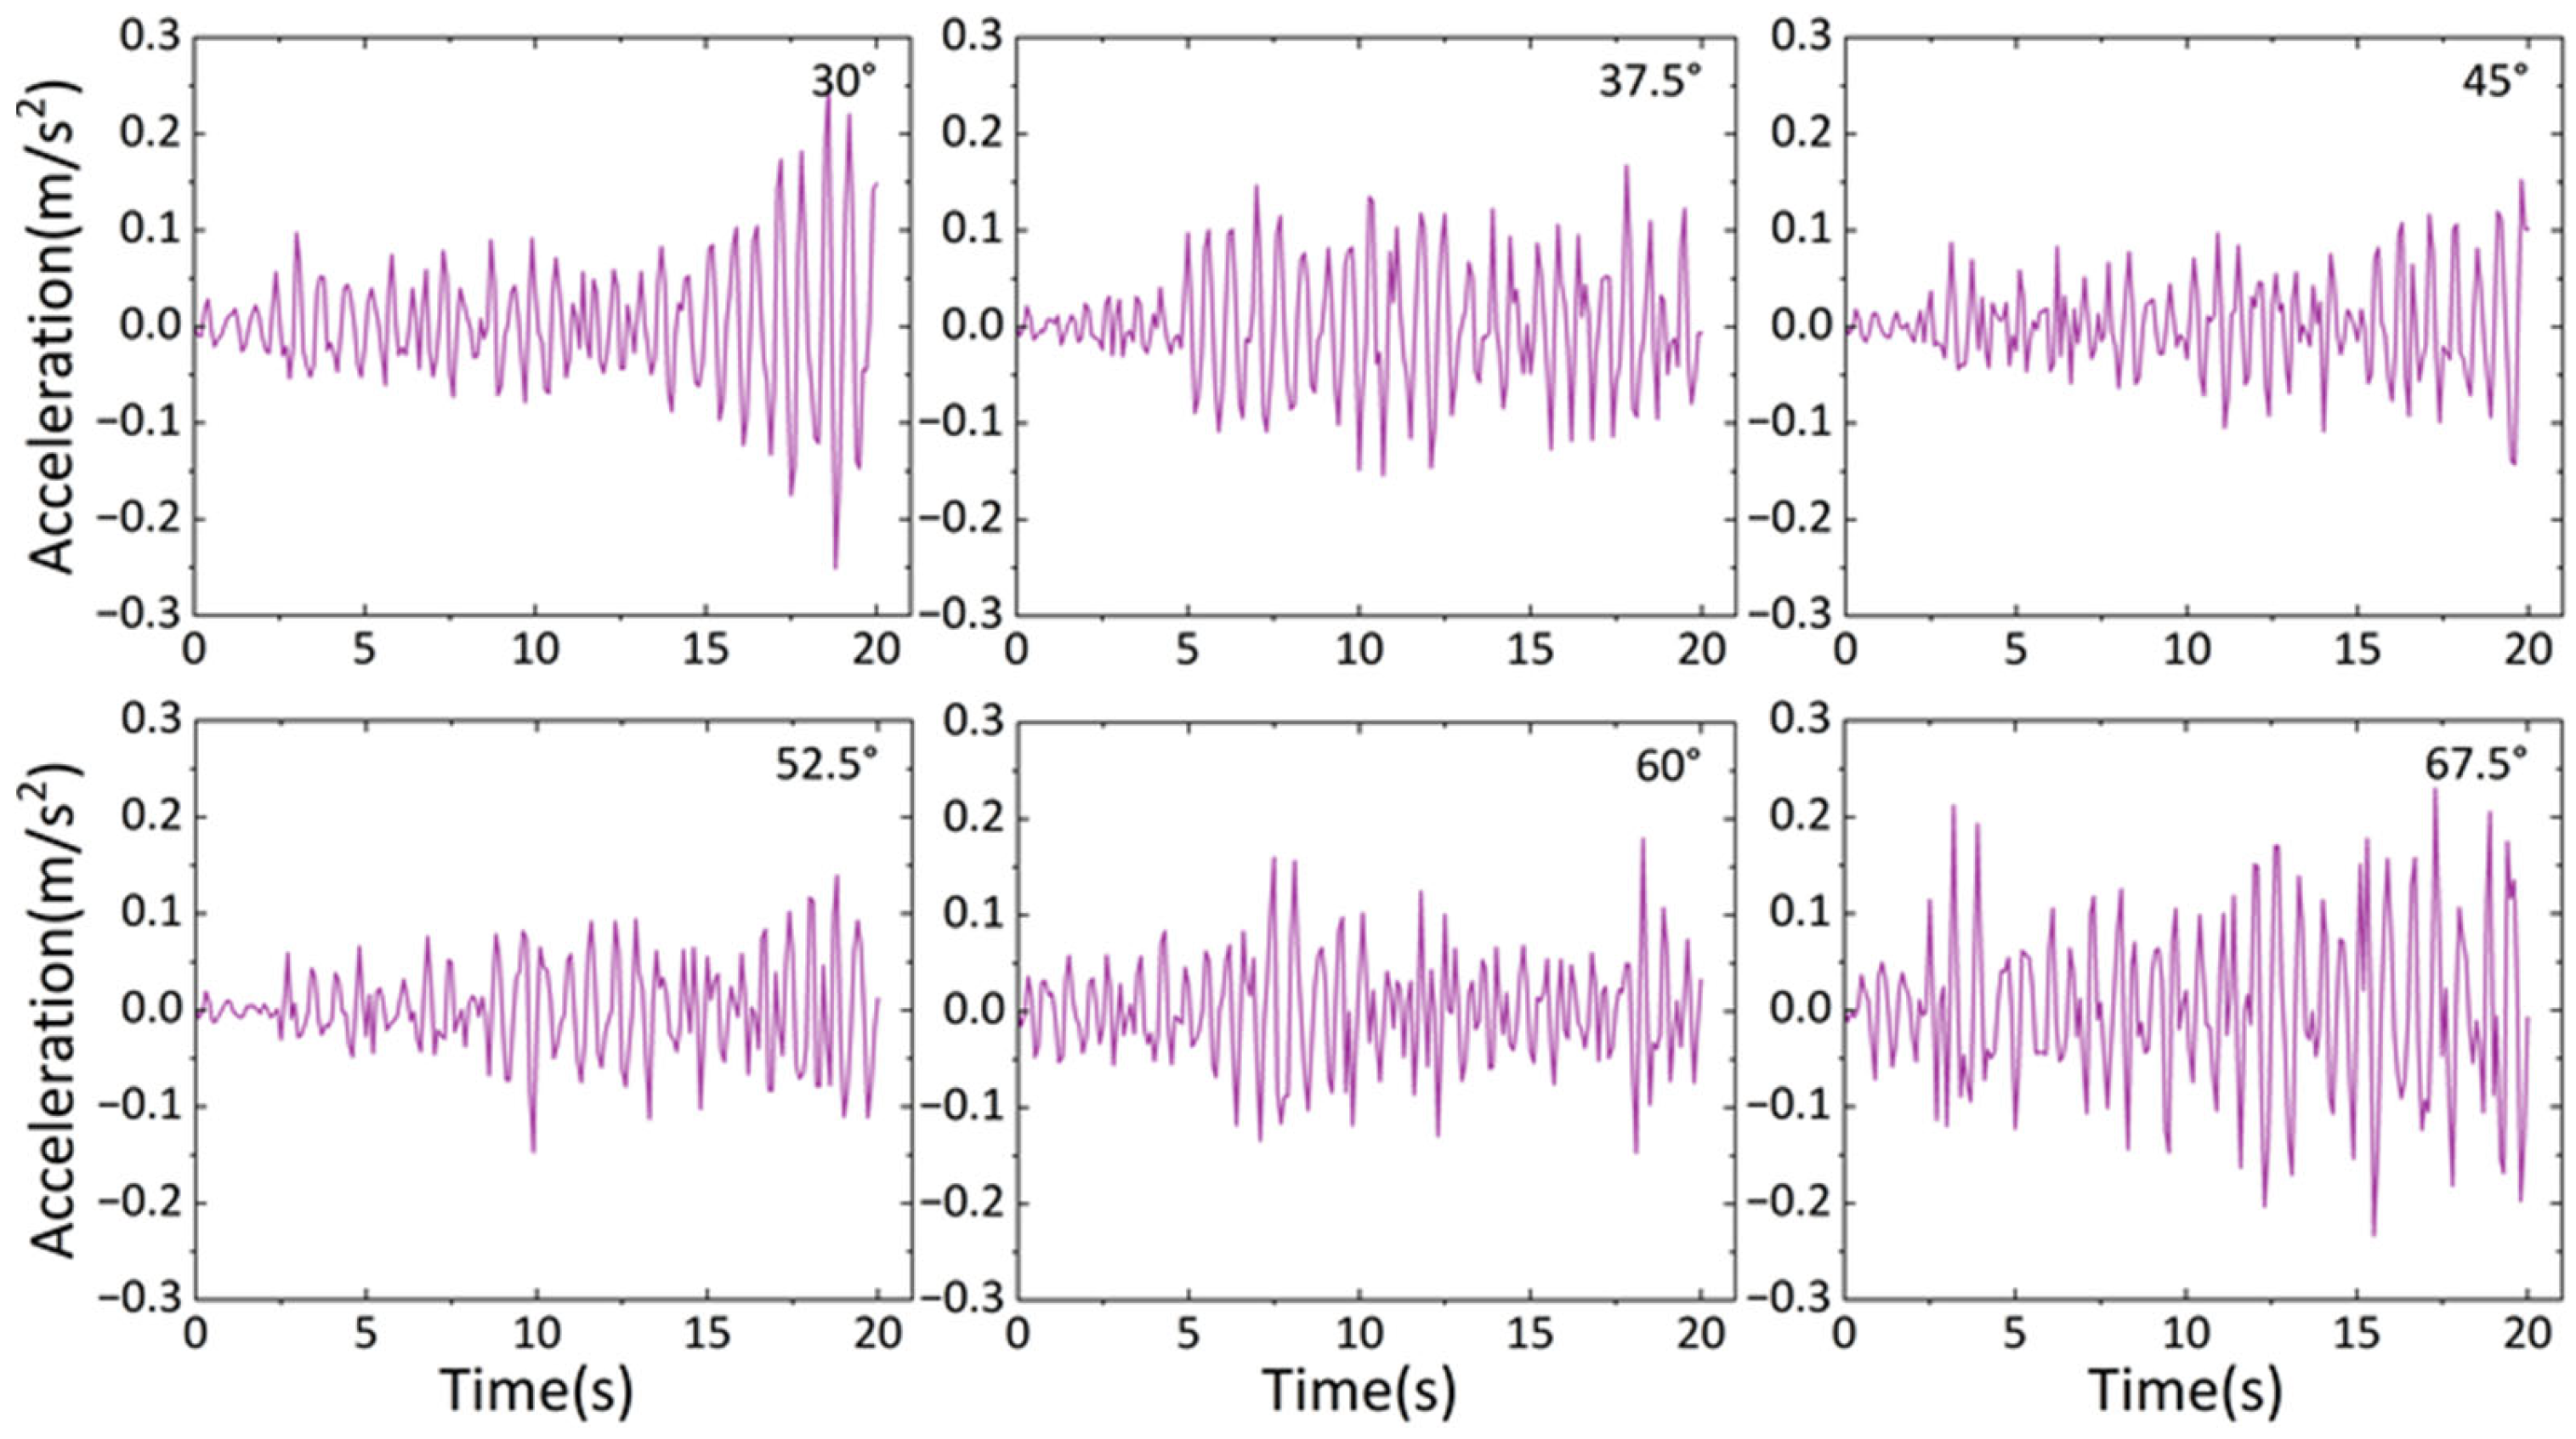
To study the impact of level ice on the jacket structure equipped with the ice-breaking cone, simulations were conducted. The ice had a direction of 0° and a velocity of 0.6 m/s. Horizontal acceleration on the top deck was obtained and shown in
Figure 18.
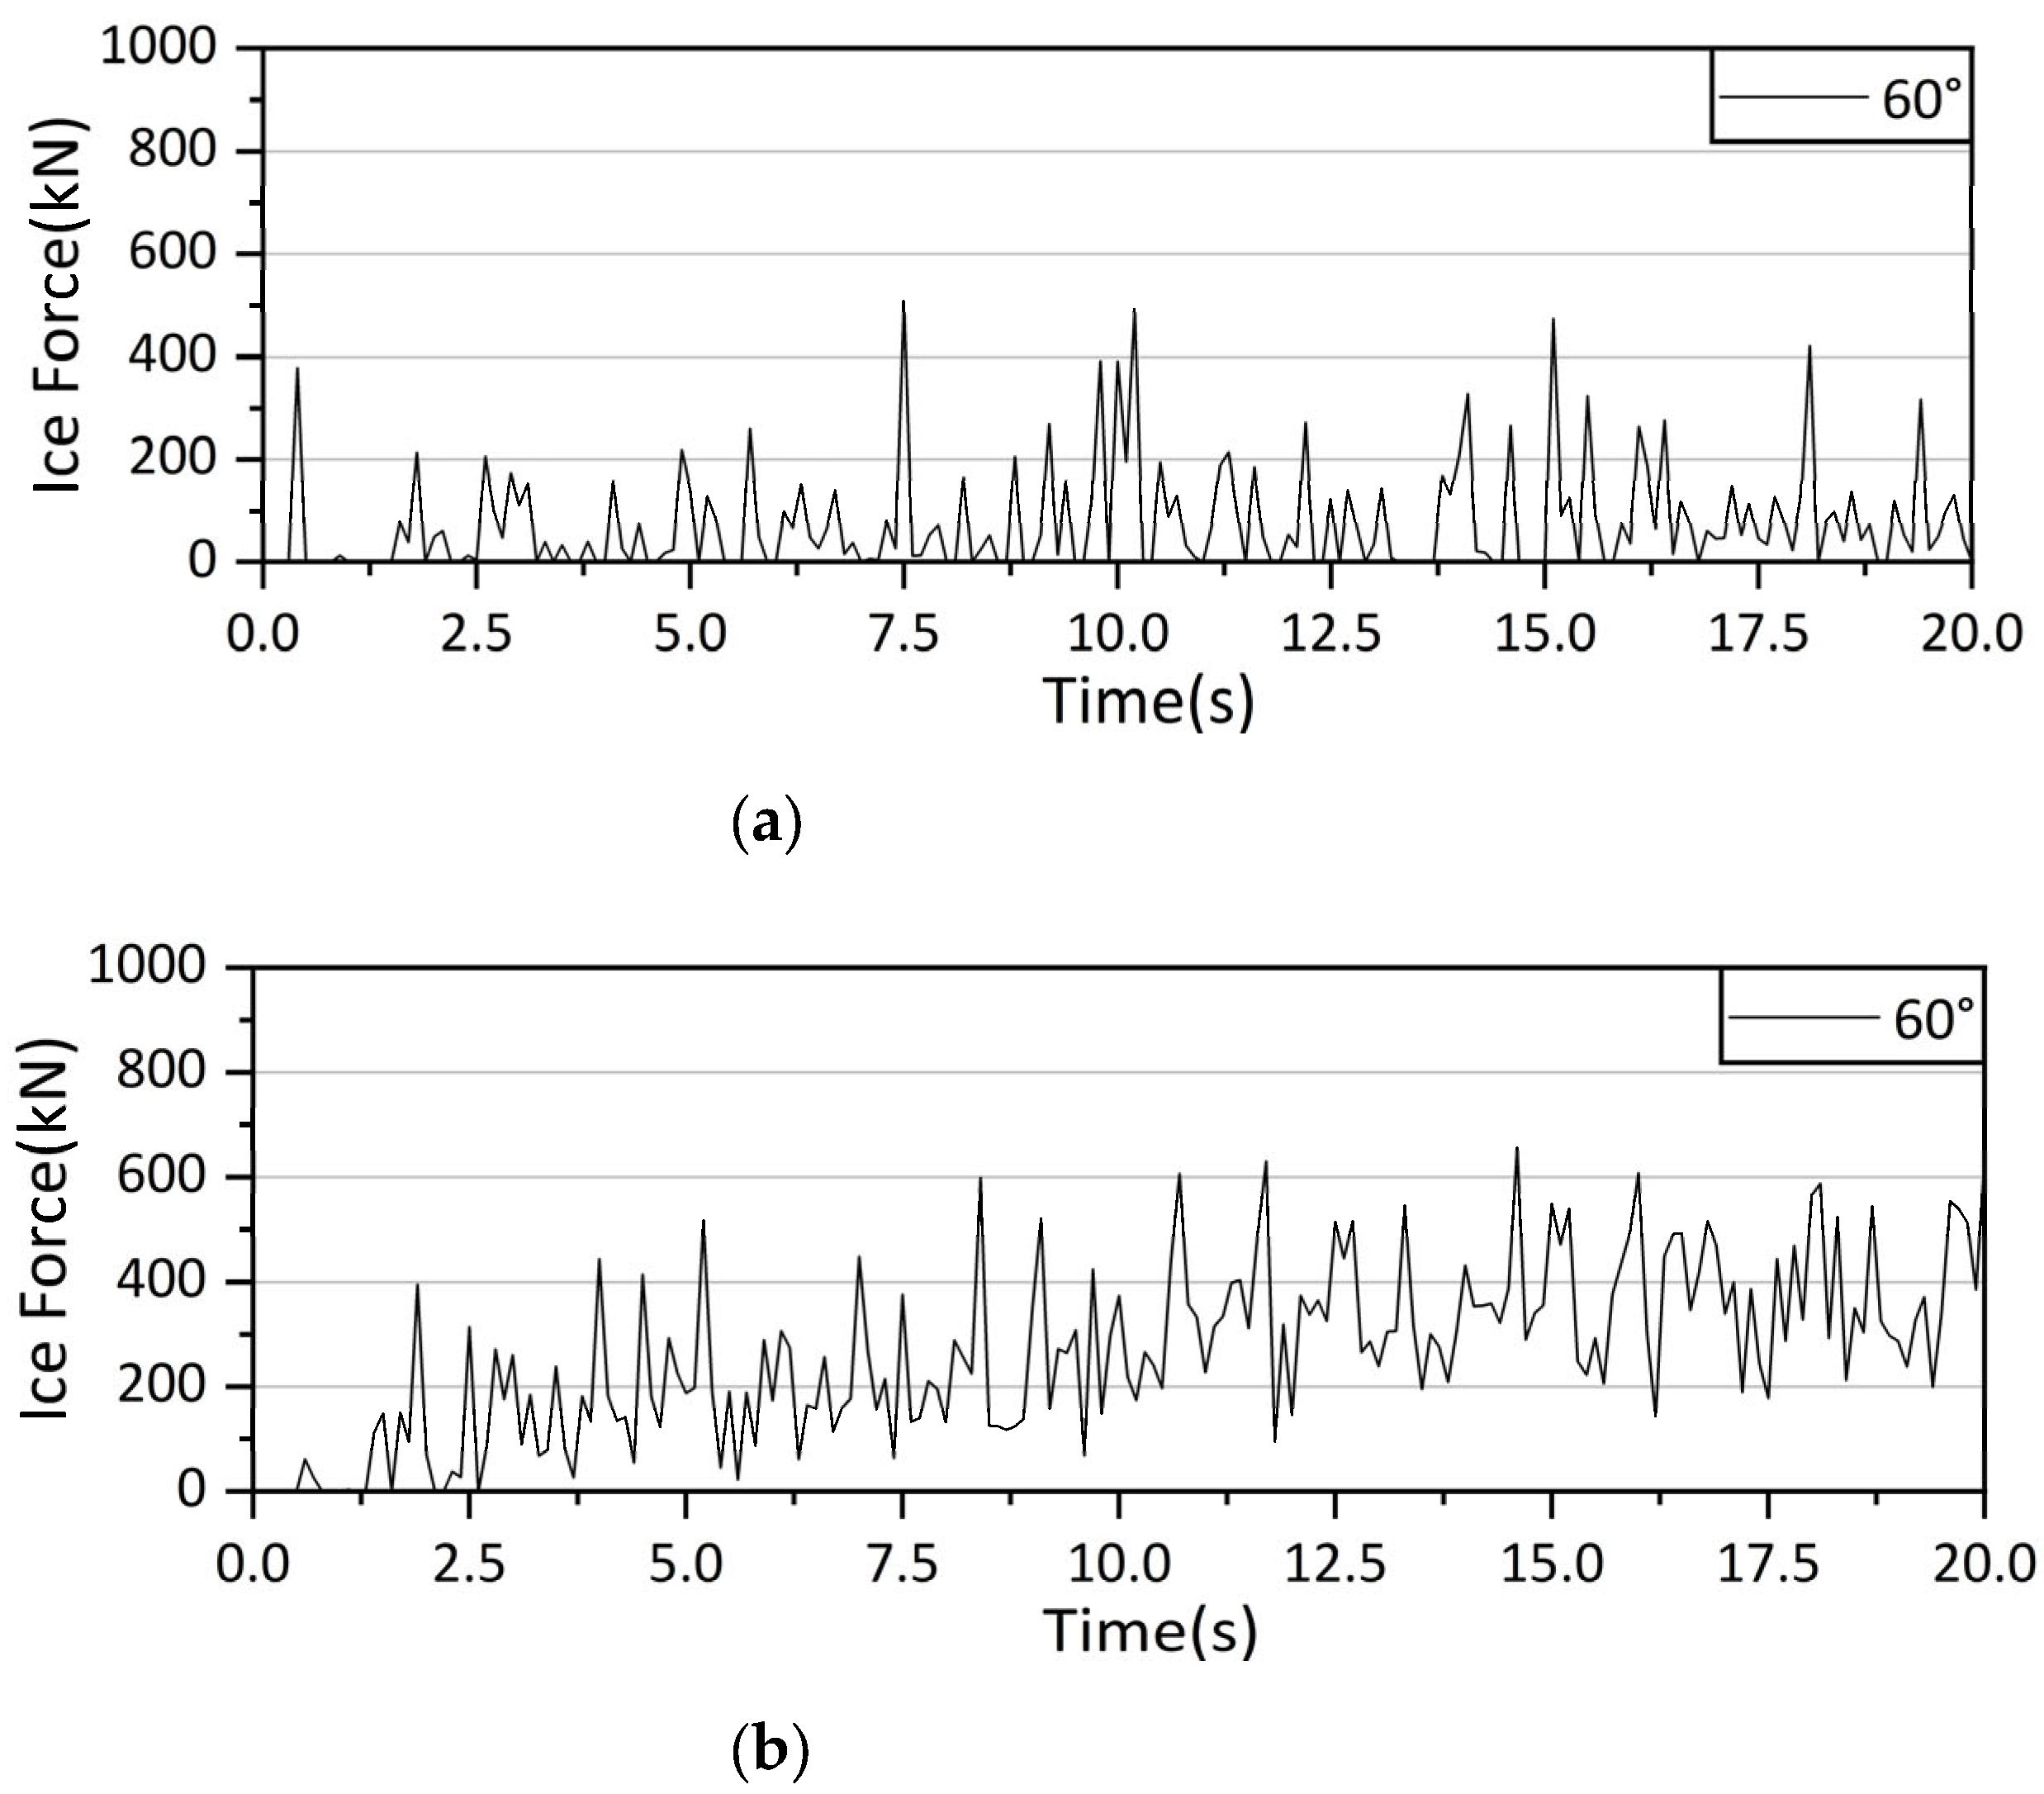
The corresponding ice load is loaded onto the Jacket structure of the booster station, and because of the geometrical symmetry of the structure in the ice-facing direction, only the y-direction deck acceleration is selected, and the x-direction is too small to be neglected. The simulation results obtained are shown in
Figure 18 and
Figure 19.
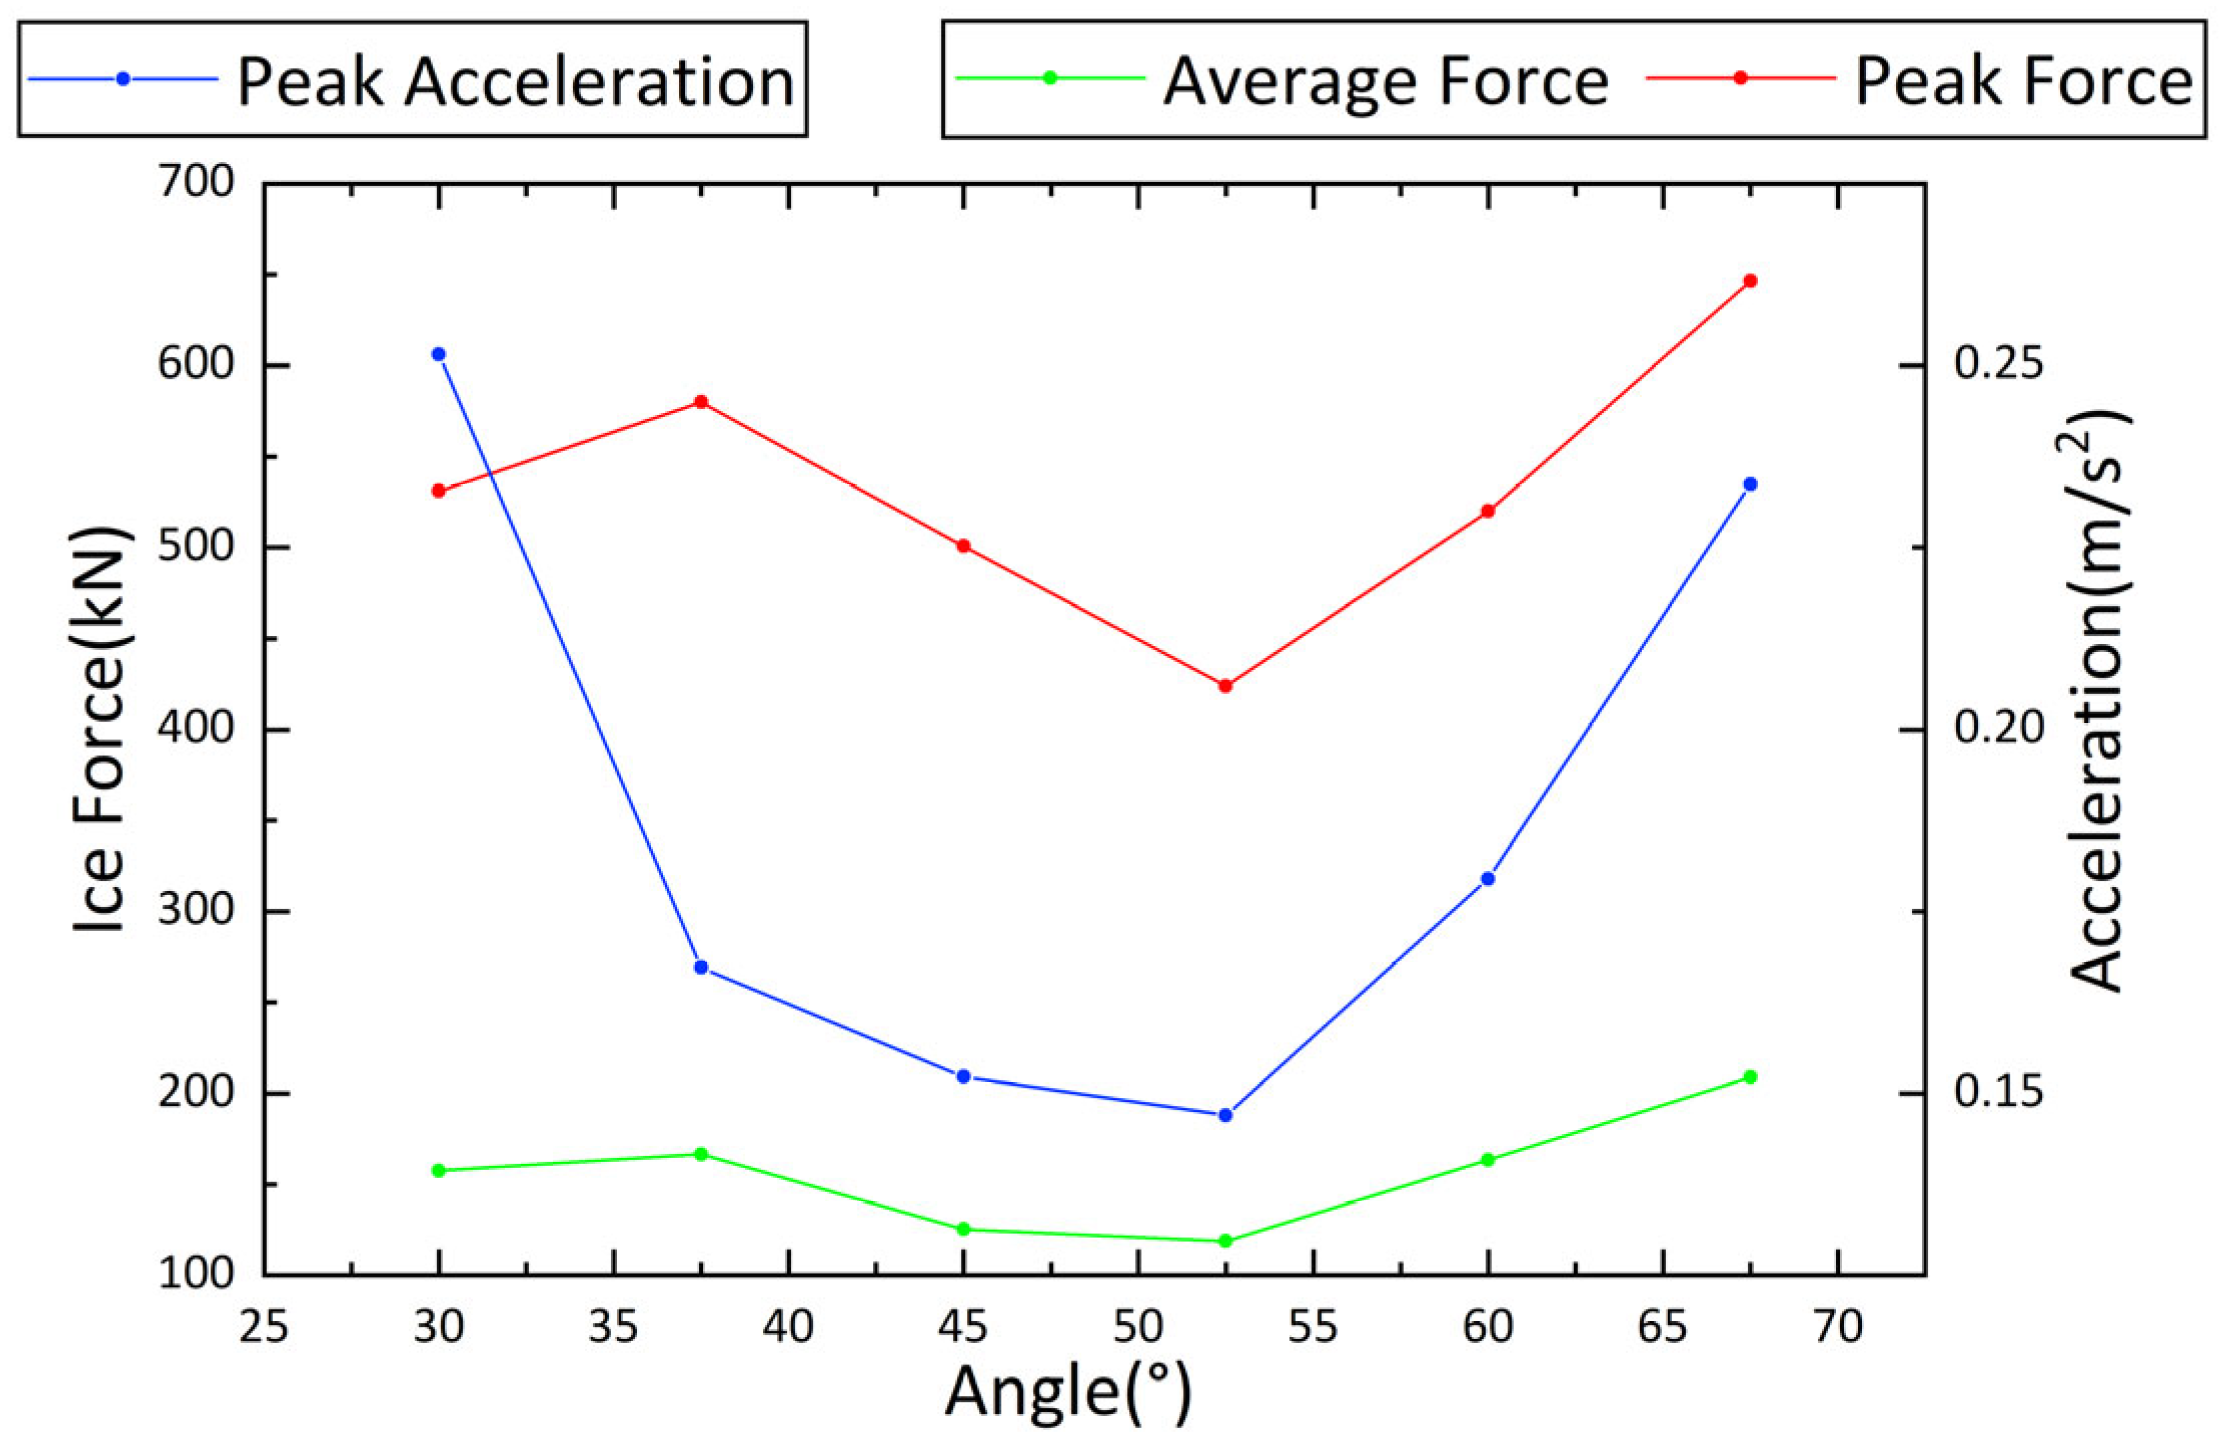
Table 8 shows the frequencies corresponding to the peak accelerations for the different cone angles in
Figure 19.
In the previous section, it was observed that a smaller cone angle leads to a lower ice load. However, when considering a fixed cone height, the primary factor influencing the overall ice load is the cone diameter, which can reach up to 12.8 m for a 30-degree cone angle, as listed in
Table 9. Consequently, this results in greater structural vibration induced by ice compared to scenarios with larger cone angles.
For jacket platforms, an ice-breaking cone with a 52.5-degree angle demonstrates the optimal effectiveness. When subjected to level ice at horizontal acceleration ranging from 0 degrees, the maximum value reaches 0.147 m/s2, indicating excellent vibration reduction capabilities.
Based on these findings, a jacket platform without an ice-breaking cone experiences a maximum horizontal acceleration of 0.3926 m/s
2 when impacted by level ice with a velocity of 0.6 m/s. However, when equipped with conical ice-breaking devices under operational conditions, the acceleration is reduced compared to the without-ice-breaking cone scenario (as shown in
Table 10).
It is noteworthy that cones with angles of 30 degrees and 67.5 degrees exhibit relatively weaker shock absorption effects, resulting in maximum accelerations of 0.2515 m/s2 and 0.2337 m/s2, respectively. This represents reductions of approximately 36% and 40% compared to without-ice-breaking cone scenarios. Conversely, cones with angles of 45 degrees and 52.5 degrees demonstrate better shock absorption capabilities, yielding maximum accelerations of only 0.1523 m/s2 and 0.1470 m/s2, respectively. These values correspond to reductions of around 61% and 63% relative to without-ice-breaking cone conditions.
5. Conclusions
The jacket platform of an offshore booster station is selected as the research subject in this study, and a CEM is employed to simulate the process of sea-ice impact on the platform. ABAQUS software is utilized to calculate and analyze the vibration effect induced by ice collision with the offshore platform under different ice speeds and downward forces. Furthermore, the vibration reduction effect of a conical ice-breaking device on ice-induced vibrations of the offshore platform is investigated, leading to the following conclusions:
(1) The study employed a combination of the finite element constitutive model and the cohesive element model to numerically simulate the collision between the ice sheet and the platform structure. The simulation results showed good agreement with the results of the Hamburg ship model tank ice-breaking experiment, with an average difference in ice load of 5.54% and a peak difference of 8.58%. These findings indicate that CEM is both feasible and reliable for simulating the collision process of sea ice.
(2) The study suggests that there is a positive correlation between the motion response of an offshore platform and the impact velocity of sea ice. However, a data comparison shows that increasing ice speed does not significantly increase the movement of the offshore platform. Analysis of the ice extrusion and breaking track also reveals that the average ice-breaking width of the pile increases with the ice speed to a certain extent.
(3) The study suggests that the direction of incoming sea ice has a significant impact on the ice-induced vibration of offshore platforms. Specifically, analysis of the horizontal acceleration curve reveals that acceleration at 135 degrees not only has the maximum value but also the maximum average acceleration. Therefore, it can be considered that 135 degrees is the most critical ice direction for the jacket platform of the booster station. However, it is important to note that the dynamic response of the jacket platform may be influenced by various factors, including the shielding effect and the structural characteristics of the jacket itself. The shielding effect, in particular, plays an important role in the dynamic response of the platform. Therefore, when assessing the risks posed by sea ice to offshore structures, these factors need to be carefully considered.
(4) The study demonstrates that the installation of an ice-breaking cone can greatly enhance the damping effect on an offshore platform. When the cone diameter at the waterplane is constant, with the increase in the cone angle, the average and maximum of the horizontal ice load borne by the ice-breaking cone will increase. Our conclusion through simulation calculation is that when compared to scenarios without any protection, cones with angles of 30 degrees and 67.5 degrees show weaker shock absorption effects, resulting in maximum accelerations of 0.2515 m/s2 and 0.2337 m/s2, respectively. On the other hand, cones with angles of 45 degrees and 52.5 degrees demonstrate improved shock absorption capabilities, with maximum accelerations of only 0.1523 m/s2 and 0.1470 m/s2, respectively. In these configurations, the maximum acceleration can be reduced by 61% and 63%, respectively, compared to when no protective devices are present. It should be noted that the optimal angle for the ice-breaking cone may vary depending on specific platform designs and operational conditions. Further research and analysis are necessary to explore different cone geometries and their corresponding damping effects. Additionally, considerations such as cost, feasibility, and maintenance requirements need to be considered when implementing such protective devices.
These conclusions are to provide insights that can guide engineering practices and contribute to the development of more resilient and secure offshore structures in ice-prone environments. It is important to note that these conclusions are based on the specific methodology and analysis employed in the study. Any modifications or adjustments in subsequent research would require a thorough review of the research methodology and data analysis.
Author Contributions
Conceptualization, J.Z.; methodology, B.W. (Bingjun Wang); software, X.W. and B.W. (Bingjun Wang); validation, X.W.; formal analysis, B.W. (Bingjun Wang); investigation, Y.L. and K.S.; resources, K.S. and D.G.; data curation, K.S.; writing—original draft preparation, X.W. and Y.L.; writing—review and editing, W.-H.K., K.S., D.G. and X.W.; visualization, W.-H.K.; supervision, J.Z. and K.S.; project administration, J.Z. and B.W. (Bin Wang); funding acquisition, J.Z. and B.W. (Bin Wang). All authors have read and agreed to the published version of the manuscript.
Funding
The authors gratefully acknowledge the financial support from the National Natural Science Foundation of China (grant Nos. 52271268, 52201331, 52171255), the Key Laboratory of far-shore wind power technology of Zhejiang Province (grant No. ZOE2020003), the Fundamental Research Funds for the Central Universities (grant No. 3072022CF0215) and the Natural Science Foundation of Liaoning Province (grant No. 2023-MS-217).
Institutional Review Board Statement
Not applicable.
Informed Consent Statement
Not applicable.
Data Availability Statement
The data presented in this study are available on request from the corresponding author.
Acknowledgments
We would like to acknowledge the reviewers and the editor for their valuable comments and suggestions.
Conflicts of Interest
The authors declare no conflict of interest. Author Bin Wang was employed by the company Powerchina Huadong Engineering Corporation Limited. The remaining authors declare that the research was conducted in the absence of any commercial or financial relationships that could be construed as a potential conflict of interest.
References
- Ji, S.; Yang, D. Ice loads and ice-induced vibrations of offshore wind turbine based on coupled DEM-FEM simulations. Ocean Eng. 2022, 243, 110197. [Google Scholar] [CrossRef]
- Zhu, B.; Sun, C.; Jahangiri, V. Characterizing and mitigating ice-induced vibration of monopile offshore wind turbines. Ocean Eng. 2021, 219, 108406. [Google Scholar] [CrossRef]
- Hammer, T.C.; Hendrikse, H. Experimental study into the effect of wind-ice misalignment on the development of ice-induced vibrations of offshore wind turbines. Eng. Struct. 2023, 286, 116106. [Google Scholar] [CrossRef]
- Blenkarn, K.A. Measurement and analysis of ice forces on Cook Inlet structures. In Proceedings of the Offshore Technology Conference, Houston, TX, USA, 21 April 1970; OnePetro: Richardson, TX, USA, 1970. [Google Scholar]
- Matlock, H.; Dawkin, W.P.; Panak, J.J. Analytical model for ice structure interaction. J. Eng. Mech. ASCE 1971, 97, 1083–1092. [Google Scholar] [CrossRef]
- Timco, G.W.; Johnston, M. Ice loads on the caisson structures in the Canadian Beaufort Sea. Cold Reg. Sci. Technol. 2004, 38, 185–209. [Google Scholar] [CrossRef]
- Hammer, T.C.; Willems, T.; Hendrikse, H. Dynamic ice loads for offshore wind support structure design. Mar. Struct. 2023, 87, 103335. [Google Scholar] [CrossRef]
- Lemström, I.; Polojärvi, A.; Tuhkuri, J. Model-scale tests on ice-structure interaction in shallow water: Global ice loads and the ice loading process. Mar. Struct. 2022, 81, 103106. [Google Scholar] [CrossRef]
- Tang, X.; Zou, M.; Zou, Z.; Li, Z.; Zou, L. A parametric study on the ice resistance of a ship sailing in pack ice based on CFD-DEM method. Ocean Eng. 2022, 265, 112563. [Google Scholar] [CrossRef]
- Jang, H.K.; Kim, M.H. Kulluk-shaped arctic floating platform interacting with drifting level ice by discrete element method. Ocean Eng. 2021, 236, 109479. [Google Scholar] [CrossRef]
- Long, X.; Liu, S.; Ji, S. Discrete element modelling of relationship between ice breaking length and ice load on conical structure. Ocean Eng. 2020, 201, 107152. [Google Scholar] [CrossRef]
- Liu, L.; Ji, S. Comparison of sphere-based and dilated-polyhedron-based discrete element methods for the analysis of ship–ice interactions in level ice. Ocean Eng. 2022, 244, 110364. [Google Scholar] [CrossRef]
- Ji, S.; Wang, S. A coupled discrete–finite element method for the ice-induced vibrations of a conical jacket platform with a Gpu-based parallel algorithm. Int. J. Comput. Methods 2020, 17, 1850147. [Google Scholar] [CrossRef]
- Guo, L.; Fahs, M.; Koohbor, B.; Hoteit, H.; Younes, A.; Gao, R.; Shao, Q. Coupling mixed hybrid and extended finite element methods for the simulation of hydro-mechanical processes in fractured porous media. Comput. Geotech. 2023, 161, 105575. [Google Scholar] [CrossRef]
- Xu, Y.; Wu, J.; Li, P.; Kujala, P.; Hu, Z.; Chen, G. Investigation of the fracture mechanism of level ice with extended finite element method. Ocean Eng. 2022, 260, 112048. [Google Scholar] [CrossRef]
- Li, F.; Kõrgesaar, M.; Kujala, P.; Goerlandt, F. Finite element based meta-modeling of ship-ice interaction at shoulder and midship areas for ship performance simulation. Mar. Struct. 2020, 71, 102736. [Google Scholar] [CrossRef]
- Liu, S.; Thoeni, K.; Feng, R.; Bona, A.; Sarmadivaleh, M. Microstructure-based modelling of hydraulic fracturing in silicified metamorphic rock using the cohesive element method. Eng. Fract. Mech. 2022, 276, 108912. [Google Scholar] [CrossRef]
- Liu, Y.; Shi, W.; Wang, W.; Li, X.; Qi, S.; Wang, B.; Michailides, C. Investigation on the interaction between ice and monopile offshore wind turbine using a coupled CEM–FEM model. Ocean Eng. 2023, 281, 114783. [Google Scholar] [CrossRef]
- Wang, F.; Zou, Z.J.; Zhou, L.; Ren, Y.Z.; Wang, S.Q. A simulation study on the interaction between sloping marine structure and level ice based on cohesive element model. Cold Reg. Sci. Technol. 2018, 149, 1–15. [Google Scholar] [CrossRef]
- Wang, F.; Zhou, L.; Zou, Z.J.; Song, M.; Wang, Y.; Liu, Y. Study of continuous icebreaking process with cohesive element method. Brodogr. Teor. Praksa Brodogr. Pomor. Teh. 2019, 70, 93–114. [Google Scholar] [CrossRef]
- Patil, A.; Sand, B.; Cwirzen, A.; Fransson, L. Numerical prediction of ice rubble field loads on the Norströmsgrund lighthouse using cohesive element formulation. Ocean Eng. 2021, 223, 108638. [Google Scholar] [CrossRef]
- Feng, D.; Pang, S.D.; Zhang, J. Parameter sensitivity in numerical modelling of ice-structure interaction with cohesive element method. In Proceedigns of the International Conference on Offshore Mechanics and Arctic Engineering; American Society of Mechanical Engineers: New York, NY, USA, 2016; Volume 49996, p. V008T07A012. [Google Scholar]
- Zhan, K.; Wan, D.; Yuan, Z. Cohesive Element Method for Ice Load on Conical Structures. In Proceedings of the 30th International Ocean and Polar Engineering Conference, Online, October 2020; OnePetro: Richardson, TX, USA, 2020. [Google Scholar]
- Wang, S.; Ji, S. Coupled DEM-FEM analysis and high-performance algorithm for ice-excited vibration of an offshore platform with conical conduit rack. J. Oceanogr. 2017, 39, 98–108. [Google Scholar]
- Dugdale, D.S. Yielding of steel sheets containing slits. J. Mech. Phys. Solids 1960, 8, 100–104. [Google Scholar] [CrossRef]
- Barenblatt, G.I. The mathematical theory of equilibrium cracks in brittle fracture. Adv. Appl. Mech. 1962, 7, 55–129. [Google Scholar]
- Liu, J.; Li, J.; Wu, B. The cohesive zone model for fatigue crack gsheetth. Adv. Mech. Eng. 2013, 5, 737392. [Google Scholar] [CrossRef]
- Hillerborg, A.; Modéer, M.; Petersson, P.E. Analysis of crack formation and crack gsheetth in concrete by means of fracture mechanics and finite elements. Cem. Concr. Res. 1976, 6, 773–781. [Google Scholar] [CrossRef]
- Shi, C. Investigation on Mechanism of Marine Structure-Sea Ice Collision Using Finite Element Method; Shanghai Jiao Tong University: Shanghai, China, 2017. [Google Scholar]
- Poblete, F.R.; Mondal, K.; Ma, Y.; Dickey, M.D.; Genzer, J.; Zhu, Y. Direct measurement of rate-dependent mode I and mode II traction-separation laws for cohesive zone modeling of laminated glass. Compos. Struct. 2022, 279, 114759. [Google Scholar] [CrossRef]
- De Oliveira, L.A.; Donadon, M.V. Delamination analysis using cohesive zone model, A discussion on traction-separation law and mixed-mode criteria. Eng. Fract. Mech. 2020, 228, 106922. [Google Scholar] [CrossRef]
- Kuutti, J.; Kolari, K.; Marjavaara, P. Simulation of ice crushing experiments with cohesive surface methodology. Cold Reg. Sci. Technol. 2013, 92, 17–28. [Google Scholar] [CrossRef]
- Lu, W.; Lubbad, R.; Løset, S. Simulating ice-sloping structure interactions with the cohesive element method. J. Offshore Mech. Arct. Eng. 2014, 136, 031501. [Google Scholar] [CrossRef]
- Qissab, M.A. Flexural Behavior of Laterally Loaded Tapered Piles in Cohesive Soils. Open J. Civ. Eng. 2015, 5, 29. [Google Scholar] [CrossRef]
- Timco, G.W.; Weeks, W.F. A review of the engineering properties of sea ice. Cold Reg. Sci. Technol. 2010, 60, 107–129. [Google Scholar] [CrossRef]
- Konuk, I.; Yu, S. A cohesive element framework for dynamic ice-structure interaction problems, Part III—Case studies. Int. Conf. Offshore Mech. Arct. Eng. 2010, 49125, 801–809. [Google Scholar]
- Diehl, T. On using a penalty-based cohesive-zone finite element approach, Part I, Elastic solution benchmarks. Int. J. Adhes. Adhes. 2008, 28, 237–255. [Google Scholar] [CrossRef]
- Shabanijafroudi, N.; Ganesan, R. A penalty function based delamination model for postbuckling analysis of composite plates with delamination. Compos. Struct. 2021, 261, 113273. [Google Scholar] [CrossRef]
- Xiang, Y.; Lin, H.; Bai, B.; Chen, Z.; Yang, Y. Numerical simulation and experimental study of submerged floating tunnel subjected to moving vehicle load. Ocean Eng. 2021, 235, 109431. [Google Scholar] [CrossRef]
- Torabi, H.; Rayhani, M.T. Equivalent-linear pile head impedance functions using a hybrid method. Soil Dyn. Earthq. Eng. 2017, 101, 137–152. [Google Scholar] [CrossRef]
- Zhang, G.H. Equivalent pile calculation. China Offshore Oil Gas 1989, 1, 1–6. [Google Scholar]
- American Petroleum Institute. Recommended Practice for Planning, Designing, and Constructing Fixed Offshore Platforms; American Petroleum Institute: Washington, DC, USA, 1989. [Google Scholar]
- Q/Hsn 3000-2002; Regulations for Offshore Ice Condition & Application in China Sea. China National Offshore Oil Corporation: Beijing, China, 2002.
Figure 1.
Failure process of inlay of cohesive element [
29].
Figure 1.
Failure process of inlay of cohesive element [
29].
Figure 2.
Tractor-separation rule of cohesive element [
32].
Figure 2.
Tractor-separation rule of cohesive element [
32].
Figure 3.
Simulation of bending damage and accumulation of broken ice in ice sheet by the cohesive element method.
Figure 3.
Simulation of bending damage and accumulation of broken ice in ice sheet by the cohesive element method.
Figure 4.
Comparison of simulation and experimental results: (a) Ice load time curve; (b) Frequency spectrum.
Figure 4.
Comparison of simulation and experimental results: (a) Ice load time curve; (b) Frequency spectrum.
Figure 5.
Finite element modeling of marine lift station platforms.
Figure 5.
Finite element modeling of marine lift station platforms.
Figure 6.
Sea-ice squeezing and breaking process at 20 s under different ice speeds: (a) 0.3 m/s ice speed; (b) 0.6 m/s ice speed; (c) 0.9 m/s ice speed; (d) 1.2 m/s ice speed.
Figure 6.
Sea-ice squeezing and breaking process at 20 s under different ice speeds: (a) 0.3 m/s ice speed; (b) 0.6 m/s ice speed; (c) 0.9 m/s ice speed; (d) 1.2 m/s ice speed.
Figure 7.
Sea ice crushed out of contact after breakup.
Figure 7.
Sea ice crushed out of contact after breakup.
Figure 8.
Horizontal ice load time course curves for different ice velocities.
Figure 8.
Horizontal ice load time course curves for different ice velocities.
Figure 9.
Comparison of peak mean horizontal ice loads at different ice velocities.
Figure 9.
Comparison of peak mean horizontal ice loads at different ice velocities.
Figure 10.
Time–history curves of horizontal acceleration of the deck at different ice velocities.
Figure 10.
Time–history curves of horizontal acceleration of the deck at different ice velocities.
Figure 11.
Schematic diagram of sea ice interacting with a jacket platform.
Figure 11.
Schematic diagram of sea ice interacting with a jacket platform.
Figure 12.
Shielding effect on piles #2 and #3 at 15 degrees ice direction.
Figure 12.
Shielding effect on piles #2 and #3 at 15 degrees ice direction.
Figure 13.
Horizontal acceleration of the jacket platform ice direction from 0 degrees to 360 degrees deck level.
Figure 13.
Horizontal acceleration of the jacket platform ice direction from 0 degrees to 360 degrees deck level.
Figure 14.
Schematic diagram of ice-breaking cones: (a) Ice-breaking cones with the same cone diameter and different cone angles; (b) Cone at a fixed height.
Figure 14.
Schematic diagram of ice-breaking cones: (a) Ice-breaking cones with the same cone diameter and different cone angles; (b) Cone at a fixed height.
Figure 15.
Finite element model of ice-breaking cone interaction with sea ice.
Figure 15.
Finite element model of ice-breaking cone interaction with sea ice.
Figure 16.
Comparison of mean horizontal ice loads for different cone angles.
Figure 16.
Comparison of mean horizontal ice loads for different cone angles.
Figure 17.
Comparison of ice load timescales on upper and lower cone surfaces: (a) Lower cone surface; (b) Upper cone surface.
Figure 17.
Comparison of ice load timescales on upper and lower cone surfaces: (a) Lower cone surface; (b) Upper cone surface.
Figure 18.
Horizontal acceleration of the deck at different cone angles.
Figure 18.
Horizontal acceleration of the deck at different cone angles.
Figure 19.
Horizontal ice load and deck acceleration of crash cone at different cone angles.
Figure 19.
Horizontal ice load and deck acceleration of crash cone at different cone angles.
Table 1.
Material Parameters for cone.
Table 1.
Material Parameters for cone.
| Parameters | Unit | Numerical Value |
|---|
| Density | kg/m3 | 7850 |
| Modulus of elasticity | GPa | 200 |
| Poisson’s ratio | - | 0.3 |
Table 2.
Material parameters of sea ice.
Table 2.
Material parameters of sea ice.
| Type of Element | Material Parameter | Unit | Numerical Value |
|---|
| Solid element | Density | kg/m3 | 920 |
| Elastic modulus | GPa | 5 |
| Poisson ratio | - | 0.3 |
| Compressive strength | MPa | 2.0 |
| Failure strain | - | 0.25 |
| Cohesive element | Density | kg/m3 | 920 |
| Elastic modulus | GPa | 50 |
| Damage initiation stress | MPa | 1.04 |
| Fracture energy | J/m2 | 30 |
Table 3.
Comparison of experimental and simulation results.
Table 3.
Comparison of experimental and simulation results.
| Parameters | Unit | Experimental Values | Simulated Value Difference |
|---|
| Average ice load | kN | 111.9 | 105.7 (5.54%) |
| Peak ice load | kN | 369.4 | 401.1 (8.58%) |
| Standard Deviation | kN | 84.1 | 100.8 (19.8%) |
Table 4.
Structural parameters of Jacket platform.
Table 4.
Structural parameters of Jacket platform.
| Parameters | Unit | Value |
|---|
| Height of Jacket foundation | m | 52.70 |
| Depth of pile leg below soil layer | m | 27.70 |
| Leg pipe pile diameter | m | 1.2 |
| Outer diameter of inclined support rod | m | 0.6 |
| Outside diameter of the transverse support rod | m | 0.8 |
| Thickness of pile leg pipe | m | 0.08 |
| Diagonal support rod thickness | m | 0.03 |
| Transverse support rod thickness | m | 0.04 |
| Superstructure weight | t | 1770 |
| Platform left overhang | m | 12 |
| Platform right overhang | m | 7.5 |
Table 5.
Material parameters of Jacket platform.
Table 5.
Material parameters of Jacket platform.
| Parameters | Unit | Value |
|---|
| Density | kg/m3 | 7850 |
| Young’s modulus | GPa | 206 |
| Poisson’s ratio | - | 0.3 |
| Underwater equivalent density | kg/m3 | 11,882.2 |
Table 6.
Peak standard deviation of horizontal ice load at different ice velocities.
Table 6.
Peak standard deviation of horizontal ice load at different ice velocities.
| Ice Speed (m/s) | 0.3 | 0.6 | 0.9 | 1.2 |
|---|
| Number of samples | 21 | 31 | 45 | 34 |
| Standard deviation (kN) | 201.8 | 121.1 | 147.8 | 142.0 |
Table 7.
The maximum horizontal acceleration of the deck at different ice velocities.
Table 7.
The maximum horizontal acceleration of the deck at different ice velocities.
| Ice Speed (m/s) | 0.3 | 0.6 | 0.9 | 1.2 |
|---|
| Accelerations (m/s2) | 0.37368 | 0.39261 | 0.40468 | 0.41302 |
Table 8.
Frequency corresponding to peak acceleration for different cone angles.
Table 8.
Frequency corresponding to peak acceleration for different cone angles.
| Cone Angle (°) | 30 | 37.5 | 45 | 52.5 | 60 | 67.5 |
|---|
| Frequency (Hz) | 1.557 | 1.457 | 1.558 | 1.406 | 1.508 | 1.407 |
Table 9.
Relationship between cone angle and cone diameter.
Table 9.
Relationship between cone angle and cone diameter.
| Cone Angle (°) | 30 | 37.5 | 45 | 52.5 | 60 | 67.5 |
|---|
| Cone diameter (m) | 12.8 | 10.0 | 8.6 | 7.2 | 6.1 | 5.1 |
Table 10.
Comparison of the effect of ice-breaking cones with different cone angles.
Table 10.
Comparison of the effect of ice-breaking cones with different cone angles.
| Condition | Maximum Acceleration (m/s2) | Discount Rate |
|---|
| Without ice-breaking cone | 0.3926 | - |
| 30° | 0.2515 | 36% |
| 37.5° | 0.1673 | 57% |
| 45° | 0.1523 | 61% |
| 52.5° | 0.1470 | 63% |
| 60° | 0.1795 | 54% |
| 67.5° | 0.2337 | 40% |
| Disclaimer/Publisher’s Note: The statements, opinions and data contained in all publications are solely those of the individual author(s) and contributor(s) and not of MDPI and/or the editor(s). MDPI and/or the editor(s) disclaim responsibility for any injury to people or property resulting from any ideas, methods, instructions or products referred to in the content. |
© 2023 by the authors. Licensee MDPI, Basel, Switzerland. This article is an open access article distributed under the terms and conditions of the Creative Commons Attribution (CC BY) license (https://creativecommons.org/licenses/by/4.0/).


 ,
, 


