1. Introduction
The marine industry, which consumes low-quality fuels, is responsible for a considerable amount of greenhouse gas (GHG) emissions and has been implementing various regulations to reduce them. To regulate GHG emissions in the marine industry, the International Maritime Organization (IMO), a specialized agency of the United Nations, developed a global strategy to reduce GHG emissions from ships. This strategy, adopted in 2018, aims to reduce total annual GHG emissions from international shipping by at least 50% below 2008 levels by 2050 and to phase them out completely [
1]. To implement this, the IMO introduced mandatory measures to reduce GHG emissions from ships, such as the energy efficiency design index (EEDI) to ensure that new ships are designed to be energy efficient, and the ship energy efficiency management plan (SEEMP) as a plan to improve a ship’s energy efficiency and reduce emissions.
While large vessels are actively responding to climate change issues through various regulations, this is not the case for small vessels, which mostly consist of fishing vessels. Small vessels use small, older engines and operate in challenging sea conditions, leading to increased fuel consumption, which in turn causes increased GHG emissions, as opposed to the large, modern engines of large vessels. Particularly, GHG emissions per unit of power or per unit of fuel usage on small vessels are higher than on larger vessels. However, regulations such as EEDI and SEEMP mentioned above are generally aimed at reducing GHG emissions from large commercial vessels but not small vessels.
The main reason that these IMO regulations do not apply to small vessels is that their GHG emissions are relatively low compared to large vessels. This may seem reasonable when comparing individual ships, but not when comparing small vessels as a whole to large vessels. When comparing the share of global GHG emissions, the IMO reports that those from the marine industry account for 2.89% [
2]. Contrastingly, GHG emissions from all fishing vessels account for 0.5%, out of which fishing vessels under 12 m in length account for 85% of all small vessels [
3]. Especially, GHG emissions from small fishing vessels account for approximately 17.3% of total marine industry emissions, which is not a small amount.
Various alternative fuels have been studied to reduce GHG emissions from small vessels. These include biodiesel, liquefied natural gas (LNG), electric propulsion, hydrogen fuel cells, and liquefied petroleum gas (LPG). Various methods for producing environmentally ecofriendly biodiesel have been proposed [
4,
5]. Lin C-Y investigated the effect of blending different weight ratios of biodiesel with two conventional fishing boat fuels and found that biodiesel can improve inferior fuel properties and that blending sulfur-free biodiesel can reduce the sulfur content of high-sulfur fishing boat fuels [
6]. Korshunov et al., presented results showing that adding ester-based vegetal oil to hydrated diesel fuel and adding bio-additives to diesel fuel can decrease exhaust gas emissions [
7,
8]. Kondrasheva et al., conducted a study on environmentally friendly diesel fuel production by incorporating various wear-resistant bio-additives derived from different sources [
9]. Hosseinzadeh-Bandbafha et al., presented state-of-the-art methodologies for the life cycle assessment (LCA) of biodiesel production from waste cooking oil [
10]. The emission of biodiesel for diesel engines was predicted using a numerical method [
11]. However, Saluja et al., states that when biodiesel is stored, it is vulnerable to oxidation due to environmental factors such as air, moisture, light, etc. [
12]. In addition, it is more expensive than conventional diesel fuel and uses crops such as soybean or palm oil as raw materials, potentially affecting food security.
LNG fuel was the most researched green fuel of the 2010s. It has lower carbon and sulfur contents than gasoline and marine diesel, the conventional fuels for small vessels, and its application in ships operating in emission control areas (ECAs) has been recognized as important. Attah et al., proposed and analyzed amendments to the EEDI baseline values for LNGC and proposed how to include methane slip emissions in current EEDI calculations [
13]. Jafarzadeh et al., and Du et al., analyzed the problems associated with the LNG system and proposed a systems engineering approach and a new propulsion system, respectively [
14,
15]. Jeong et al., developed an improved hybrid decision-making model that is applied to integrate the economic, environmental, and technical performance of three LNG-fueled engine systems (ultra-steam turbine, four-stroke medium speed engine, and two-stroke low speed engine) [
16]. However, while LNG can be used to satisfy environmental regulations, solutions are needed to address the increasing capital costs due to the complexity of installation, safety requirements, and increased space required. Furthermore, methane, which makes up the majority of LNG fuel, is a major GHG, and there are still issues to be addressed such as boil-off and methane-slip in LNG systems.
Recently, electric propulsion systems are the most active areas of research as an alternative to address air pollution caused by GHG emissions. Therefore, pure electric propulsion systems and hybrid systems that combine conventional engines and electric propulsion systems have been proposed. Kim et al., conducted a case study on the application of a battery hybrid system for fishing boats in South Korea and analyzed the effect of reducing CO
2 emissions [
17]. In addition, it their work demonstrated that the CO
2 emissions by the controller are lower compared to the option of introducing load-sharing optimal control. Wang et al., demonstrated that battery-powered systems reduce life cycle GHG by approximately 30% and reduce life cycle cost by 15% when utilizing grid mix electricity in 2019 compared to conventional power systems [
18]. Jeong et al., confirmed that the impact of battery application is far from zero-emission shipping from a life cycle perspective [
19]. The disadvantage of electric propulsion systems is that the GHG emissions in the electricity production stage vary by country, so even if a ship is equipped with the same electric propulsion system, the GHG emissions for the life cycle may vary by country, so it is difficult to conclude that electric propulsion systems are necessarily eco-friendly.
Hydrogen fuel cells are being researched for eco-friendly ships in conjunction with the electric propulsion systems mentioned above. Here, there are two ways to use hydrogen directly as a fuel and supply it to the fuel cell, and a way to convert ammonia fuel into hydrogen through a reformer and supply it to the fuel cell. To provide a roadmap for life cycle clean shipping, Park et al., proposed one system that uses hydrogen as a fuel for fuel cells and a battery and solar power generation system as a backup to store onshore power and another system that uses ammonia as a direct fuel and a battery and solar power generation system as a backup [
20]. They found that both systems have the effect of reducing GHG emissions compared to conventional fossil fuels. Arrigoni et al., conducted an environmental impact assessment of the life cycle of hydrogen fuel cells, evaluating the influence of durability and performance degradation. Including durability when performing LCA of hydrogen fuel cells in the future is recommended [
21]. Chalaris et al., investigated the environmental impact of ammonia in maritime activities regarding its life cycle and global warming potential and demonstrated that ME-LGI engines can reduce the carbon footprint of ships when considering the production route [
22]. However, hydrogen and ammonia are challenging fuels to handle. Hydrogen fuel must be kept at a low temperature of −253 °C and very high pressure to be transported and stored as a liquid. To compensate for this, hydrogen can be converted to ammonia for transportation and storage, but ammonia is toxic as a fuel in its own right and requires considerable care in transportation and storage.
LPG is one of the cleaner fuels and is being explored for use in small vessels as an alternative to traditional fuels such as gasoline and diesel. Eva et al., found that LPG fuel is an attractive fuel option for storage and transportation [
23]. Hu et al., utilized LCA to evaluate the environmental impact of using LNG as a replacement for large vehicle diesel. Proposed policy recommendations suggest the modification of regulations that hinder the efficiency improvement of LNG engines and the introduction of incentives for technological development [
24]. Chun et al., studied the application of small vessels with electric propulsion systems using LPG engines as generators [
25]. Sarkan et al., and Nemoianu et al., studied the application of LPG engines as a replacement for gasoline and diesel engines, respectively, and both studies found that LPG engines performed better on exhaust emission assessments compared to gasoline and diesel engines [
26,
27]. This shows that LPG not only offers storage and transportation advantages but also performs well on emission assessments. It also has many other advantages, such as easy conversion without major changes to the engine or fuel system, low sulfur content similar to LNG fuel, and much easier BOG control than LNG, making it applicable to ships and small vessels sailing in ECA zones.
Bio-liquefied petroleum gas (Bio LPG) is a renewable form of fuel with similar properties to LPG. It is produced from soybean or palm oil, as well as bio-waste or other renewable resources. OGI et al., and Amer et al., researched the production of Bio LPG from biomass and amino acids and found that its production using these materials is sustainable [
28,
29]. As such, the use of Bio LPG in small vessels provides the same benefits as conventional LPG, with the added benefit of being a renewable fuel. The production of Bio LPG can also considerably reduce GHG emissions compared to gasoline, marine diesel, and LPG, which are the current fuels for small vessels.
This study investigates the life cycle of LPG and Bio LPG, a renewable LPG fuel, as one of the environmentally friendly fuels, in terms of GHG emissions from the propulsion system of small vessels. This study proposes to accomplish the following objectives: (1) collect data necessary to conduct this study, and input suitable or applicable data from past studies, (2) conduct an environmental impact assessment of the life cycle of each fuel, (3) conduct an environmental impact assessment of the entire life cycle of the fuel for small vessels, (4) compare the quantified results of the environmental impact assessment of the life cycle of small vessels for each fuel and determine how each fuel contributes to the environmental performance of small vessels, and (5) discuss and identify key findings to answer fundamental questions.
2. Literature Review
LPG is a widely used fuel in the residential, commercial, and industrial sectors due to its clean-burning properties and high energy density. Meanwhile, Bio LPG is a renewable energy that replaces conventional LPG produced from renewable energy sources such as organic waste and biomass. This article introduces LCA as a methodology for conducting an environmental impact assessment for LPG as a green energy source and for the application of Bio LPG in small vessels and explores the application of LCA in the marine industry. Next, the application of LPG fuel and engines in the marine industry and small fishing vessels was discussed, followed by the application of LCA in LPG fuel and engines. Finally, the application of LCA to biofuel and Bio LPG was explored.
First, in terms of research methodology, LCA techniques have been used in environmental impact assessment for decades. LCA is a method used to assess the environmental impact of a product or process during its production, use, and disposal phases. LCA considers the entire life cycle of a product, including raw material acquisition, manufacturing, packaging, transportation, use, and disposal, and is a comprehensive tool that provides a holistic approach to environmental impact assessment. It helps to identify environmental hotspots and opportunities for improvement, making it an important tool for decision-making in industry, policy, and research. The international organization for standardization (ISO) has developed a set of standards for conducting LCA studies that provide a systematic framework for assessing environmental impacts. These standards were revised in 2006 and now include ISO 14040 [
30], which provides principles and framework, and ISO 14044 [
31], which provides requirements and guidelines, as the standards for conducting LCA studies.
Despite these international standards, LCA research has had setbacks since it has been applied in a variety of conditions and scopes, with different results. Testa et al., proposed and demonstrated the effectiveness of a collaborative approach to overcome barriers to LCA adoption [
32]. However, there is little research on a comprehensive analysis of the specific obstacles or challenges organizations face when adopting LCA. To address some of the shortcomings in the adoption of LCA in the marine industry, the IMO is developing guidelines for life cycle GHG emissions. The guidelines aim to address the above shortcomings and transform existing LCA studies in the marine industry from tank-to- wake (TtW) to well-to-wake (WtW), which includes well-to-tank (WtT) and TtW.
Many studies have been conducted on the application of LCA in the marine industry. Ling-Chin et al., conducted an LCA study of three power systems based on the existing diesel power system of a ship, a modified power system, and a newly configured system [
33]. Wang et al., showed that LCA can provide information to owners and shipyards to facilitate reliable long-term maintenance decisions [
34]. Jeong et al., conducted a life cycle analysis of a ship propulsion system from an economic and environmental perspective using the modularity concept [
35]. Jang et al., conducted an LCA of a SO
X reduction scrubber system, equipment used to respond to international marine regulations [
36]. Onal et al., conducted an environmental impact assessment using LCA for the steel hull building and end-of-life stages of a ship [
37]. Bui et al., performed a life cycle cost and environmental analysis of a dual-fuel engine for a ship and compared it to a conventional diesel engine [
38]. The scope of LCA in the marine industry is expanding from power systems and propulsion systems to ship accessories and hull materials, and recently to dual-fuel engines used in ships. However, the application of LCA in the marine industry is mostly limited to large vessels, and there are not many studies on its application to small fishing vessels. Most of the LCA applications for small fishing vessels have focused on fish products or fishing methods, and studies on GHGs generated through operations have recently been conducted by Greer et al., and Jeong et al. [
39,
40]. However, these studies also have the disadvantage of examining global trends using historical data or simulation, failing to conduct LCA research using actual small fishing vessel data.
Next, looking at existing research on LPG fuel or engines, Yeo et al., studied the feasibility of LPG fuel as a marine fuel [
41]. This study suggests that LPG fuel can reduce emissions compared to conventional marine fuels, while also reducing fuel costs. However, the study concluded that LPG fuel is more environmentally friendly than conventional marine fuels based on a comparison of TtW emissions from combustion in the engine. Fuel costs also have limitations, such as not considering tax exemptions for each fuel. Kim et al., conducted a study using an LCA approach for LPG and diesel vehicles in South Korea and found that LPG vehicles are more favorable than diesel vehicles in terms of GHG emissions [
42]. However, it may not be applicable in regions with different energy sources and production methods, and it assumes that fuel efficiency remains constant regardless of fuel type.
Studies on LPG engines for small fishing vessels were conducted by Murillo et al., and Baruno et al. [
43,
44]. Murillo et al., compared conventional small fishing vessel engines, particularly gasoline and diesel engines, with LPG engines. They found that LPG engines offer substantial reductions in fuel consumption and pollutant emissions compared to conventional engines [
43]. Baruno et al., also compared gasoline engines in conventional small fishing vessels with LPG engines. They found a payback period for the cost of the LPG engine conversion kit to be amortized through fuel savings combined with reduced fuel consumption [
44]. However, both studies were conducted in a laboratory and did not take into account the unique characteristics of small fishing vessels, which vary in operating hours and are highly dependent on sea conditions for engine performance.
There have been a few attempts to study LPG fuel and engines from a life cycle perspective. Afrane et al., conducted a life cycle environmental impact assessment of LPG as a cooking fuel compared to other fuels [
45]. Unnasch et al., conducted an LCA of the suitability of LPG fuel as a transportation fuel for the California low-carbon fuel standard [
46]. Kim et al., compared the results of LCAs for LPG and diesel fuels used as automotive fuels in South Korea [
42]. However, these studies are limited to the LCA of LPG fuels and LPG engines in land vehicles, and there are no LCA applications of LPG fuels and engines in small vessels.
Recently, biofuels, which utilize organic matter or biomass, such as plant material, agricultural and forestry residues, and waste, for renewable energy, have gained prominence. Biofuels can be categorized into first-generation biofuels produced from edible crops such as corn, sugarcane, and vegetable oils [
47,
48] and second-generation biofuels produced from non-edible crops [
49,
50], with active research in each area. Currently, there is a trend to study the life cycle of biofuels produced from specific materials rather than simply studying the production of biofuels from various materials. Fokaides et al., presented the main issues in LCA of biofuel production [
51]. In particular, issues raised by key assumptions and alternative biofuel production systems were presented. However, key assumptions are inevitable in complex environmental impact assessments. Roque et al., presented an LCA of the use of diesel, hydrotreated vegetable oils such as palm oil and soybean oil, and bioethanol under different operating conditions in a diesel engine for small-scale electricity generation [
48]. However, they omit the maritime transportation of materials, which has a considerable impact on global warming potential (GWP) values. Tanzer et al., conducted a study on the application of biofuels as marine fuels and found that the life cycle emissions of GHGs and SO
X are lower than fossil fuels [
52]. However, they also found that marine biofuels are three times more expensive than fossil fuels.
Among the various biofuels, Bio LPG has been recognized as the future green fuel to replace LPG due to its advantages such as renewability, lower carbon emissions, no charges for infrastructure, higher efficiency, and reduced dependence on fossil fuels. Bio LPG is also being actively researched because it can be produced from a variety of feedstocks, such as the biofuels described above. Amer et al., presented a blueprint for the production of Bio LPG fuel by converting waste volatile fatty acids into bacterial cultures [
53]. However, there are no results on GHG reductions compared to conventional fuels or emission factors for comparison. Brynolf et al., compared the life cycle environmental performance of LNG, liquefied biogas, methanol, and bio-methanol as marine fuels and found liquefied biogas and bio-methanol to have the potential to reduce climate impact [
54]. However, it was also noted that the engine performance of methanol has not been validated. Nevertheless, the liquefied biogas presented in this study has a similar molecular formula as LNG, which is different from the molecular structure of Bio LPG, so it is difficult to consider Bio LPG fuel as a marine fuel.
Although various studies on LPG and Bio LPG have been conducted, there are no studies on LPG and Bio LPG fuels and engines that apply LCA techniques to small vessels. Therefore, to overcome the above shortcomings of existing studies on LPG and Bio LPG fuels and engines, we believe that there is value in applying the LCA method to small fishing vessels, which are not regulated by the IMO but emit a substantial amount of GHGs. As a new study to expand the application of LCA research in the marine industry, which has been focused on TtW, to WtW, a study on the GHGs generated by the application of LPG and Bio LPG fuels to small vessels is warranted.
3. Evaluation Framework
The application of the LCA method to LPG and Bio LPG was conducted as follows. First, the scope of this LCA study was specified along with the goals to be achieved through LCA. Within the specified scope, individual inventories to achieve the LCA goal were detailed, data were collected for input, outputs were derived, and the derived outputs were used to evaluate the potential environmental impacts on GHG emissions of each fuel using GWP. Finally, the inventory and impact assessment are used to identify key drivers affecting environmental impact.
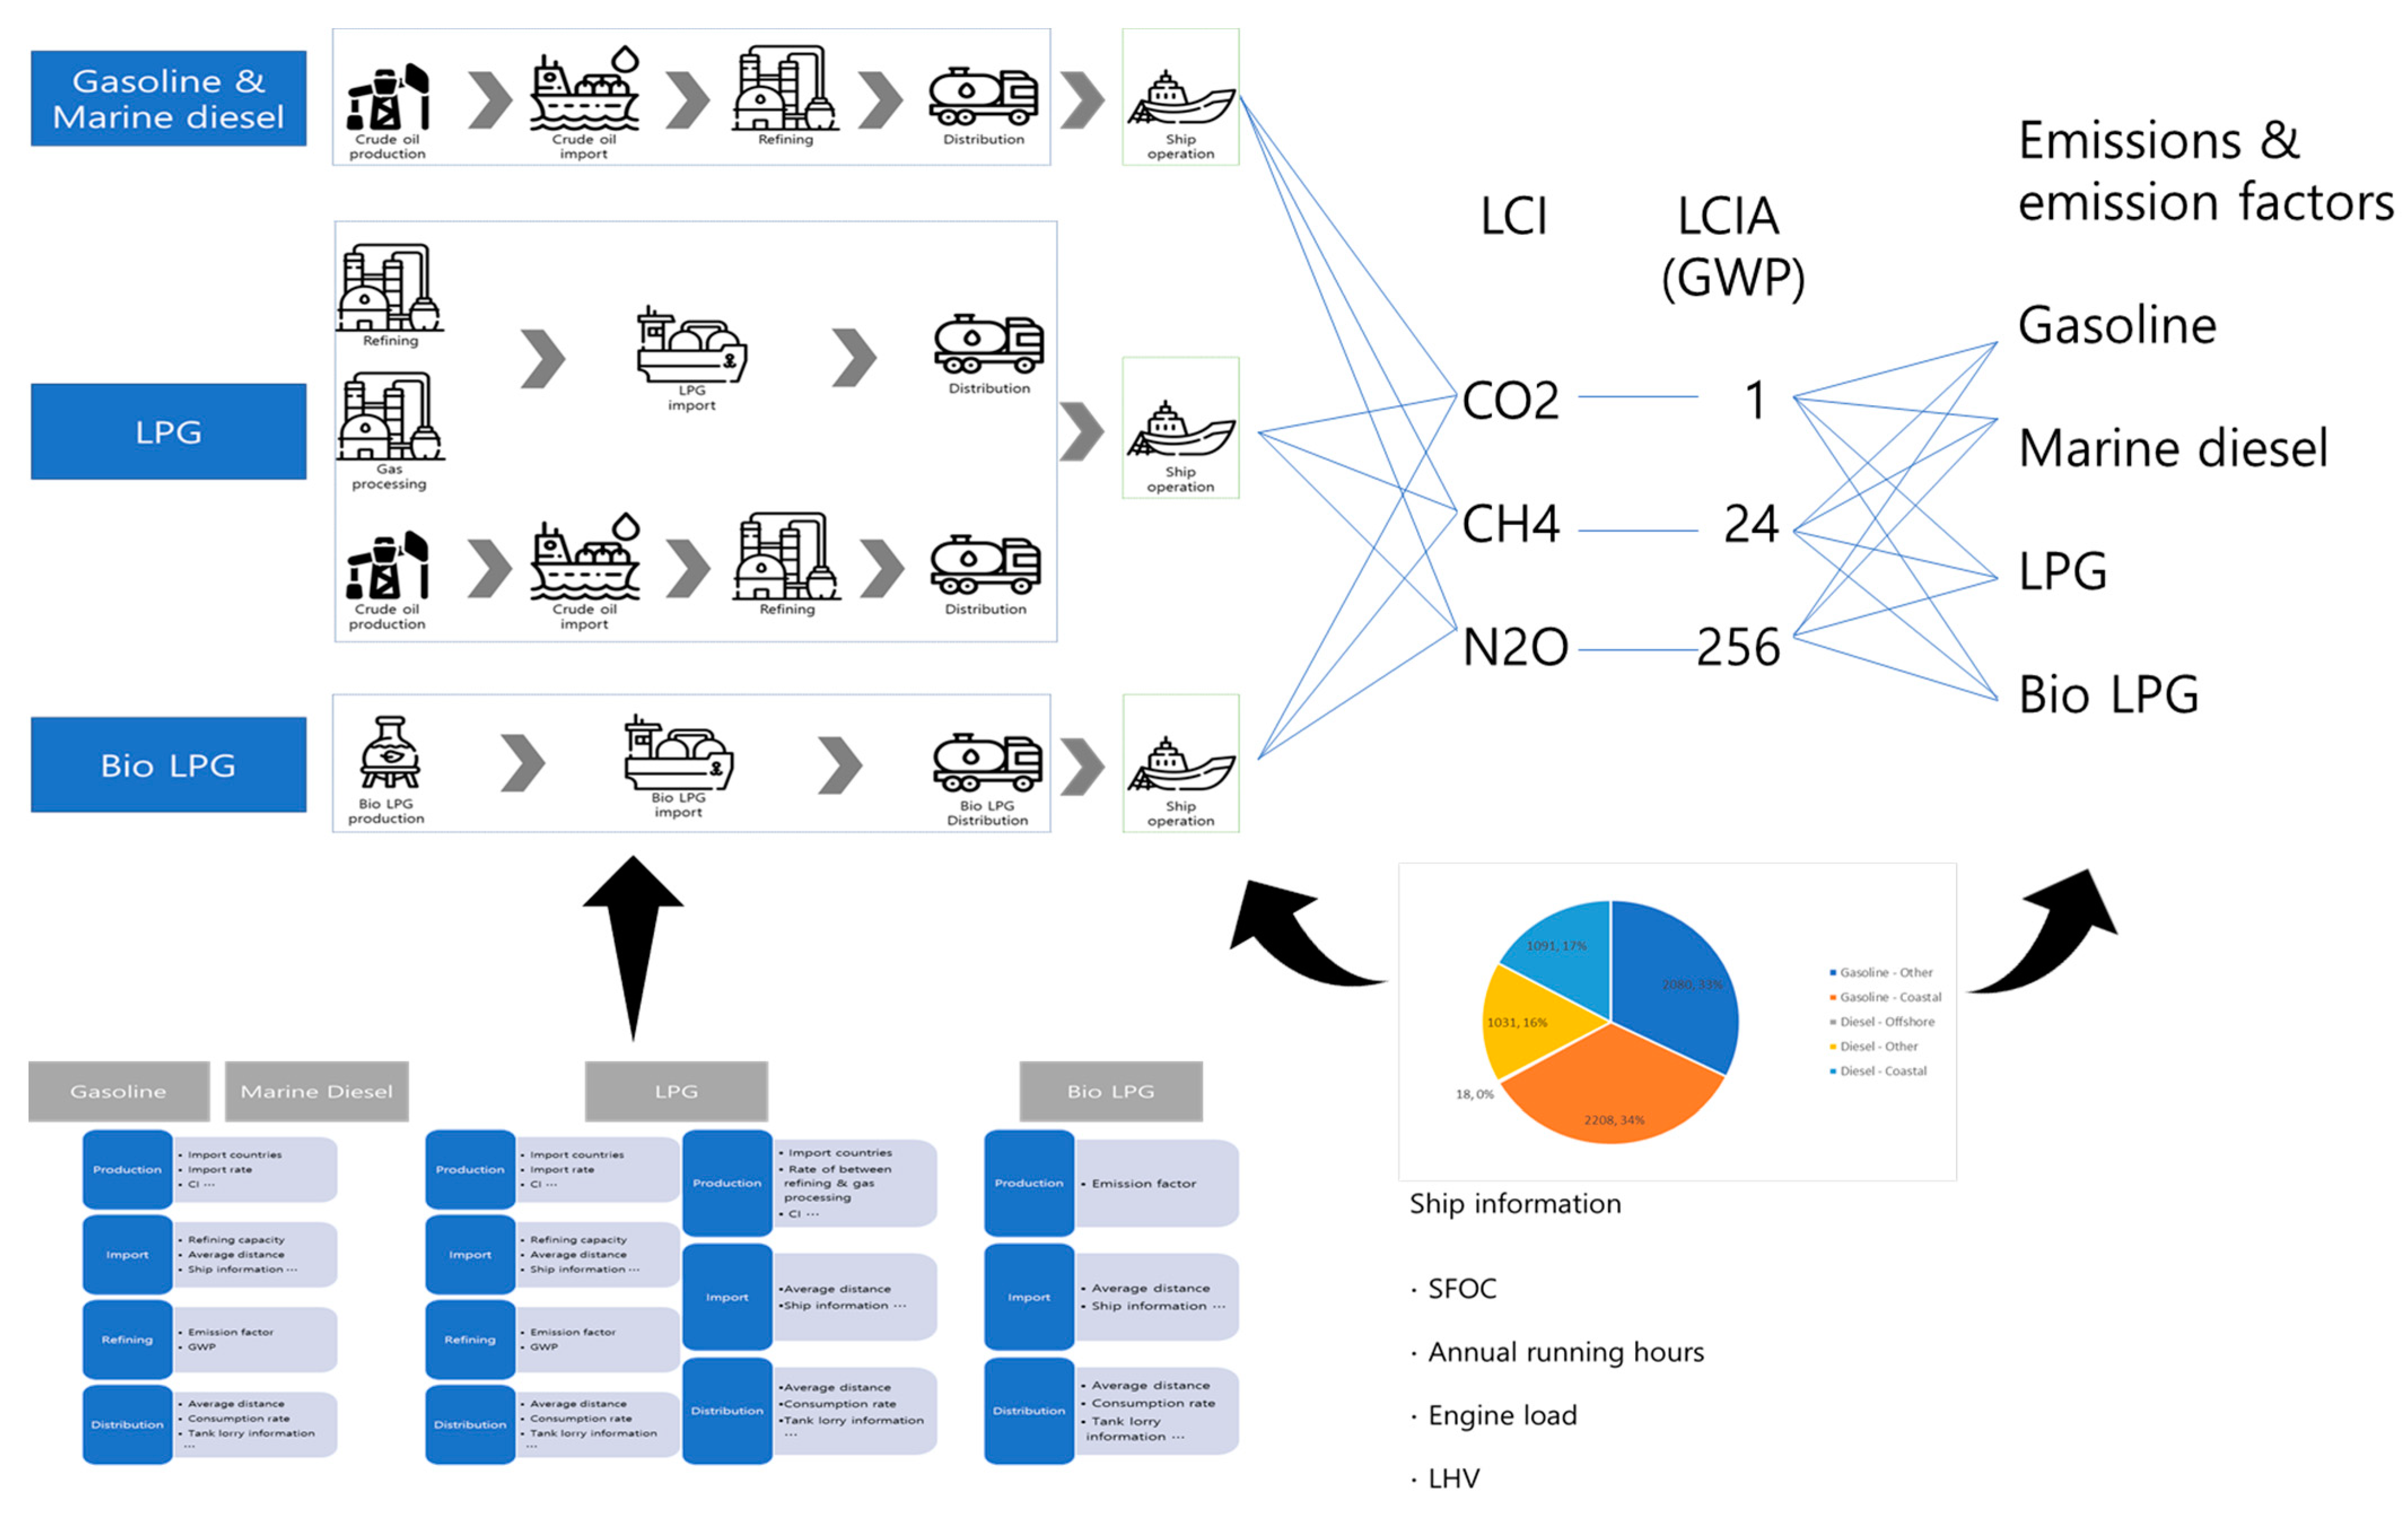
Figure 1 shows the flow chart of this study, which applies LCA techniques to LPG and Bio LPG.
3.1. LCA Goal and Scope
This study uses LCA to evaluate the environmental performance in terms of GHG emissions of LPG engines used in small fishing vessels in South Korea. Conventional small fishing vessels are powered by gasoline and diesel engines, which are important components of fisheries in many parts of the world but are known to emit considerable amounts of GHGs. The LCA goal of this study is to evaluate the environmental impact of GHG emissions from conventional and LPG engines on small fishing vessels using the LCA methodology. The LCA scope of this study includes the entire life cycle of each fuel in terms of WtW, including extraction, transportation, refining, distribution, and use. The scope is divided into WtT and TtW, and the output consists of GHGs generated through WtT and TtW, which are differentiated for each fuel.
To determine the warming effect of the various GHGs emitted at each stage, the GWP was applied and converted to a value of CO2 eq per unit energy of the fuel. Given that the hull material of small fishing vessels is fiber-reinforced plastic, the life cycle of the vessel was assumed to be 30 years and the GHG emissions of each fuel were compared over this period. Any assumptions or limitations for conducting the LCA are presented in the individual sections of the LCA inventory.
In this study, the following specific approaches and LCA inventories were used to achieve the targeted LCA goals. First, emission factors were calculated for WtT and TtW, which were separated in the LCA scope. In the case of WtT, it was further subdivided according to the characteristics of each fuel, and emission factors were calculated for each subdivided part. The detailed emission factors for WtT were calculated using various LCA inventories, including fuel exporters, import rates, and the distance between export and import ports. More details are presented in the individual sections. Since GHG emissions from the TtW process account for the largest proportion of the fuel’s lifecycle, the latest emission factors published by a recognized organization were used [
55]. The emission factors for each stage and the annual fuel consumption of each ship were used to calculate the GHG emissions of the ship’s life cycle. The annual fuel consumption of each vessel was calculated using existing research data [
56], such as annual operating hours and load factor [
57], depending on the fuel used and the area of operation [
58].
3.2. LCA Inventories
3.2.1. Boat Selection and Annual Fuel Consumption
This study aims to conduct an LCA of GHG emissions from the application of a 200 kW class LPG engine, which is currently being developed in South Korea for the first time for marine use, on small fishing vessels. Therefore, considering the applicability of the LPG engine under development, fishing vessels that fall within the ±10% deviation range in output were selected as the target vessels of this study. To select the vessels for the study, The data on vessels registered in South Korea as of May 2020 were used and 6428 fishing vessels with 180 to 220 kW engines were selected as the study sample out of a total of approximately 70,000 registered fishing vessels.
Table 1 below shows the distribution of fishing vessels in this study by tonnage, and
Table 2 shows the distribution by the number of engines.
The samples were first divided into gasoline and diesel engines according to engine type and then further divided into fishing zones according to engine type. The Korean Ministry of Oceans and Fisheries’ classification, namely coastal, offshore, and open ocean, was applied, and classified vessels that did not fall into any of these categories or had more than one fishing zone were classified as “other.” Fishing vessels were categorized according to their industry code, and the information on the industry code of fishing vessels to categorize their fishing zones is provided by the Korean government [
51].
Table 3 shows the classification of the sample by engine type and fishing zone.
Information related to the operation of engines is important because GHG emissions from engines account for a considerable portion of the total GHG emissions over the life cycle of fuel. For specific fuel oil consumption (SFOC) information by engine type, it would be desirable to collect the SFOC of individual ships, but since this study has many ships in the study sample, existing research that presents SFOC by breaking down engine power by engine type as a supplementary method was used [
49].
Table 4 shows the SFOC information on gasoline and diesel engines applied in this study.
The annual fuel consumption of a fishing vessel was calculated by taking into account the annual operating hours and an engine load factor of the engine, which varies depending on the moving and working of each fishing zone. This method may be less accurate than using a plotter to calculate the fuel use of individual vessels, but it is a commonly used method that cannot directly collect the fuel use information of individual vessels. In this study, the annual operating hours and engine load factor information for moving and working by fishing zone presented in an existing study were used [
58], as shown in
Table 5.
Based on the data described above, the annual fuel consumption of a ship using gasoline and diesel engines can be calculated using the following equation:
For LPG engines, the annual fuel consumption was calculated as the amount of fuel that produces the same calorific value as the annual use of gasoline and diesel-powered ships.
Table 6 shows the lower heating value (LHV) of each fuel used to calculate the annual fuel consumption of the LPG engine. The LHV of Bio LPG is similar to that of LPG, given that it is chemically identical to LPG.
3.2.2. Emission Factors
The emission factor is an important indicator for determining GHG emissions along with annual fuel consumption. It was calculated by collecting the necessary information for each fuel and stage, and only for the parts that could not be calculated through the collected information, the LCA software greenhouse gases, regulated emissions, and energy use in transportation (GREET) and existing published data were cited [
55].
Emission Factors of Gasoline Fuel
Gasoline-powered ships account for approximately 67% of all ships in the study and are engines that use gasoline as fuel. The WtT of gasoline consists of four stages, as shown in
Figure 1. In this chapter, emission factors are calculated for the entire life cycle of gasoline as a fuel for gasoline-powered ships, which includes four stages of WtT and one stage of TtW.
The gasoline production stage emission factor was calculated by considering the import ratio of crude oil as of 2018 and the carbon intensity (CI) value for each country. The import ratio was calculated based on the import volume of each country, and the CI value of each country’s production stage was based on existing studies (see
Table 7).
Based on the information presented in the table, the emission factor for the gasoline production stage is 8.91 g CO2eq/MJ.
- b.
Import stage emission factor of WtT
The import stage emission factor of gasoline was calculated by considering the refining ratio of each refinery of crude oil as of 2018, the average distance from the exporting country to the importing port considering the refining ratio, import ratio, and the ship information for importing crude oil. There are four refineries in South Korea, and
Table 8 shows the refining capacity and ratio of each refinery, as well as information on the import port based on the location of the refinery.
The average import distance of crude oil was calculated by using the distance information from the exporting country to the importing port. One representative port of each exporting country was selected, and the distance information from the representative port of each exporting country to the domestic crude oil import port was collected. Considering this distance information and the refining ratio, the average distance from each exporting country to South Korea was calculated. This average distance was then multiplied by the import ratio to calculate the final average distance.
Table 9 shows the distance information from each exporting country to the domestic import port and the average distance from each exporting country to South Korea considering the refining ratio.
The overall average distance from each of the exporting countries to South Korea was calculated in
Table 9, taking into account the import ratio, and the result is 8746 nmiles.
To calculate the emission factor of the import stage, information on the vessel used to import crude oil and the import distance were needed. A very large crude oil carrier (VLCC) with a deadweight of 300,000 tons was selected as the vessel used to import crude oil, and 95% of loading conditions and bunker C fuel were assumed. Furthermore, the vessel’s operating speed and fuel consumption were averaged over the laden and ballast voyage based on one year of operating data.
Table 10 shows the ship information for calculating the emission factor for the import stage.
Based on the average distance for crude oil imports and information on VLCCs, the import stage emission factor for gasoline is 0.68 g CO2eq/MJ.
- c.
Refining stage emission factor of WtT
The emission factors of the refining stage for gasoline were obtained from the database of GREET. In this study, only CO
2, CH
4, and N
2O, which are the main three components of GHGs, were used among various air pollutants generated in the refining stage, and the emission factor was calculated using the GWP data presented in the Fifth Assessment Report of the Intergovernmental Panel on Climate Change (IPCC) in 2014.
Table 11 shows the information and GWP values of CO
2, CH
4, and N
2O from the refining stage of gasoline presented in the GREET database.
The emission factor for the refining stage of gasoline, calculated based on the information presented in this table, is 5.28 g CO2eq/MJ.
- d.
Distribution stage emission factor of WtT
The emission factor for the distribution stage for gasoline was calculated using the gasoline consumption ratio by region in Korea as of 2018, the refining capacity ratio of crude oil refineries, and the average transportation distance from the three cities with refineries to each consumption area.
Table 12 shows the information on the distance from the three cities with refining facilities and the consumption ratio.
It is assumed that gasoline is transported in a 15-ton tank-lorry at 95% of loading conditions and diesel is used as fuel.
Table 13 shows information about the average distance and tank-lorry of gasoline considering consumption rates.
Based on the above information, the emission factor for the distribution stage for gasoline is 0.60 g CO2eq/MJ.
- e.
Emission factor of TtW
The emission factors for the TtW of gasoline are from the EPA [
55], and the GWP is from the same source as the refining stage.
Table 14 shows the EPA data for the TtW of gasoline.
Based on the information in the table above, the emission factor of TtW for gasoline is 72.77 g CO2eq/MJ.
Emission Factors of Diesel Fuel
Diesel-powered ships account for approximately 33% of all ships in the study and are engines that use marine diesel as fuel. In this chapter, emission factors are calculated for the entire life cycle of marine diesel as a fuel for diesel-powered ships, which includes the four stages of WtT and one stage of TtW, as for gasoline.
- a.
Production stage emission factor of WtT
This is the same as that of gasoline.
- b.
Import stage emission factor of WtT
This is the same as that of gasoline.
- c.
Refining stage emission factor of WtT
Information from the GREET database was used, and similar GHG pollutant sources and GWP data as gasoline were used.
Table 15 shows the information of CO
2, CH
4, N
2O, and GWP data from the refining stage of marine diesel fuel presented in the GREET database.
Based on the information presented in the table, the emission factor for the refining stage of marine diesel fuel is 3.34 g CO2eq/MJ.
- d.
Distribution stage emission factor of WtT
The emission factor for the distribution stage for marine diesel was calculated as for gasoline.
Table 16 shows the information on the distance and consumption rates from the three cities with refineries for the calculation of the emission factor for the distribution stage for marine diesel fuel.
The transportation method for marine diesel was assumed to be similar to gasoline.
Table 17 shows the information on the average distance and tank-lorry of marine diesel considering consumption rates.
Based on the above information, the emission factor for the distribution stage for marine diesel fuel is 0.57 g CO2eq/MJ.
- e.
Emission factor of TtW
The emission factors [
45] and GWP for TtW of marine diesel are from a similar source as gasoline.
Table 18 shows the emission factor and GWP for TtW of marine diesel fuel.
Based on the information in the table above, the emission factor of TtW for marine diesel fuel is 76.25 g CO2eq/MJ.
Emission Factors of LPG Fuel
LPG-powered ships assume that existing gasoline and diesel-powered ships are converted to LPG engines. In South Korea, LPG fuel is supplied by two LPG importers and four refiners, with a share of 64% and 36%, respectively, in 2018. These ratios were used to calculate the emission factors for each stage of LPG fuel. In the case of LPG importers, the LPG fuel is directly imported from the exporting country. By contrast, in the case of importing through refiners, crude oil is imported and LPG fuel is separated during the refining process. The WtT of LPG fuel consists of three steps through an LPG importer and four steps through refiners. In this chapter, emission factors are calculated for the entire life cycle of LPG fuel, including the WtT and TtW described above.
The emission factor for the production stage of LPG fuel was calculated by dividing the supply through importers and refiners and finally considering the supply ratio. First, the emission factor of the production stage of LPG fuel supplied through LPG importers was calculated by considering the import ratio and CI from LPG exporting countries as of 2018. The import ratio was calculated based on the import volume of each country. The production method of LPG fuel through LPG importers is divided into refinery and gas processing, and the proportion varies depending on each LPG exporting country. The emission factors for refineries and gas processing for each country were obtained from GREET’s database. This study assumes that the GHG emissions from LPG refining in each country’s refineries are similar and does not take into account the step before refining. The same GHG components and GWP data were used for gasoline and marine diesel.
Table 19 shows the GHG components and GWP values for the refining stage of LPG fuel presented in the GREET database.
Based on the information presented in the table, the emission factor for the refining process at the LPG fuel production stage by the LPG importer is 3.63 g CO2eq/MJ.
For gas processing, CH
4 leakage during recovery and processing and CO
2 from venting and flaring were considered. Only the United States was separated into conventional gas (46%) and shale gas (54%), and all other countries were assumed to be using conventional gas.
Table 20 shows the CO
2, CH
4, and GWP values from the gas processing stage.
Based on the information presented in the table, the emission factors for the gas process at the LPG fuel production stage by LPG importers are 4.32 g CO2eq/MJ for the United States and 4.29 g CO2eq/MJ for countries other than the United States.
The collected emission factors of refinery and gas processing were calculated as CIs for each country by applying the refinery and gas processing ratios.
Table 21 shows the emission factors for each country calculated by considering the LPG exporting countries and export volumes as of 2018, import ratio according to export volumes, refinery and gas processing ratios of each country, and emission factors and ratios of the refinery and gas processing stages from the GREET database.
Considering the CIs and import rates for each country in
Table 21, the emission factor for the production stage through LPG importers is 4.23 g CO
2eq/MJ.
The emission factor of the LPG fuel production stage produced by the refinery is similar to that of gasoline and marine diesel fuels, which is 8.91 g CO2eq/MJ. The emission factor for the LPG fuel production stage is 5.91 g CO2eq/MJ considering the supply ratio through the importer and refiner of LPG fuel.
- b.
Import stage emission factor of WtT
Similar to the production stage, the import stage was calculated separately by the LPG importer and refiner and then finally by applying the supply ratio. First, the emission factor for the import stage through LPG importers was calculated using a similar method to that of crude oil. While crude oil was based on refining capacity, LPG imports were based on storage capacity.
Table 22 shows the storage volume information for each region by Korean importers.
The average distance by LPG importers was calculated using a similar method as for crude oil, and
Table 23 shows the average distance from the representative port of the LPG exporting country to each port with LPG storage in Korea, taking into account the storage ratio.
The average distance of LPG imports through LPG importers was calculated by considering the average distance of each country, storage ratio, and import ratio and amounted to 14,465 nmiles.
An LPG carrier of 47,000 tons deadweight was selected as the vessel for importing LPG fuel, assuming 95% loading conditions and bunker C fuel, the same as for crude oil. The ship speed and engine consumption were taken from existing studies.
Table 24 shows the vessel information for the calculation of emission factor for the import stage through an LPG importer.
Based on the above information, the emission factor for the LPG fuel import stage through an LPG importer is 1.91 g CO2eq/MJ.
The emission factor for the LPG fuel import stage through refineries is the same as for gasoline and marine diesel fuel, which is 0.68 g CO2eq/MJ. Finally, the emission factor for the LPG fuel import stage, which takes into account the ratio of LPG fuel importers and refiners, is 1.47 g CO2eq/MJ.
- c.
Refining stage emission factor of WtT
The LPG fuel refining stage does not include imports through importers, so only the refining process through crude oil via refineries was considered. As mentioned above, GREET’s database was used, and it was assumed that the GHG emissions generated during the LPG refining process at refineries in each country are similar. The emission factor for the LPG import stage through refineries in Korea is 3.63 g CO2eq/MJ, and the emission factor for the LPG fuel import stage considering the import ratio is 1.31 g CO2eq/MJ.
- d.
Distribution stage emission factor of WtT
The emission factor for the LPG fuel distribution stage through LPG importers was calculated similarly to gasoline and marine diesel.
Table 25 shows the information on the distance from the five LPG storage sites to each consumption area and the consumption rate.
The transportation method for LPG fuel was assumed to be similar to gasoline and marine diesel.
Table 26 presents information on the average distance and tank-lorries of LPG fuel transported by LPG importers, taking into account consumption rates.
Based on the above information, the emission factor for the LPG fuel distribution stage through the LPG importer is 0.22 g CO2eq/MJ.
The same methodology was used to calculate the emission factor for the LPG fuel distribution stage through refineries, and
Table 27 shows the information on the distance from the three refineries to each consumption area and ratio.
The transportation method was also assumed to be similar to LPG importers, and
Table 28 presents information on the average transportation distance and tank-lorries of LPG fuel through refineries considering consumption rates.
Based on the above information, the emission factor of the LPG fuel distribution stage through the refinery is 0.35 g CO2eq/MJ. Finally, the emission factor for the distribution stage of LPG fuel considering the import rate is 0.27 g CO2eq/MJ.
- e.
Emission factor of TtW
The emission factor for the TtW of LPG fuel was calculated using similar data as for gasoline and marine diesel.
Table 29 shows the EPA and GWP data for the TtW of LPG fuel.
Based on the information in the table above, the emission factor of TtW for LPG fuel is 52.64 g CO2eq/MJ.
Emission Factors of Bio LPG Fuel
Although the production and consumption of Bio LPG are currently increasing in Europe, there is still no Bio LPG production in Korea. Therefore, this study made several assumptions about Bio LPG fuels.
- (1)
All Bio LPG is imported through two European Bio LPG producers (Neste, SHV ENERGY), and the export port is Rotterdam, Netherlands;
- (2)
The amount of Bio LPG produced can meet the consumption of South Korea;
- (3)
The materials used to produce Bio LPG are CPO and RBD;
- (4)
The conditions for importing Bio LPG are the same as those for importing LPG fuel through an LPG importer, except for the port of export;
- (5)
There are no GHG emissions from TtW because Bio LPG fuel is a carbon-neutral bio-based fuel.
- a.
Production stage emission factor of WtT
CE Delft [
63] presented the emission factors for the production stage of Bio LPG fuels using CPO and RBD, which are materials for Bio LPG production, and this study cited this data. According to the data, the emission factors for the production stage of Bio LPG fuels using CPO and RBD materials are 22.73 g CO
2eq/MJ and 26.84 g CO
2eq/MJ, respectively.
- b.
Import stage emission factor of WtT
The emission factors for the import stage were calculated using the same method as for the import process of LPG fuel through LPG importers. The only differences are the average distance from the export port to the domestic LPG storage and the storage ratio.
Table 30 shows this information.
Based on the average distances shown in the table above and the vessel information for LPG fuel imports presented earlier, the emission factor for the import stage is 1.66 g CO2eq/MJ.
- c.
Distribution stage emission factor of WtT
It is equivalent to the distribution stage of an importer of LPG fuel and has a value of 0.22 g CO2eq/MJ.
- d.
Emission factor of TtW
The emission factor for TtW is 0 g CO2eq/MJ because Bio LPG fuel is a carbon-neutral bio-based fuel, as assumed earlier.
3.3. Life Cycle Impact Analysis (LCIA)
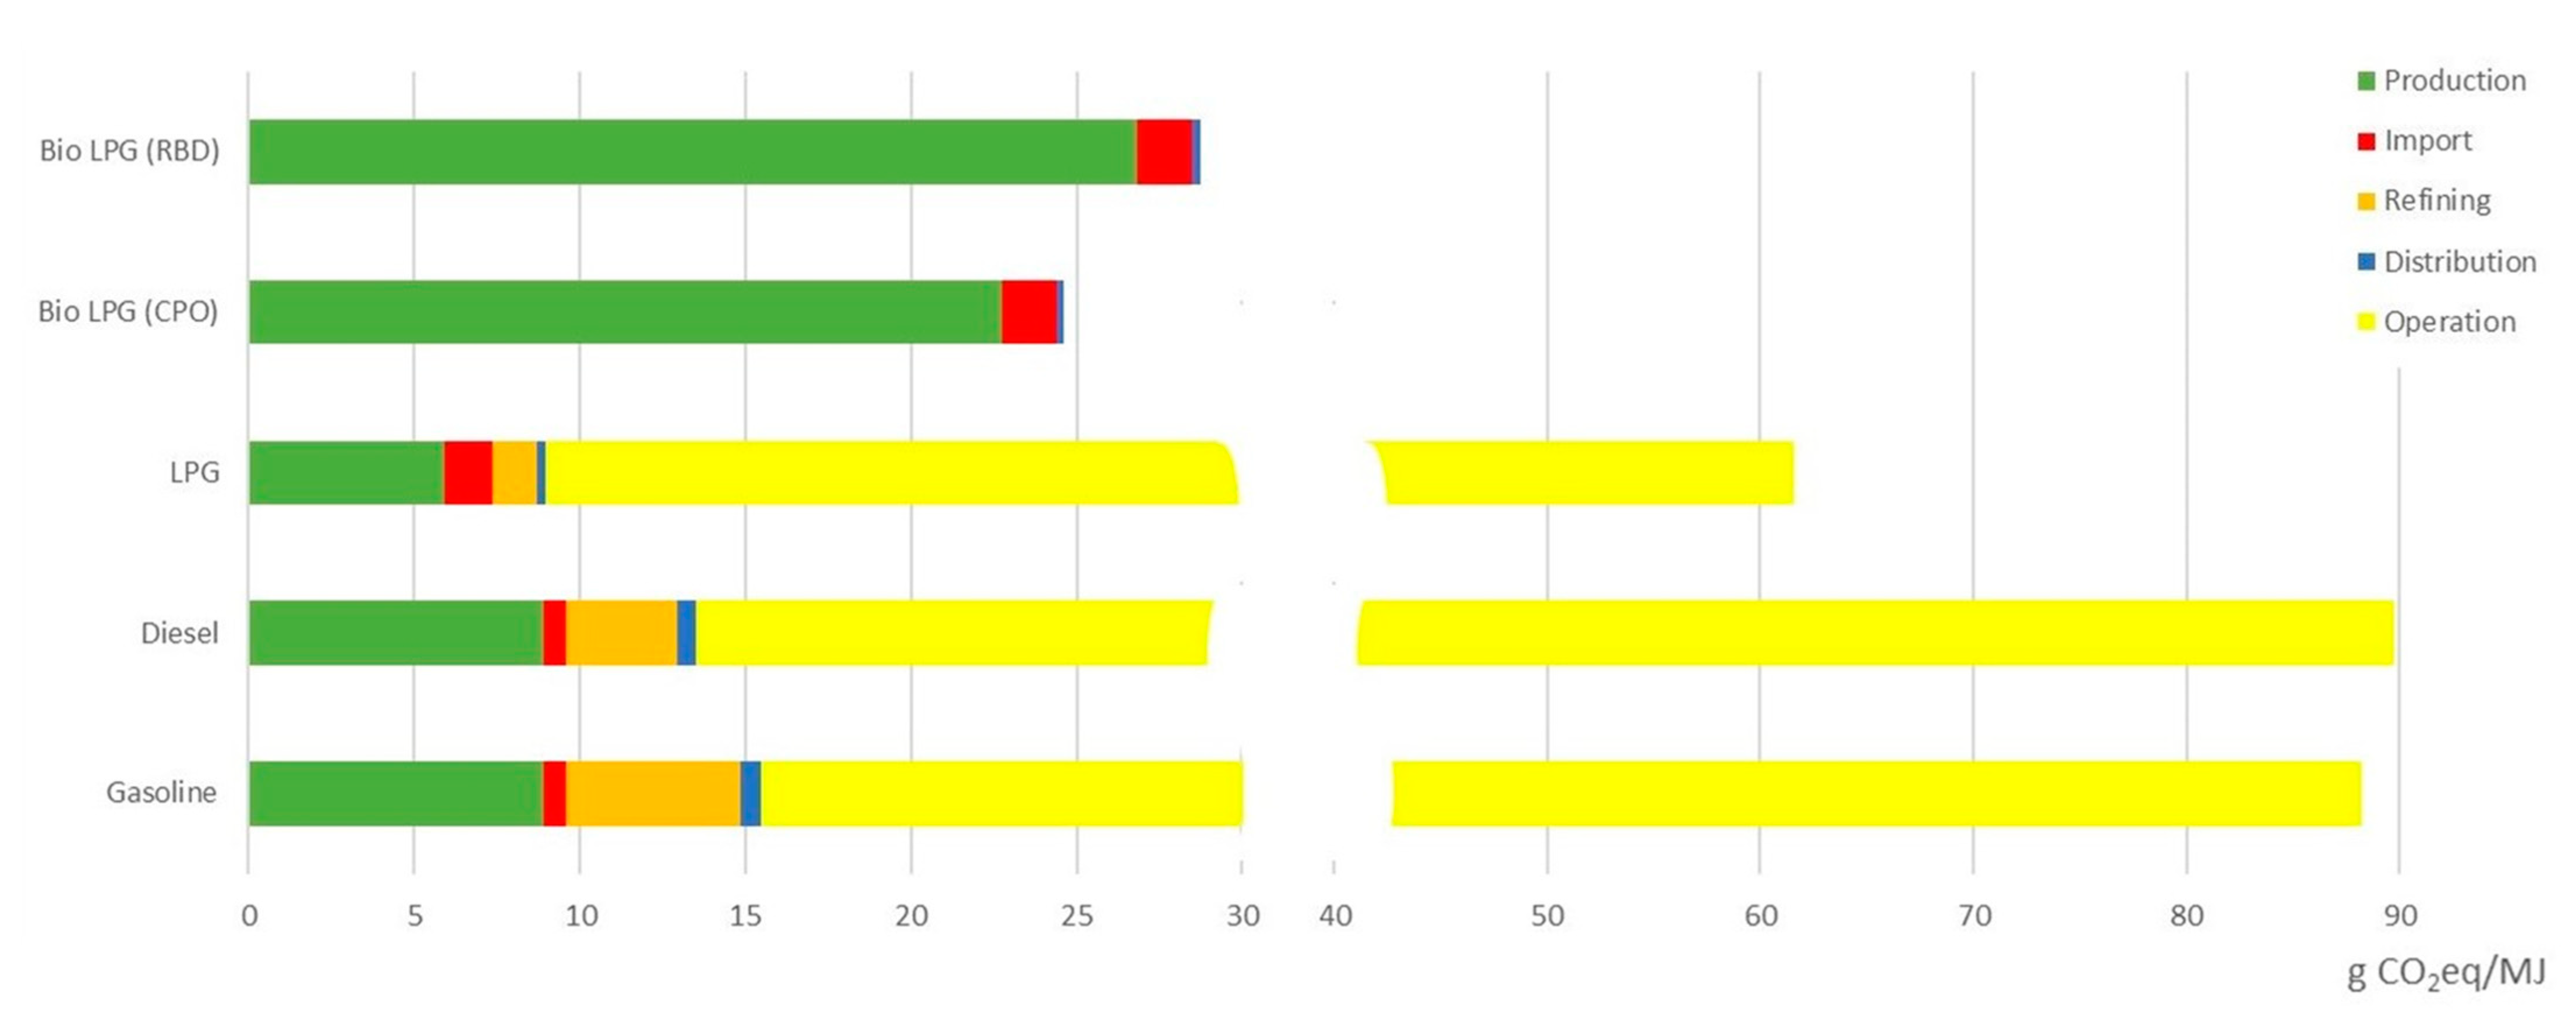
In this study, for the application of LPG and Bio LPG fuel to small ships, the entire process of those fuels and conventional fuels, gasoline, and marine diesel, for GHG was studied. To assess the potential contribution of each fuel to global warming through its life cycle, the GHG emissions from the production, import, refining, distribution, and operation stages were evaluated using 1 MJ of energy as the functional unit for each fuel. Life cycle inventory (LCI) data were collected for the inputs and outputs associated with each stage of each fuel’s life cycle, and for the life cycle impact analysis (LCIA), GWPs were used from the IPCC’s Fifth Assessment Report 2014. The input and output results for each stage are presented in
Section 3.2, and
Figure 2 below shows the GWP results obtained from the LCI data collected.
The LCIA results show that conventional fuels, namely gasoline and marine diesel, have a higher GWP contribution than LPG and Bio LPG. The main reason for this is the high GHG emissions at the TtW stage, while the refining and distribution stages also contribute more to GHG emissions for conventional fuels. Comparing LPG and Bio LPG alone shows that LPG has a higher GWP contribution. This is because, despite the high GHG emissions in the production and import stages of Bio LPG, there are no GHG emissions at TtW, which has the largest impact on the GWP results. Therefore, the results suggest that using LPG and Bio LPG over conventional fuels and Bio LPG over LPG are more environmentally sustainable options than using conventional fuels.
3.4. Interpretation
This study, which conducted an LCA of four different fuels for 1 MJ of energy, found that the contribution of GWP was in the order of marine diesel, gasoline, LPG, Bio LPG (RBD), and Bio LPG (CPO). For each fuel, LCI data collected at each stage of production, import, refining, distribution, and operation shows that in order of GWP contribution, 89.75 g CO2eq, 88.24 g CO2eq, 61.60 g CO2eq, 28.72 g CO2eq, and 24.61 gCO2 eq emit GHGs, respectively.
The high GHG emissions of conventional fuels are due to the large amount of carbon in their composition. LPG and Bio LPG have the same chemical structure, but over the life cycle of the fuel, excluding the production phase, Bio LPG has a lower GWP contribution than LPG, resulting in a lower environmental impact.
The results of this study suggest that the environmental impact of small vessels can be reduced by switching from conventional fuels—gasoline and marine diesel—to LPG and Bio LPG. In particular, Bio LPG has a lower GWP contribution than the other three fuels and can be reused, reducing its overall environmental impact. By assessing the environmental impact of the life cycle of fuels used in small vessels, this study demonstrates the importance of switching to LPG and Bio LPG as a sustainable option that can reduce environmental impact compared to conventional fuels.
4. Results
4.1. Results of Emission Factors
Table 31 summarizes the emission factors for each fuel obtained in Chapter 3.
The GHG emission reduction rates of LPG and Bio LPG compared to gasoline and marine diesel, the existing fuels for small fishing vessels, can be determined by using the total emission factors for each fuel presented in
Table 31. In this study, the GHG emission reduction for 100% LPG, a 50% to 50% blend of LPG and Bio LPG, and 100% Bio LPG were examined using the production capacity of Bio LPG as a variable, and
Table 32 shows the results.
As shown in
Table 32, it has been found that LPG fuel has a GHG reduction effect of approximately 30% compared to conventional fuels, and Bio LPG fuels using CPO and RBD have a GHG reduction effect of more than 65% compared to conventional fuels. These GHG reduction rates compared to conventional fuels are expected to be an important indicator for assessing the responsiveness of LPG and Bio LPG fuels to GHG regulations that may be applied to small vessels in the future.
Parametric Analysis of Emission Factors
Various input data related to the calculation of emission factors affect the emission factor. The sensitivity analysis was performed by changing the input data that affect the emission factor at each stage of the fuel life cycle process. The sensitivity analysis used the deviation of the emission factor calculated in each step in
Section 3.2.2 and the newly calculated emission factor by changing the individual input data of the same step. Using the results of the sensitivity analysis, the sensitivity of the input data for each step is presented in order. Among the presented input data, artificially adjustable and unadjustable data were distinguished. In addition, a plan to reduce the emission factor at each stage was presented using the adjustable data presented.
- a.
Production stage emission factor of WtT
The input data that affect the production stage emission factor can be considered as the change in the import ratio due to the switch in the importing country and the CI value for each country. Since the CI value of each country directly affects the emission factor by the same percentage change, this study excluded the sensitivity analysis of the CI value of each country and conducted a sensitivity analysis of the change in the import ratio due to the change in the importing country. To analyze the sensitivity of the import ratio to changes in importing countries, the existing production stage emission factors were compared to the production stage emission factors calculated by applying a new import ratio of 100% to the top 10 importing countries.
To analyze the sensitivity of the import ratio to changes in the number of importing countries, gasoline production stage data were used. The existing production stage emission factor for gasoline is 8.91 g CO2eq/MJ, and
Table 33 shows the import ratio and CI values for each country considering the import ratio of the top 10 gasoline importers as 100%.
Based on the information presented in
Table 33, the value of the production stage emission factor for gasoline that considers the change in the import ratio due to the change in the number of importing countries is 8.61 g CO2eq/MJ. It was confirmed that the GWP contribution is lower than the existing results when the top 10 importing countries are considered. However, this result is a combination of changes in the import ratio due to changes in the number of importing countries and the exclusion of countries with low import ratios but high CI values. Therefore, to reduce the GWP contribution of production stage emission factors, imports from countries with low CI values in the production stage should be increased.
For marine diesel and LPG fuels, like gasoline, increasing imports from countries with lower CI values for the production stage is a valid way to reduce the GWP contribution. However, for LPG fuel, other input data affect the sensitivity of the production stage. This is the proportion of LPG imported through importers and refiners. For LPG fuel, the effect of changing this ratio on the production stage emission factor was investigated.
Table 34 shows the existing percentage of LPG imported through importers and refiners and the new percentage adjusted by ±10%.
Table 34 shows the results of the emission factors for the original percentage imported through LPG importers and refiners and the new percentages adjusted by ±10%.
As shown in
Table 34, increasing imports through LPG importers resulted in a lower GWP contribution of the production stage emission factor. Therefore, it can be concluded that increasing the proportion of imports through LPG importers can effectively reduce the GWP contribution of the production stage emission factor of LPG fuel, except for the LPG inevitably generated during the refining process of crude oil. Furthermore, this result applies not only to the production stage of LPG fuel but also to the import, refining, and distribution stages.
Sensitivity analysis for Bio LPG was omitted because the production stage emission factor was cited from existing research data.
- b.
Import stage emission factor of WtT
The average import distance, loading condition, ship speed, and daily fuel consumption can be considered as input data that affect the import stage emission factor. To compare the increase in emission factors for changes in the four input data, the average import distance and daily fuel consumption increased by 10% from the default values, and the loading condition and ship speed that decreased by 10% were defined as new input data. The change in emission factors in response to a 10% change in the presented input data was used to identify its degree of influence on the import stage emission factor.
For the sensitivity analysis of the four input data presented, gasoline import stage data were used, which have an existing emission factor of 0.68 g CO
2eq/MJ.
Table 35 shows the default values for the four input data of the gasoline import stage, the new conditions with a 10% change, and the emission factors calculated with the new conditions.
The new emission factor results presented above confirm that the sensitivity of gasoline to the import stage emission factor is in the order of loading condition > ship speed > average distance and daily fuel consumption. Among the input data presented above, ship speed and daily fuel consumption may change depending on sea conditions such as wind, current, and wave height and cannot be artificially adjusted in the operation of actual ships. In contrast, loading condition and average distance are variables that can be adjusted through planning. Consequently, it is believed that the GWP contribution of the import stage emission factor can be lowered through planning, such as maximizing the loading condition and importing from countries with short average distances.
Marine diesel and LPG have the same sensitivity results as gasoline for the above four input data. Furthermore, in this study, Bio LPG imports were conducted at one export port. Thus, loading ratio, ship speed, and fuel consumption per day, excluding the average import distance, can be the parameters of the sensitivity analysis. The sensitivity results for the three parameters are the same as for the other fuels.
- c.
Refining stage emission factor of WtT
For all fuels except Bio LPG fuel, the refining stage emission factor is determined by the CO
2, CH
4, and N
2O emissions from the refining process. These emissions show different results for an equal amount and equal percentage increases in the change in emissions per unit of energy.
Table 36 shows the results of the emission factors for the same amount and the same percentage change for the three emissions presented.
Based on the results in the above table, for the same amount of increase (+1 g/mmBtu), the descending order of the results was N2O (5.68 g CO2eq/MJ) > CH4 (5.29 g CO2eq/MJ) > CO2 (5.27 g CO2eq/MJ). For the same percentage increase (+10%), the results were in the descending order of CO2 (5.66 g CO2eq/MJ) > CH4 (5.40 g CO2eq/MJ) > N2O (5.27 g CO2eq/MJ). Therefore, reducing the GWP contribution of the refining stage for the same amount or the same percentage will be effective to reduce emissions in the order presented above. The results show the same order of sensitivity for marine diesel and LPG fuel.
- d.
Distribution stage emission factor of WtT
The input data that affect the distribution stage emission factor can be considered as average transportation distance, loading condition, and fuel efficiency. The sensitivity of the emission factor was checked by comparing the increase in the emission factor with the three input data presented as new inputs. To compare the deviation of the emission factors in the same manner, the average distance traveled increased by 10% and the loading condition and fuel efficiency decreased by 10% and were defined as new inputs. Then the degree of their impact on the distribution stage emission factor was identified.
For the sensitivity analysis of the three input data presented, the gasoline distribution stage data were used, and the emission factor was 0.60 g CO
2eq/MJ.
Table 37 shows the default values of the three input data for the gasoline distribution stage, new conditions with a 10% change, and results of the emission factors calculated by applying the new conditions.
The results of emission factors with the new input presented above confirmed that the import stage emission factor of gasoline is affected in the order of loading condition and fuel efficiency > average distance. In actual transportation, fuel efficiency and average distance vary according to traffic conditions and demand, respectively, in each region, so it is not possible to adjust them artificially. However, the loading condition is a variable that can be adjusted through planning. Hence, maximizing the loading condition is thought to be effective in reducing the distribution stage emission factor. Marine diesel, LPG, and Bio LPG show the same sensitivity as gasoline to the input data presented above.
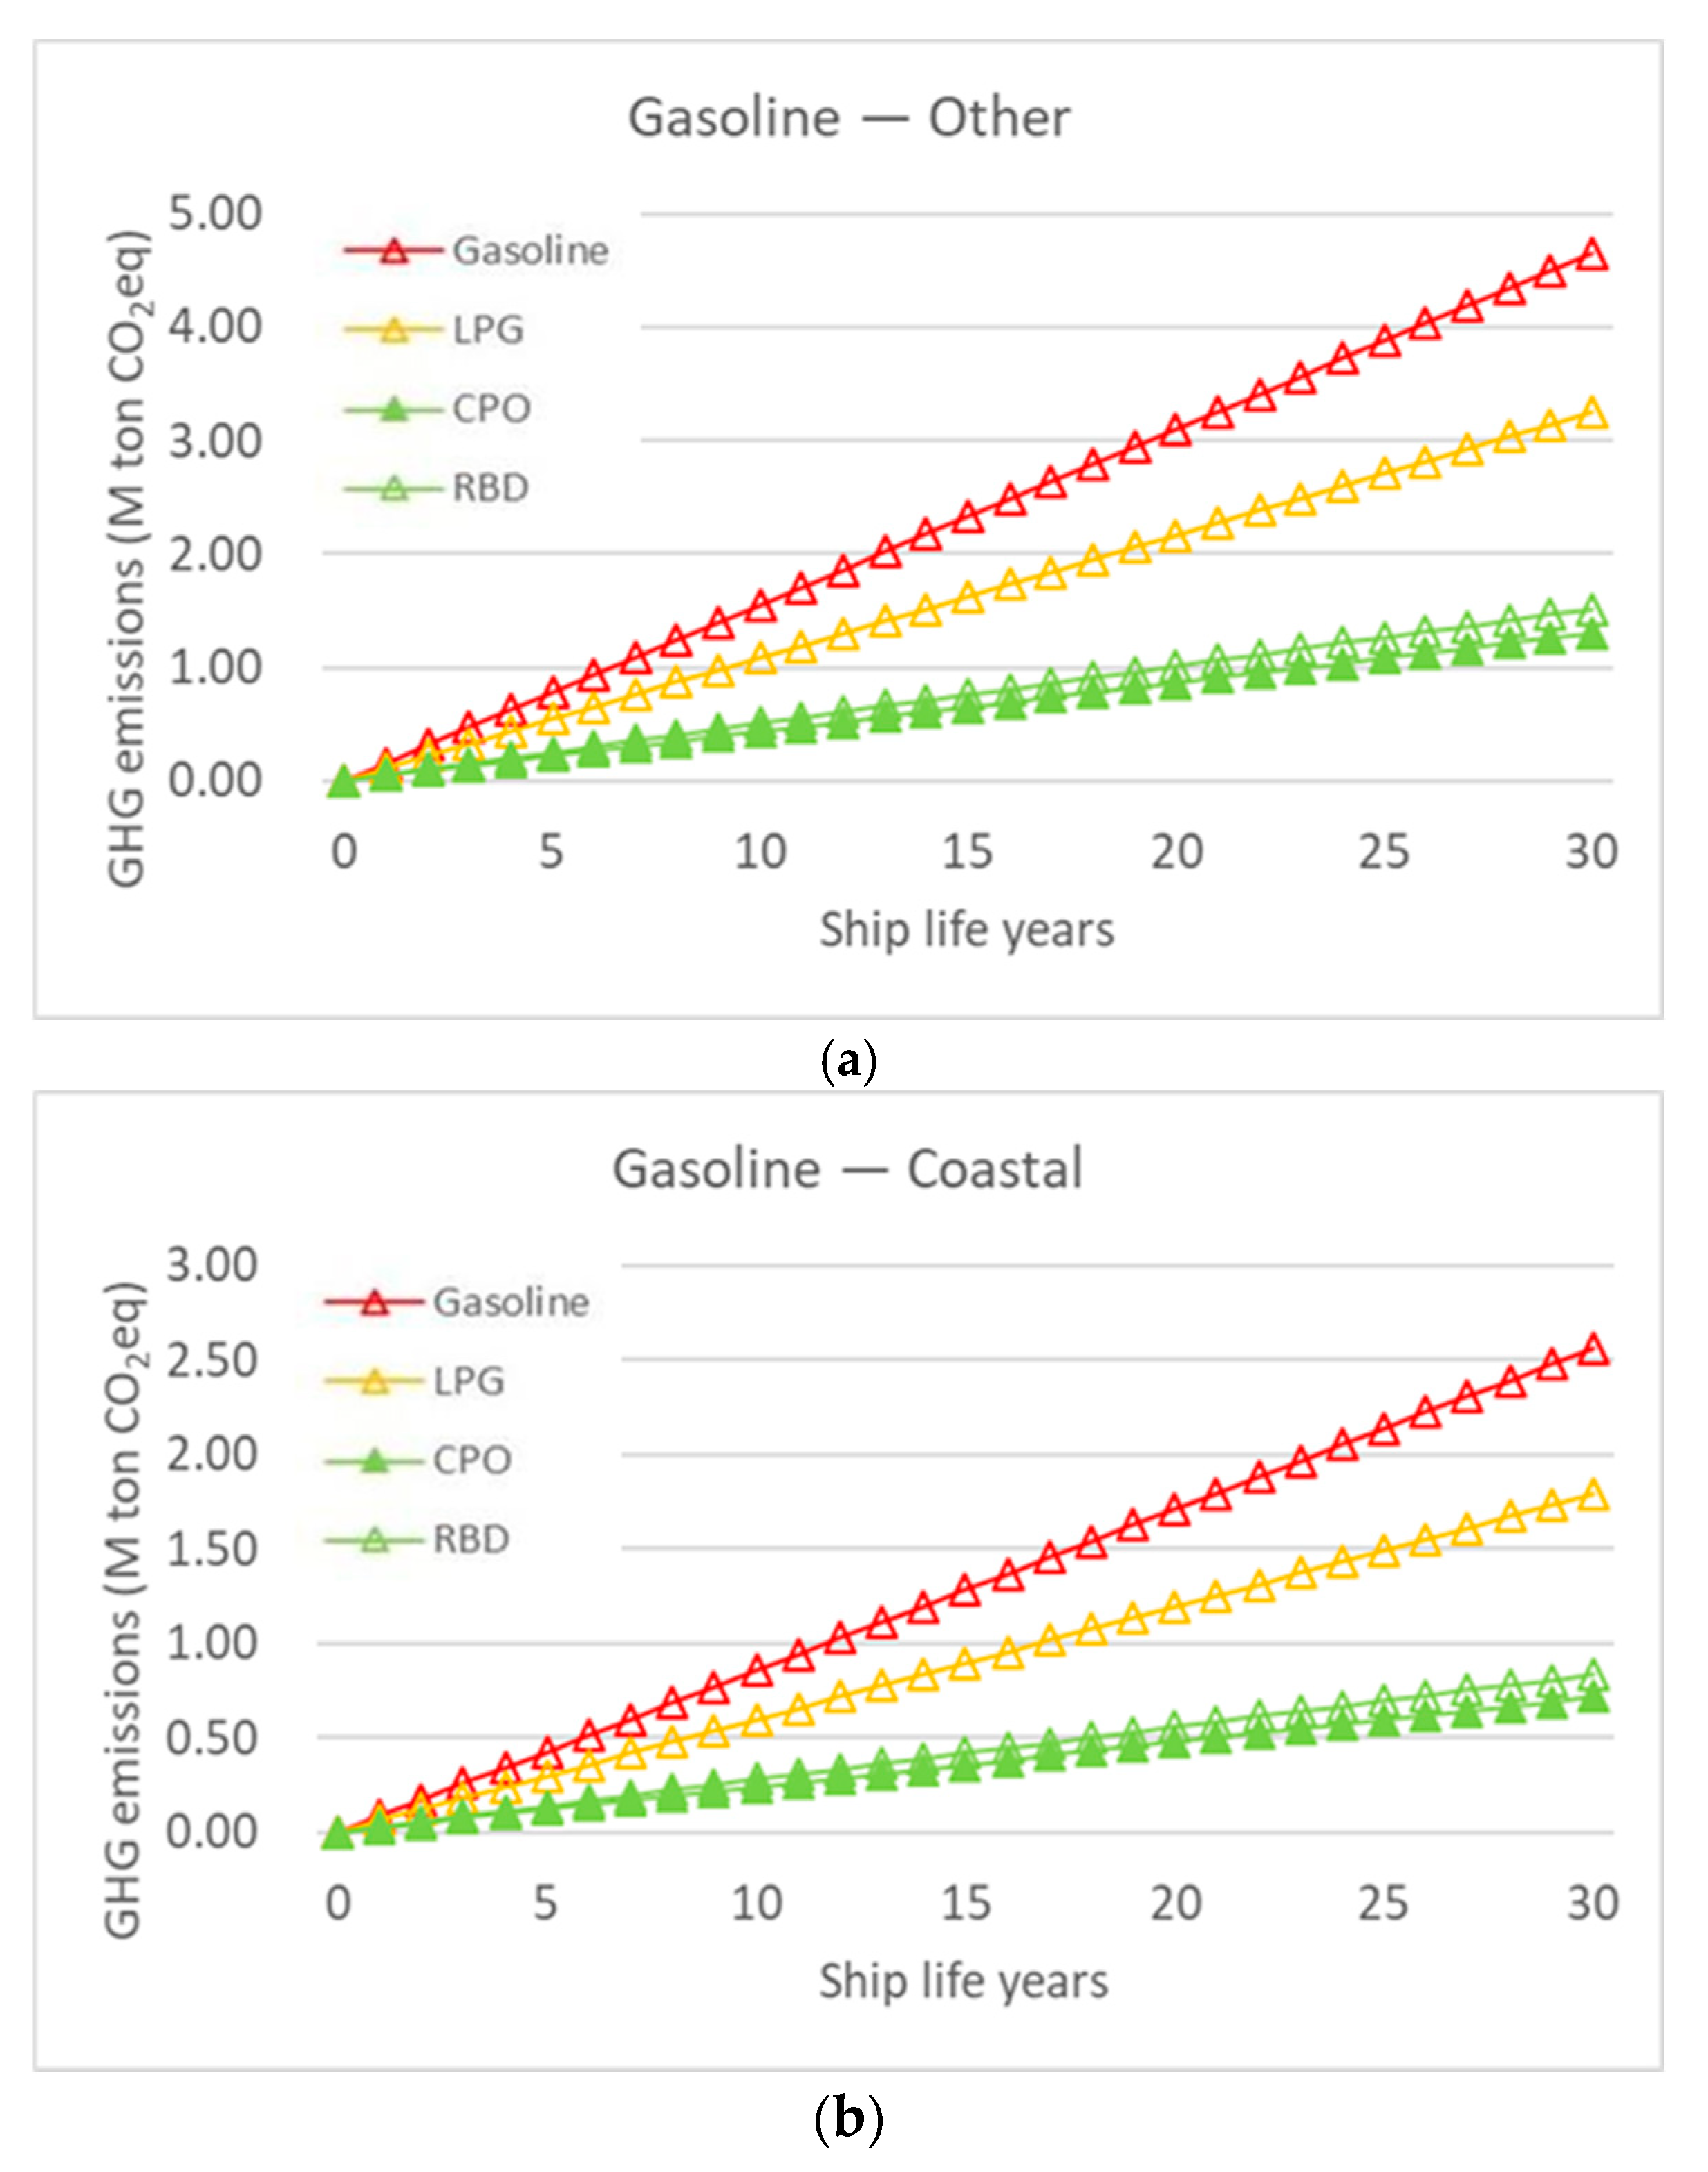
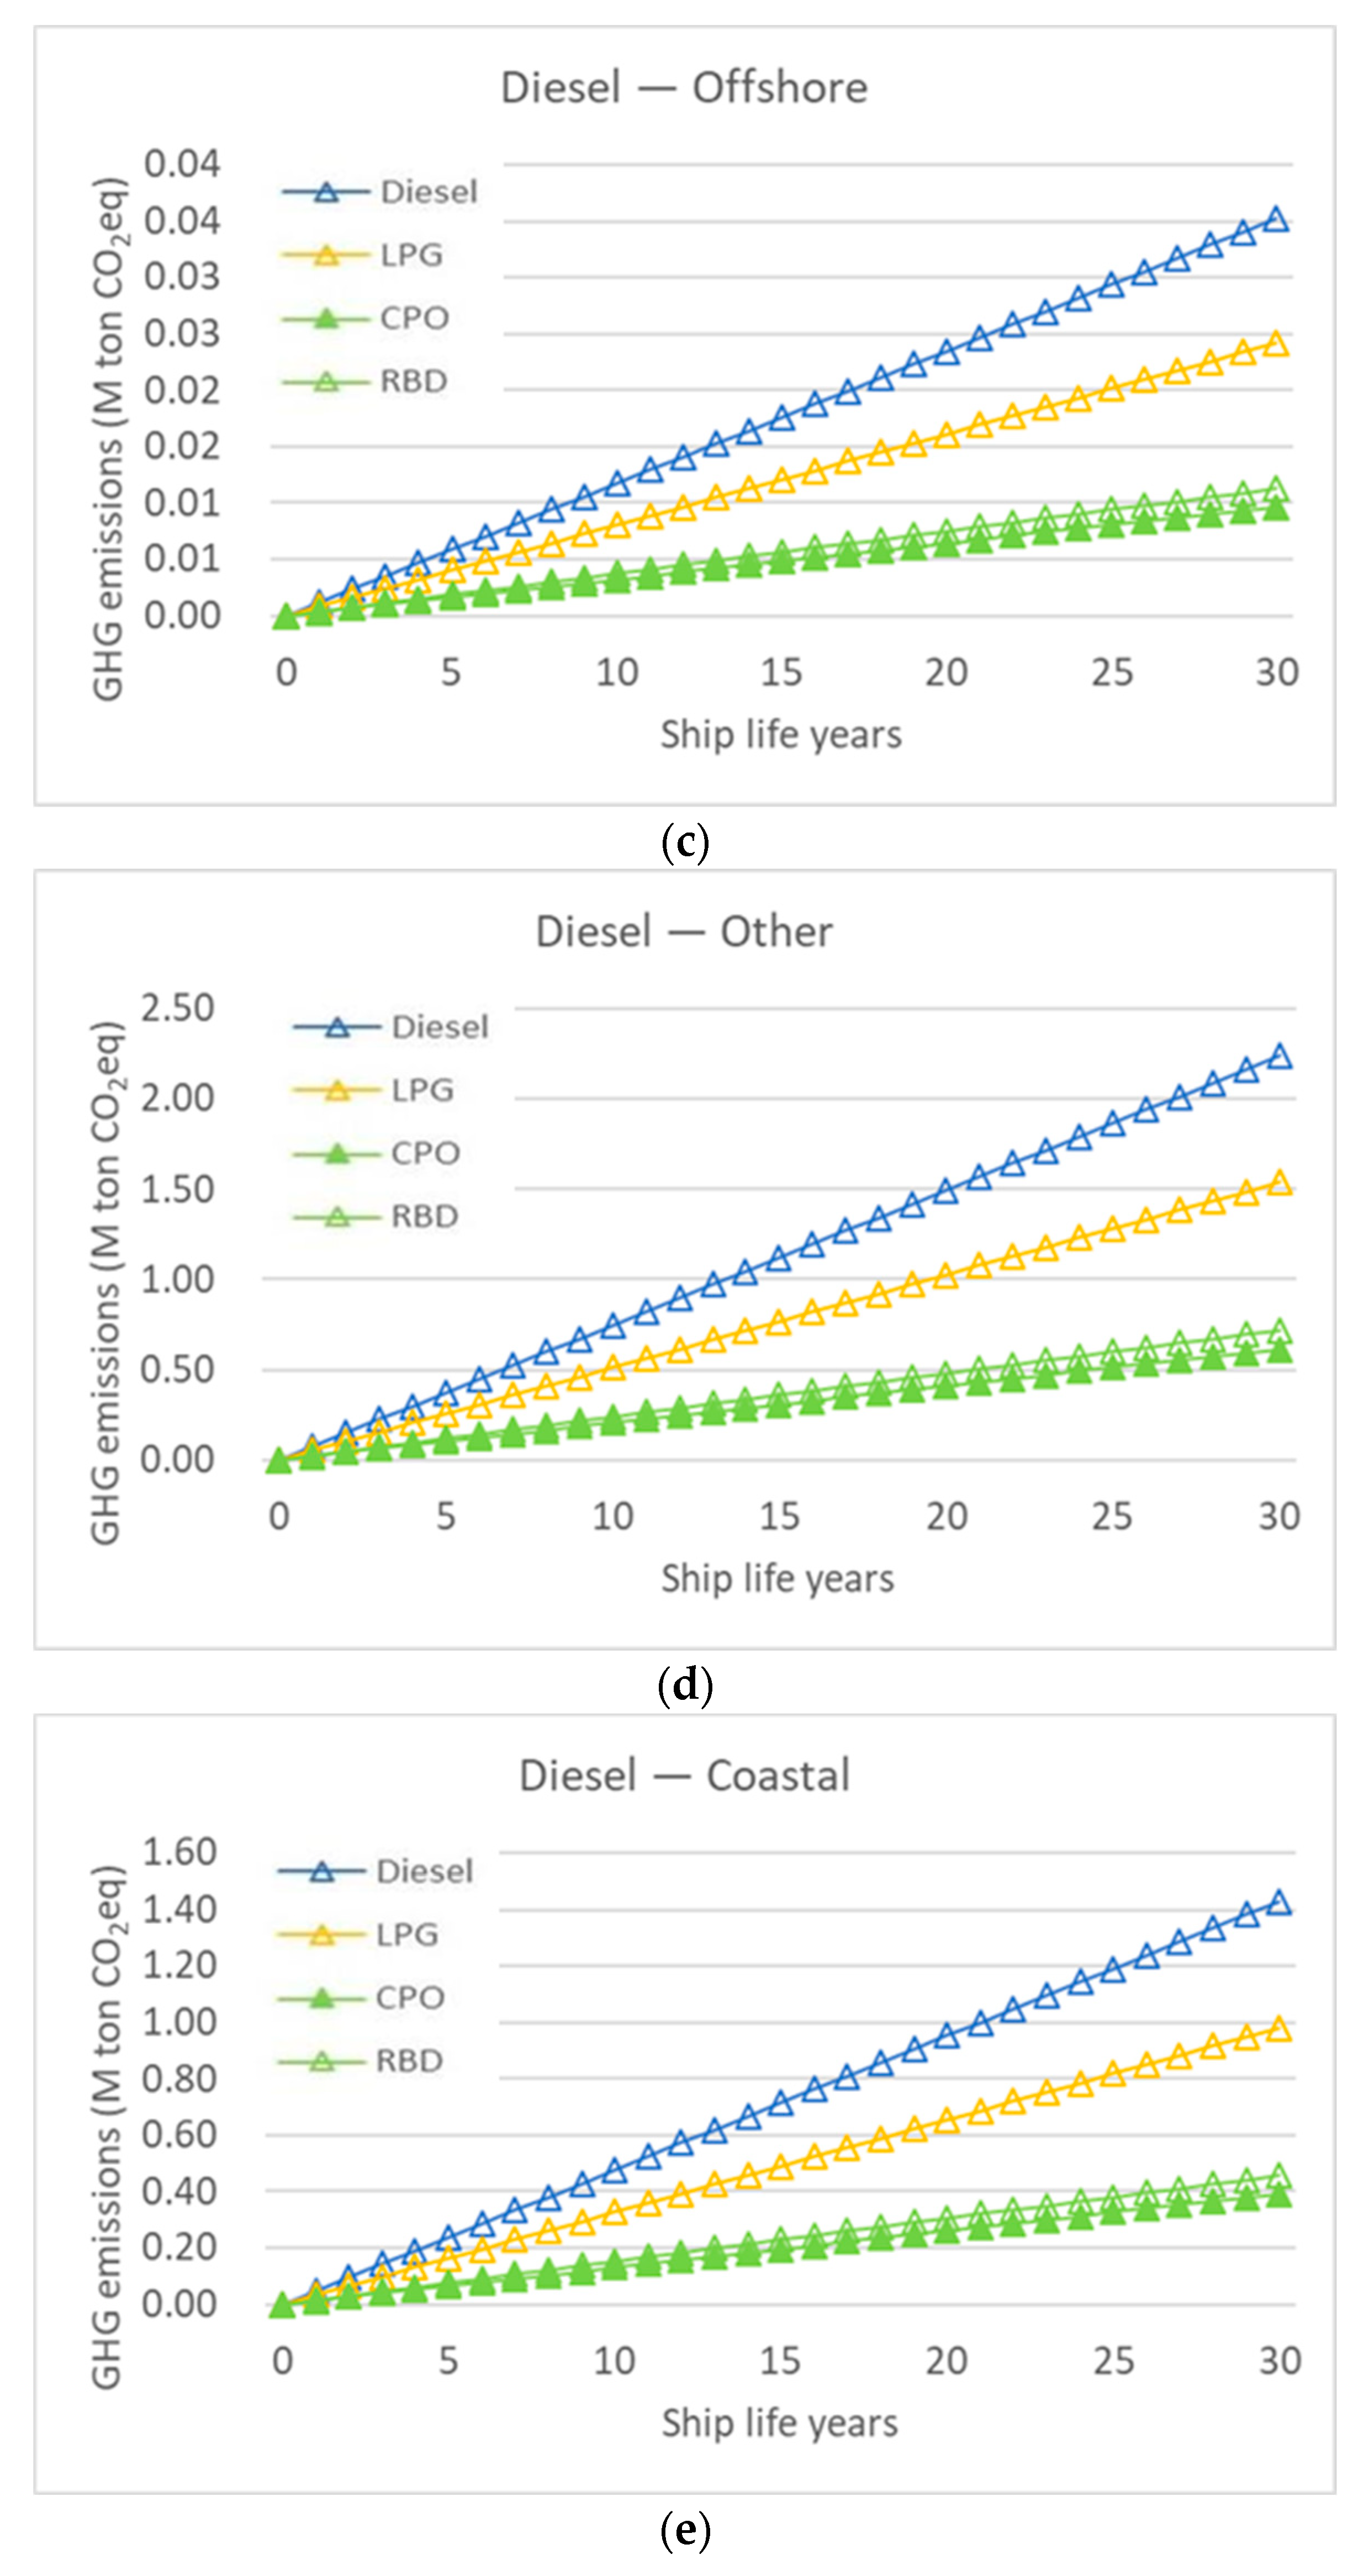
4.2. Results of Total Emissions for Ship’s Life Cycle
In
Section 4.1, the GHG reductions of LPG and Bio LPG fuels using the emission factors of each fuel were discussed. In this section, the GHG reductions over the life cycle of the vessel when conventional fuels are converted to LPG and Bio LPG are examined. Using the functional units for each fuel presented in
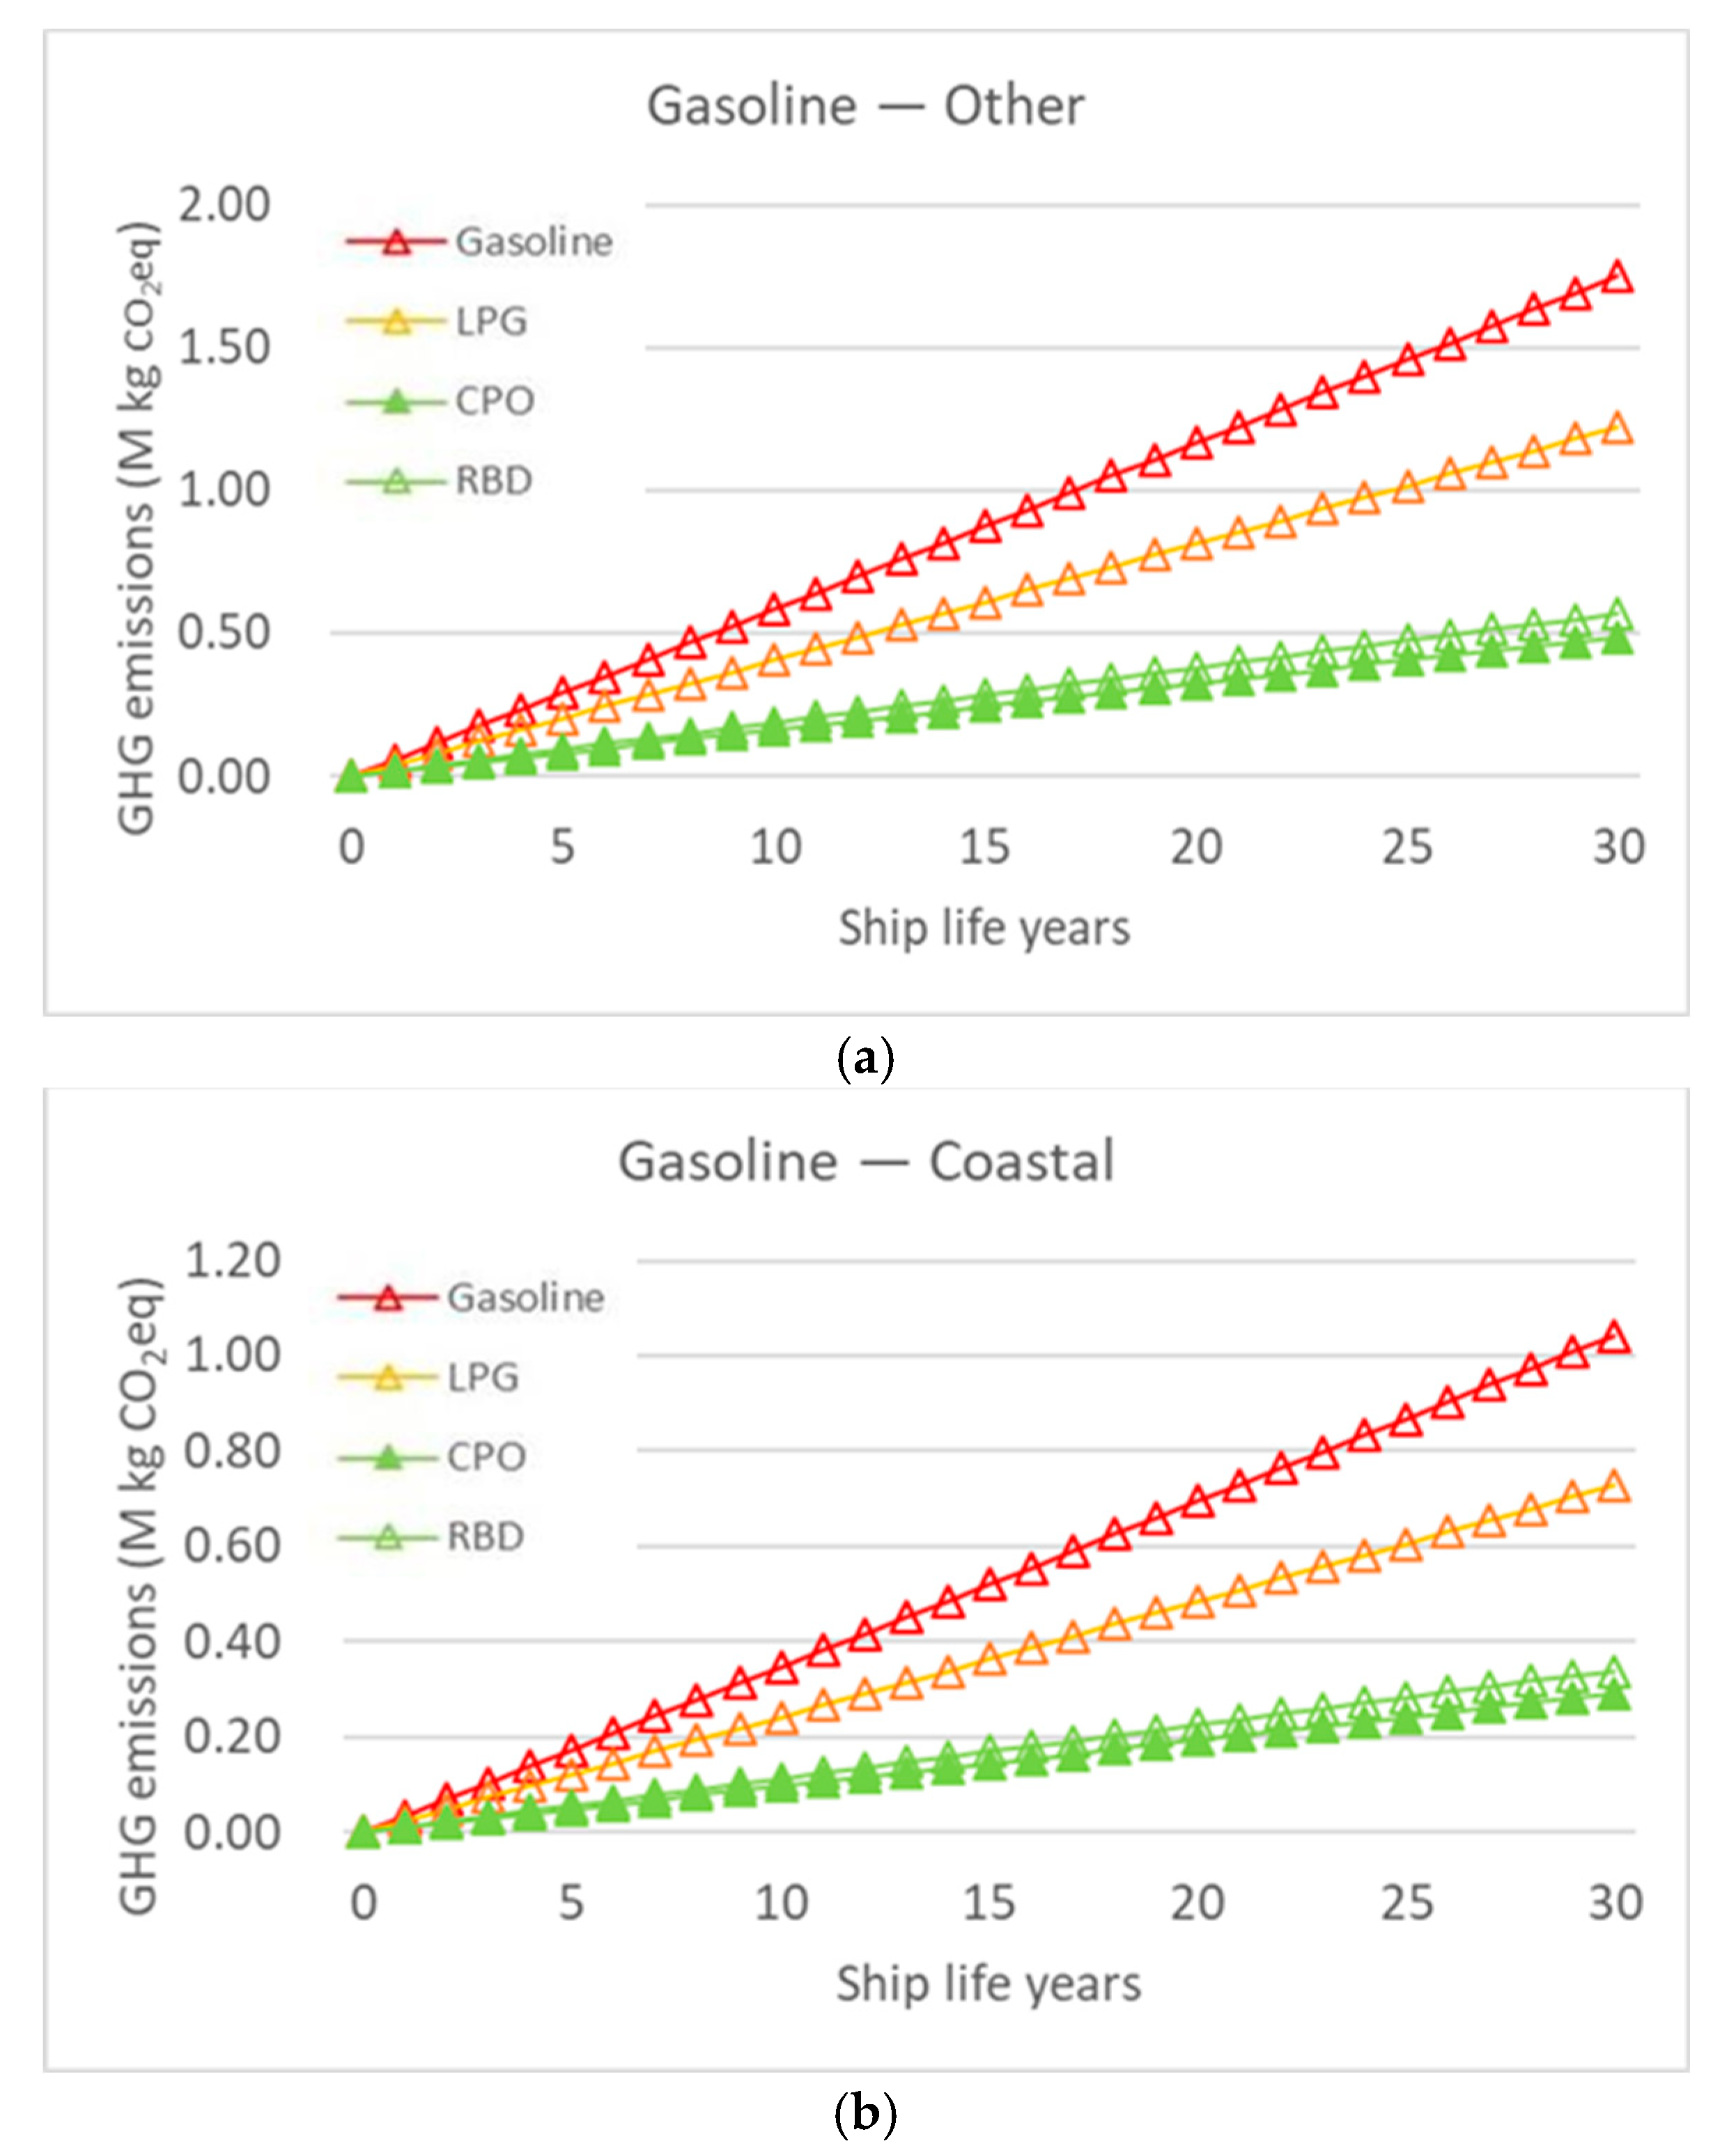
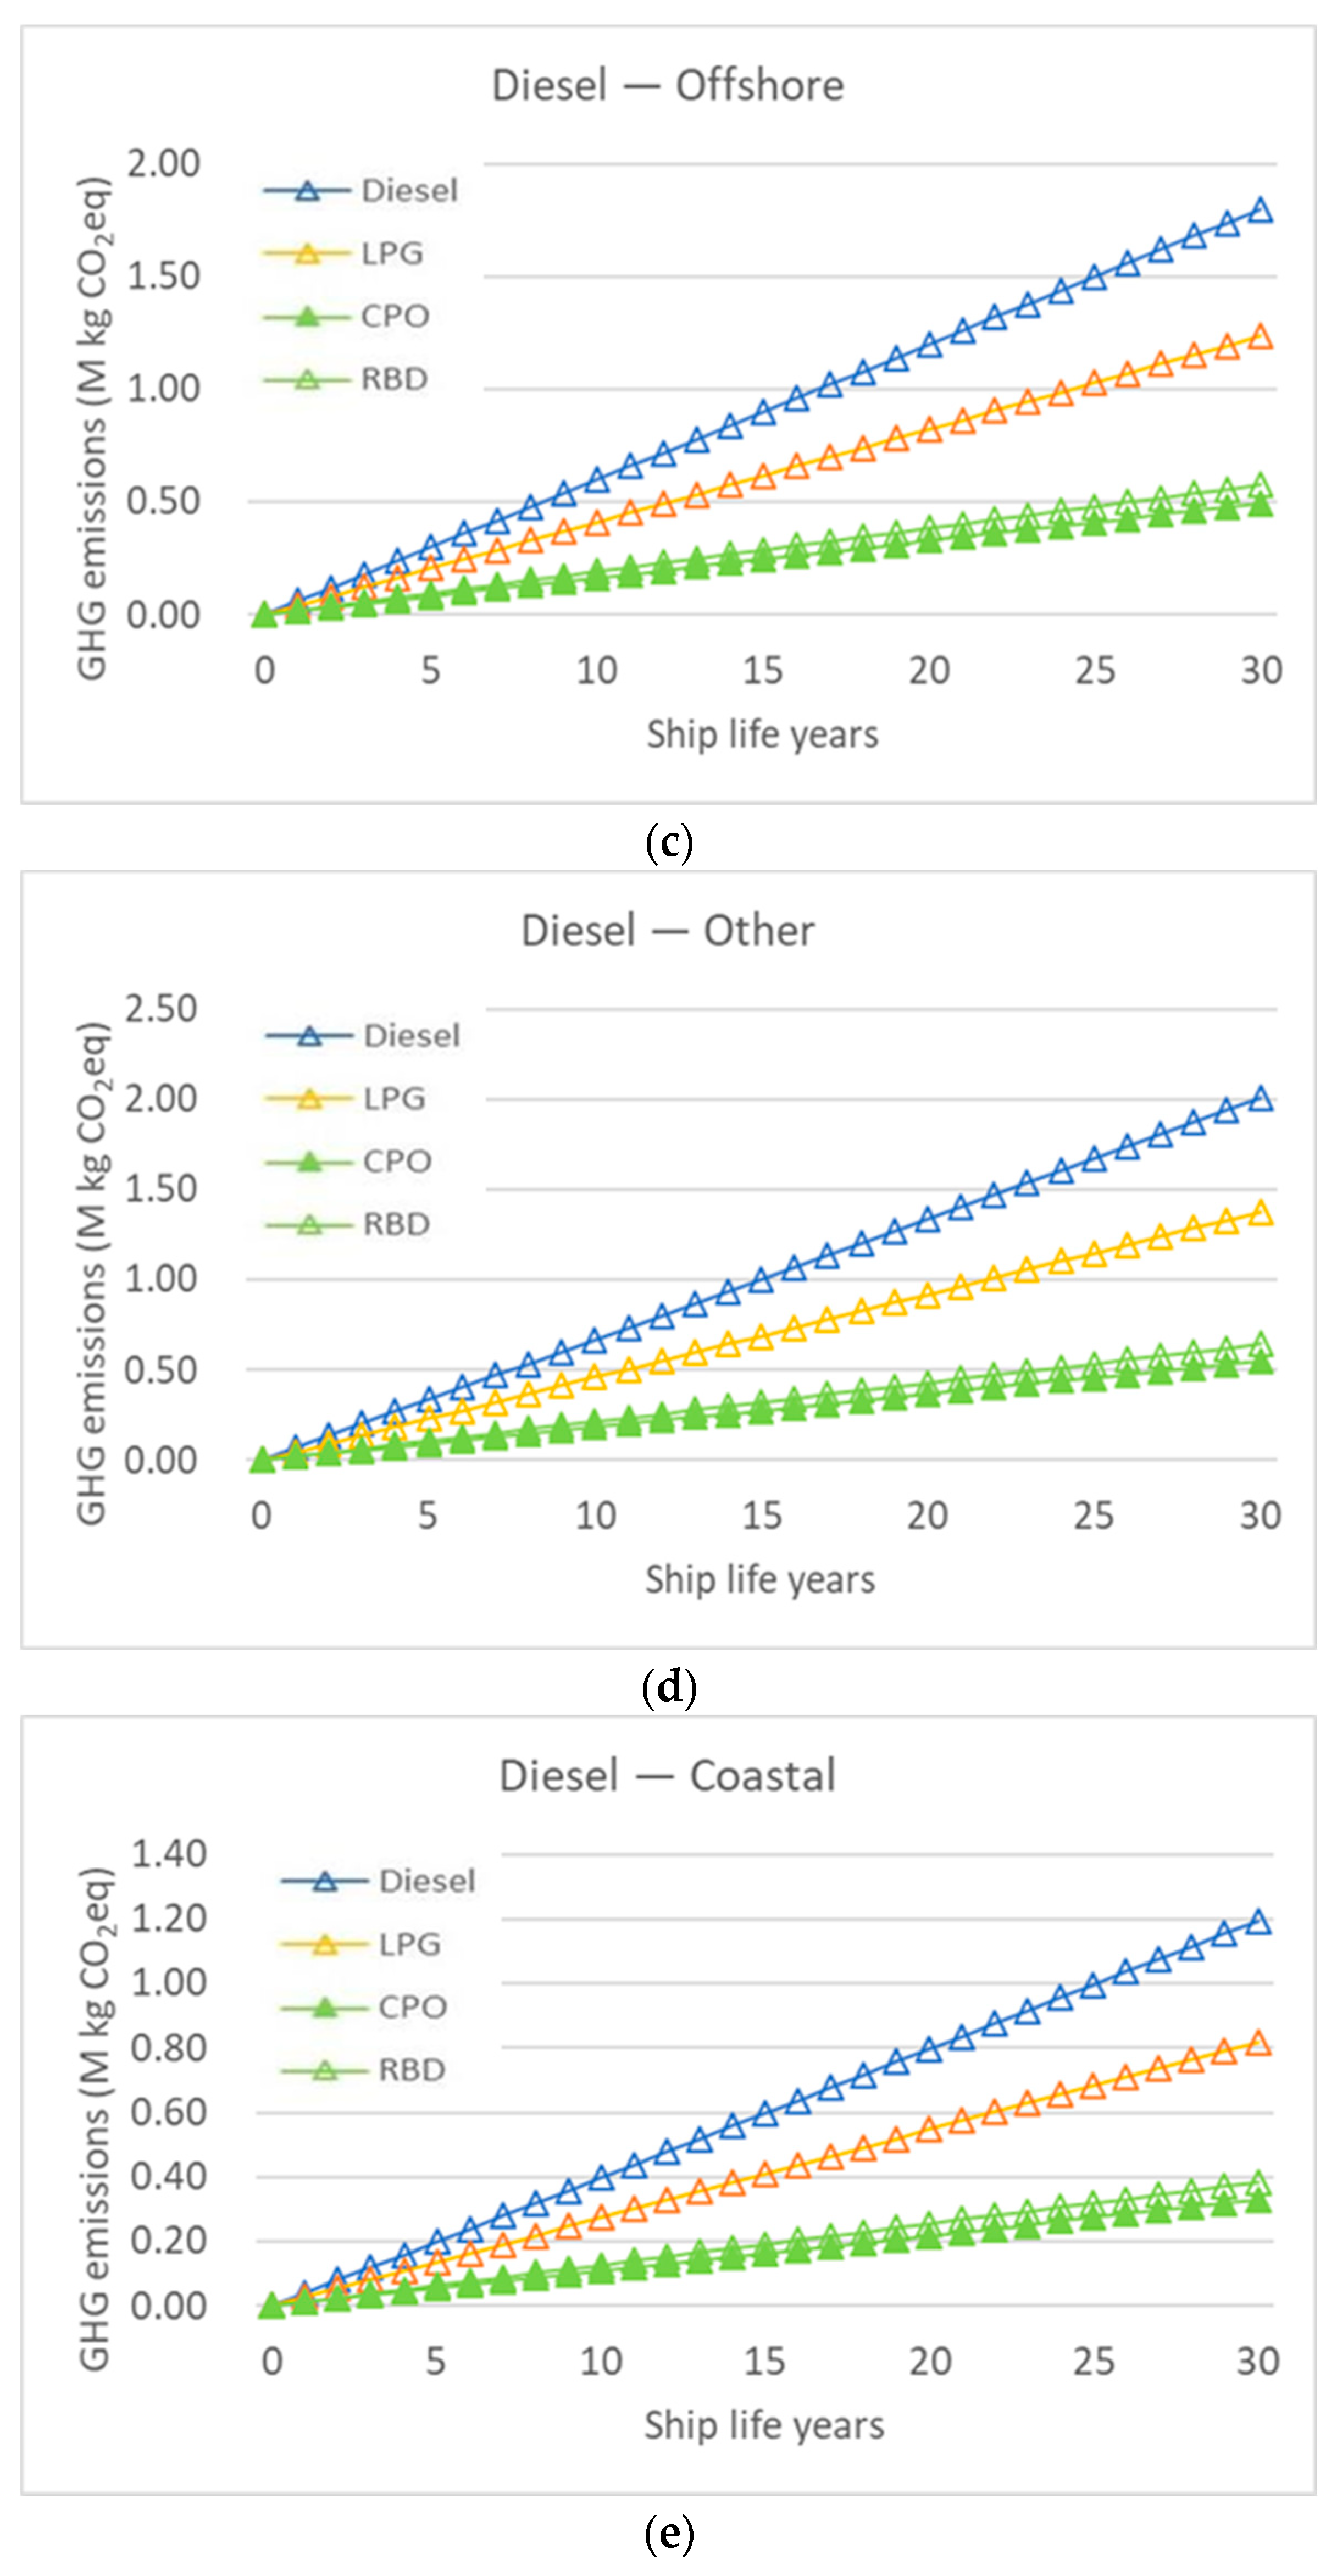
Section 3.3, two results were derived for the 30-year life cycle of the small fishing vessels assumed earlier. The first is a comparison of the GHG emissions of all vessels categorized by fuel and fishing zone. It has compared GHG emissions of four different fuels for all ships categorized by fuel and fishing zone during the life cycle.
Figure 3 shows the GHG emissions of conventional fuels, LPG, and Bio LPG by fishing zone over a 30-year lifecycle for all small fishing vessels.
LPG fuel showed a GHG reduction of 2,179,761 tons and 1,161,575 tons compared to gasoline and marine diesel, respectively. The GHG reductions for each fuel and fishing zone were 1,405,453 tons in (a), 774,308 tons in (b), 11,048 tons in (c), 702,109 tons in (d), and 448,418 tons in (e). The GHG reductions of Bio LPG fuel using CPO material were 5,206,389 tons and 2,687,908 tons compared to gasoline and marine diesel, respectively. By fuel and fishing zone, the GHG reductions were 3,356,943 tons, 1,849,446 tons, 25,564 tons, 1,624,703 tons, and 1,037,641 tons, in the same order as LPG. The Bio LPG fuel using RBD materials showed GHG reductions of 4,870,096 tons and 2,518,314 tons compared to gasoline and marine diesel, respectively. The GHG reductions by fuel and fishing zone were 3,140,110 tons, 1,729,986 tons, 23,951 tons, 1,522,192 tons, and 972,171 tons, in the same order as LPG.
The above results are notable in that the emission factors presented in
Section 4.1 are higher for diesel than for gasoline, but the order of GHG emissions over the life cycle of ships is higher for gasoline-fueled ships than for diesel-fueled ships. This is because there are at least twice as many gasoline-fueled ships as diesel-fueled ships, which offsets the difference in emission factors.
Next, GHG emissions over the life cycle of a single vessel categorized by fuel and fishing zone were compared. For this study, the GHG emissions of a single fishing vessel with an engine of the same power (186 kW) were calculated for each fuel and fishing zone. The comparison method was the same as for all vessels.
Figure 3 shows the GHG emissions of one fishing vessel with the same power for each fuel and fishing zone for the life cycle of small fishing vessels compared to LPG and Bio LPG.
The difference from the results of all vessels is that the GHG reduction over their life cycle was influenced by the number of vessels. In contrast, the GHG reduction for the life cycle of a single fishing vessel of the same power output was driven by the impact of annual moving and working hours as well as engine load. Despite these influences,
Figure 4c has higher GHG emissions than
Figure 4a because of the higher emission factor of marine diesel than gasoline.
LPG fuel showed GHG reductions of 842,790 kg and 1,567,590 kg compared to gasoline and marine diesel fuel, respectively. The respective GHG reductions for each fuel and fishing zone were 528,120 kg in (a), 314,670 kg in (b), 563,970 kg in (c), 628,890 kg in (d), and 374,730 kg in (e). The GHG reductions of Bio LPG fuel using CPO material were 2,013,000 kg and 3,627,420 kg compared to gasoline and marine diesel, respectively. By fuel and fishing zone, the GHG reductions were 1,261,410 kg, 751,590 kg, 1,305,060 kg, 1,455,240 kg, and 867,120 kg in the same order as LPG. The Bio LPG fuel using RBD materials showed GHG reductions of 1,882,980 kg and 3,398,550 kg compared to gasoline and marine diesel, respectively. The GHG reductions by fuel and fishing zone were 1,179,930 kg, 703,050 kg, 1,222,710 kg, 1,363,440 kg, and 812,400 kg in the same order as for LPG.
Parametric Study of Total Emissions for Ship’s Life Cycle
Among the various input data relevant to the calculation of total emissions, the sensitivity to the presented input data was analyzed by comparing the change in the amount of emissions with changes in SFOC, annual running hours, and load. For each fishing zone of gasoline and marine diesel, the existing input data values were increased by 10%, and the variation of emission generation was compared to this change. The change in the amount of LPG and Bio LPG emissions due to changes in input data values is the same as the change in annual energy consumption due to changes in gasoline and marine diesel. Therefore, the order of sensitivity of gasoline and marine diesel for each fishing zone is the same as the order of sensitivity of gasoline and marine diesel. Therefore, the individual sensitivity of LPG and Bio LPG is not presented separately. Emissions are based on the same power engine (186 kW) presented in
Section 4.2.
Table 38 shows the results of the percentage increase in emissions due to changes in individual input data by fuel and fishing zone.
The results in
Table 38 show that all fuels have the highest percentage increase in emissions for changes in SFOC in all fishing zones. This suggests that using engines with a lower SFOC is the most effective way to reduce overall emissions in all fishing zones. By fishing zone, the sensitivity order of the input data in other and coastal zones was SFOC > moving running hour and load > working running hour and load. In offshore, the sensitivity order was SFOC > working running hour and load > moving running hour and load. These differences can be seen in Equation (1). In the calculation of annual consumption, which is related to the amount of emissions, other and coastal zones are more sensitive to the value of moving running hour × moving load being greater than the value of working running hour × working load. However, the opposite is true for offshore, where the value of working running hour × working load is greater than moving running hour × moving load. This contrast is believed to be the cause of the difference in sensitivity of the input data by fishing zone.
5. Discussion
As the pressure on environmental issues grows, the maritime industry is responding with regulatory measures, but small vessels have not yet been included in these regulations. The GHG emissions per unit output or unit fuel usage of small vessels are higher than those of large vessels. Thus, to reduce them, studies have been conducted to apply various eco-friendly fuels, but there are many difficulties in actual application due to various reasons. This study compared the environmental friendliness of LPG and Bio LPG fuels with conventional fuels, gasoline, and marine diesel, for a 200 kW-class LPG engine under development in South Korea for the first time, which applies to actual ships.
The results in Chapter 4.1 show that utilization of LPG and Bio LPG fuels can reduce GHG emissions by more than 30% and 65%, respectively, compared to gasoline and marine diesel, the existing fuels for small fishing vessels. These results suggest that LPG fuel is unlikely to meet the IMO’s goal of reducing total annual GHG emissions by at least 50% from 2008 levels by 2050. Moreover, a continued shift to Bio LPG will not only meet the IMO’s reduction targets but also result in at least 15% additional GHG reductions. In addition, the application of both fuels in small vessels is expected to reduce GHG emissions and proactively respond to future IMO emission regulations that may be applied to small vessels. One way to do this is to use LPG fuel as a bridge fuel that can respond to the gradually tightening emission regulations by blending it with Bio LPG before applying 100% Bio LPG in the future as Bio LPG production technology advances and production volume increases. Since Bio LPG fuel can utilize waste residues among various materials, it is expected to have a higher GHG reduction effect than Bio LPG made from the two palm oils used in this study, considering the suppression of CH4 production generated by the decay of waste residues. Furthermore, although it is not carbon-free fuel like hydrogen and ammonia, it could be used as a fuel with another good feature to protect the environment because it can use waste residue as a material.
Section 4.1 analyzed the sensitivity of input data at each stage of the fuel’s life cycle. In addition, methods were presented to minimize the emission factors at each stage by separating the input data that cannot be planned for from those that can. The proposed methods are feasible options, and it is believed that these methods can reduce the GWP contribution of each stage’s emission factor, thereby reducing the WtW emission factor of the fuel.
The results in
Section 4.2 can be actively utilized to promote policies such as the government’s promotion of eco-friendly engines for small vessels. For example, in 2018, the GHG emissions of the marine fisheries sector in South Korea were 4,061,000 tons [
56]. The overall GHG reduction over the ship’s life cycle through the promotion of LPG eco-friendly engines can be expected to be 80% of the annual GHG emissions in the marine and fisheries sector if LPG fuel is used, and 194% and 182% for Bio LPG fuels using CPO and RBD, respectively. Comparing this to annualized emissions rather than ship life cycles, LPG fuel has a reduction effect of about 2.7% of annualized GHG emissions in the marine fisheries sector, while the Bio LPG fuels using CPO and RBD have a reduction effect of approximately 6.5% and 6.1%, respectively. Considering that the number of fishing vessels with 180 to 220 kW engines used as a sample for this study is approximately 8.6% of the total number of registered vessels in South Korea, and their engine power is not high, a substantial GHG reduction effect can be expected by spreading eco-friendly LPG engines to all small fishing vessels. This can also be an important indicator for prioritizing government policies. This study can be utilized as an important resource for the promotion of various eco-friendly engines and not only LPG engines, which are the subject of this study.
Section 4.2 analyzed the sensitivity of the input data affecting the amount of emissions by fuel and fishing zone. Based on the results of the analysis, the sensitivity of the input data is presented in order by fuel and fishing zone. However, the input data that affect the total emission amount are determined by external factors such as the ship’s operating conditions, sea, or weather conditions. Therefore, it is not easy to reduce the total emission amount by using them.
Despite the achievements presented above, this study has a limitation in that it applies universal data to the entire fleet, and therefore fails to account for important individual vessel specificities that can affect LCA results. For example, even if a vessel uses the same fuel and operates in the same fishing zone, it is not possible to take into account all the operating characteristics of individual vessels, which vary in annual operating hours and engine load depending on various operating conditions, such as sea conditions and the type of seafood targeted during fishing. In addition, recent eco-friendly vessels consider various propulsion systems such as electric and hybrid propulsions, but this study only considers direct propulsion. The last limitation is that only the GHG-related part of the exhaust emissions of each fuel was studied. However, the novelty of this study is that it used the LCA method for the application of LPG and Bio LPG fuels in small vessels for the first time.
In addition to the GHG reduction benefits, there are several other advantages of converting conventional fuels into LPG and Bio LPG. First, LPG and Bio LPG weigh less than conventional fuels for the same annual energy requirement. This means that the reduced weight of the fuel can be used to ship cargoes, allowing for longer bunkering intervals and more time available for fishing. Second, fuel costs can be reduced through government subsidies for LPG and Bio LPG fuels. In South Korea, LPG fuel is not yet a tax-free fuel for fishing, making it uneconomical for fishermen. However, unlike LNG, there is a legal basis to apply tax exemptions to LPG fuel. Therefore, it is expected that applying tax exemptions to LPG fuel will reduce fuel costs for fishermen and promote eco-friendly engines.
Based on this study, further research plans to complement the shortcomings of the current study include a study on the differences in the application of LPG and Bio LPG fuels in small fishing vessels according to various propulsion systems. Furthermore, research will be conducted by applying LCA techniques to the application of various other eco-friendly fuels to small fishing vessels that were not addressed in this study. Finally, if LPG fuel is tax exempted, research is expected on the economic feasibility of LPG fuel compared to conventional fuels.


