1. Introduction
Vertical eddy viscosity coefficient (VEVC) is an important parameter used in the study of ocean dynamics, and it is a scaling factor that describes the momentum transfer process in fluids. It represents the rate of momentum transfer per unit area per unit time. VEVC is widely used in ocean models to simulate and study the vertical mixing process in the ocean and various phenomena in ocean dynamics [
1]. It has important implications for the vertical structure of the ocean, the formation and evolution of the mixing layer, ocean circulation and marine biological and chemical processes [
2]. Many ocean phenomena and physical quantities are closely related to wind stress at the sea surface [
3,
4,
5,
6], especially the VEVC [
7,
8,
9,
10]. The VEVC is a key parameter in the viscosity term of the ocean Navier–Stokes equations, which describe the internal frictional effects of the fluid and the energy exchange between eddies [
11,
12]. Additionally, VEVC has a significant impact on some classical dynamic processes in the ocean, such as the Ekman current, near-inertial internal waves, circulation and turbulent mixing processes [
13,
14,
15,
16]. However, VEVC is difficult to measure directly in the real ocean circumstance, so it is usually calculated based on turbulence models, such as the Richardson number-dependent model, KPP model, k-ε model, Prandtl mixed-length model and M-Y model. The parameters of these models have large uncertainties that affect the simulation accuracy of the VEVC. Therefore, there is an urgent need for an effective method to improve the accuracy of the simulated VEVC [
11,
15,
17,
18].
An adjoint assimilation method is a widely used data assimilation technique which can directly assimilate various observations distributed in time and space into a numerical model, while maintaining consistency with the model in terms of its dynamics and physics [
19,
20] (Zhang and Lu 2010). However, there are often wide fluctuations and large errors in measured data that affect the accuracy of the parameter inversion. Therefore, some interpolation methods are usually combined with the Ekman model to improve the estimation accuracy of the vertical eddy viscosity coefficient [
11,
17]. The Ekman model does not need to express the buoyancy-forcing and stratification effects explicitly, but rather responds to them through the values of the viscosity and boundary layer parameters, and it is easy to solve the Ekman model to explore the effects of specific parameters [
21]. Wu et al. [
22] studied the inversion of VEVC in ideal experiments using the optimal control theory and variational principle based on the adjoint assimilation method. This paper extends Wu’s [
22] work to invert the depth distribution of VEVC using the measured data and to explore the effect of wind stress. The triangular polynomial interpolation scheme was adopted to enhance the adjoint assimilation process of the data, which has been demonstrated to be more effective in improving the accuracy of the Ekman model inversion.
The wind has an important influence on the dynamic process of sea–air interaction, especially on the Ekman transport process [
23,
24,
25,
26,
27,
28,
29,
30,
31]. In the Ekman model, which is based on linear stability conditions, the basic assumptions are that the seawater is considered to be stationary and free of eddies, as well as having a uniform density and temperature, and the currents are considered to be uniform and gentle. In this model, the magnitude and direction of the wind stress at the sea’s surface affect the estimation results of the vertical eddy viscosity coefficient. Therefore, based on the previous ideal experiments, several strong and weak wind processes were selected by screening the measured wind speed data according to the wind speed magnitude. The main purpose is to study the effects of wind stress on VEVC under different wind fields in shallow offshore waters in the framework of the Ekman model. This paper mainly explores the effects of wind speed strength and wind steering on VEVC and the effect of the change of sea surface wind field on the kinetic energy of each layer.
The structure of this paper is as follows:
Section 2 introduces the theoretical model and the screening for different wind progresses,
Section 3 discusses the curve variation of the inversion of VEVC in wind-field backgrounds with different intensities,
Section 4 focuses on the effect of wind steering on the VEVC curve in the inversion process,
Section 5 investigates the effect of wind-field variation on the kinetic energy distribution and
Section 6 gives the conclusion of this paper.
2. Theoretical Model and Screening of Measured Data
2.1. Model Description
In the study of physical processes in the upper ocean, especially turbulent processes, the Ekman model is one of the models widely used by previous authors; the modified Ekman model is used in this paper to invert the ocean vertical eddy viscosity coefficients [
1]. The model describes the relationship between wind stress and currents based on the equilibrium between Coriolis forces and friction. It provides important information for describing vertical profile current velocities (Ekman spiral) and surface drift (Ekman drift). Errors in the model may arise from parameterization and inaccurate initial conditions. These errors could be reduced by comparing observed data with simulated data in the adjoint assimilation method to optimize the initial field and optimize the vertical eddy viscosity coefficient.
The control equations of the forward model (Yu et al., 1991) [
32] are as follows:
where
z is the water depth (positive direction with the z-axis vertically upwards) and the surface of the ocean is defined as
z = 0. Variables
u (positive in the due east direction) and
v (positive in the due east direction) are the horizontal components of the current velocity in the ocean,
f is the Coriolis parameter (
f is a constant) and
A is the vertical eddy viscosity coefficient. The finite difference format of Equation (1) is shown in
Appendix A.
Some interpolation methods are usually used to optimize
A, and the triangular polynomial interpolation scheme is used in this paper, a scheme which is derived from the method presented by Nie et al. [
33]. With the addition of a triangular polynomial interpolation scheme to the adjoint assimilation model, the optimized correction equation for the vertical eddy viscosity coefficient in the vertical direction is as follows:
where
denotes the frequency of trig functions in the inversion and
H0 denotes the depth of the Ekman layer.
The initial conditions are as follows:
where
and
are initial current velocity components.
The current caused by the downward transfer of energy due to the action of the surface wind field in the Ekman model has a certain depth of influence (Ekman depth); the influence of the downward transfer of energy is relatively very weak at this depth, so the corresponding boundary conditions are as follows:
where
Cd is the wind stress drag coefficient,
ρa represents the density of air,
ρw represents the density of water and
ua and
va are the horizontal components of the wind speed at a height of 10 m.
Next, observation data distributed over time and space are assimilated into the numerical model using the adjoint assimilation method. The adjoint equation is as follows:
First, construct the cost function:
where
and
denote observed values of current velocity,
u and
v denote simulated values and
denotes the weighting factor.
Also, the Lagrange function is constructed:
where
λ and
μ are Lagrange multipliers (also known as concomitant variables) for
u and
v, respectively. The objective is to find the minimization of the cost function subject to the control equations and the initial and boundary values, which translates into the problem of finding the stationary points of
u,
v,
A,
λ and
μ when the gradient of the Lagrangian function vanishes. This leads to the following equations.
The adjoint equations are as follows:
The corresponding boundary conditions are as follows:
The model is run in reverse, i.e., running from the end of the time to the start.
The final conditions are as follows:
where
T is the total time of integration (10 days) in the model.
The above equation gives the gradients of the cost function for the wind stress drag coefficient and VEVC:
In the equation above,
where
,
and
,
(
k = 0, 1, 2, …,
m) denote the priori coefficient and adjustment factors, respectively, which can be calculated in the adjoint assimilation model; α is the step size factor, which is used to adjust the magnitude of the iterations. In this paper,
= 0.5, based on the Crank–Nicolson method.
2.2. Data Introduction
The data of measured wind and current fields are adopted to investigate the effect of wind stress on the vertical eddy viscosity coefficient in the vertical direction. The data set mentioned above is from Buoy No. 17 of the Yellow Sea Station (geographical location: 36.18° N, 121.22° E, as shown in
Figure 1). It was provided by the Institute of Oceanography, Chinese Academy of Sciences, with data extending from 2016 to 2019, and mainly includes the data of maximum wind speed, wind direction corresponding to the maximum wind speed and current speed and direction at different depths; time resolution for all the data described above is 10 min. The wind speed data are at the height of 4 m from the sea’s surface, and the spatial resolution of the current field data is 2 m, with a depth of 3–40 m. In this paper, several strong wind processes and weak wind processes were selected for analysis to study the variation of VEVC with depth under different wind stress backgrounds and the effect of different wind stresses on the inversion performance of the Ekman model. Based on the effects of wind speed and wind direction on the VEVC curves, we speculate on the role of wind field strength and wind direction changes in the inversion process and further explore the changes in kinetic energy at each depth.
2.3. Screening for Strong/Weak Wind Processes
In this paper, the wind speed observation data of the same site (Buoy 17 in the Yellow Sea) from 2016 to 2019 was analyzed. Based on the data, two types of wind processes were identified. The first type was the strong wind process, which was characterized by the maximum wind speed fluctuating around 10 m/s and the maximum value in the interval not exceeding 25 m/s at the observation point. The second type was the weak wind process, which was characterized by the maximum wind speed fluctuating around 5 m/s and the maximum value in the interval not exceeding 10 m/s at the observation point. From the discrimination conditions above, five periods of strong and weak wind processes with a duration of 10 days were selected, respectively. The wind speed data points in each process were further analyzed statistically. A total of 85–90% of the data points in the weak wind process were below 7 m/s, and 55% of the data points in the strong wind process were above 7 m/s. The filtered measured data were substituted into the Ekman model to investigate the inversion of the vertical eddy viscosity coefficient in both the strong and the weak wind background. The specific time intervals were selected as shown in
Table 1, below:
2.4. Model Settings
The inversion process of the vertical eddy viscosity coefficient was performed by setting the model parameters as follows: the time resolution (Δt) was 0.5 h, the spatial resolution (Δz) was 1 m, the time integration interval (T) was 10 days, the Ekman layer depth (H0) was 40 m, the initial latitudinal and longitudinal velocities () were 0, the Coriolis parameter, f, was calculated from the latitude of the measured data, and the densities of seawater and air (ρw, ρa) were 1.025 × 10³ kg·m−3 and 1.2 kg·m−3, respectively.
The specific inversion steps are as follows:
- (a)
Given the initial value of the vertical eddy viscosity coefficient, the forward model is accordingly run to obtain the simulated value of the current velocity and considered to be the observed current value.
- (b)
The forward model is run with the constant initial guess of the VEVC to obtain the simulated values of the currents. The difference between the simulated and observed results is used to drive the inverse model.
- (c)
The cost function is solved and the gradient of the cost function relative to the vertical eddy viscosity coefficient is calculated.
- (d)
The values obtained from the inversion are optimized using a triangular polynomial interpolation scheme.
- (e)
Using the inverse values optimized by interpolation as the new initial values, steps (a)–(d) are iteratively carried out, while the convergence criterion is established, and when the inverse result satisfies the criterion, the iteration is stopped, and the final inverse value of the eddy viscosity coefficient is obtained.
3. The Impact of Wind Field Strength on VEVC
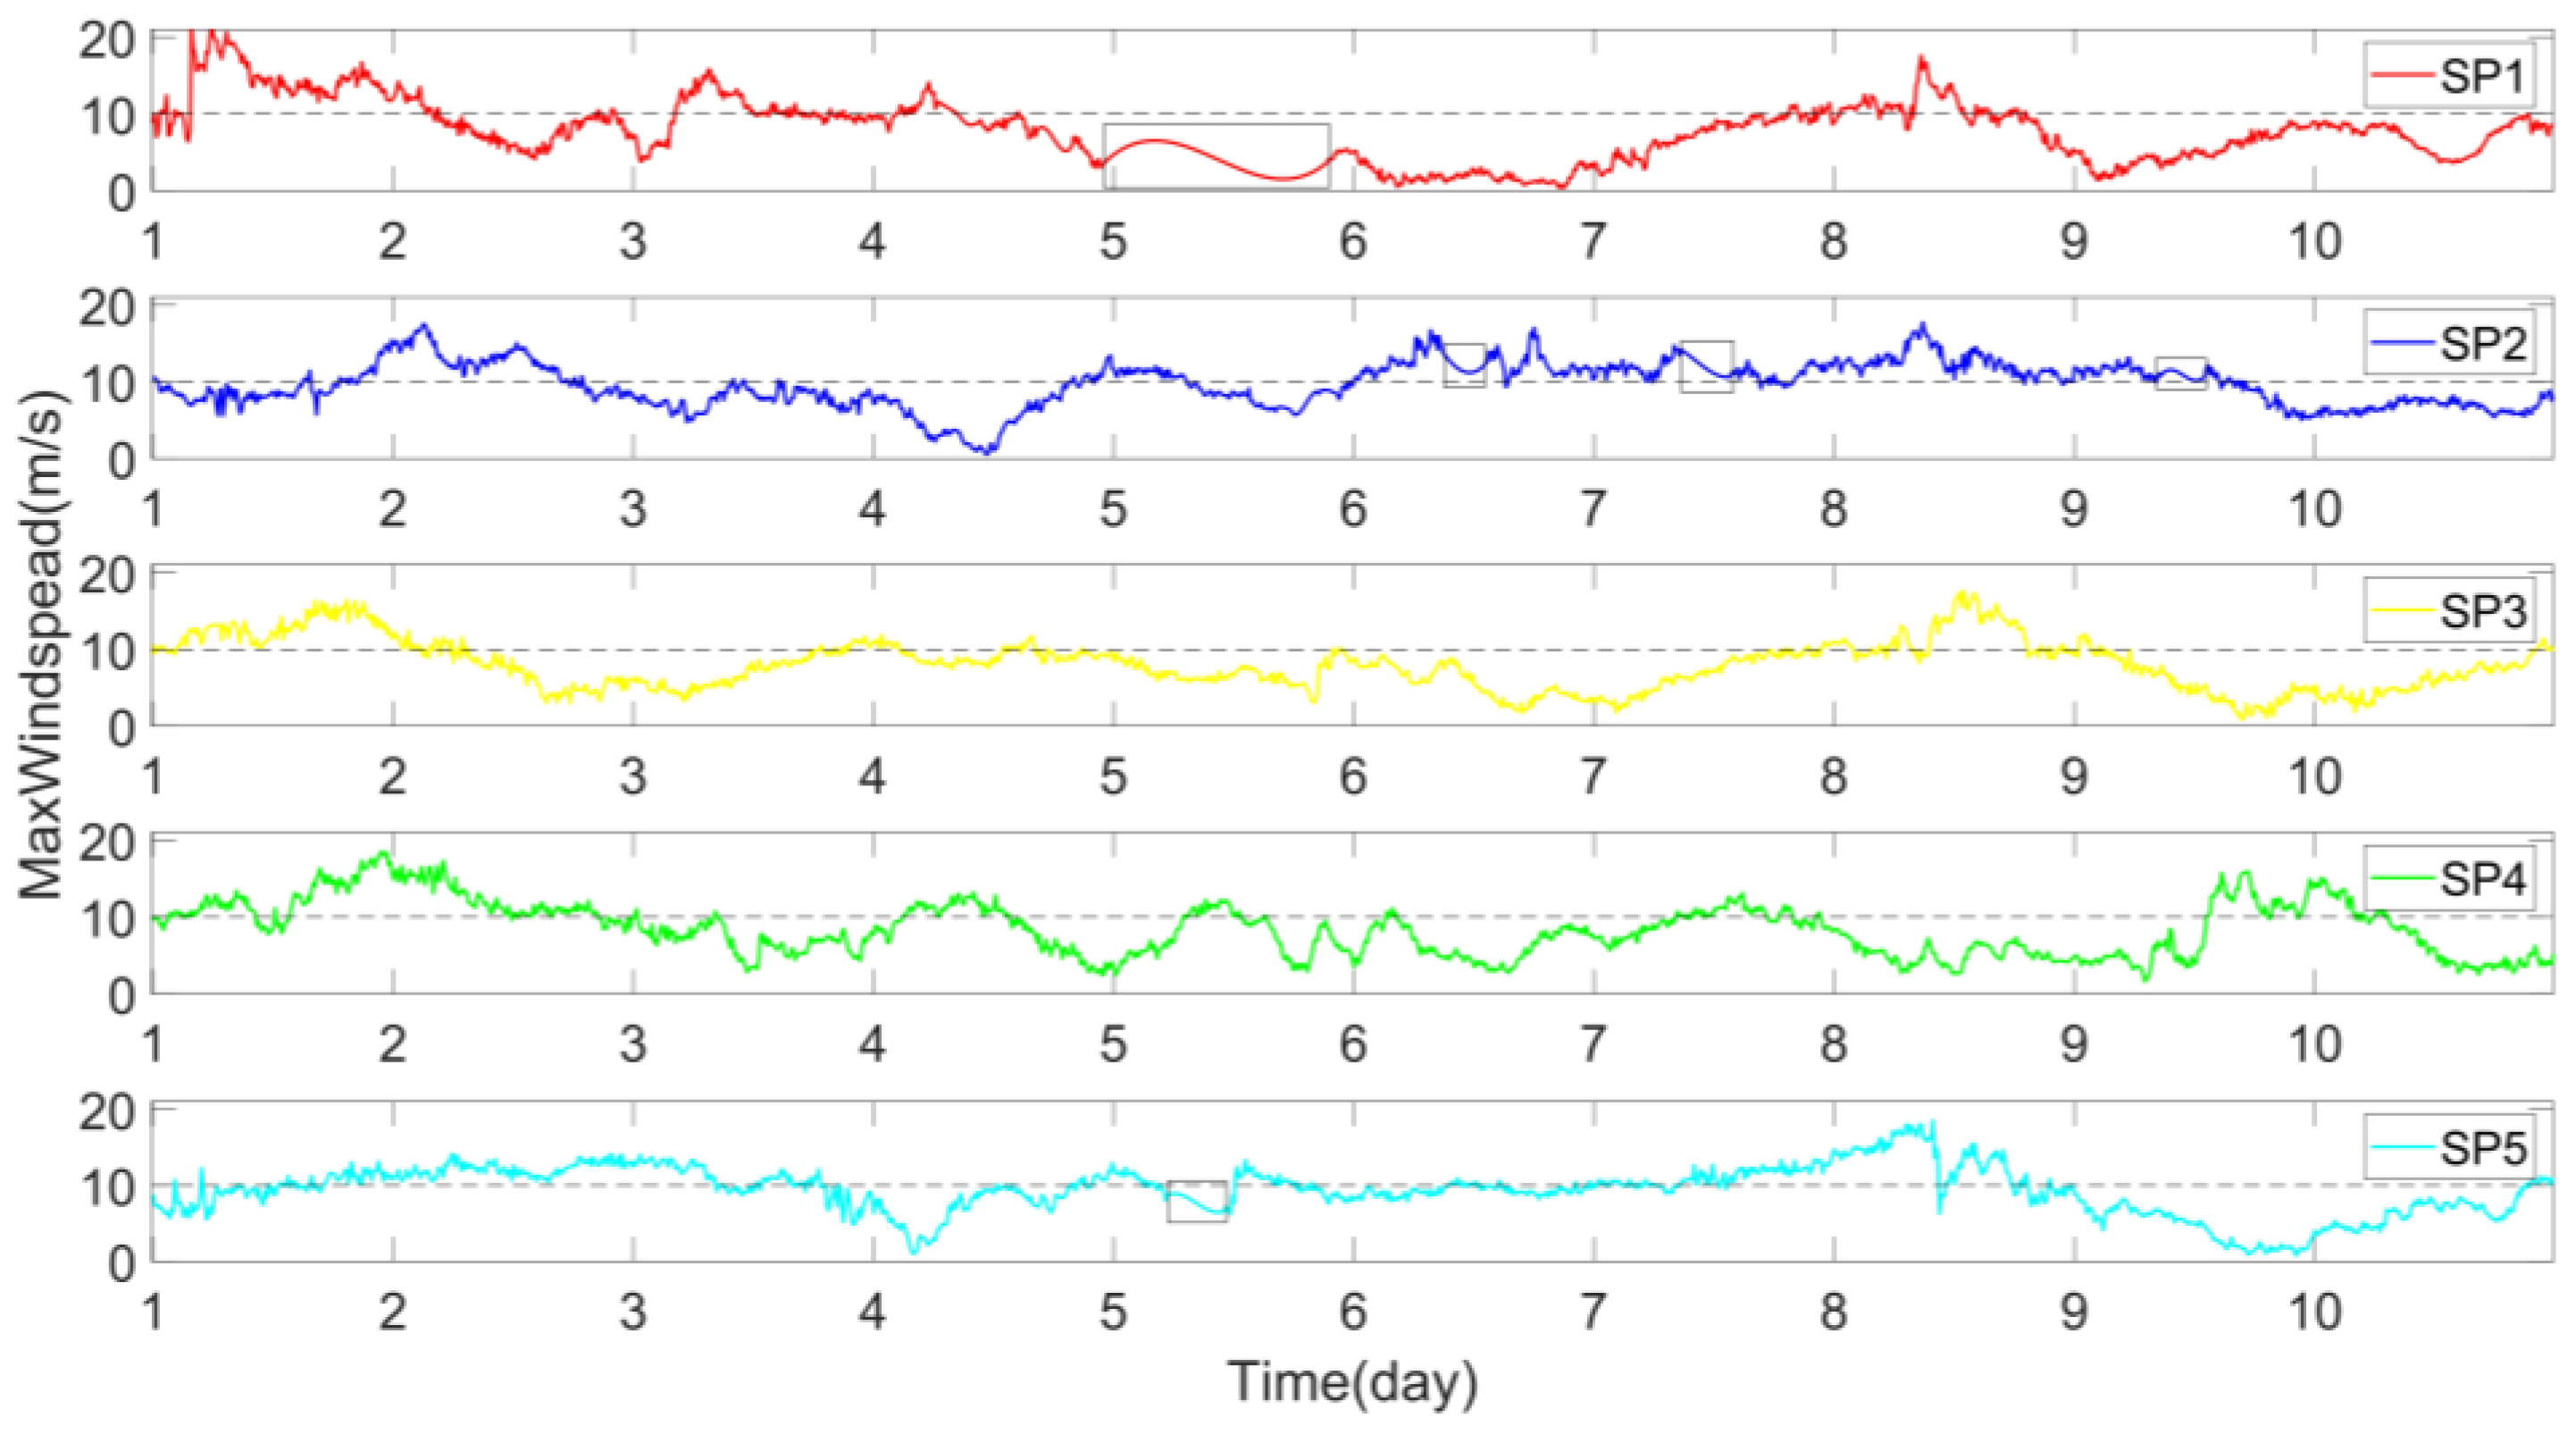
Firstly, we selected five strong wind processes with maximum wind speed fluctuating around 10 m/s from the general wind speed time series, as listed in
Table 1.
Figure 2 shows the maximum wind-speed time series for each process. Due to some unstable factors in the actual observation process, there may be missing values in certain intervals of the measured data, which would need to be filled in by some technical means. The modified Akima cubic Hermite interpolation polynomial method was used to fill in the missing data [
34]. This interpolation method provides smooth interpolation results when dealing with highly variable or noisy data points and retains the original trend of the data as a whole. The measured data used in this paper has high variability and instability, which makes this interpolation method more suitable.
After interpolating the general wind speed time series for each interval, we substituted the wind speeds for each of the 10 days into the Ekman model in the previous section. This resulted in an inversion curve of the VEVC with depth.
3.1. Inversion of VEVC in Strong Wind Fields
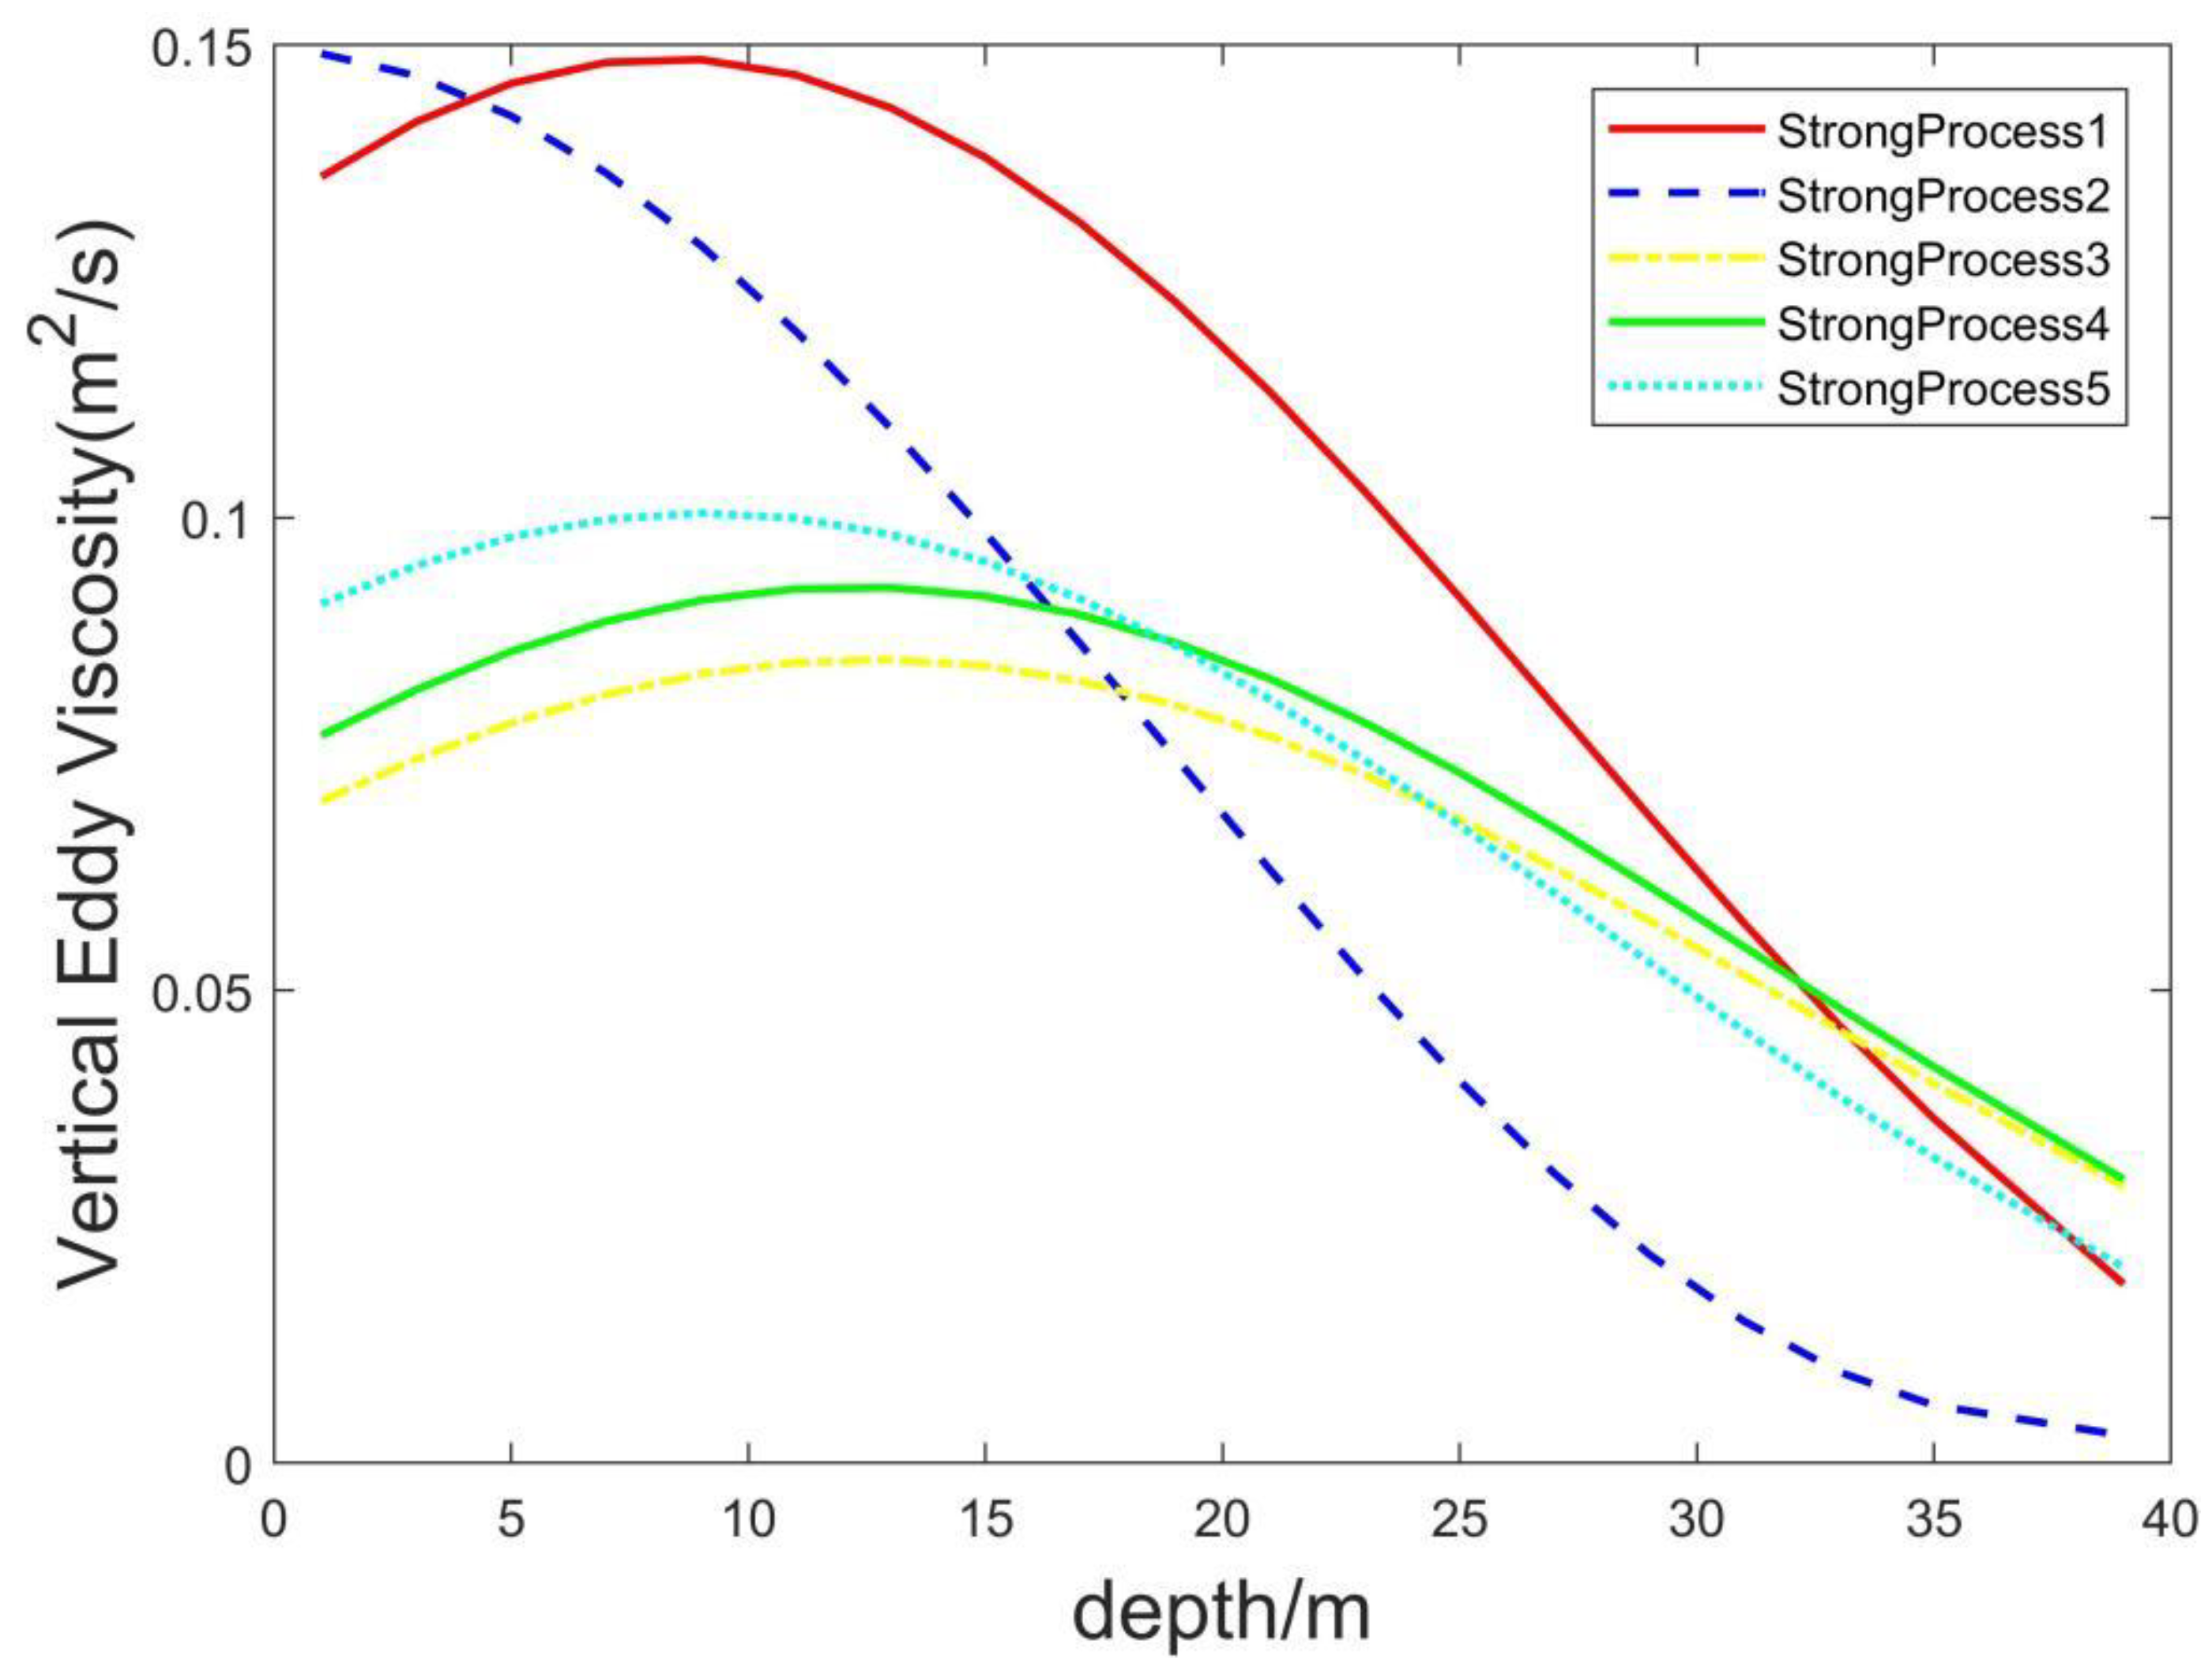
Figure 3 shows the variation of the final inversion values of the vertical eddy viscosity coefficient with depth for each of the five selected strong wind processes. The general trend of the curves is that the inversion values of VEVC increase slightly with lower depth in higher wind speed fields, reaching a maximum at around 10 m depth for all five processes. Beyond 10 m depth, the inverse VEVC values decrease monotonically with increasing depth. This trend continues until the bottom of the selected observations, i.e., around 40 m depth, when the inversion curve of VEVC reaches its minimum value.
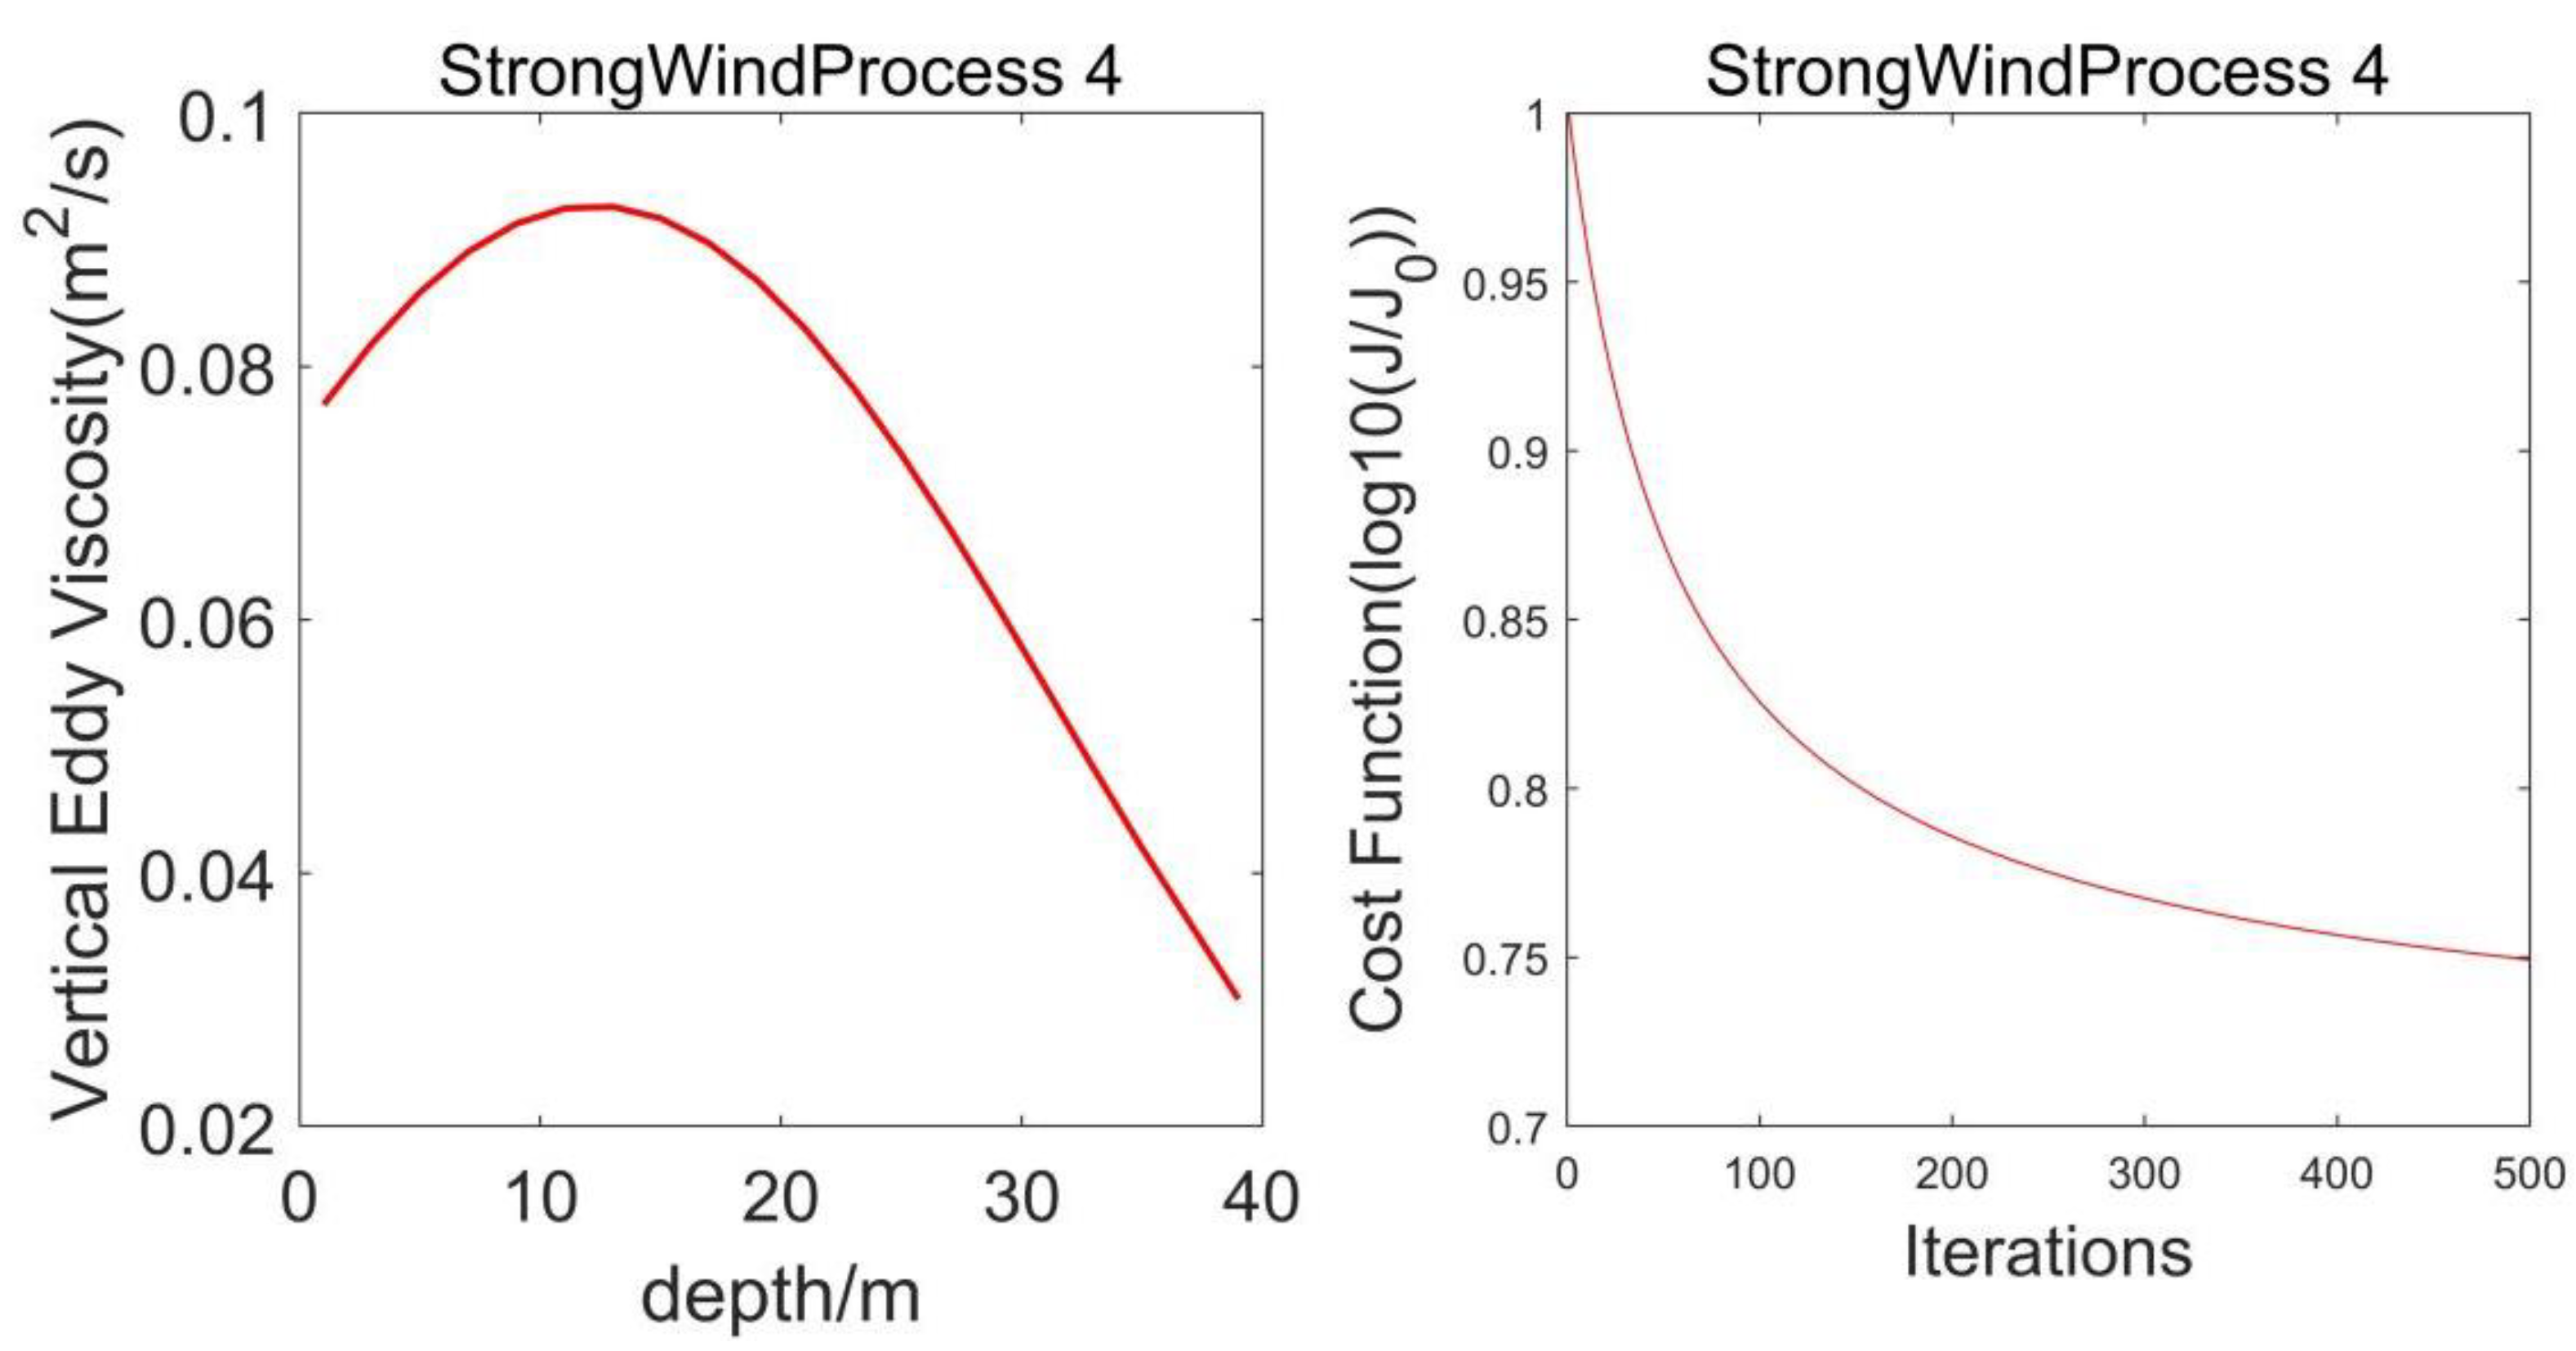
To observe clearly the variation of the VEVC curves in the strong wind background, we selected strong wind process 4 and analyzed the inversion of VEVC values with depth along with the cost function curves during the inversion process.
Figure 4 shows that the inversion values of VEVC were consistent with the general trend analyzed above, increasing slightly with depth at first and then decreasing monotonically with depth beyond 10 m until the bottom 40 m of the observations. The cost function curve decreases monotonically with the number of inversion steps, and the slope of the curve shows that the decreasing rate of the cost function is larger at the beginning of the inversion, and then decreases with the inversion process. This phenomenon reflects the fact that the simulated current velocity values gradually approach the actual observed values under the accumulation of inversion steps, which also indicates that the inversion values of VEVC gradually approach the actual values.
3.2. Inversion of VEVC in Weak Wind Fields
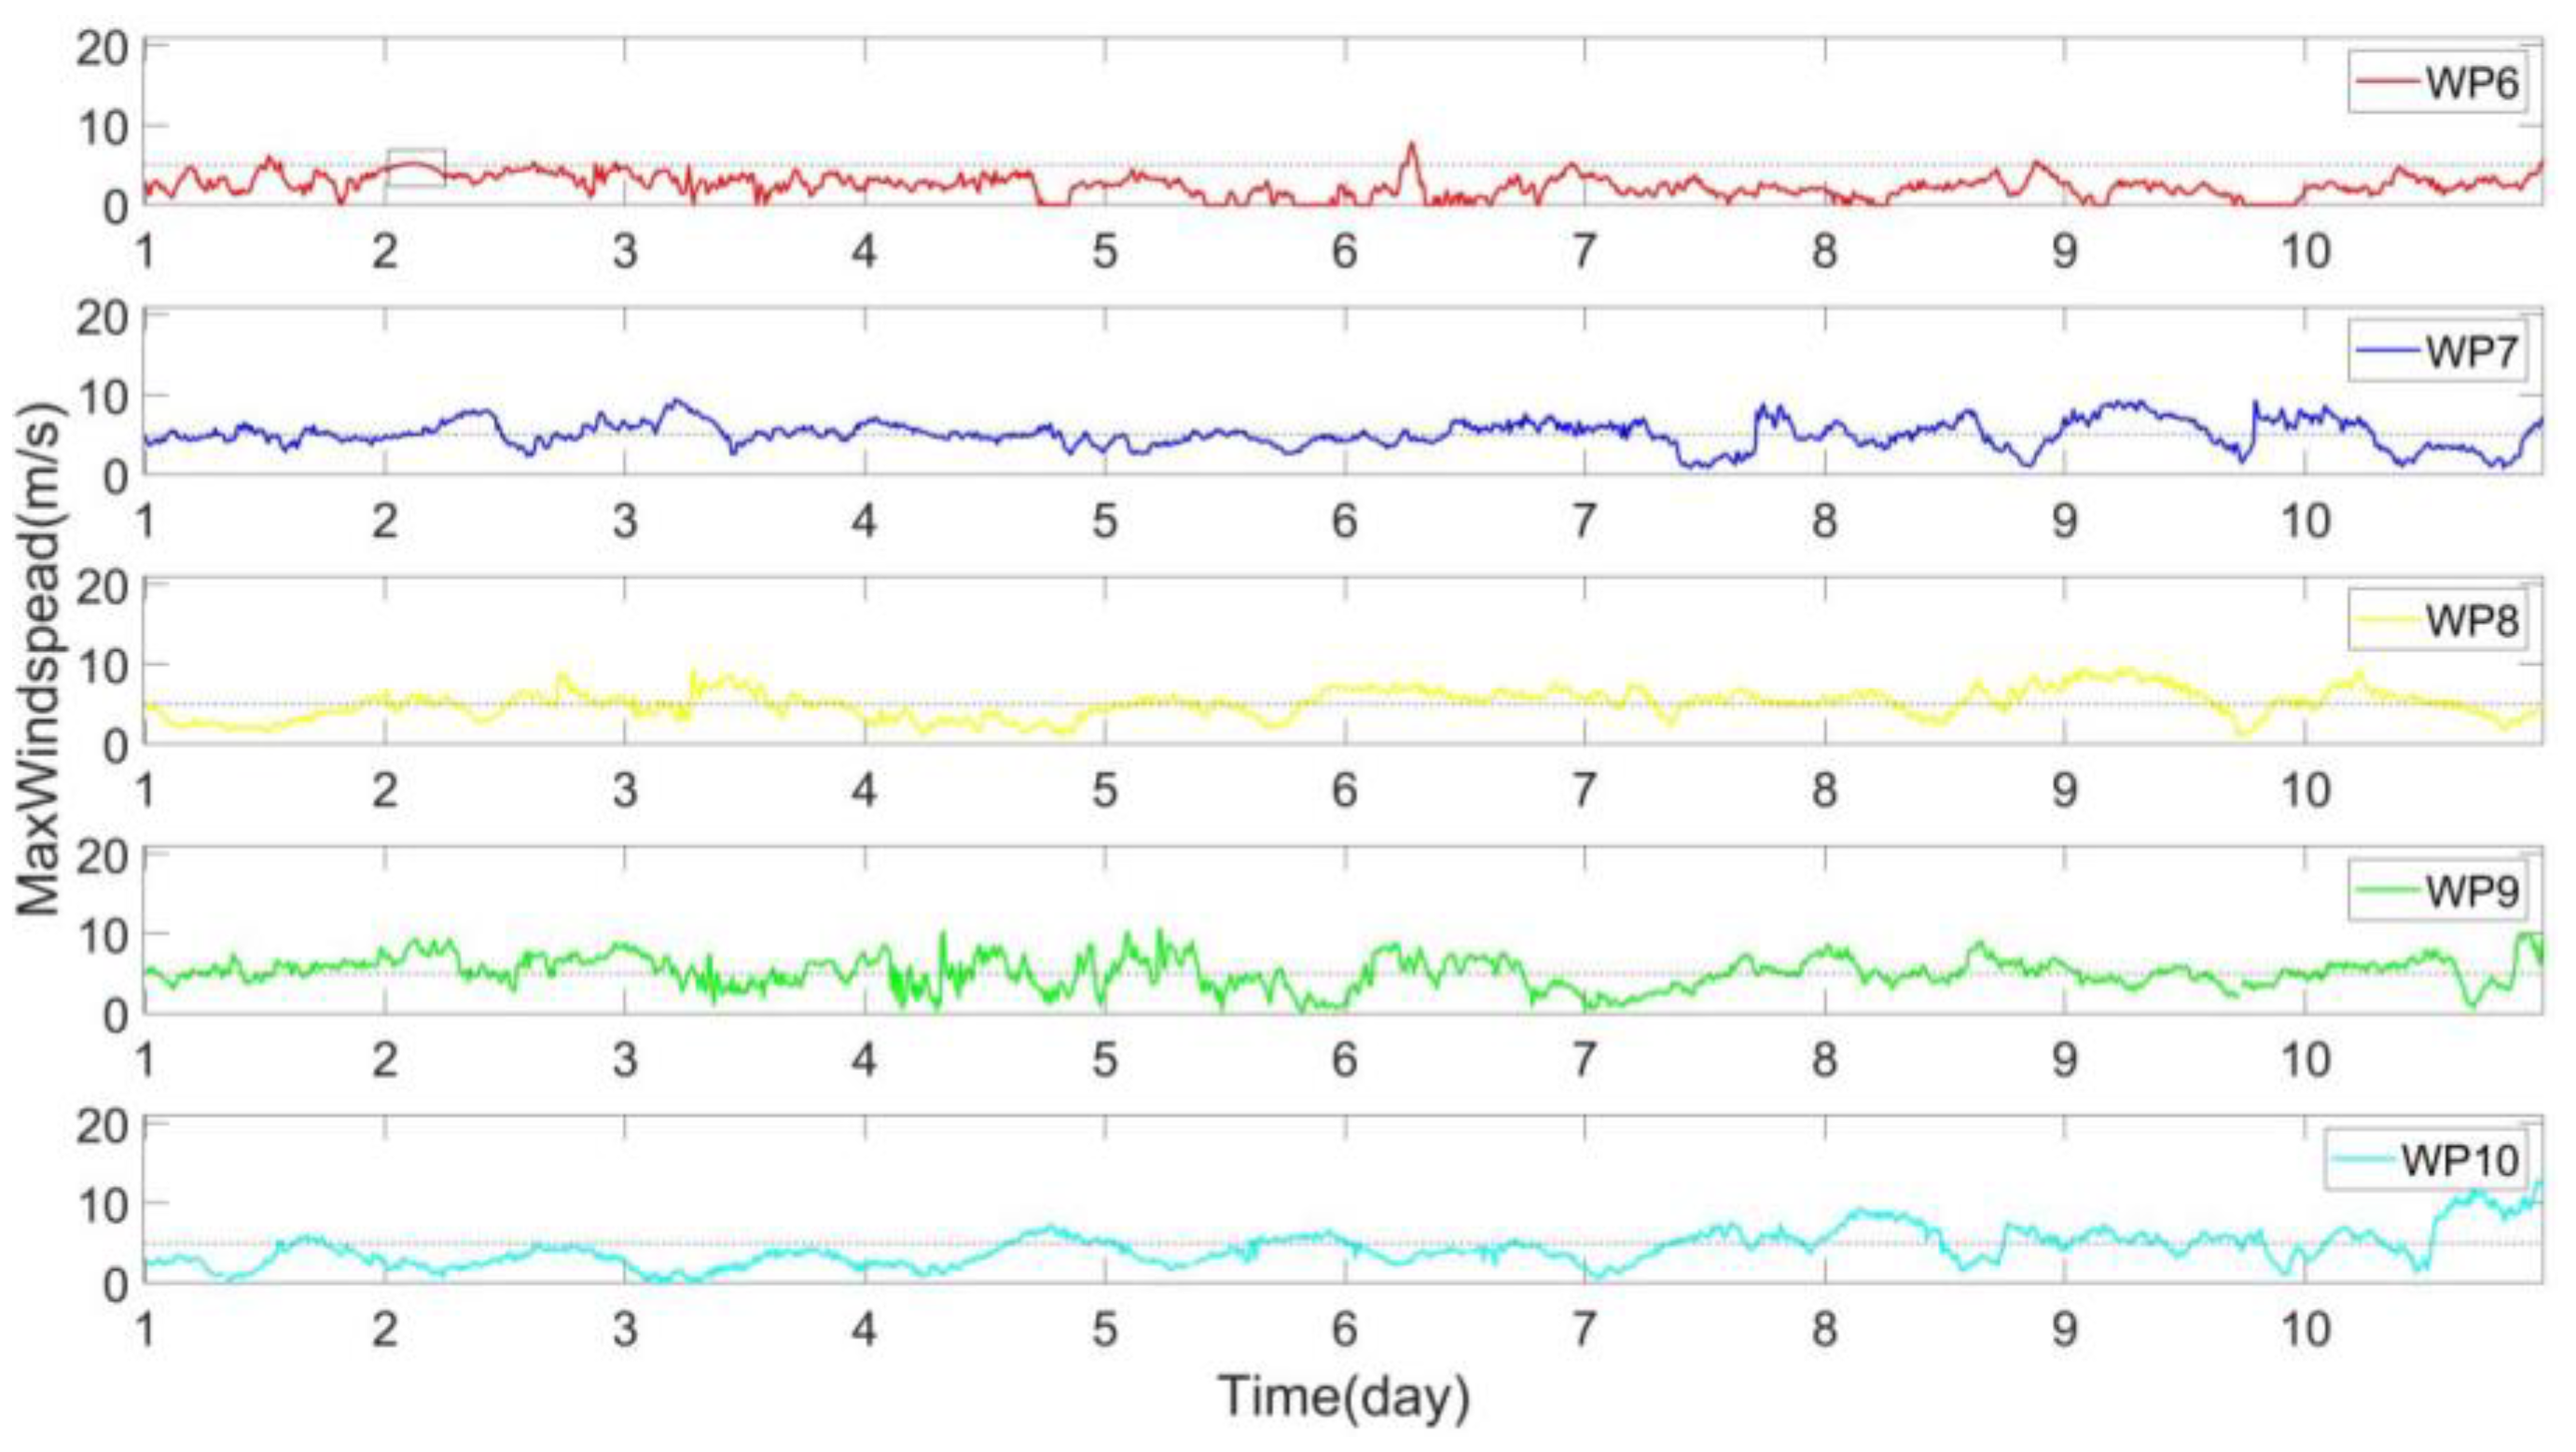
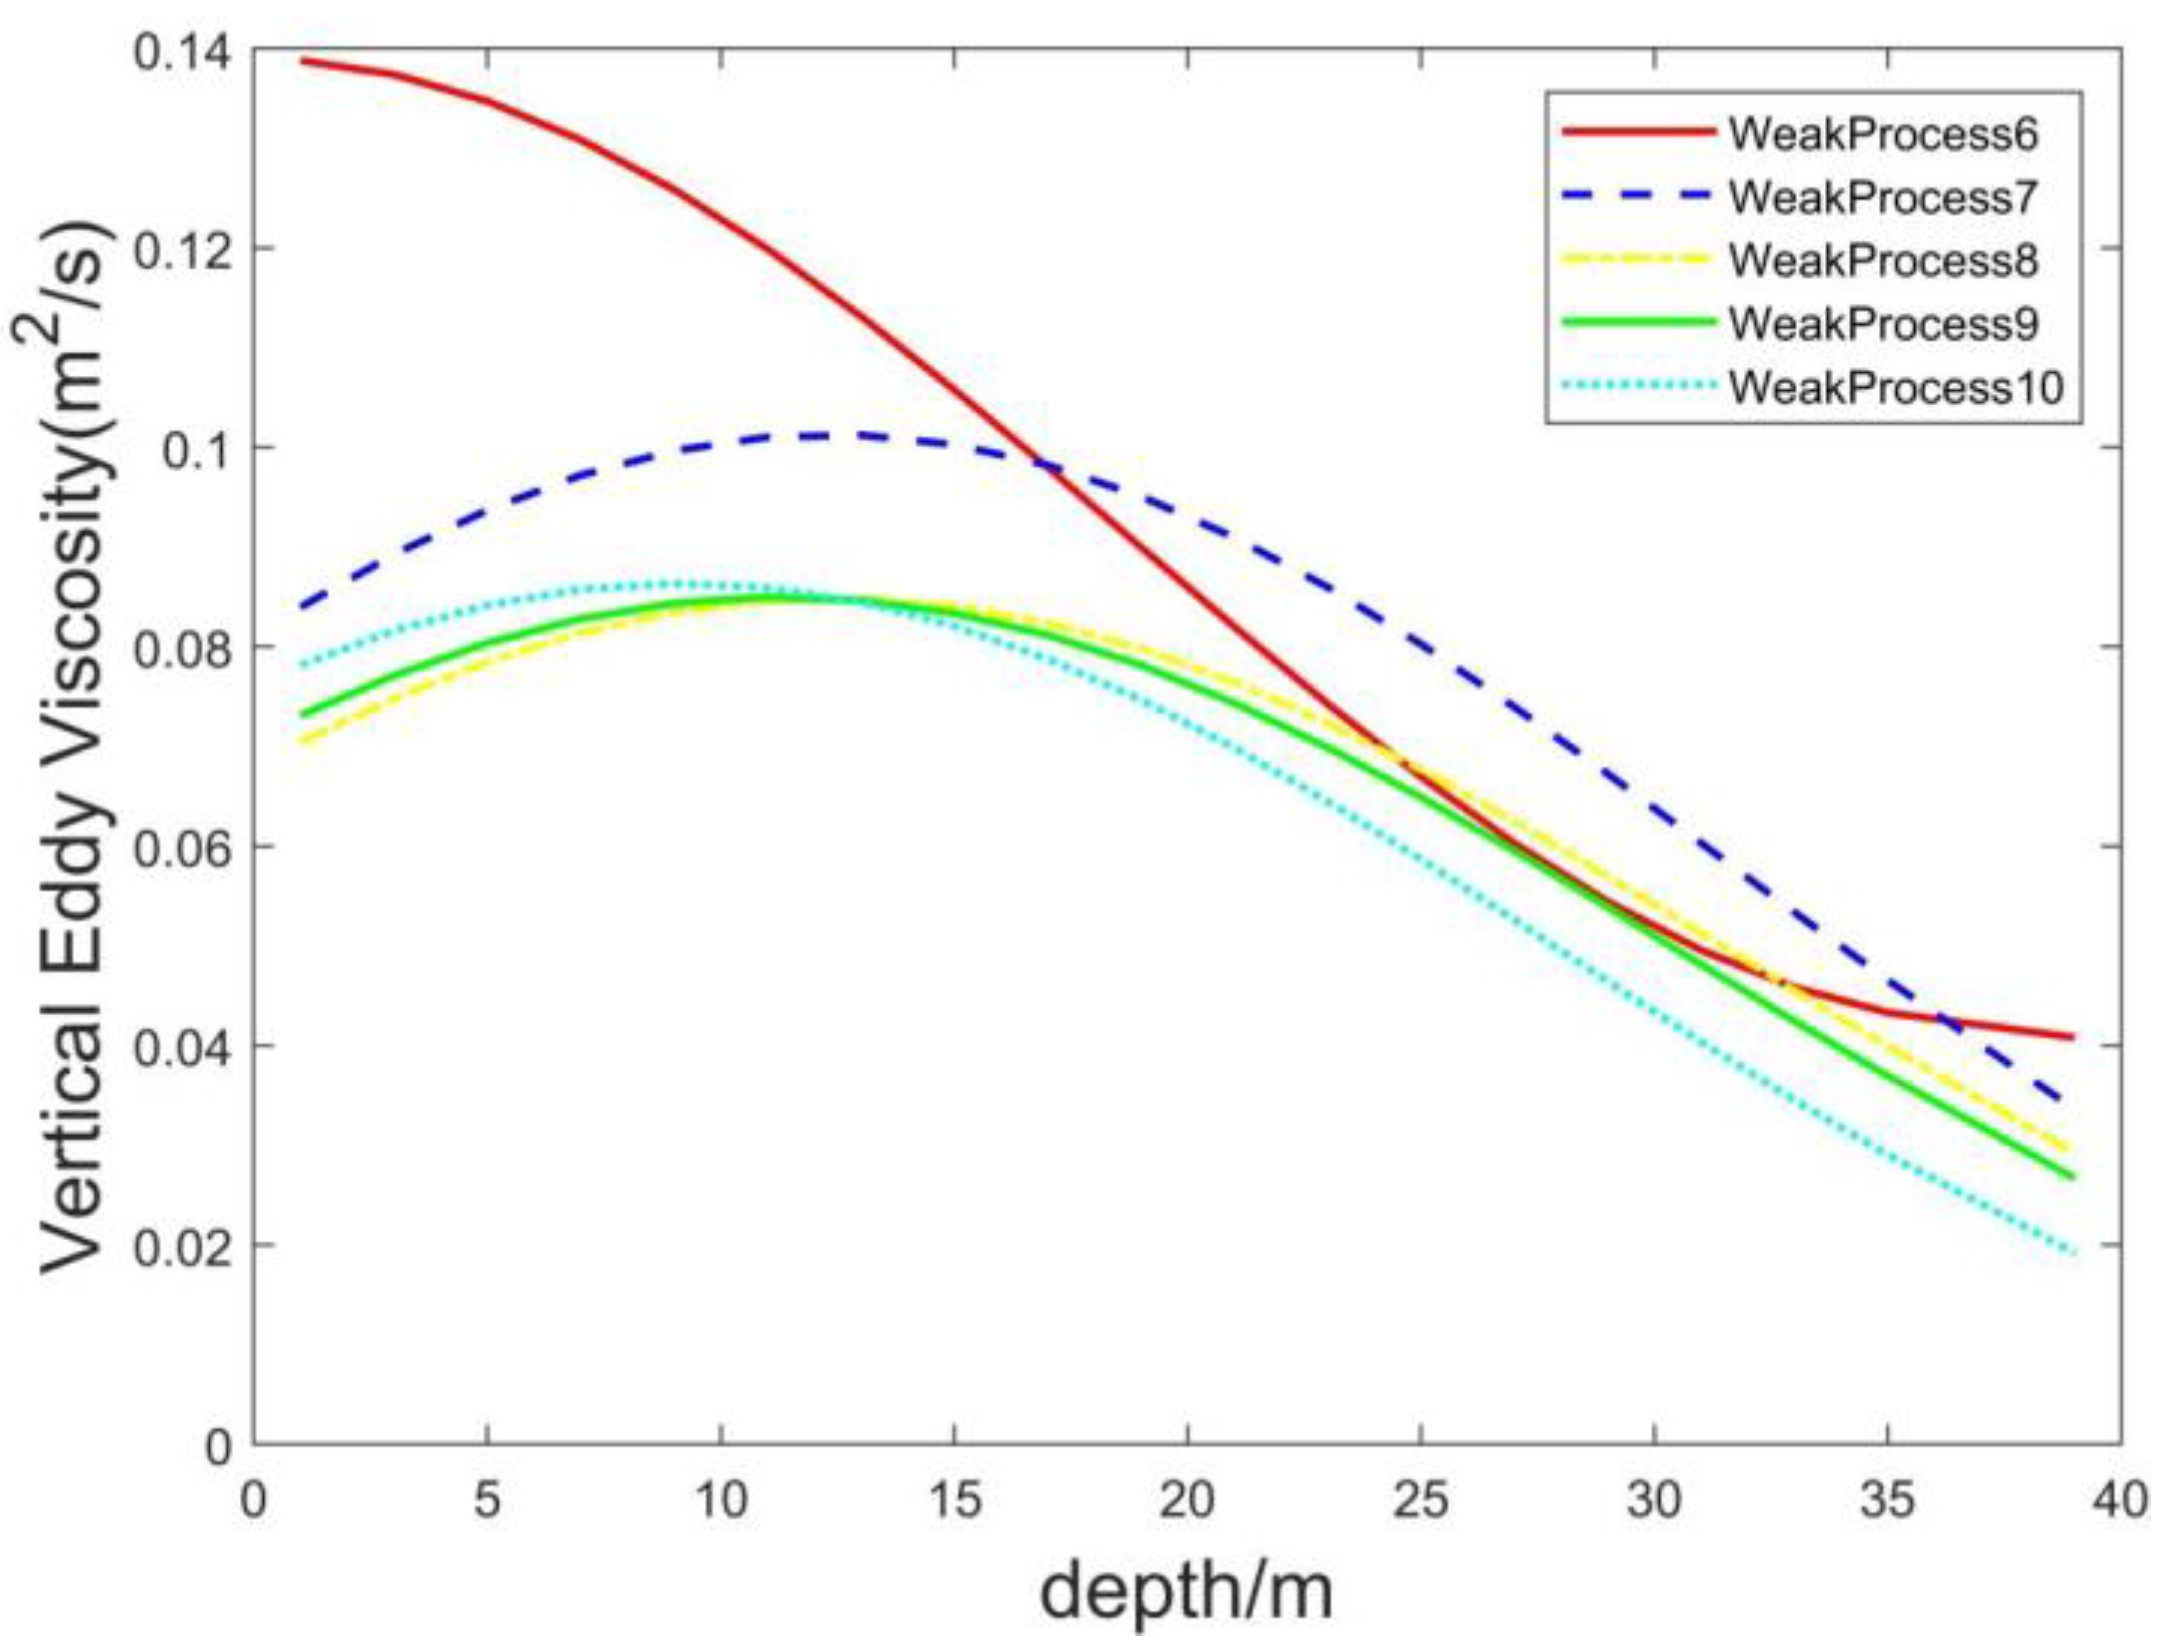
To investigate the influence of wind stress in the inversion of VEVC, this subsection discusses and analyzes weak wind processes. Similarly to the previous subsection, we selected five weak wind processes with wind speeds below 7 m/s that account for 85–90% of the total data, and the time series are shown in
Figure 5. We substituted the time series of wind speed into the Ekman model to obtain the VEVC variation curve with depth in the weak wind background.
Figure 6 shows the variation of the inverse VEVC values with depth for the five groups of processes under the weak wind background field. The general trend is similar to that of the VEVC in the strong wind background field: they increase slightly with depth at first, followed by a monotonic decrease. However, the rate of change of the VEVC inversion curve in the weak wind background differs from that in the strong wind background. Firstly, the extremes of the VEVC inversion curves are different in the different wind fields: in the strong wind field, the VEVC inversions reach their interval maximum near 10 m or before reaching 10 m depth, whereas in the weaker wind field, the VEVC inversions reach their interval maximum at 12.5 m depth or below. Secondly, the magnitude of the VEVC inversion curves varies in different wind field backgrounds, with more significant changes in the strong wind field than in the weak wind field, i.e., the curves in weak wind fields are flatter and less variable.
3.3. Synthetic Analysis of the VEVC Inversion Curve
After analyzing the data presented in
Figure 4 and
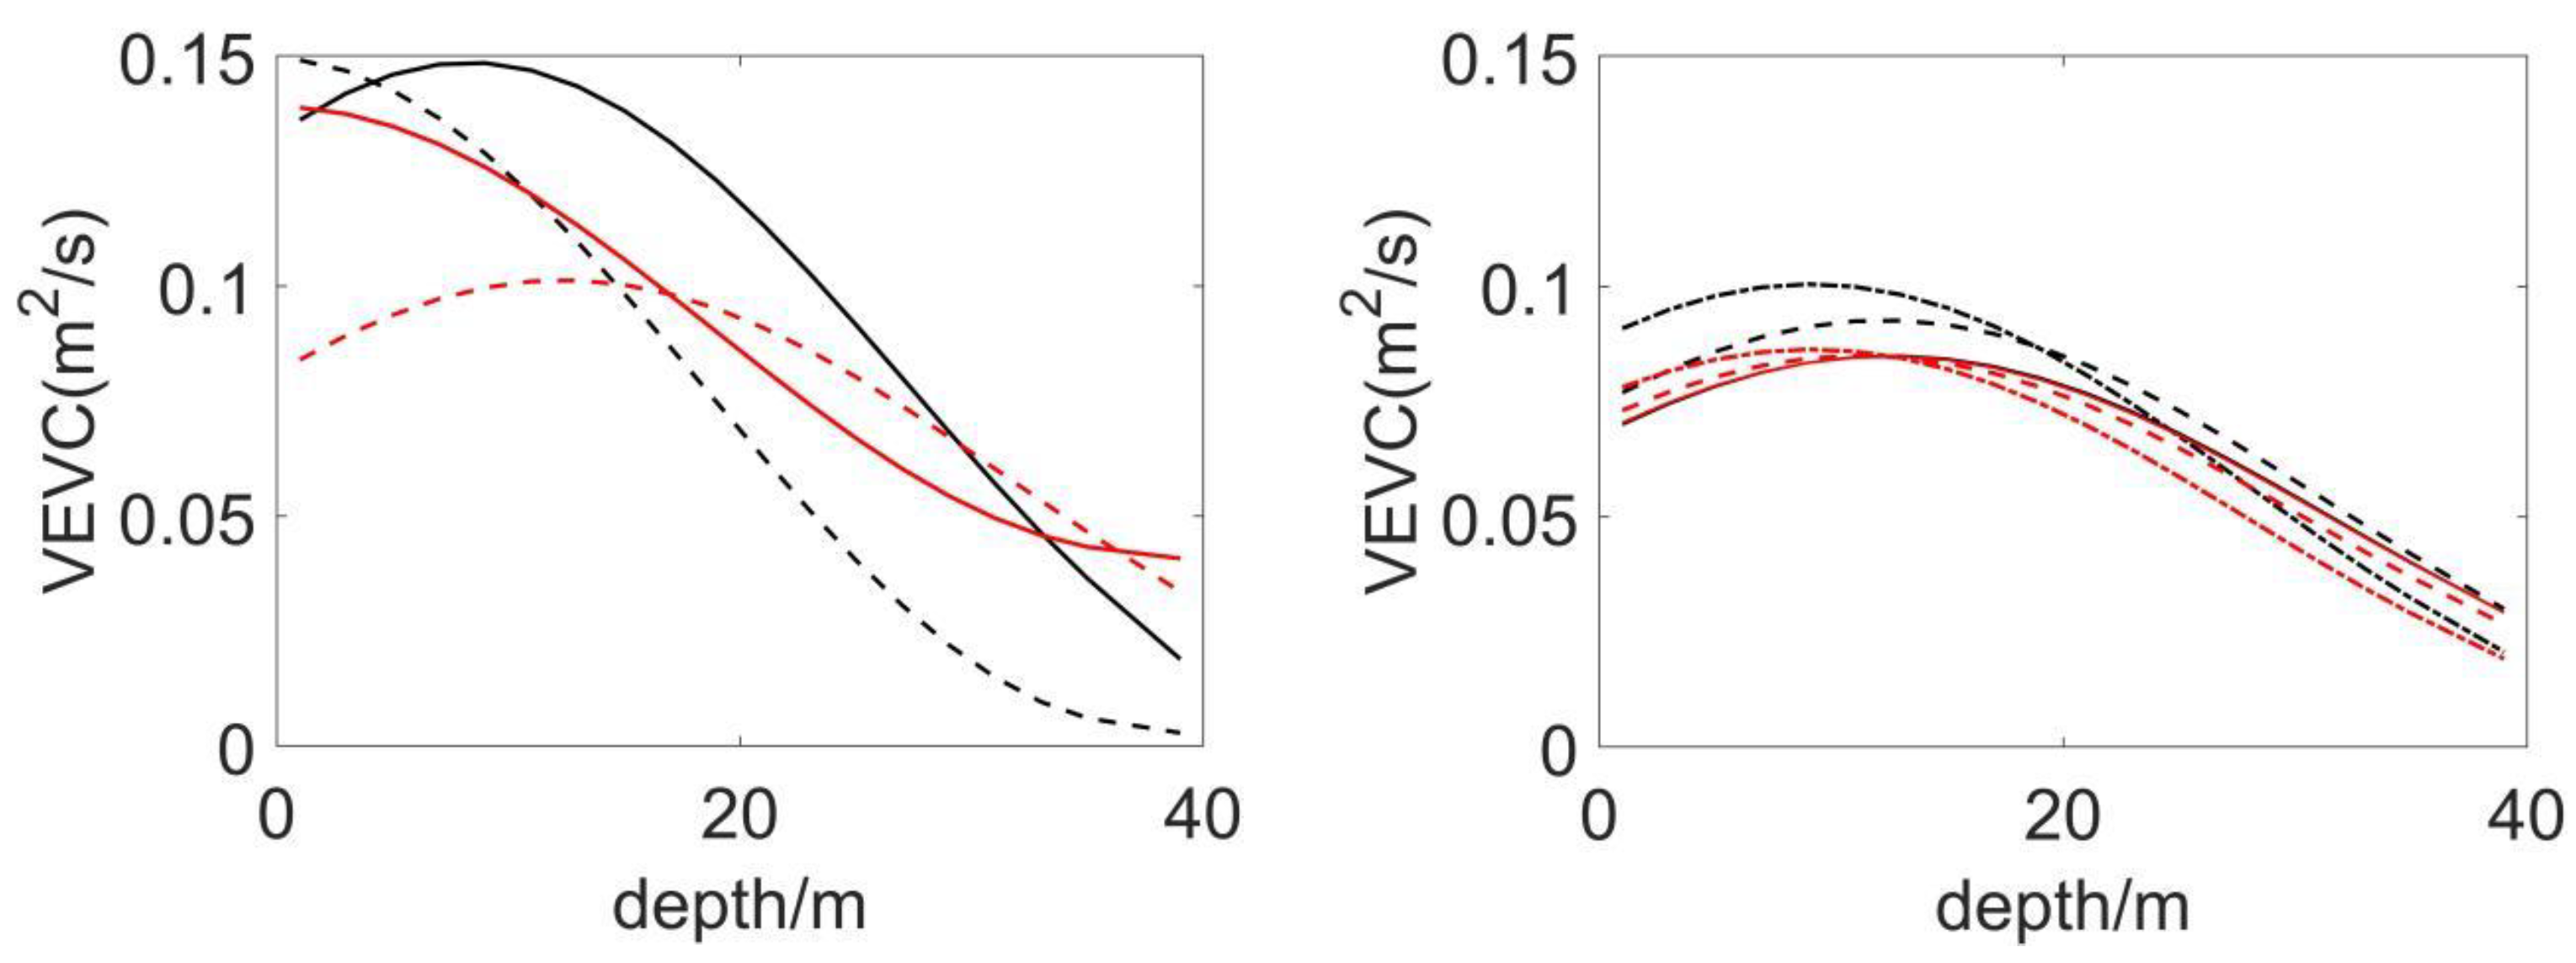
Figure 6, it was observed that the four curves, representing strong wind processes 1 and 2 and weak wind processes 6 and 7, exhibited an obvious deviation from the general trend. Therefore, a synthetic analysis was performed on these four abnormal curves and the remaining curves that displayed a normal trend, as illustrated in
Figure 7. Upon closer observation of
Figure 7, it is clear that the black curves generally appear above the red curves. This indicates that VEVC inversion values obtained during strong wind conditions are generally higher than those obtained during weak wind conditions.
Moreover, least-squares linear fitting was performed on the VEVC inversion curves for different wind processes, and the fitted slope (
k), intercept (
b), and average value (
a) of the curves are presented in
Table 2. The results indicate that the mean value of the curve is significantly higher for the strong wind process than for the weak wind process. This suggests that the VEVC values obtained during inversion in a strong wind background are generally greater compared to those obtained in the weak wind process. This confirms the aforementioned analysis.
Furthermore, the absolute value of the curvature fitted to the strong wind process is relatively large, while it is smaller for the weak wind process. This implies that there is a more rapid decrease in VEVC inversion with depth in a strong wind background. In addition, the intercept of the strong wind process is higher than that of the weak wind process. This indicates that the inverse value of the VEVC in the surface water is relatively higher for a stronger background wind speed.
As two of the four anomalous trend curves correspond to the strong wind process while the other two correspond to the weak wind process, it is unlikely that the background wind speed is the primary reason for the anomalous trend. Therefore, the influence of wind steering on the VEVC is discussed in
Section 4.
3.4. Effects of Wind Field Strength on Simulated and Observed Current Velocity
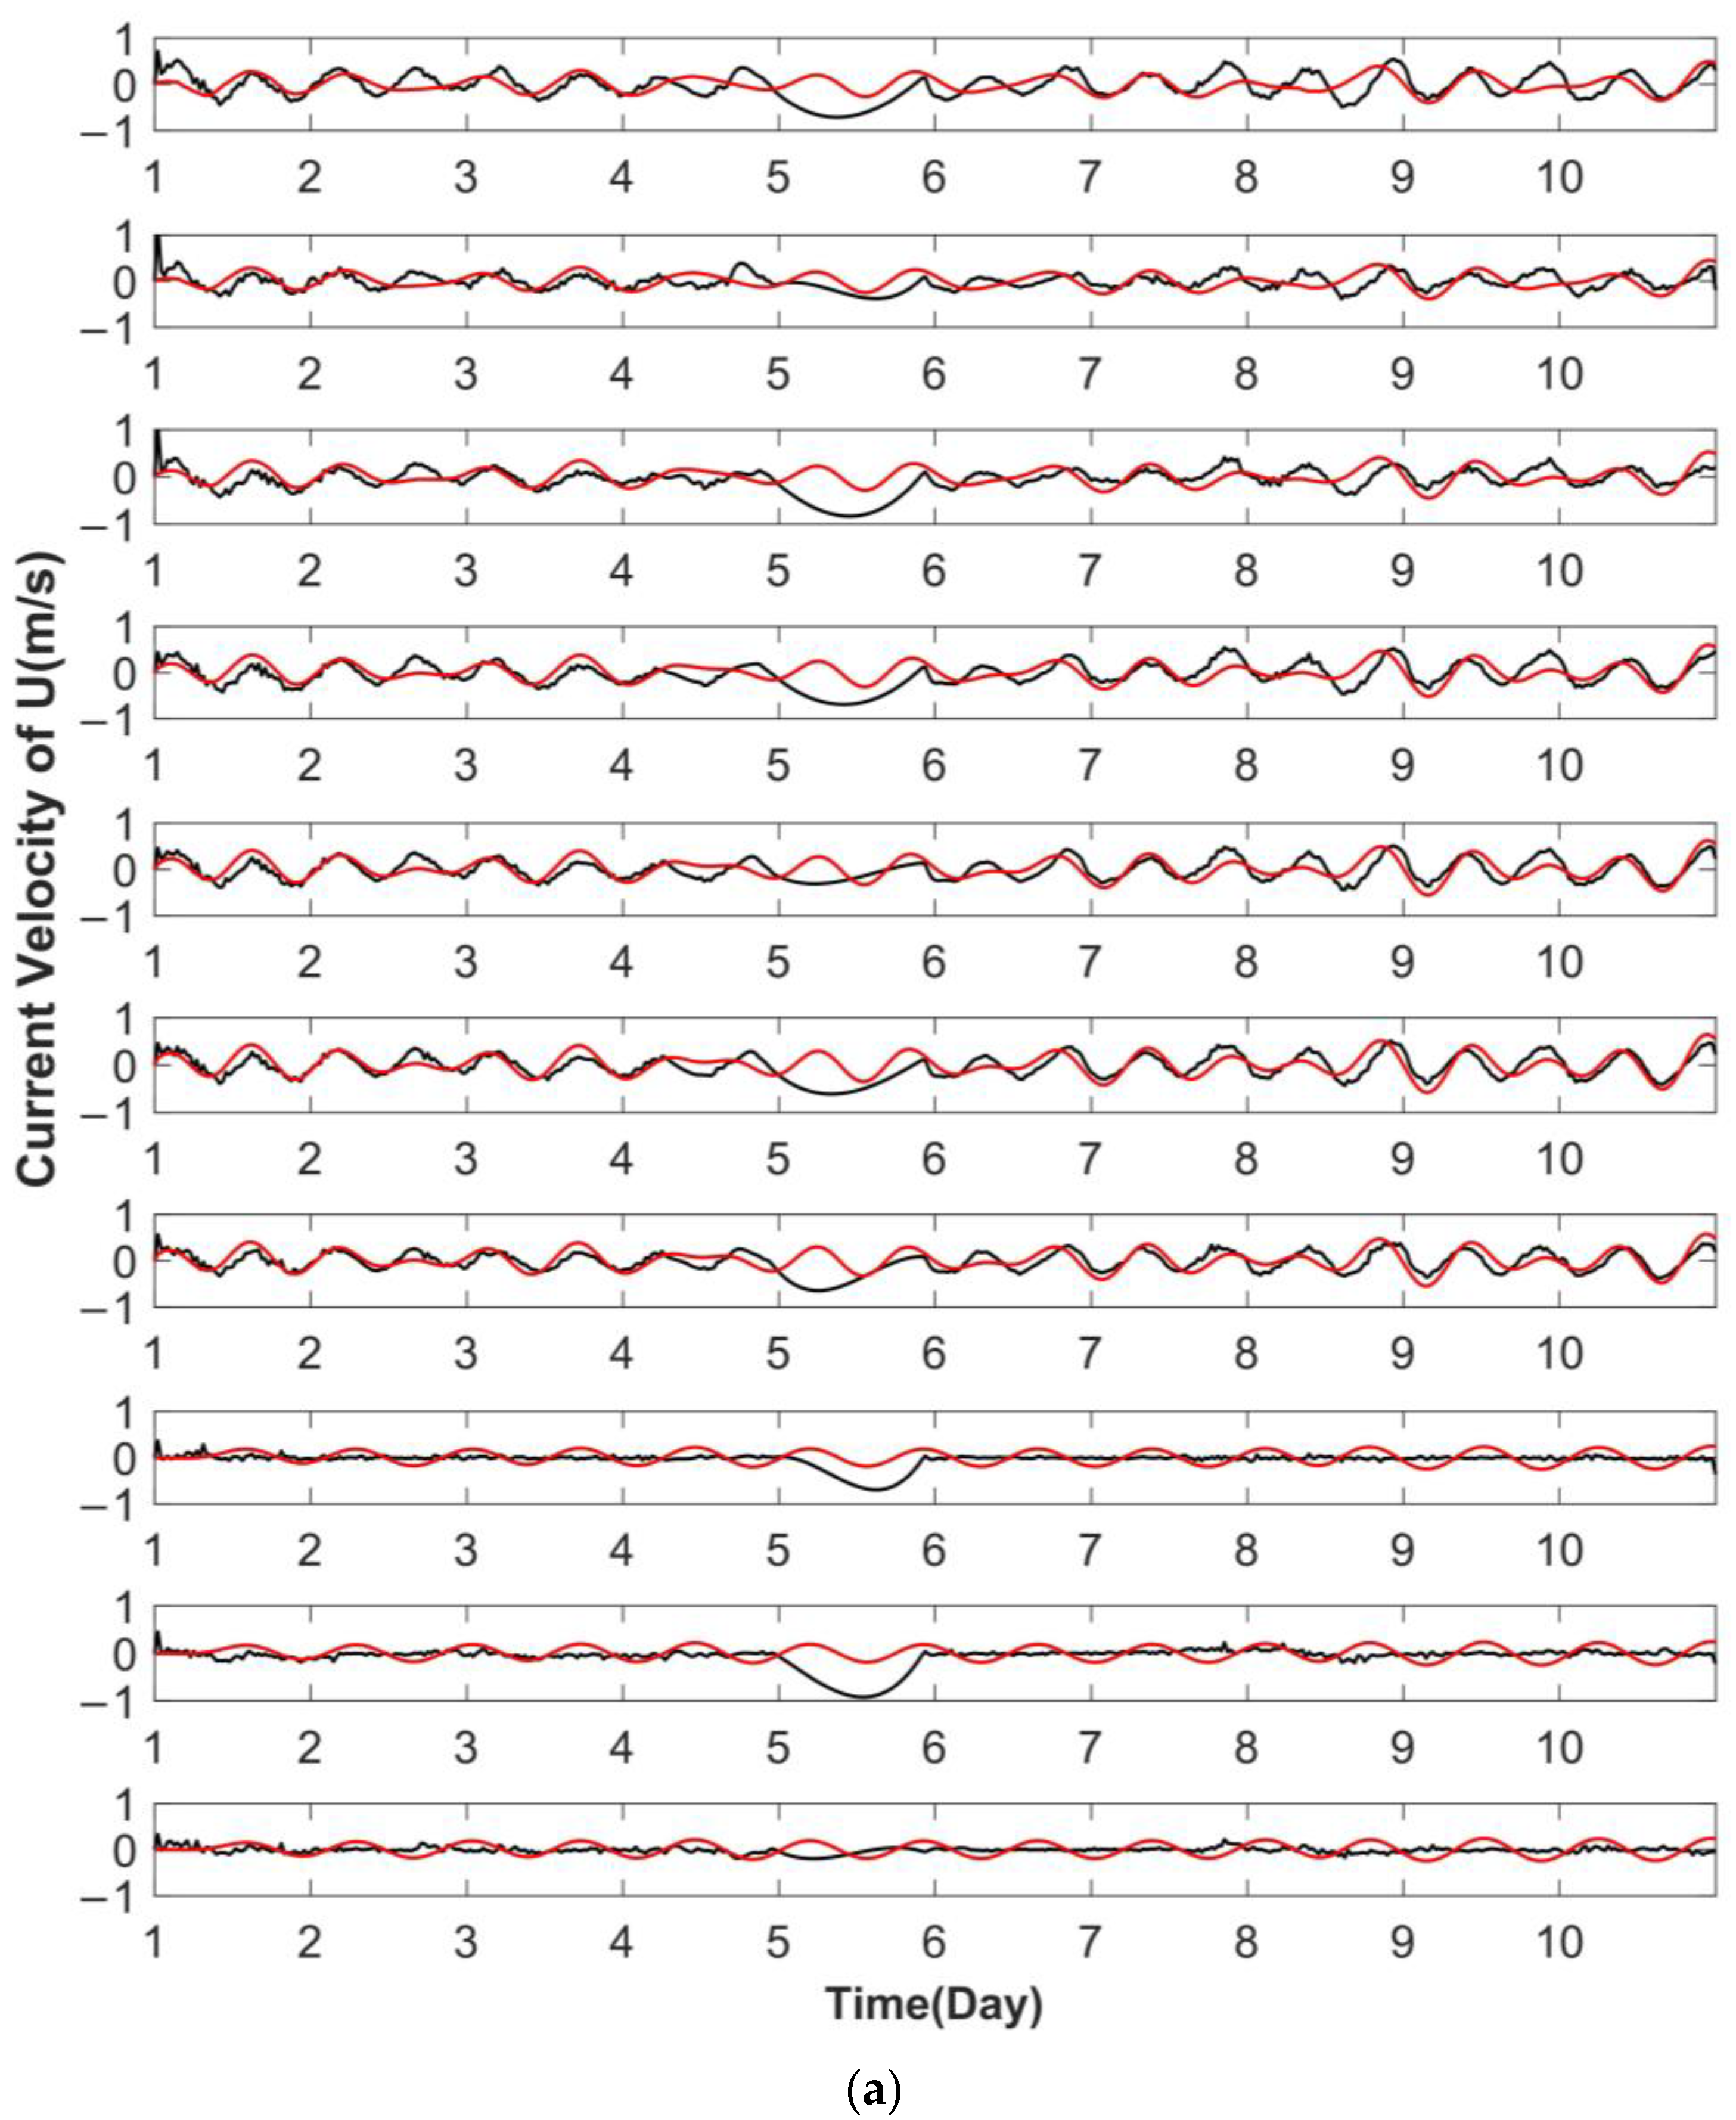
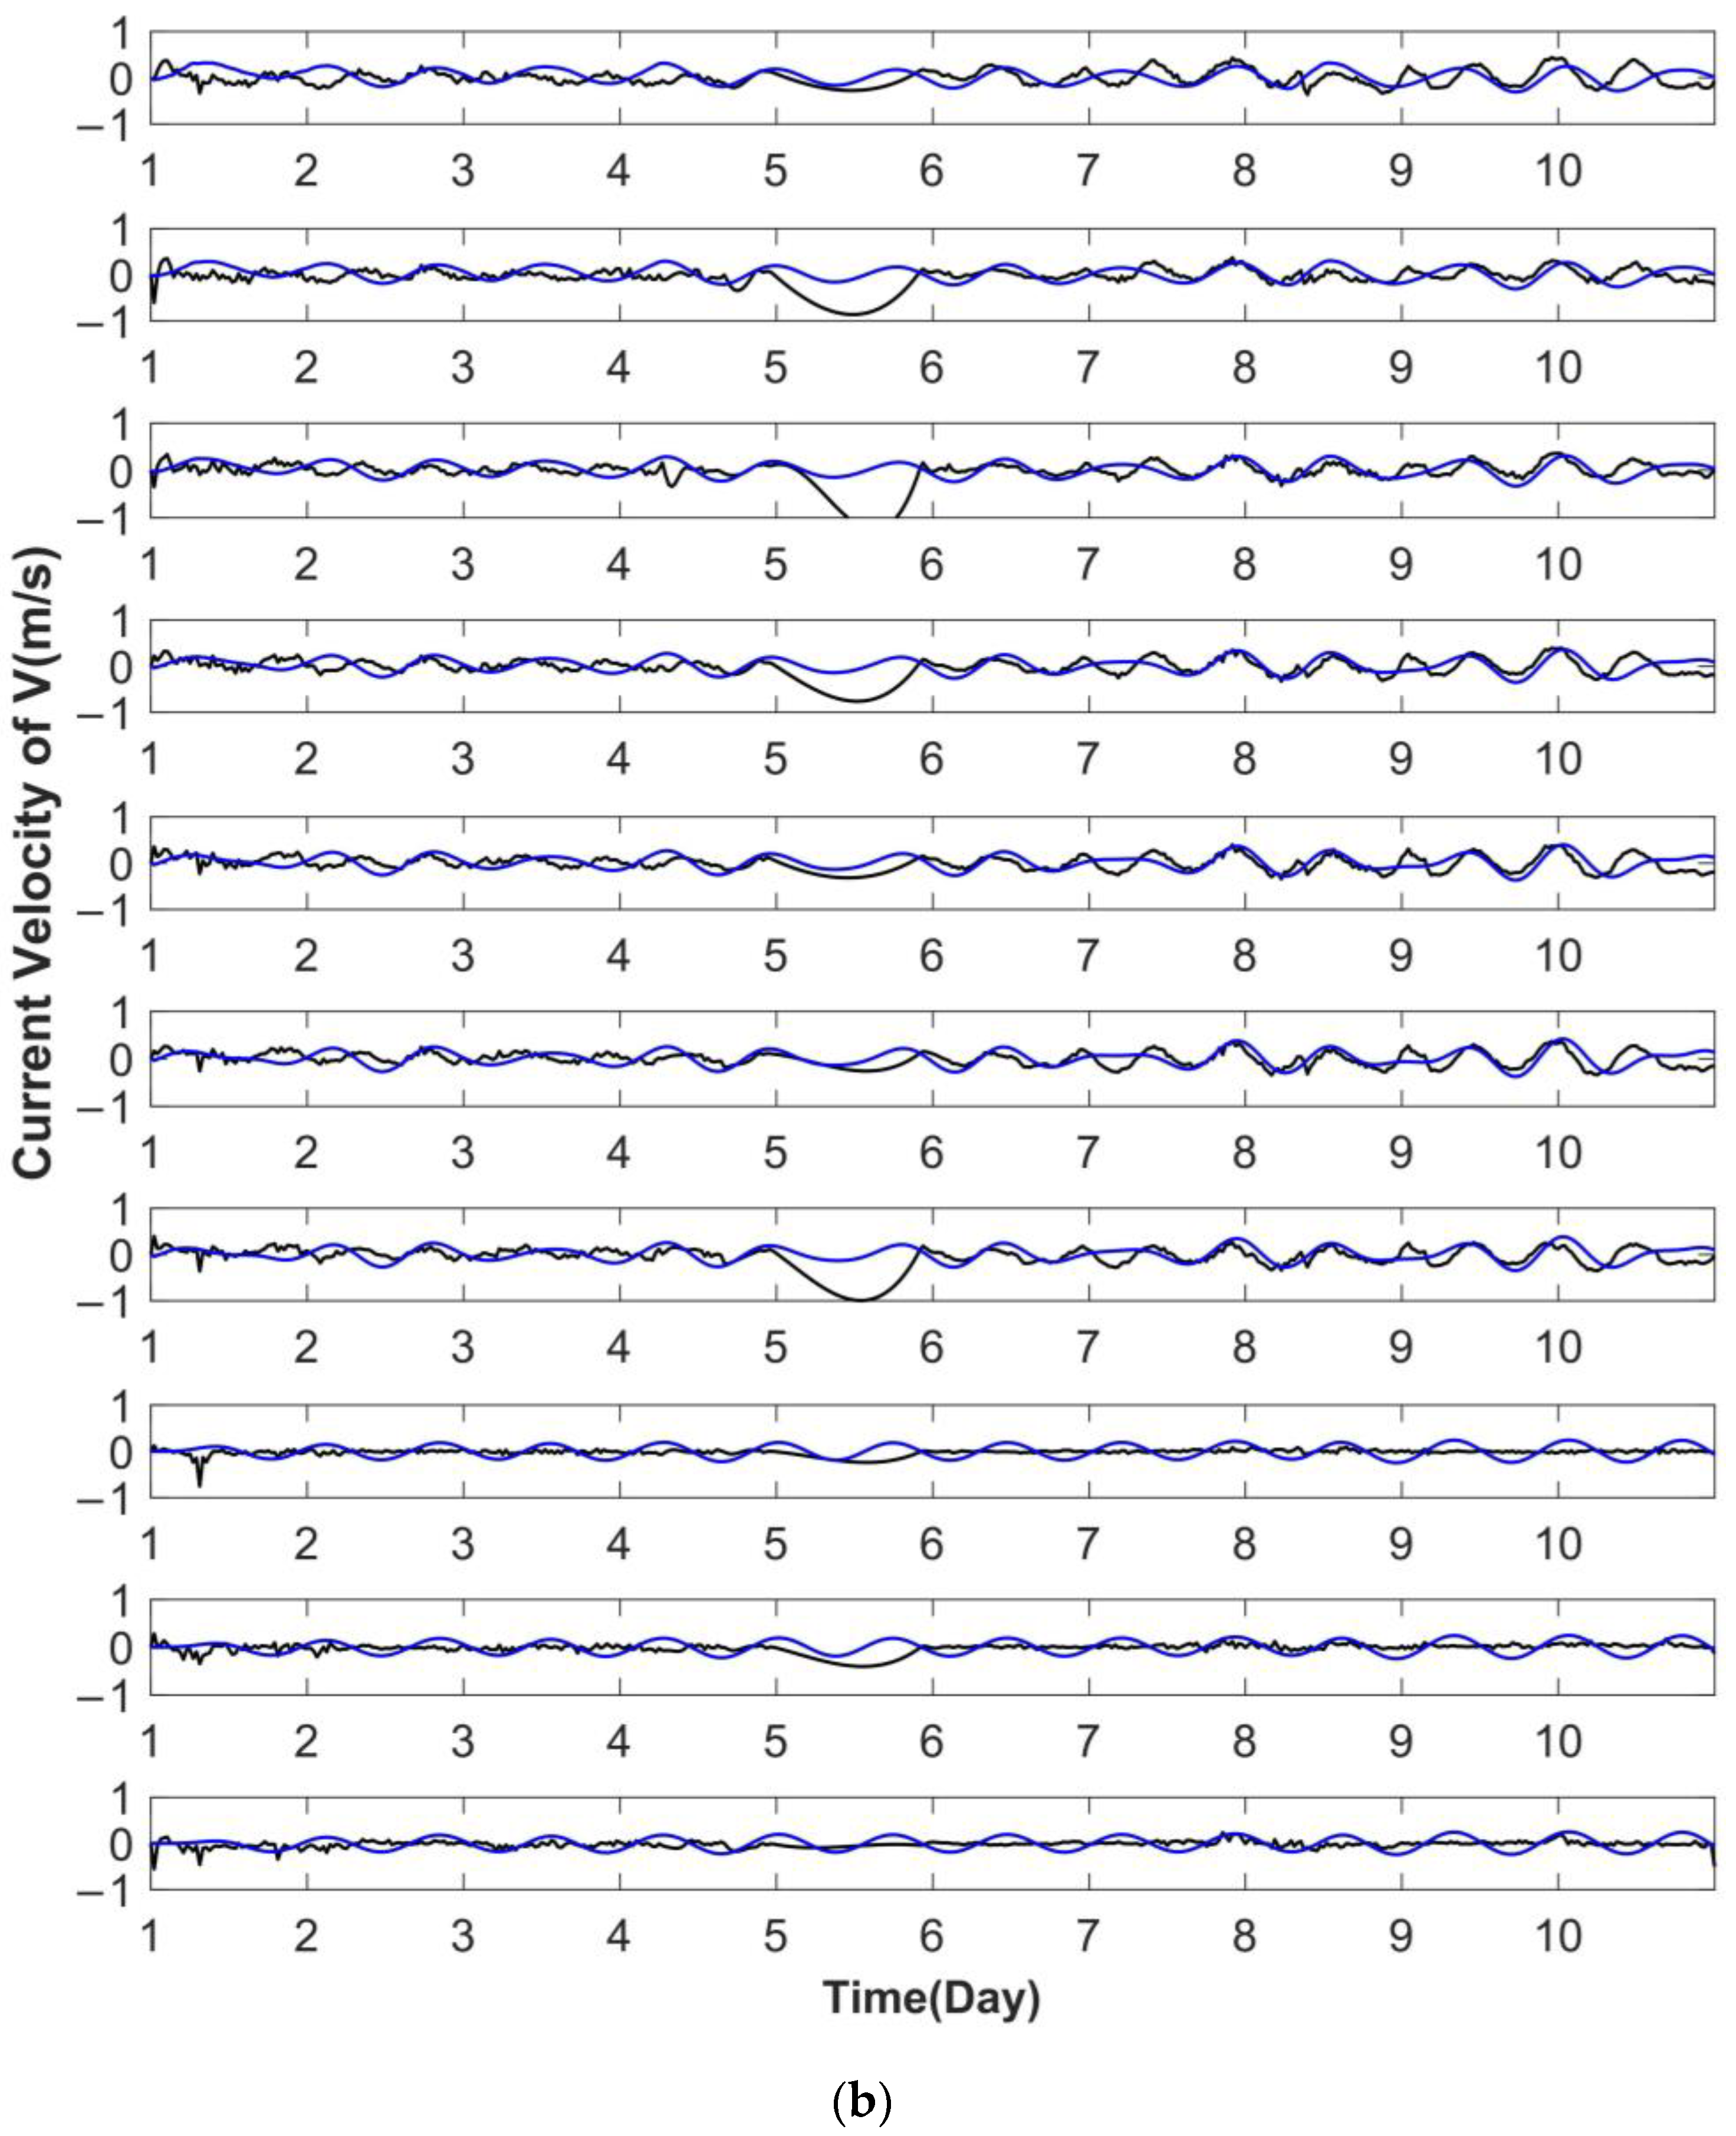
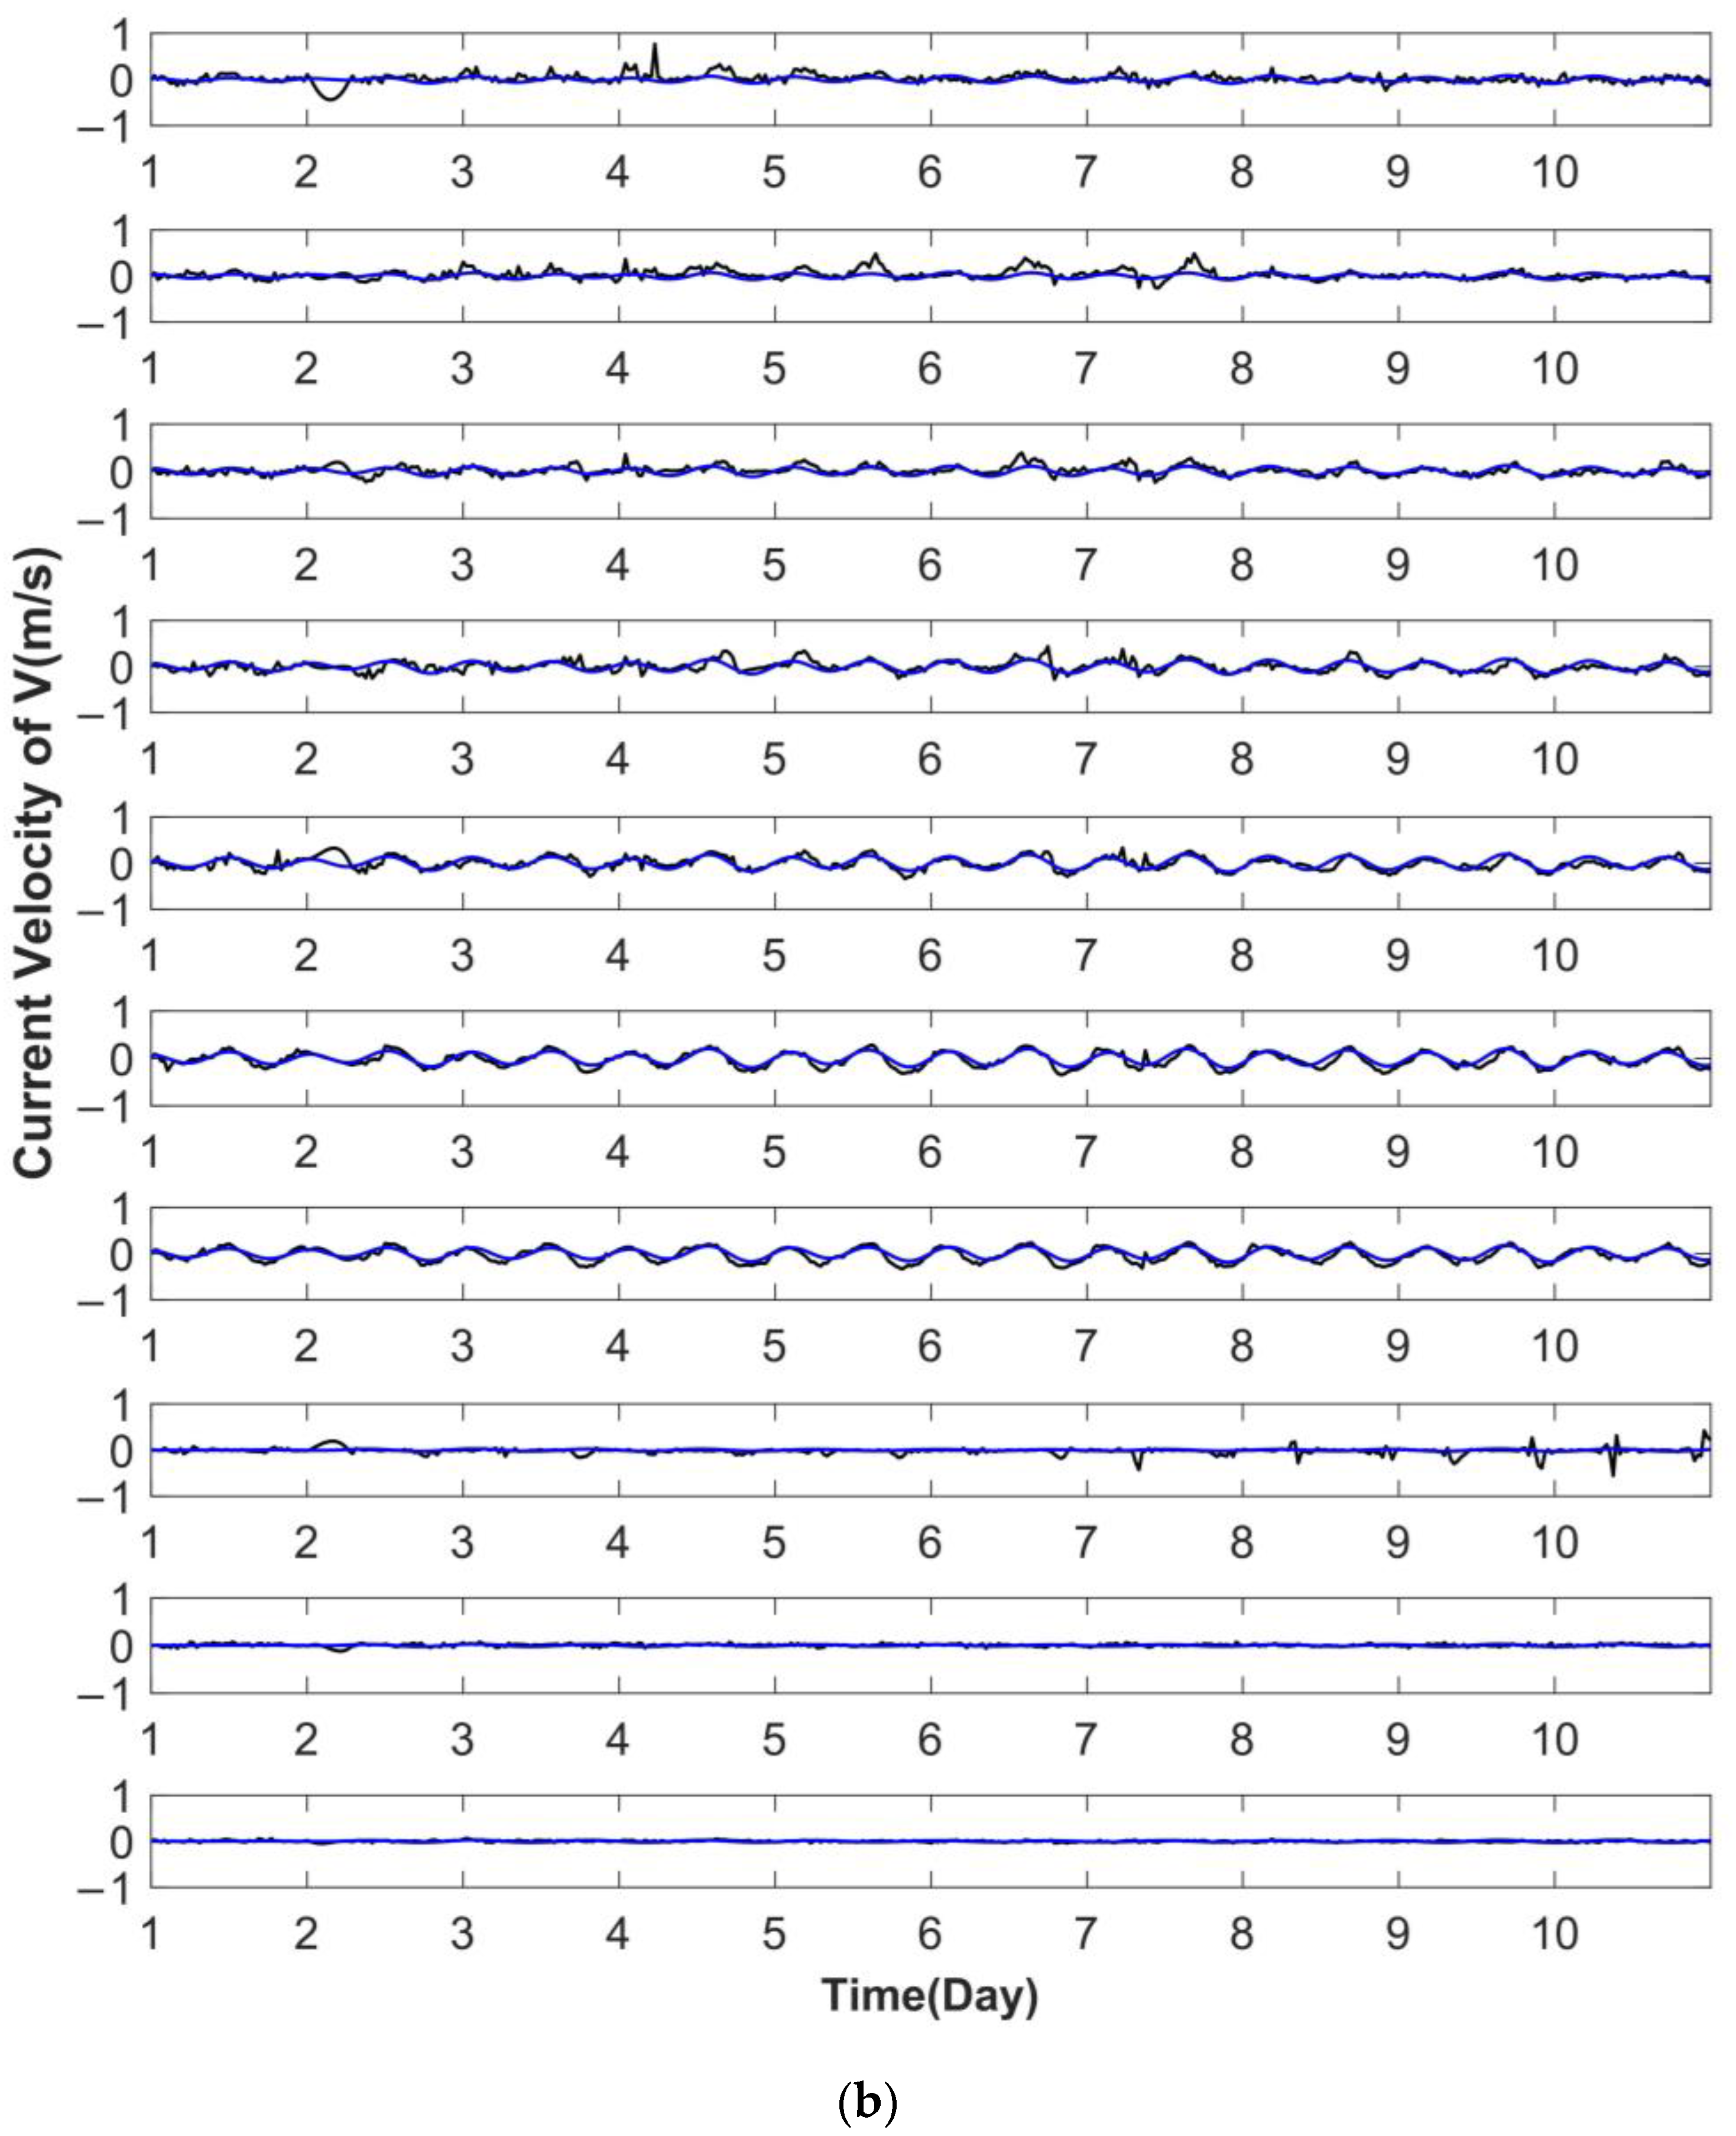
Figure 8 and
Figure 9 depict the variation of observed and simulated current velocities with depth for strong and weak wind backgrounds, respectively. During the strong wind period, the observed current velocities in surface water are not very large, and the kinetic energy is transported downwards with the input of wind energy. At greater depths, there are still relatively apparent fluctuations in current velocity. This indicates that kinetic energy can be transferred downwards to the bottom layer during the Ekman transport process in a strong wind background.
In contrast,
Figure 9 shows that the current velocity no longer fluctuates below 26 m. This implies that the kinetic energy transfer to depths greater than 26 m has been effectively lowered to zero and does not reach the bottom layer.
The simulated current velocities were compared with the observed current velocities, and it was found that the trend of the simulated current velocities was the same as that of the observed current velocities. This indicates that the effect of the change in wind field strength on the simulated current velocities is identical to that on the actual observed current velocities. Therefore, the simulated current velocities and the VEVC obtained by inversion in this paper are reliable and meaningful.
4. The Impact of Wind Steering on VEVC
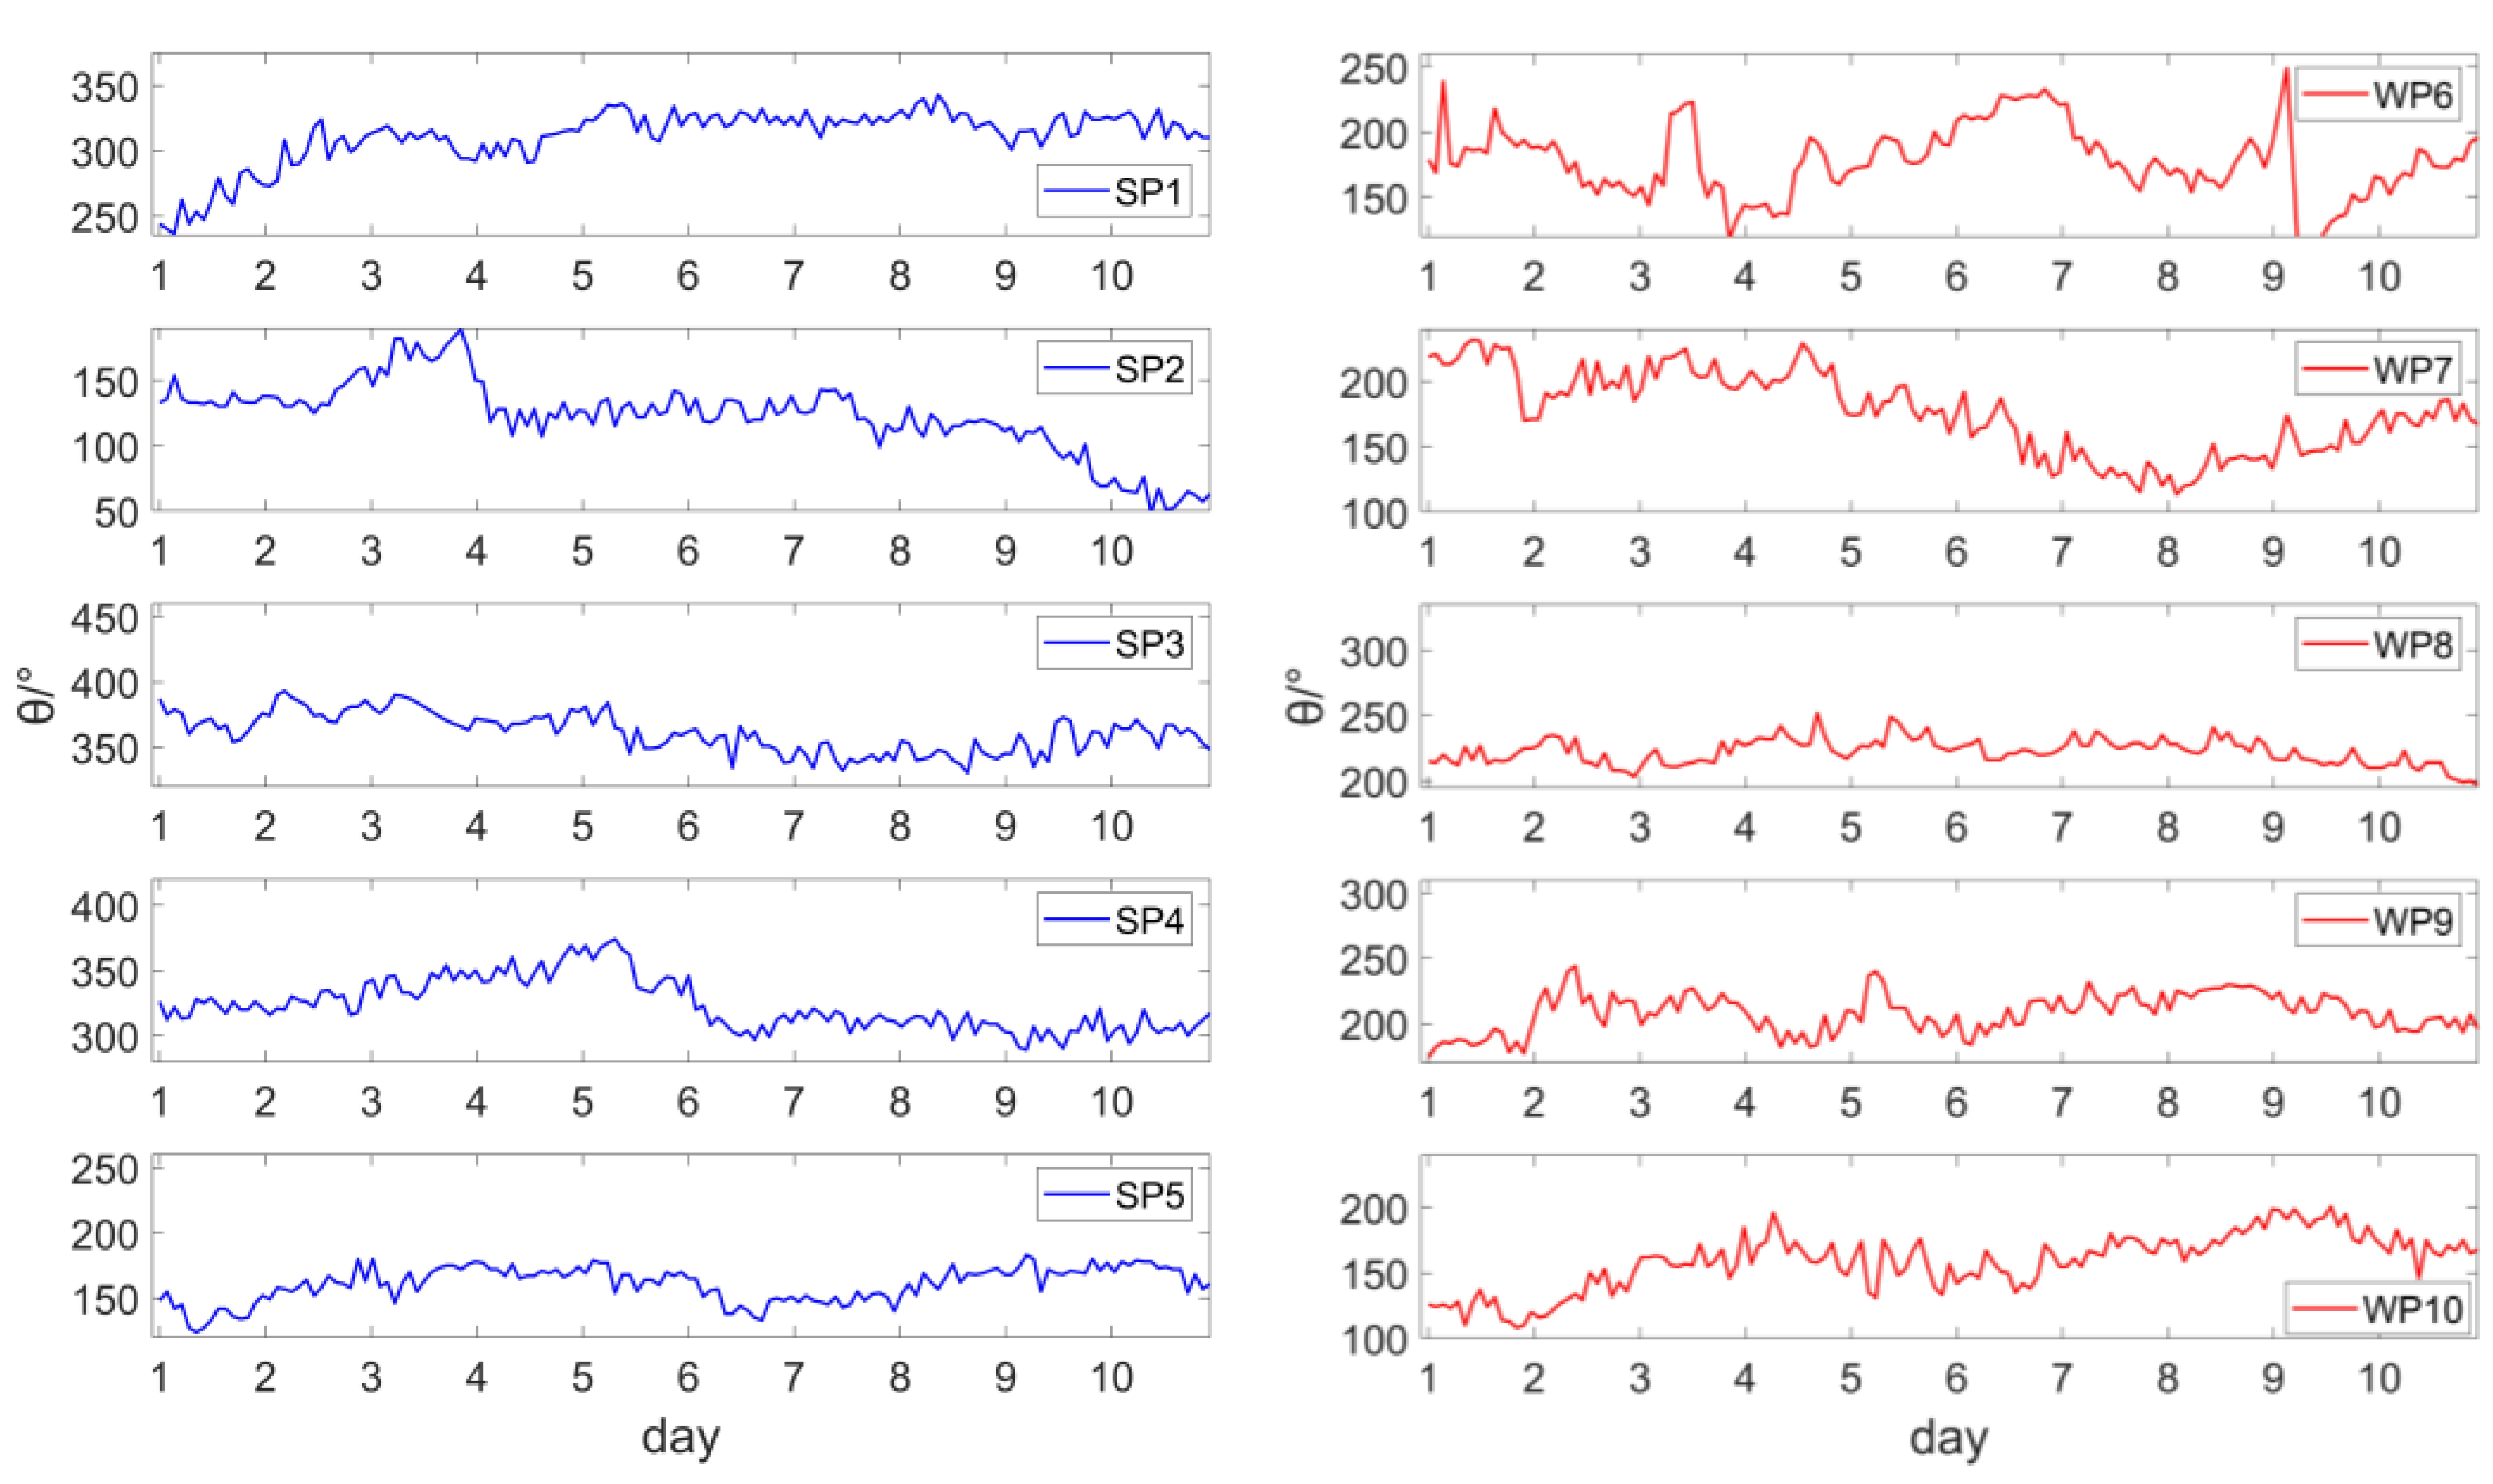
Changes in the surface wind field can influence the direction of surface currents by altering the vertical shear during Ekman transport, which in turn affects vertical mixing. To investigate this effect, we plotted wind direction time series for 10 processes in both strong and weak wind conditions, as shown in
Figure 10. Missing measurements were filled in using the modified Akima cubic Hermite interpolation polynomial method described earlier. To aid the observation of wind steering angle magnitudes, 360° was added to angles approaching 0° for each process.
The five strong wind processes exhibit maximum deflection angles of 100°, 140°, 60°, 85° and 59°, respectively. The wind vectors in SP1 and SP2 (the abbreviation SP was used to refer to the strong process, and WP was used to refer to the weak progress) show an even more pronounced steering effect, with maximum deflection angles exceeding 100°, while the other three processes have smaller deflection angles. Examining the VEVC inversion curves in
Figure 7 (left), we observe that wind vector steering has a significant impact on the regularity of the curves during the inversion process. This impact manifests as an overall elevation of the curves, i.e., an increase in the inversion values of the VEVC, and a weakening of the trend seen in VEVC curves that initially increase slightly at the surface before declining with depth. For SP2, where the wind vector deflection angle reaches 140°, both effects are present in the VEVC curve. In contrast, only the overall elevation of the curve is seen in SP1, where the deflection angle is 100°. This suggests that, in a strong wind field, the stronger the wind vector steering angle, the more pronounced the influence on the general trend of the VEVC curve during inversion.
The five processes with weak background winds exhibit maximum deflection angles of 115°, 116°, 55°, 67° and 98°, respectively. Among them, WP6 has the largest deflection angle, which impacts the general trend of the corresponding VEVC curve. Specifically, the VEVC curve for WP6 is generally higher and decreases monotonically with depth from the surface layer. As a result, the stable trend of a small increase followed by a decrease in the inverse curve summarized in the previous section is destroyed. WP7 also has a deflection angle over 100°, and its VEVC inversion curve retains the trend of increasing and then decreasing, but it is significantly higher than the general stable trend of the other three processes.
Therefore, it can be assumed that both strong and weak wind fields have an impact on the VEVC inversion curve, causing it to deviate from the general stable trend. In strong wind processes, the wind steering elevates the curve and changes its trend. When the wind deflection angle is large enough, both effects can be simultaneously reflected in the inversion curve.
5. The Impact of Wind Field Changes on Kinetic Energy Distribution
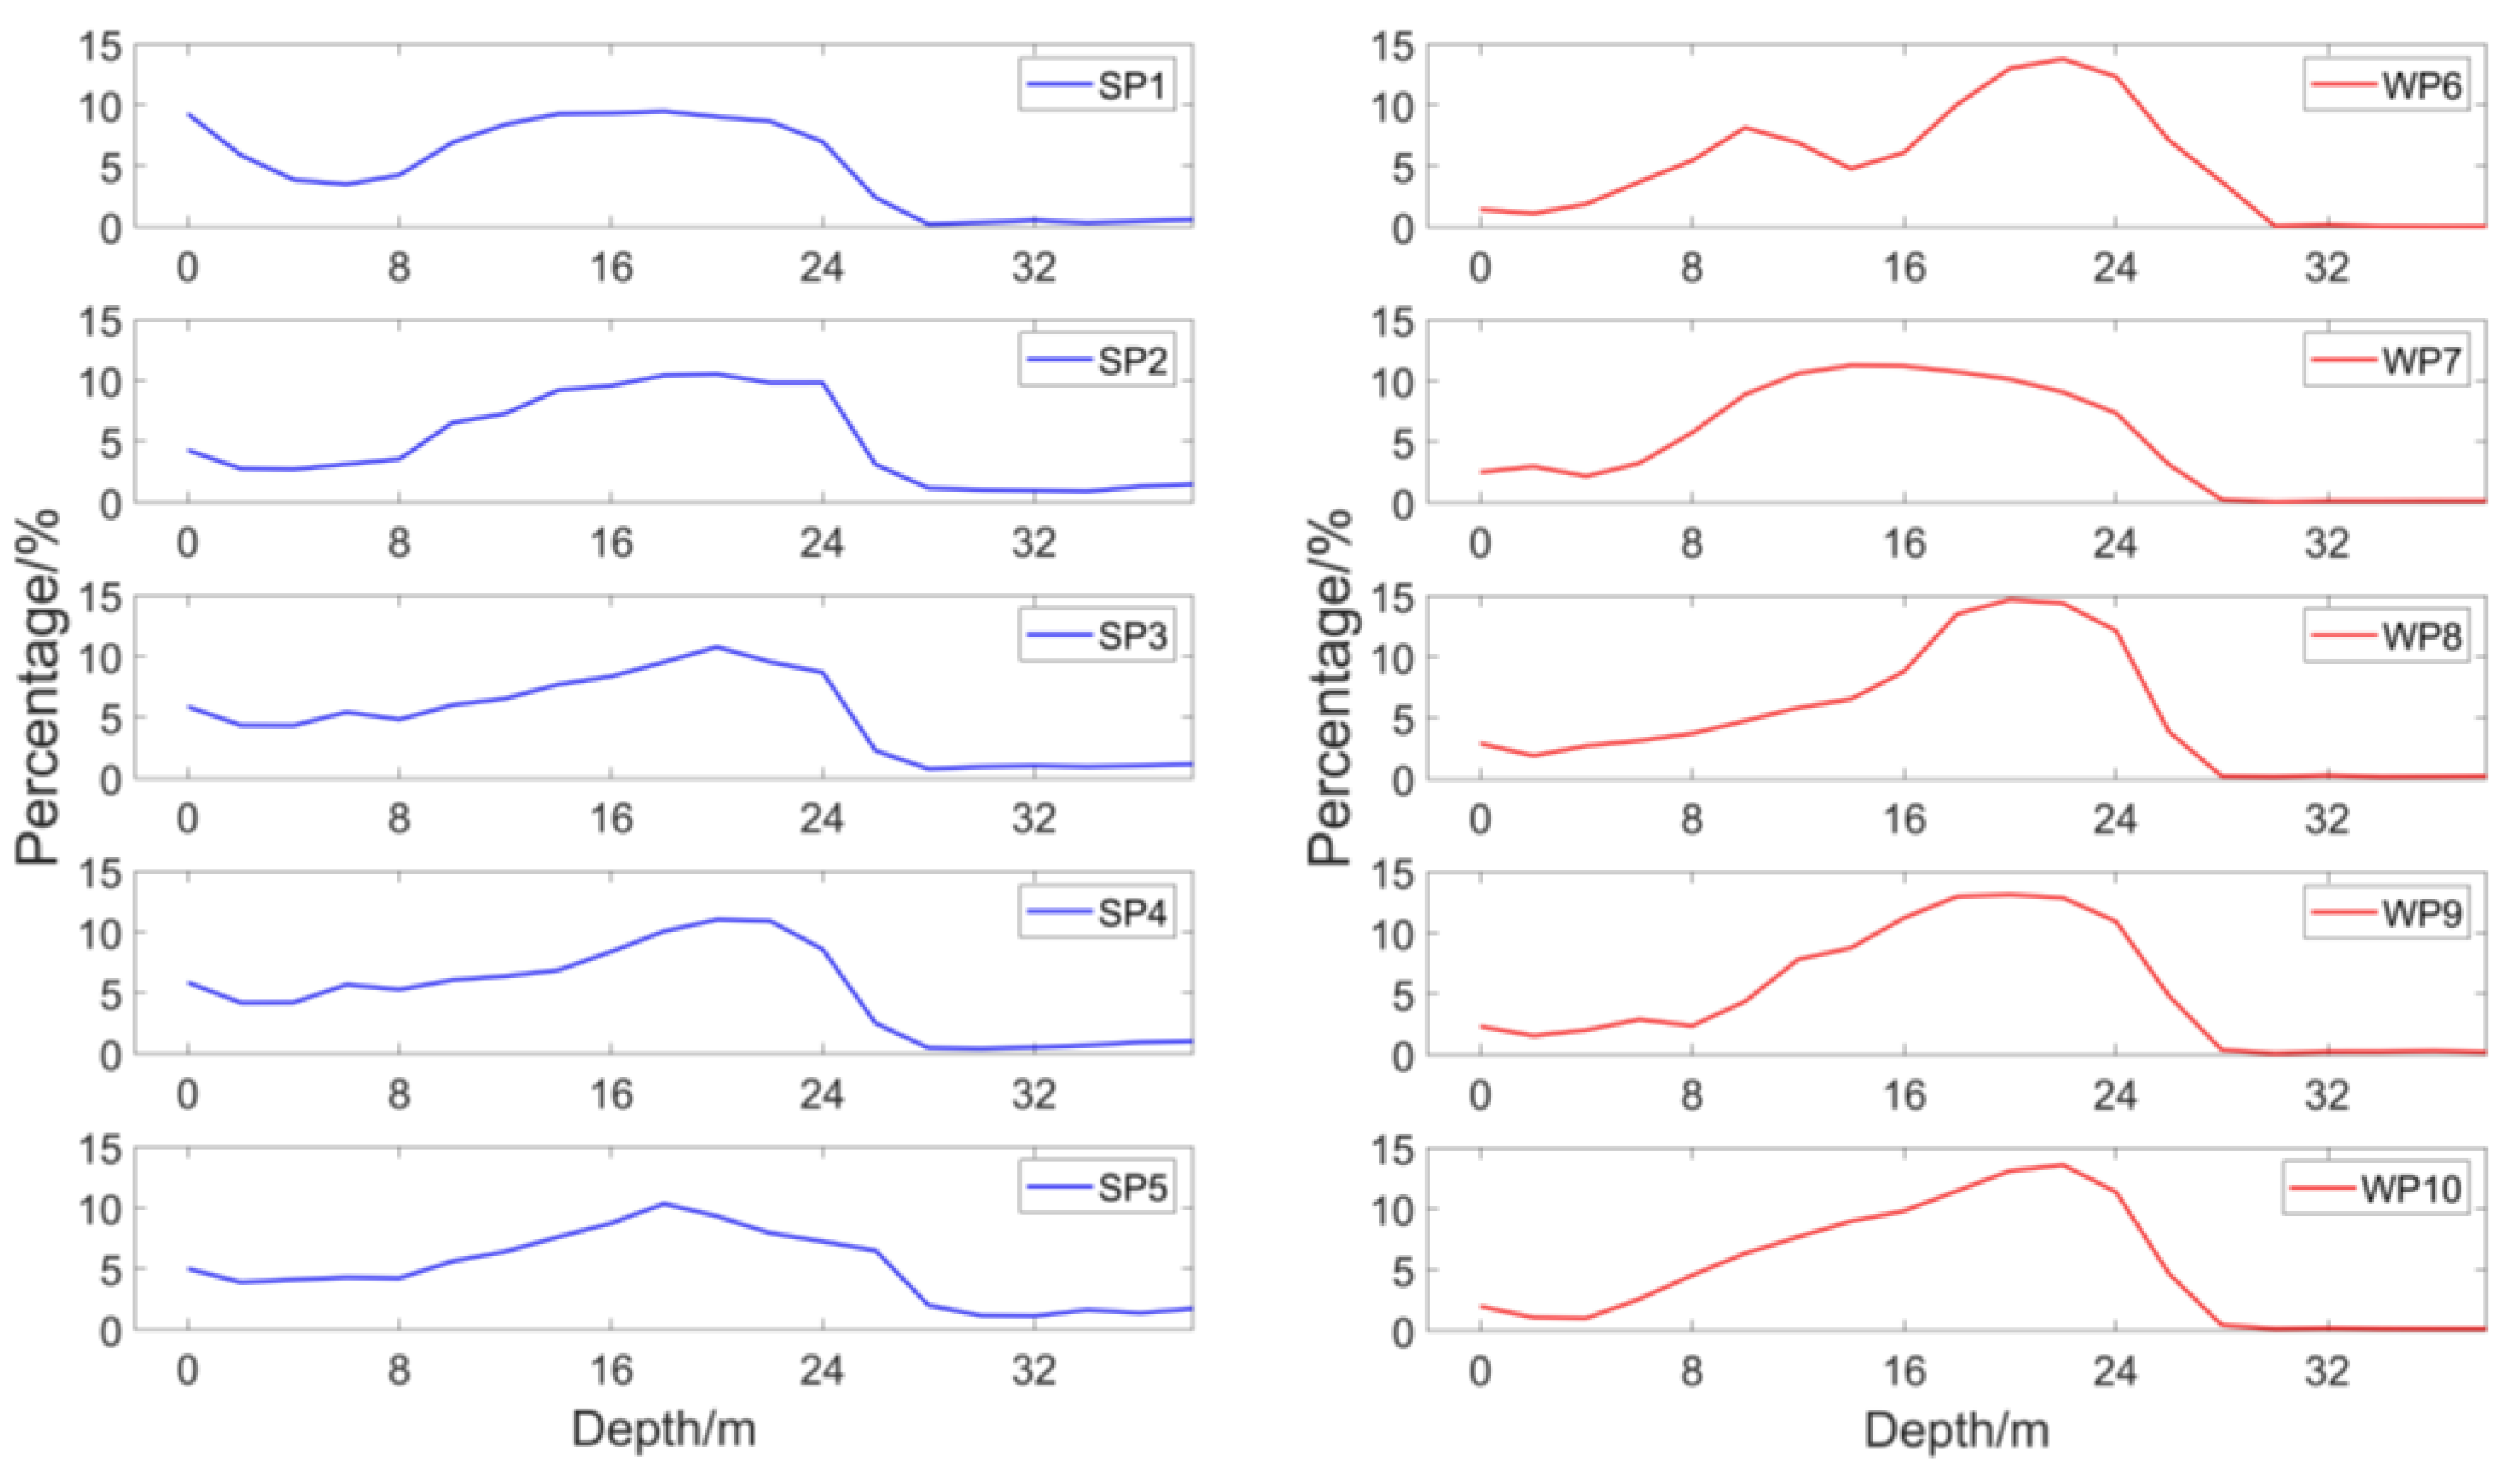
Since the VEVC parameter plays a crucial role in the exchange of kinetic energy in offshore marine areas, this section focuses on discussing the percentage of kinetic energy present in each layer. By using the Ekman model and incorporating wind speed data from multiple 10-day periods, we can obtain the distribution of current velocity as a function of depth, which is then used to calculate the kinetic energy of each layer. To eliminate potential bias from the inversion process, we only consider the kinetic energy from the last three days of each 10 days for our analysis; the obtained kinetic energy share of each layer is shown in
Figure 11.
The resulting kinetic energy distribution for five strong wind processes follows a specific trend: the kinetic energy is relatively low in the surface layer but increases gradually with depth, reaching a maximum value of around 18–20 m, and then decreases rapidly once the depth exceeds 24 m. The middle and lower layers, around 30 m, experience significantly lower levels of kinetic energy, which persists until the bottom layer at 40 m. Conversely, the change in kinetic energy for weak wind processes follows a similar trend; however, the depth at which the maximum value occurs slightly decreases to approximately 20–22 m. From an analysis of the general trend of VEVC inversion curves, we find a small initial increase, with the strong wind process reaching a maximum of 10 m and the weak wind process at 12.5 m, followed by a monotonic decrease. These results suggest that the downward transport of kinetic energy due to wind stress is slightly delayed when compared to the change in VEVC, with a similar general trend and consistent differences in the strong and weak wind fields.
When studying each process individually, it becomes apparent that SP1 and SP2, as well as WP6 and WP7, deviate from the general trend observed in the data. Specifically, the share of kinetic energy at depths between 8–24 m in SP1 and WP7 increases rapidly to a higher level and remains stable before starting to decrease gradually, unlike the trend observed in SP3-5 where it gradually increases to a maximum and then drops rapidly. In WP6, there is a notable drop at around 14 m. In the context of the impact of wind steering, it is worth noting that when sea surface winds are steered, the direction of the Ekman transport may also be deflected, which can weaken or alter the transport of energy to the lower layers when compared to a stable wind direction. This fundamental difference correlates with the curves for kinetic energy percentage, which also deviate from the general trend during the four significant wind steering processes mentioned above.
6. Conclusions
The surface wind stress, which acts as the driving force of sea–air interaction, plays a crucial role in the Ekman transport process. This paper focuses on analyzing the impact of wind stress on the Ekman transport process through the examination of a specific parameter, the vertical eddy viscosity coefficient. This analysis is conducted from multiple perspectives, including the strength of the wind field, the effect of wind steering and the distribution of kinetic energy with depth.
The strength of the background wind field has a direct impact on the inversion curve of the VEVC, as observed in this study. By analyzing the VEVC inversion curves of multiple processes and combining them, we can identify the general trend of the VEVC with depth. This trend typically involves a slight increase at the surface water, with a maximum value observed at a water depth of 10–12 m, and then a monotonic decrease as depth increases to the bottom of the water column. Additionally, the cost function in the inversion process decreases towards stability with each inversion step. It is worth noting that this general trend varies with the strength of the background wind field, particularly in terms of the depth at which the curve reaches its maximum. Specifically, when the background wind field is strong, the VEVC inversion curve typically reaches its maximum at around 10 m, whereas for weaker wind fields, the depth at which the VEVC curve reaches its maximum decreases slightly to around 12.5 m or less.
This study integrated and compared ten VEVC inversion curves, including both strong and weak wind processes. The analysis revealed that the VEVC inversion values were typically higher in strong wind fields than those in weak wind fields, and that the rate of decline with depth was relatively rapid. The study also observed that four of the ten curves deviated significantly from the general trend, which is likely related to wind steering.
Furthermore, the maximum wind deflection angles of each of the ten processes were analyzed separately, and it was discovered that the maximum deflection angles of SP1, SP2, WP6 and WP7 exceeded 100°. These larger deflection angles influenced the general trend of the VEVC inversion curve as to two main aspects. Firstly, the entire VEVC inversion curve was elevated, resulting in a higher inversion value of VEVC at the same depth. Secondly, the general rule that the VEVC inversion curve gradually rises to a maximum at around 10–12.5 m and then decreases monotonically was broken.
To assess the practical significance and impact of VEVC, we calculated the distribution curves of kinetic energy for the past three days across each layer. The results revealed a consistent trend: the surface layer contains a small percentage of kinetic energy that gradually increases as depth increases; a maximum of 18–20 m is achieved before decreasing rapidly to a very low level at 24 m and beyond. This general trend is consistent with the previous analysis of the difference in maximum values achieved by VEVC in strong and weak wind fields. Further, the percentage curves associated with anomalous processes caused by four wind deflections significantly deviates from this trend, lending support to our analysis of wind field and direction changes’ influence on VEVC.
Through the estimations of the vertical eddy viscosity coefficient with the Ekman model, the analysis and speculation clarify the influence of wind stress in Ekman transport. This deepens our understanding of the sea–air interaction process and holds great significance for researching the relationship between wind and current in offshore areas.
Author Contributions
Conceptualization, X.L.; methodology, X.L., C.L. and M.X.; software, C.L. and X.L.; validation, C.L., B.Y. and G.G.; formal analysis, C.L.; investigation, G.G.; resources, G.G.; data curation, C.L. and G.G.; writing—original draft preparation, C.L. and M.X.; writing—review and editing, C.L., X.L. and M.X.; visualization, C.L.; supervision, M.X. and X.L.; project administration, X.L. and G.G.; funding acquisition, X.L. All authors have read and agreed to the published version of the manuscript.
Funding
This work was supported by the National Natural Science Foundation of China (NSFC, No. 42006004), the Shandong Provincial Natural Science Foundation (NSFSD, No. ZR2019BD016), and the Open Fund Project of the Key Laboratory of Marine Environmental Information Technology, Ministry of Natural Resources of the People’s Republic of China.
Institutional Review Board Statement
Not applicable.
Informed Consent Statement
Not applicable.
Data Availability Statement
Data are available on request due to specific restrictions, e.g., those privacy-based or ethical in nature. The data presented in this study are available on request from the corresponding author. The data are not publicly available.
Conflicts of Interest
The authors declare no conflict of interest.
Appendix A. Finite-Difference Scheme
Based on the Crank–Nicolson method (
α = 0.5), the numerical model is built by using the finite-difference discretization of spatial increment ∆
z and time increment ∆
t. The finite difference schemes corresponding to the governing Equation (A1) are:
(i = 1, 2, …, 480; j = 1, 2, …, 20).
References
- Wu, X.; Xu, M.; Gao, G.; Yin, B.; Lv, X. Application of the Trigonometric Polynomial Interpolation for the Estimation of the Vertical Eddy Viscosity Coefficient Based on the Ekman Adjoint Assimilation Model. J. Mar. Sci. Eng. 2022, 10, 1165. [Google Scholar] [CrossRef]
- Levermore, C.D.; Sammartino, M. A Shallow Water Model with Eddy Viscosity for Basins with Varying Bottom Topography. Nonlinearity 2001, 14, 1493–1515. [Google Scholar] [CrossRef]
- Teng, F.; Dong, C.; Ji, J.; Bethel, B.J.; Pan, A.; Xu, C. Does the Wind Stress Always Damp an Oceanic Eddy? Geosci. Lett. 2021, 8, 4–9. [Google Scholar] [CrossRef]
- Pedlosky, J. Geophysical Fluid Dynamics. Geophys. Fluid Dyn. 1979, 1207, 10–11. [Google Scholar] [CrossRef]
- Munk, W.H. Wind Stress on Water: An Hypothesis. Q. J. R. Meteorol. Soc. 1955, 81, 639. [Google Scholar] [CrossRef]
- Dawe, J.T.; Thompson, L.A. Effect of Ocean Surface Currents on Wind Stress, Heat Flux, and Wind Power Input to the Ocean. Geophys. Res. Lett. 2006, 33, 1–5. [Google Scholar] [CrossRef]
- Wunsch, C. The Work Done by the Wind on the Oceanic General Circulation. J. Phys. Oceanogr. 1999, 28, 2332–2342. [Google Scholar] [CrossRef]
- Rai, S.; Hecht, M.; Maltrud, M.; Aluie, H. Scale of Oceanic Eddy Killing by Wind from Global Satellite Observations. Sci. Adv. 2021, 7, 1–9. [Google Scholar] [CrossRef]
- Jarosz, E.; Mitchell, D.A.; Wang, D.W.; Teague, W.J. Bottom-up Determination of Air-Sea Momentum Exchange under a Major Tropical Cyclone. Science 2007, 315, 1707–1709. [Google Scholar] [CrossRef]
- Hughes, C.W.; Wilson, C. Wind Work on the Geostrophic Ocean Circulation: An Observational Study of the Effect of Small Scales in the Wind Stress. J. Geophys. Res. Oceans 2008, 113, 1–10. [Google Scholar] [CrossRef]
- Zhang, Y.; Tian, J.; Xie, L. Estimation of Eddy Viscosity on the South China Sea Shelf with Adjoint Assimilation Method. Acta Oceanol. Sin. 2009, 28, 9–16. [Google Scholar]
- Flexas, M.M.; Thompson, A.F.; Torres, H.S.; Klein, P.; Farrar, J.T.; Zhang, H.; Menemenlis, D. Global Estimates of the Energy Transfer from the Wind to the Ocean, With Emphasis on Near-Inertial Oscillations. J. Geophys. Res. Oceans 2019, 124, 5723–5746. [Google Scholar] [CrossRef] [PubMed]
- Davies, A.M.; Xing, J. The Influence of Eddy Viscosity Parameterization and Turbulence Energy Closure Scheme upon the Coupling of Tidal and Wind Induced Currents. Estuar. Coast. Shelf Sci. 2001, 53, 415–436. [Google Scholar] [CrossRef]
- Lenn, Y.D.; Chereskin, T.K. Observations of Ekman Currents in the Southern Ocean. J. Phys. Oceanogr. 2009, 39, 768–779. [Google Scholar] [CrossRef]
- Song, J.B.; Huang, Y.S. An Approximate Solution of Wave-Modified Ekman Current for Gradually Varying Eddy Viscosity. Deep. Res. Part I Oceanogr. Res. Pap. 2011, 58, 668–676. [Google Scholar] [CrossRef]
- Song, J.B.; Xu, J.L. Wave-Modified Ekman Current Solutions for the Vertical Eddy Viscosity Formulated by K-Profile Parameterization Scheme. Deep. Res. Part I Oceanogr. Res. Pap. 2013, 80, 58–65. [Google Scholar] [CrossRef]
- Yoshikawa, Y.; Endoh, T. Estimating the Eddy Viscosity Profile from Velocity Spirals in the Ekman Boundary Layer. J. Atmos. Ocean. Technol. 2015, 32, 793–804. [Google Scholar] [CrossRef]
- Large, W.G.; McWilliams, J.C.; Doney, S.C. Oceanic Vertical Mixing: A Review and a Model with a Nonlocal Boundary Layer Parameterization. Rev. Geophys. 1994, 32, 363–403. [Google Scholar] [CrossRef]
- Zhang, J.; Lu, X. Inversion of Three-Dimensional Tidal Currents in Marginal Seas by Assimilating Satellite Altimetry. Comput. Methods Appl. Mech. Eng. 2010, 199, 3125–3136. [Google Scholar] [CrossRef]
- Edwards, C.A.; Moore, A.M.; Hoteit, I.; Cornuelle, B.D. Regional Ocean Data Assimilation. Ann. Rev. Mar. Sci. 2015, 7, 21–42. [Google Scholar] [CrossRef]
- Jiacheng, Y.; Yanqiu, G.; Jicai, Z. Estimation of the Time-Varying Vertical Eddy Viscosity Coefficient in an Ekman Layer Model through the Adjoint Data Assimilation Approach. Mar. Sci. 2018, 42, 71–82. [Google Scholar]
- Wu, X.; Xu, M.; Gao, Y.; Lv, X. A Scheme for Estimating Time-Varying Wind Stress Drag Coefficient in the Ekman Model with Adjoint Assimilation. J. Mar. Sci. Eng. 2021, 9, 1220. [Google Scholar] [CrossRef]
- Duhaut, T.H.A.; Straub, D.N. Wind Stress Dependence on Ocean Surface Velocity: Implications for Mechanical Energy Input to Ocean Circulation. J. Phys. Oceanogr. 2006, 36, 202–211. [Google Scholar] [CrossRef]
- Kirincich, A.R.; Barth, J.A. Time-Varying across-Shelf Ekman Transport and Vertical Eddy Viscosity on the Inner Shelf. J. Phys. Oceanogr. 2009, 39, 602–620. [Google Scholar] [CrossRef]
- Polton, J.A.; Lewis, D.M.; Belcher, S.E. The Role of Wave-Induced Coriolis-Stokes Forcing on the Wind-Driven Mixed Layer. J. Phys. Oceanogr. 2005, 35, 444–457. [Google Scholar] [CrossRef]
- Price, J.F.; Sundermeyer, M.A. Stratified Ekman Layers. J. Geophys. Res. 1999, 104, 20467–20494. [Google Scholar] [CrossRef]
- Nummelin, A. Passive Buoyant Tracers in the Ocean Surface Boundary Layer: 1. Influence of Equilibrium Wind-Waves on Vertical Distributions. J. Geophys. Res. Oceans 2015, 120, 2813–2825. [Google Scholar] [CrossRef]
- Lueck, R.G.; Wolk, F.; Yamazaki, H. Oceanic Velocity Microstructure Measurements in the 20th Century. J. Oceanogr. 2001, 58, 153–174. [Google Scholar] [CrossRef]
- Polton, J.A.; Lenn, Y.D.; Elipot, S.; Chereskin, T.K.; Sprintall, J. Can Drake Passage Observations Match Ekman’s Classic Theory. J. Phys. Oceanogr. 2013, 43, 1733–1740. [Google Scholar] [CrossRef]
- McWilliams, J.C.; Huckle, E.; Shchepetkin, A.F. Buoyancy Effects in a Stratified Ekman Layer. J. Phys. Oceanogr. 2009, 39, 2581–2599. [Google Scholar] [CrossRef]
- Zhang, J.; Li, G.; Yi, J.; Gao, Y.; Cao, A. A Method on Estimating Time-Varying Vertical Eddy Viscosity for an Ekman Layer Model with Data Assimilation. J. Atmos. Ocean. Technol. 2019, 36, 1789–1812. [Google Scholar] [CrossRef]
- Yu, L.; O’Brien, J.J. Variational Estimation of the Wind Stress Drag Coefficient and the Oceanic Eddy Viscosity Profile. J. Phys. Oceanogr. 1991, 21, 709–719. [Google Scholar] [CrossRef]
- Nie, Y.; Wang, Y.; Lv, X. Acquiring the Arctic-Scale Spatial Distribution of Snow Depth Based on AMSR-E Snow Depth Product. J. Atmos. Ocean. Technol. 2019, 36, 1957–1965. [Google Scholar] [CrossRef]
- Akima, H. A New Method of Interpolation and Smooth Curve Fitting Based on Local Procedures. J. ACM 1970, 17, 589–602. [Google Scholar] [CrossRef]
Figure 1.
Diagram of the geographical position of Buoy 17 (marked with a five-pointed star in the figure) at the Yellow Sea Station.
Figure 1.
Diagram of the geographical position of Buoy 17 (marked with a five-pointed star in the figure) at the Yellow Sea Station.
Figure 2.
Time series of maximum wind speeds for strong wind processes 1–5; the area marked by the rectangular box is part of the missing data filled in by using the modified Akima cubic Hermite (Makima) interpolation polynomial method.
Figure 2.
Time series of maximum wind speeds for strong wind processes 1–5; the area marked by the rectangular box is part of the missing data filled in by using the modified Akima cubic Hermite (Makima) interpolation polynomial method.
Figure 3.
The inversion of VEVC under a strong wind background.
Figure 3.
The inversion of VEVC under a strong wind background.
Figure 4.
Variation of VEVC inversion values with depth during strong wind process 4 (left), and the corresponding cost function curve (right).
Figure 4.
Variation of VEVC inversion values with depth during strong wind process 4 (left), and the corresponding cost function curve (right).
Figure 5.
Time series of maximum wind speed for weak wind process 6–10.
Figure 5.
Time series of maximum wind speed for weak wind process 6–10.
Figure 6.
VEVC inversion in the weak wind background.
Figure 6.
VEVC inversion in the weak wind background.
Figure 7.
VEVC curve integration (left) panel shows trend anomalous processes 1, 2, 6, 7; (right) panel shows trend normal processes 3, 4, 5, 8, 9, 10. (Black curves indicate strong wind processes and red curves indicate weak wind processes;the solid, dashed and dotted lines represent different strong and weak wind processes).
Figure 8.
(a) Observed velocity (black curves) and simulated current velocity of u (red curves) for StrongProcess1, from top to bottom, with increasing depths from 2 m to 40 m, respectively, at 4 m intervals. (b) Observed velocity (black curves) and simulated current velocity of v (blue curves) for StrongProcess1, from top to bottom, with increasing depths from 2 m to 40 m, respectively, at 4 m intervals.
Figure 9.
(a) Observed velocity (black curves) and simulated current velocity of u (red curves) for WeakProcess6, from top to bottom, with increasing depths from 2 m to 40 m, respectively, at 4 m intervals. (b) Observed velocity (black curves) and simulated current velocity of v (blue curves) for WeakProcess6, from top to bottom, with increasing depths from 2 m to 40 m, respectively, at 4 m intervals.
Figure 10.
Diagram of wind direction magnitude for each strong and weak wind process (blue lines indicate strong wind processes, red lines indicate weak wind processes).
Figure 10.
Diagram of wind direction magnitude for each strong and weak wind process (blue lines indicate strong wind processes, red lines indicate weak wind processes).
Figure 11.
Schematic representation of the kinetic energy stratification ratio of each process (blue lines indicate strong wind processes, red lines indicate weak wind processes).
Figure 11.
Schematic representation of the kinetic energy stratification ratio of each process (blue lines indicate strong wind processes, red lines indicate weak wind processes).
Table 1.
Selection of processes.
Table 1.
Selection of processes.
| Strong/Weak Process | Start Time (Year/Month/Date/Time) |
|---|
| StrongProcess1 | 19 January 2017 | 11:50 |
| StrongProcess2 | 25 September 2017 | 18:20 |
| StrongProcess3 | 2 November 2017 | 23:40 |
| StrongProcess4 | 15 December 2017 | 15:00 |
| StrongProcess5 | 12 August 2018 | 20:20 |
| WeakProcess6 | 24 July 2018 | 10:00 |
| WeakProcess7 | 16 May 2017 | 15:40 |
| WeakProcess8 | 2 September 2017 | 19:30 |
| WeakProcess9 | 12 May 2018 | 17:40 |
| WeakProcess10 | 25 September 2019 | 02:00 |
Table 2.
Fitted slope (k), intercept (b) and average value (a) of the curves for the 10 strong and weak wind processes.
Table 2.
Fitted slope (k), intercept (b) and average value (a) of the curves for the 10 strong and weak wind processes.
| | SP1 | SP2 | SP3 | SP4 | SP5 | WP6 | WP7 | WP8 | WP9 | WP10 |
|---|
| k | −0.0036 | −0.0045 | −0.0013 | −0.0014 | −0.0022 | −0.0030 | −0.0016 | −0.0013 | −0.0014 | −0.0022 |
| b | 0.1746 | 0.1620 | 0.0924 | 0.1016 | 0.1161 | 0.1481 | 0.1107 | 0.0925 | 0.0946 | 0.1161 |
| a | 0.1023 | 0.0719 | 0.0672 | 0.0726 | 0.0728 | 0.0877 | 0.0796 | 0.0670 | 0.0659 | 0.0631 |
| Disclaimer/Publisher’s Note: The statements, opinions and data contained in all publications are solely those of the individual author(s) and contributor(s) and not of MDPI and/or the editor(s). MDPI and/or the editor(s) disclaim responsibility for any injury to people or property resulting from any ideas, methods, instructions or products referred to in the content. |
© 2023 by the authors. Licensee MDPI, Basel, Switzerland. This article is an open access article distributed under the terms and conditions of the Creative Commons Attribution (CC BY) license (https://creativecommons.org/licenses/by/4.0/).

