Article

Abundance and Distribution of Macro- and Mesoplastic Debris on Selected Beaches in the Northern Strait of Malacca

1
Centre for Marine and Coastal Studies (CEMACS), Universiti Sains Malaysia, Gelugor 11800, Malaysia
2
National Marine Environmental Monitoring Center, No. 42, Linghe Street, Dalian 116023, China
3
Geography Section, School of Humanities, Universiti Sains Malaysia, Gelugor 11800, Malaysia
4
Heritage and Urban Studies, Penang Institute, Georgetown 10350, Malaysia
5
School of Biological Sciences, Universiti Sains Malaysia, Gelugor 11800, Malaysia
*
Authors to whom correspondence should be addressed.
J. Mar. Sci. Eng. 2023, 11(5), 1057; https://doi.org/10.3390/jmse11051057
Submission received: 13 April 2023 / Revised: 6 May 2023 / Accepted: 9 May 2023 / Published: 16 May 2023

Abstract

:
Plastics account for 60–80% of marine debris worldwide, and, in 2021, Malaysia was the 28th largest plastic polluter in the world. In light of this finding, the Malaysian government has launched the Roadmap Towards Zero Single-Use Plastics 2018–2030 and the Plastics Sustainability Roadmap 2021–2030 to reduce plastic pollution and implement a circular economy for Malaysia. A comprehensive database of the status of plastic pollution in Malaysia is needed to achieve this target. This study aims to record the presence of macro- (>2.5 cm) and mesoplastic (0.5–2.5 cm) debris at selected beaches in the northern Strait of Malacca. All study sites are publicly accessible beaches (Pulau Songsong, Teluk Aling, and Pulau Gazumbo) except Pulau Lembu, which is in a Marine Protected Area (MPA). The debris was collected from predetermined transects on the beach and categorised according to its form and economic market segments in Malaysia. Most of the macro- (53–75% of total mass) and mesoplastics (52–80% of the total number) were accumulated in the backshore area. Public beaches such as Pulau Gazumbo and Pulau Songsong recorded the highest abundance of macroplastics, with 7.32 g/m2 and 9.77 g/m2, respectively. Teluk Aling recorded the lowest abundance of macroplastics (3.58 g/m2) but the highest in mesoplastics (0.55 items/m2). Most of the macroplastics found were packaging plastics such as plastic bottles, containers, and polystyrene foam debris. Although Pulau Lembu is an MPA, the amount of macroplastics found was considerably high (7.17 g/m2). Based on the beach cleanliness index, Pulau Gazumbo (−3.99) was the dirtiest site, followed by Pulau Lembu (−2.92) and Pulau Songsong (−2.85), while Teluk Aling (−1.63) was the cleanest site, which can explain the amount of macroplastic debris found. However, all the study sites’ cleanliness may not be ideal, as the indexes were less than zero due to the low availability of waste bins and insufficient frequency of beach cleaning. This may not be able to curb the effects of high anthropogenic activities conducted in addition to uncontrollable natural factors.

1. Introduction

Studies on plastic pollution have been increasing since 1960 when the first record of plastic items on albatrosses was reported [1]. Since then, more studies have been carried out to understand the effects of plastics and their abundance and distribution in different habitats, such as coastal environments [2]. Plastics, by far, are the most abundant marine debris and account for 60–80% of marine waste [3]. The arrival of plastic debris in a particular habitat can ultimately affect organisms and the environment. For example, plastic debris can be embrittled and broken down into microplastics, which increases the bioavailability for the organisms in the habitat, such as ghost crabs, polychaetes, sandhoppers, and shorebirds in the intertidal area [4,5,6,7,8]. The aesthetic value will be decreased due to debris, which will affect the beach’s preferability and, subsequently, the economy [9]. Entanglement and injury of shorebirds and other organisms by ropes and nets could also occur [10].
Past studies show that 85% of marine debris is sourced from land-based activities, while the remaining comes from ocean-based activities [11]. Plastic debris can be transported by rivers, winds, waves, and sewage systems to estuaries, beaches, and bays [12,13]. Lebreton et al. (2017) [14] showed that Asian rivers contributed 86% of the global plastic input. Mobilik et al. (2016) [15] showed that 1.3% of debris from selected vessels was found at the nearby beaches with 2 items/km, indicating that illegal dumping of debris into the ocean had occurred, which was later transported by wind and ocean waves. Beachgoers are also a factor in marine debris present at the beach, whereby tourist seasons accompany increased plastic litter pollution [16].
The surrounding environment can be influenced by the anthropogenic activities’ type and intensity, and subsequently, the type of debris and abundance of plastic pollutants found [17]. Lee et al. (2017) [18] showed that beaches near a highly polluted city had a high number of hard plastics that may originate from recreational and daily life activities, while beaches near aquaculture activities had a high number of Styrofoam that originated from buoys. Beaches on the Kerala coast of India with higher fishing intensity received a higher weight of fishing-related plastic debris compared to beaches with lower fishing intensity and non-fishing beaches [19].
Besides anthropogenic activity, hydro- and morphodynamic factors could also influence the abundance and distribution of plastic debris on the beach. Tsukada et al. (2021) [20] showed that a dissipative beach and lower energy environment with a smaller slope and longer sand strip received more microplastics than a beach with a higher slope and shorter sand strip. Degree of exposure, coastal morphology, beach orientation to the prevailing wind, and forms of plastic debris are some factors that also influence the abundance and distribution of plastic debris on the beach [13,20,21].
Malaysia is one of the top consumers of plastic in Asia, with a rate of 56 kg/capita/year of plastic consumption, and was recently ranked as one of the top three countries for mismanaged plastic waste in the world through the river pathway in 2021 [22,23]. After food waste, plastic waste stands as the second-highest amount of waste, with 20% of the total waste generated [24]. In 2019, only 24% of key plastic resins were recycled, and 1.07 million tonnes per year of plastic waste were disposed of [25]. Less than 15% of the waste is safely disposed of, and the amount of waste that could reach the environment may be high [26,27]. The Roadmap Towards Zero Single-Use Plastics 2018–2030 and the Malaysia Plastics Sustainability Road Map 2021–2030 by the government were launched to address plastic pollution and create a circular economy by phasing out unsustainable products, developing sustainable alternatives to improve plastic recovery, recyclability, and reusability, as well as enhancing the pipeline of plastic usage and waste management. In support of this, a more comprehensive database of the status of plastic pollution in Malaysia is needed [27,28,29,30]. This preliminary dataset can also be used in the research and monitoring component of the SEA-MaP programme framework and to inform the development of regional policies and strategies to address plastic pollution in the region of the UN Environment Programme (UNEP). It is also important for planning a strategy and designing and enforcing the laws to mitigate the plastic pollution problem in Malaysia.
Therefore, this study used the beach cleanliness index (BCI) and field sampling to determine the actual cleanliness of the selected study beaches. The objective of this study is to assess the BCI of the selected beaches and determine the abundance and distribution of the macro- (>2.5 cm) and mesoplastics (0.5–2.5 cm) in the northern Strait of Malacca.

2. Materials and Methods
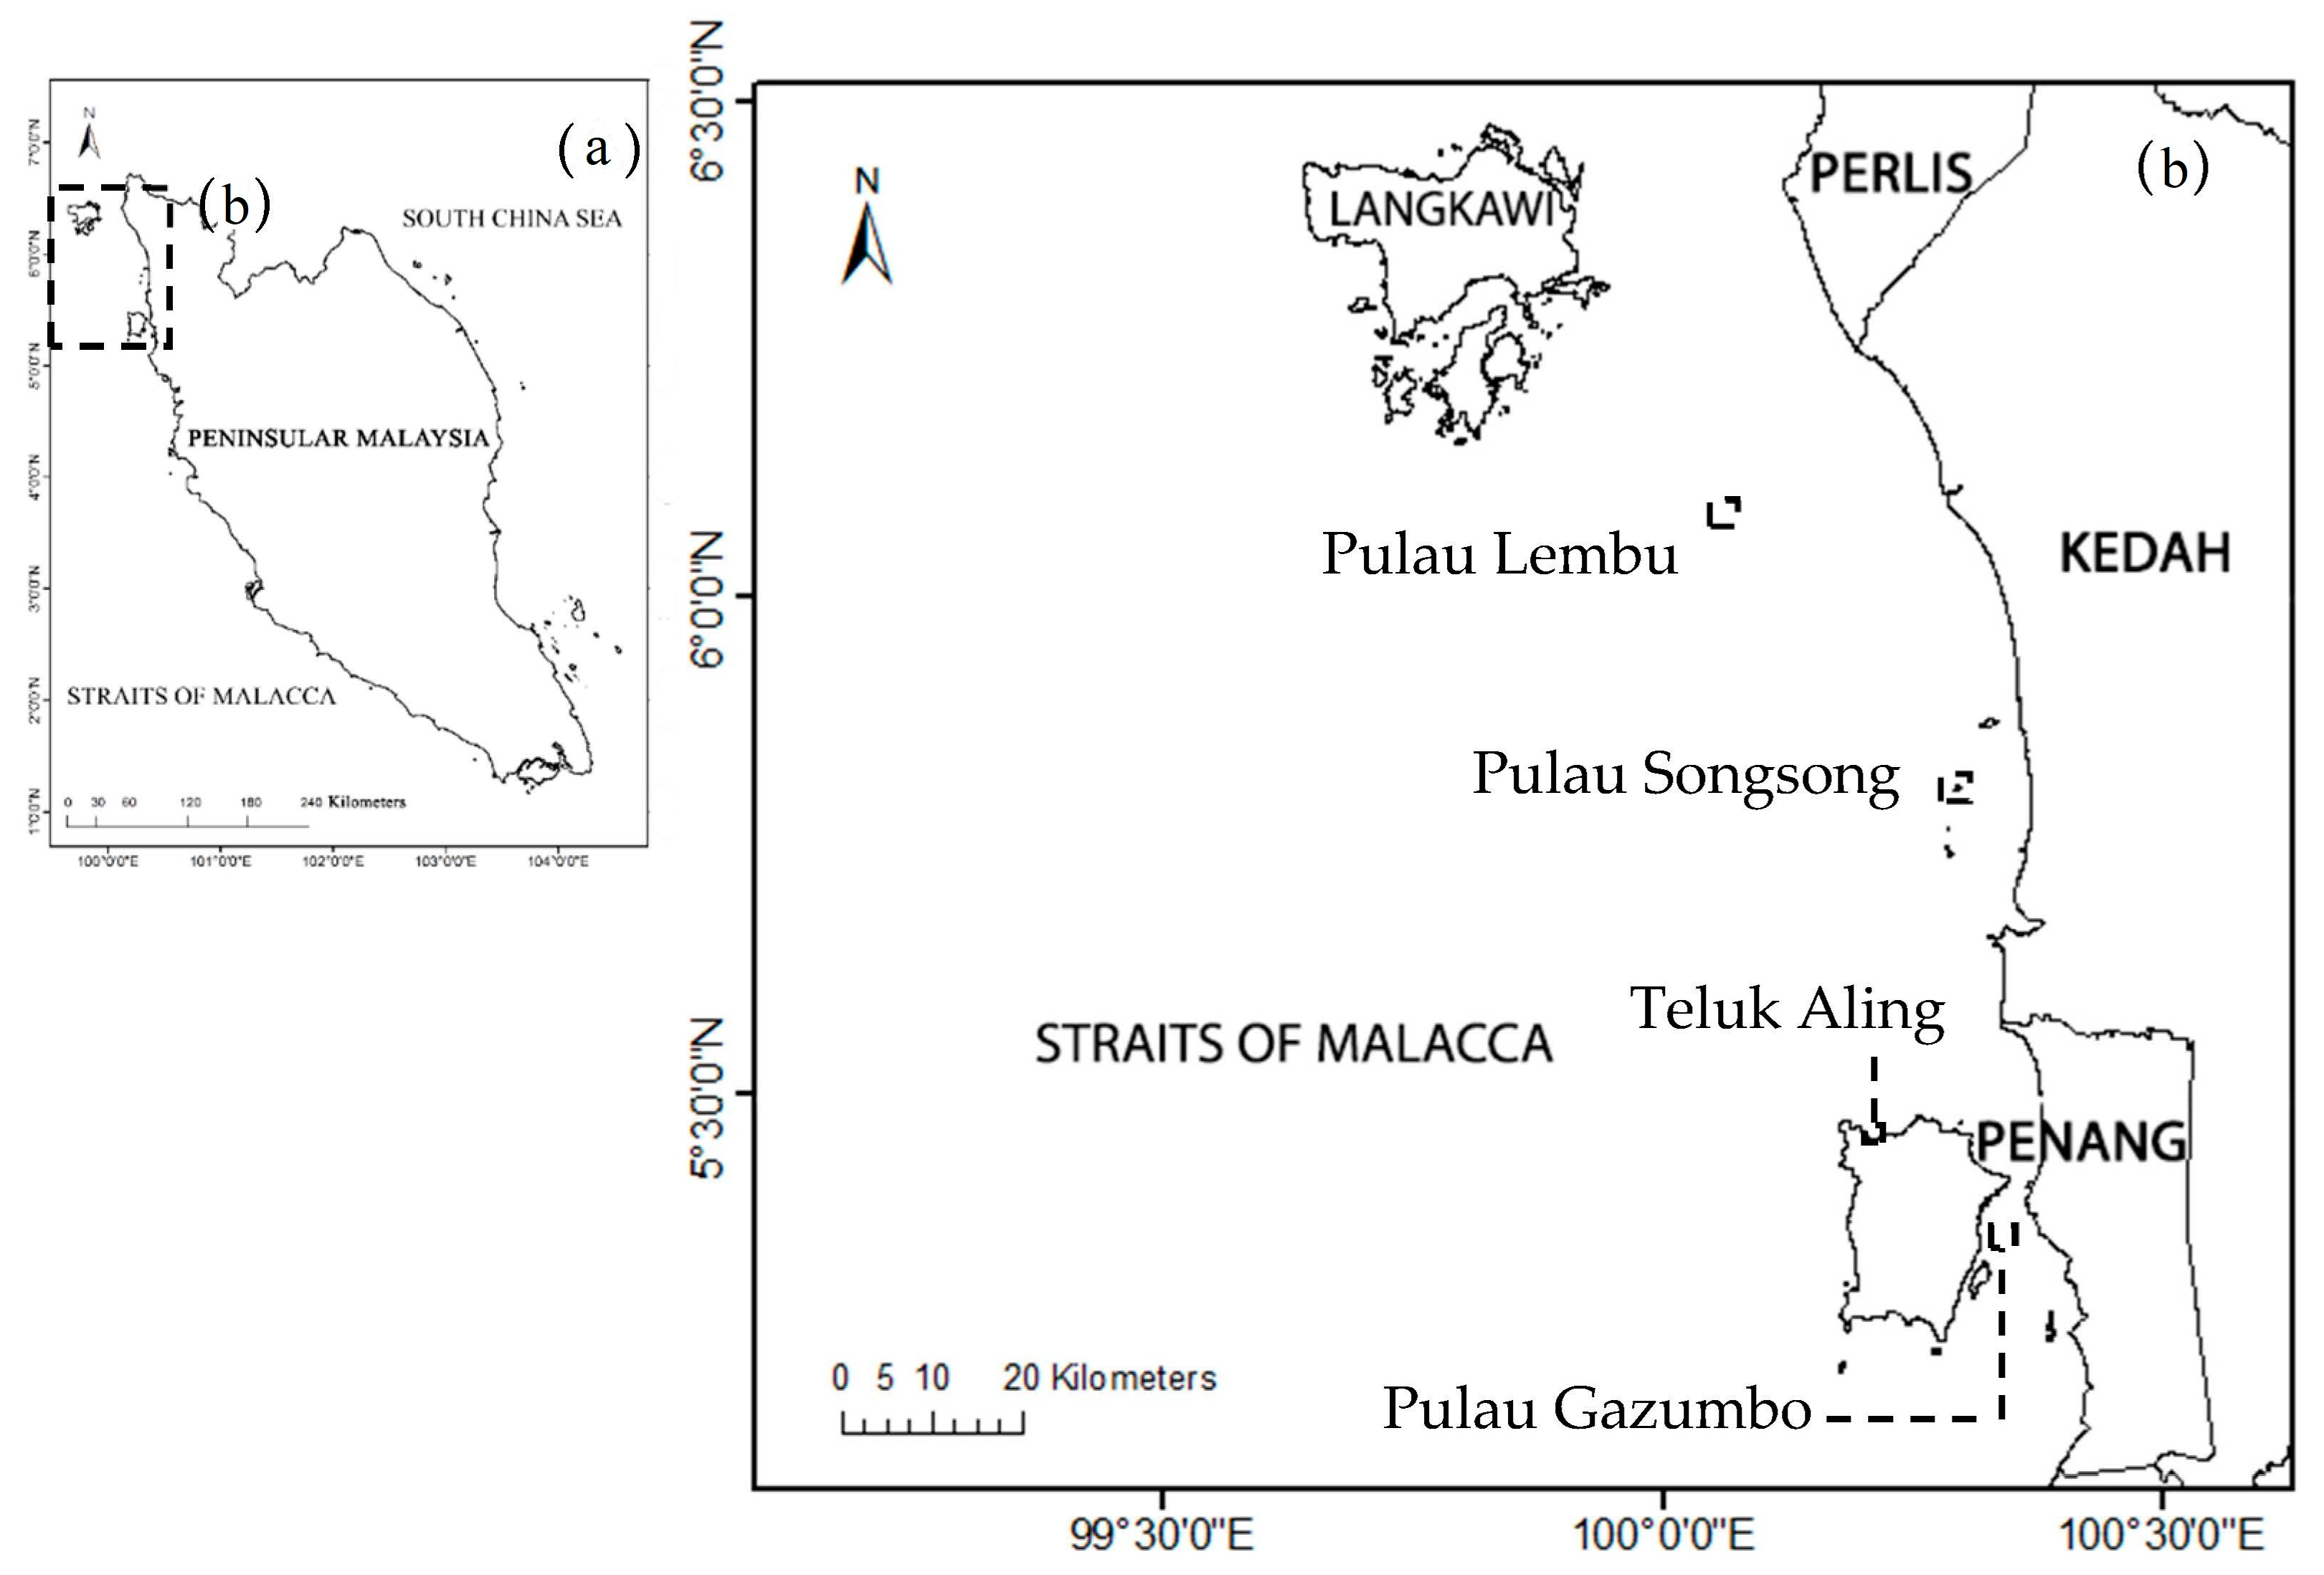
2.1. Study Site

This study focuses on selected beaches of Pulau Lembu, Pulau Songsong, Teluk Aling, and Pulau Gazumbo in the northern Strait of Malacca (Table 1, Figure 1). All study sites are public beaches except for Pulau Lembu, which is in a marine protected area (MPA).

2.2. Beach Cleanliness Index
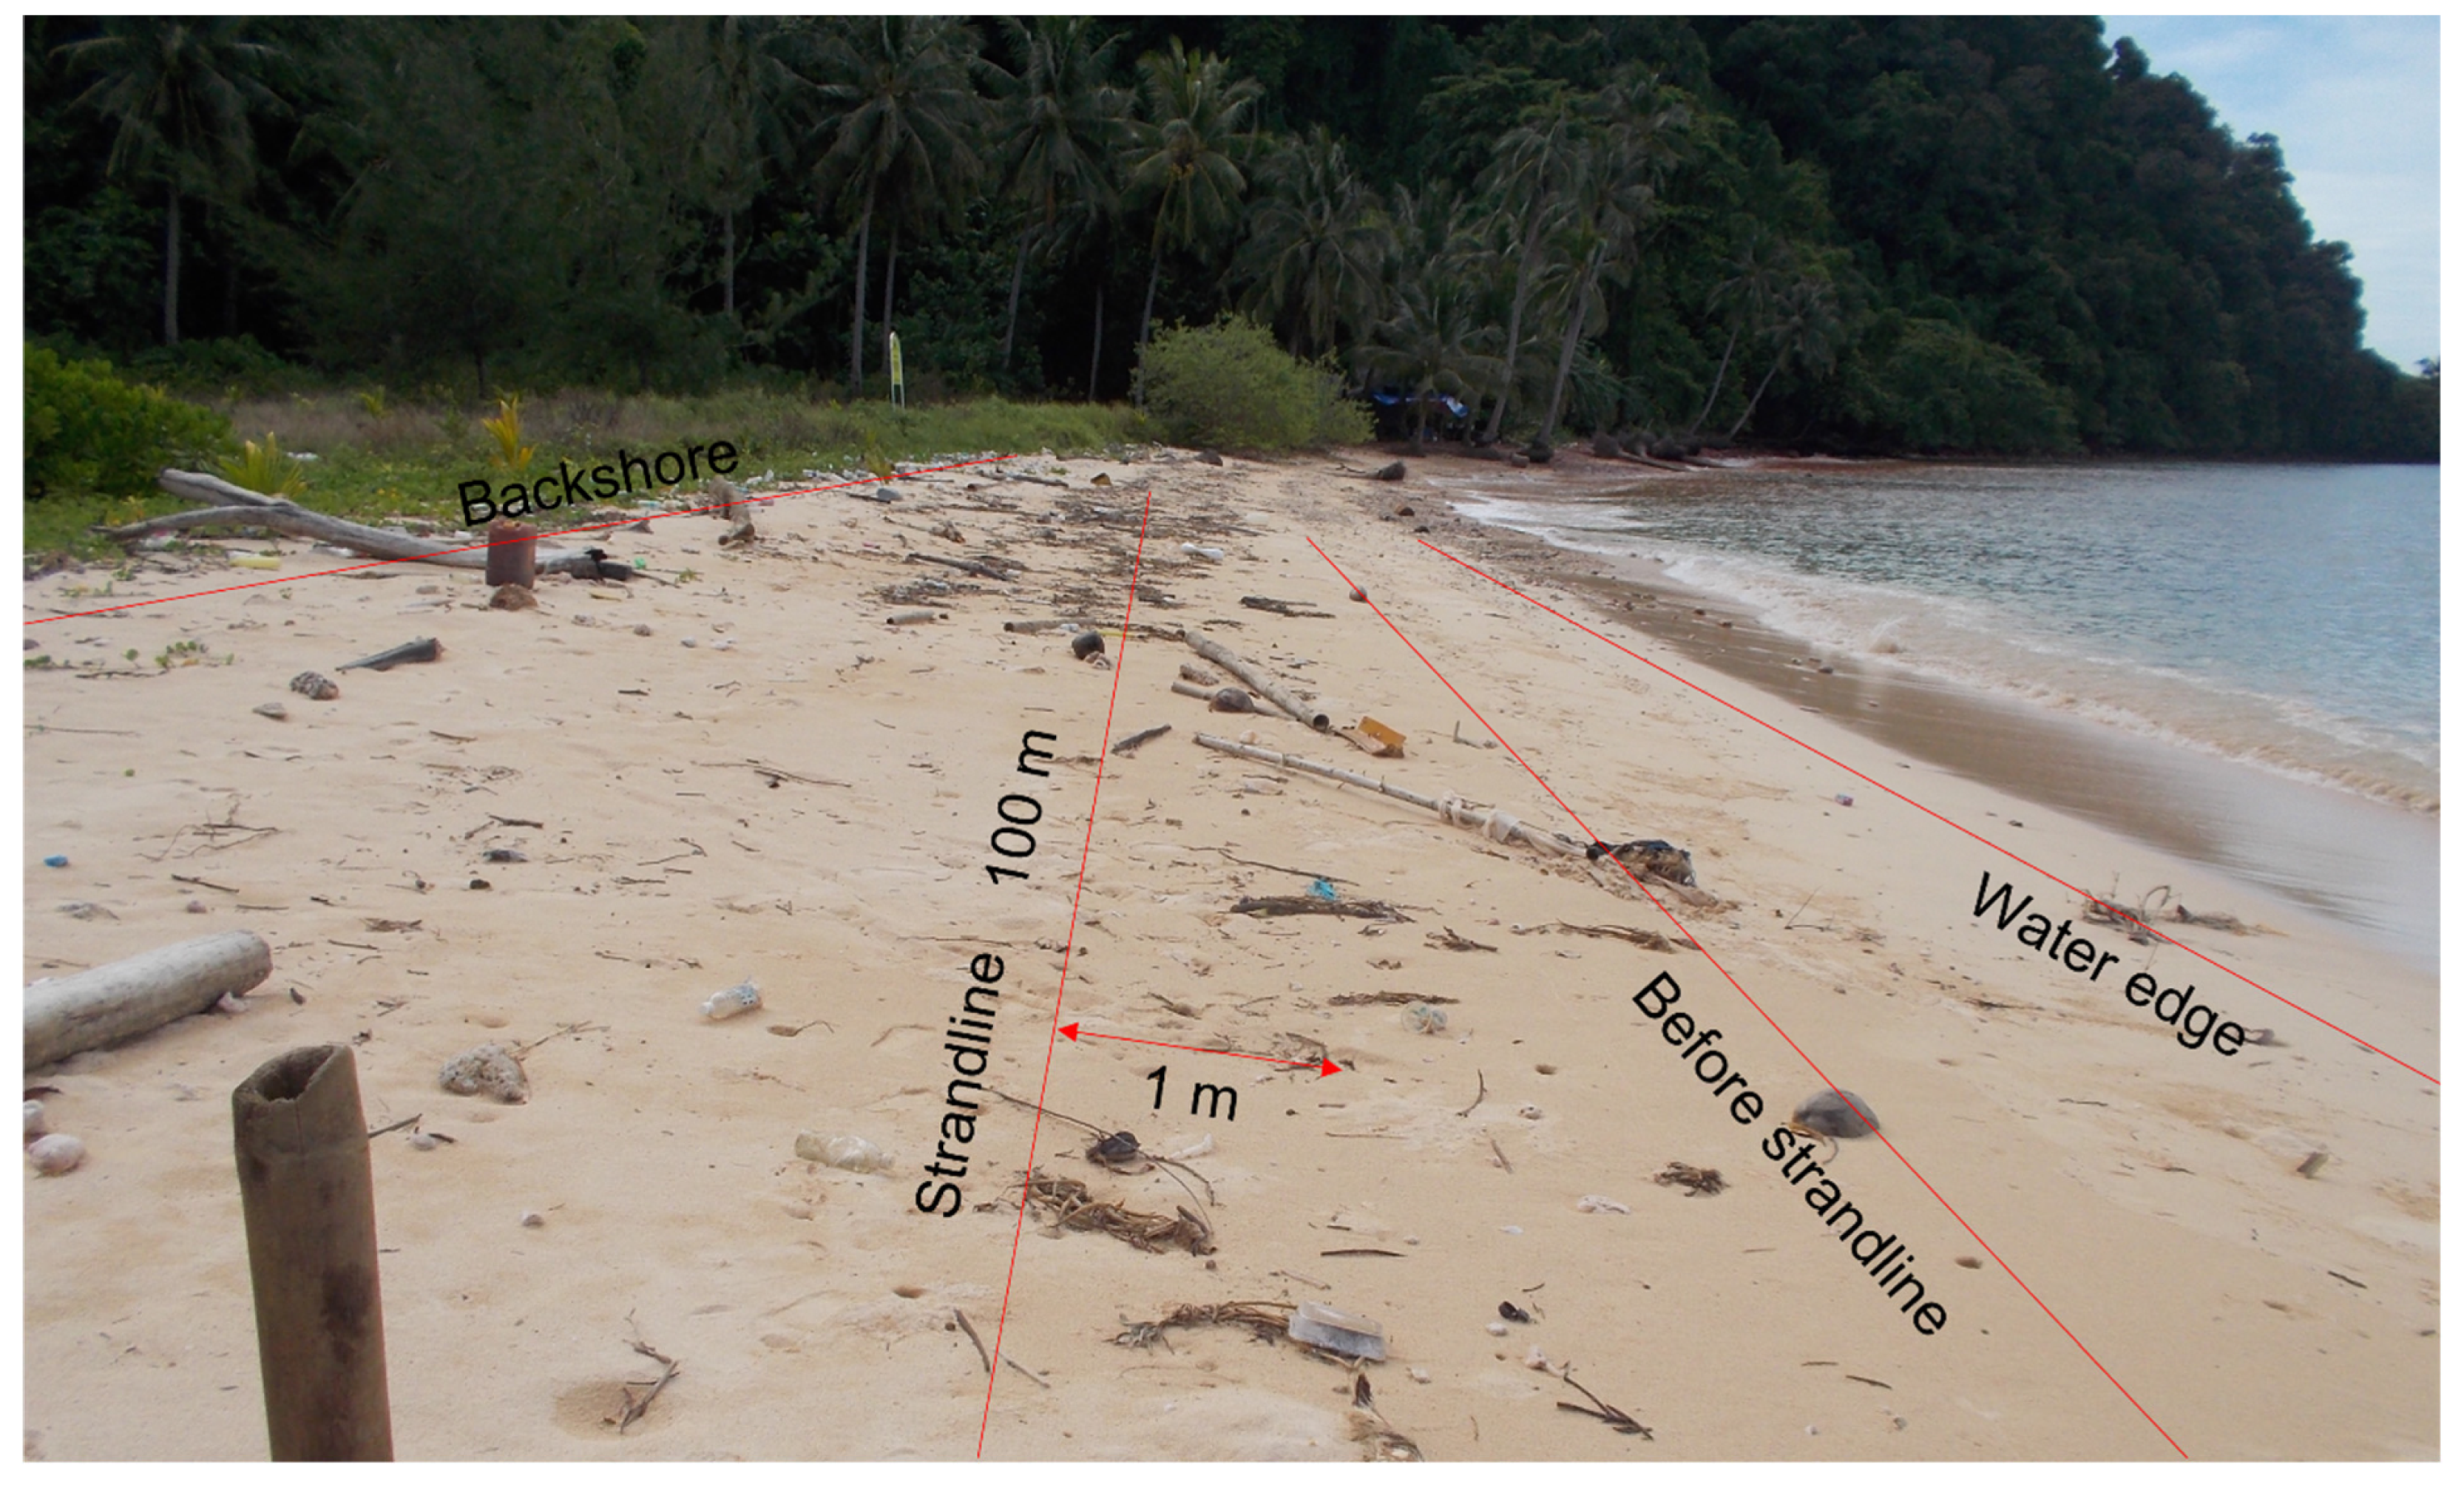
The beach cleanliness index (BCI), which is a descriptive statistic, is established to evaluate the cleanliness of the beach based on the following criteria: frequency of beach cleaning (BC), availability of waste bins (AB), anthropogenic activities (AA), and natural factors (NF), based on Nurul Nadia (2019) [31]. It objectively assesses whether any criterion is sufficient or needs improvement for the beach. Each criterion was scored based on the Likert scale, as shown in the Supplementary Material [31]. Information on the frequency of beach cleaning at Pulau Lembu was obtained from secondary data in the carrying capacity report [32]. For Pulau Songsong, obtained from the “Komuniti Bot Songsong” Facebook page, which has activity records at Pulau Songsong. For Teluk Aling, an informal interview with the cleaner of the local authority. For Pulau Gazumbo, from online news reports of online newspapers reporting the cleaning of Pulau Gazumbo. There was no beach cleaning being done on Pulau Gazumbo based on the observations and experience of CEMACS lecturers working on Pulau Gazumbo for the past decades. Availability of waste bins, anthropogenic activities, and natural factors were observed during the sampling at the study sites by at least three people involved in the sampling.
A decimal numerical value was attributed to the frequency of beach cleaning to represent the exact information of the frequency of beach cleaning obtained. For example, a value of 2.3, between 2.0 and 3.0, in the Likert scale guide for frequency of beach cleaning in Supplementary Materials was given to represent three times per week of beach cleaning at Teluk Aling.
Based on the value given to each of the criteria, the following formula was used to establish the BCI for each study site:
B C + A B ( A A + N F )
The higher the value of BCI, the better the BCI of a study site, and hence, the cleaner the beach would be expected. A higher frequency of beach cleaning and a higher number of waste bins would have a higher probability of bringing cleanliness to the beach. This will increase the value of BCI according to the formula in Section 2.1. A high number of anthropogenic activities and natural phenomena could potentially bring debris. This will decrease the value of BCI.

2.3. Field Sampling

In this study, the modified protocol from Fauziah et al. (2015) [33] and the National Oceanic and Atmospheric Administration (NOAA) by Lippiatt et al. (2013) [34] was used to collect macro- and mesoplastics. The protocol was modified by adding a transect at the zone before the strandline, depending on the size of the beach. Stranded macro- (>2.5 centimetres (cm)) and mesoplastic (0.5–2.5 cm) samples on the surface of the beaches were collected by walking along the transect line laid at four different zones during the lowest tide—backshore, strandline, before strandline, and water edge, as shown in Figure 2. The sampling time details are shown in Table 2. Each site was sampled once throughout the study period, from September 2017 to January 2022. The length of transect lines laid at each zone of the study sites and area of sampling was compiled in Table 2. The length of the transect line laid at each site was determined based on the beach area and length, with the width of each transect fixed at 1 m (m). However, for Pulau Lembu, due to the small beach size, only 30 m of a transect of samples were collected at all zones except before the strandline. Precautions were taken to avoid contamination from other sources of plastic. Dedicated, clean, and sturdy non-plastic containers such as metal containers and equipment were used to store and handle the samples. In the field, the sample collectors were advised not to step on the sampling area to avoid damage and avoid changing the location and depth of the samples. The samples were handled gently to avoid further damage to the samples. Different zones of samples were collected and stored in separated and labelled sampling containers to avoid cross-contamination.
All the data collected were expressed in items or mass per meter squared (m2), as described in Section 2.4. The samples were visually spotted and collected into sampling containers. All the samples were transported back to the laboratory for further processing and analysis.

2.4. Laboratory Processing, Categorisation and Data Analysis

The same precautions taken during the sampling were followed in the processing and analysis of the samples in the laboratory. General good laboratory practice was implemented. Samples were handled meticulously while being washed, dried, measured, weighed, observed, and stored to prevent further damage to the sample. The samples were covered whenever possible to avoid plastics from other sources being included between the samples without knowledge.
The collected samples were washed with freshwater to remove sediment and natural debris not associated with the plastics. The samples were then air dried, and identification was given for, for example, plastic bottles, plastic cups, plastic bags, rubber, toys, cable ties, plastic straws, ropes, and other debris that was found and could be identified. The debris was photographed. Debris in which we were unsure of whether it was plastic was tested with a hot needle test based on De Witte et al. (2014) [35]. A small fragment of the object was cut out and placed under a stereomicroscope with appropriate magnification to observe any changes in the object. A needle was contacted with a flame until it was red or orange in colour, and then it was quickly contacted with the object. A melting or curling event on the object was noted, which indicated the possibility of plastic material.
All plastic debris was measured, counted, weighed, and categorised according to its respective location, size, transect zone, number of items, and mass of item. The macroplastics were categorised according to Malaysia’s major plastic market segment, which includes packaging, electrical and electronics, household, automotive, construction, agriculture, and others [36]. Mesoplastics were further categorised into their form, which includes fragment, foam, filament, and film, based on Lee et al. (2013) [37] and Lee et al. (2015) [38] with modifications [39]. The amount of macroplastics at each transect zone and location was expressed in gram (g)/m2, while for mesoplastics, items/m2 were calculated by using the formula below:
A = n u m b e r   o r   w e i g h t   o f   p l a s t i c   d e b r i s   ( i t e m   o r   g ) a r e a   o f   s a m p l i n g   ( m 2 )
where A = abundance of plastic debris (items/m2 of g/m2).

3. Results

3.1. Beach Cleanliness Index

The beach cleanliness index, which comprised frequency of beach cleaning (BC), availability of waste bins (AB), occurrence of anthropogenic recreational activities (AA), and natural factors (NF), was established for each study site based on observations and experience during the sampling event. The score was tabulated in the Supplementary Material.
The calculated BCI using the formula in Section 2.2 based on each of the criteria is shown in Table 3. The highest BCI index was attributed to Teluk Aling with−1.63, followed by Pulau Songsong and Pulau Lembu, with −2.85 and −2.92, respectively. The lowest BCI index was attributed to Pulau Gazumbo, with −3.99.

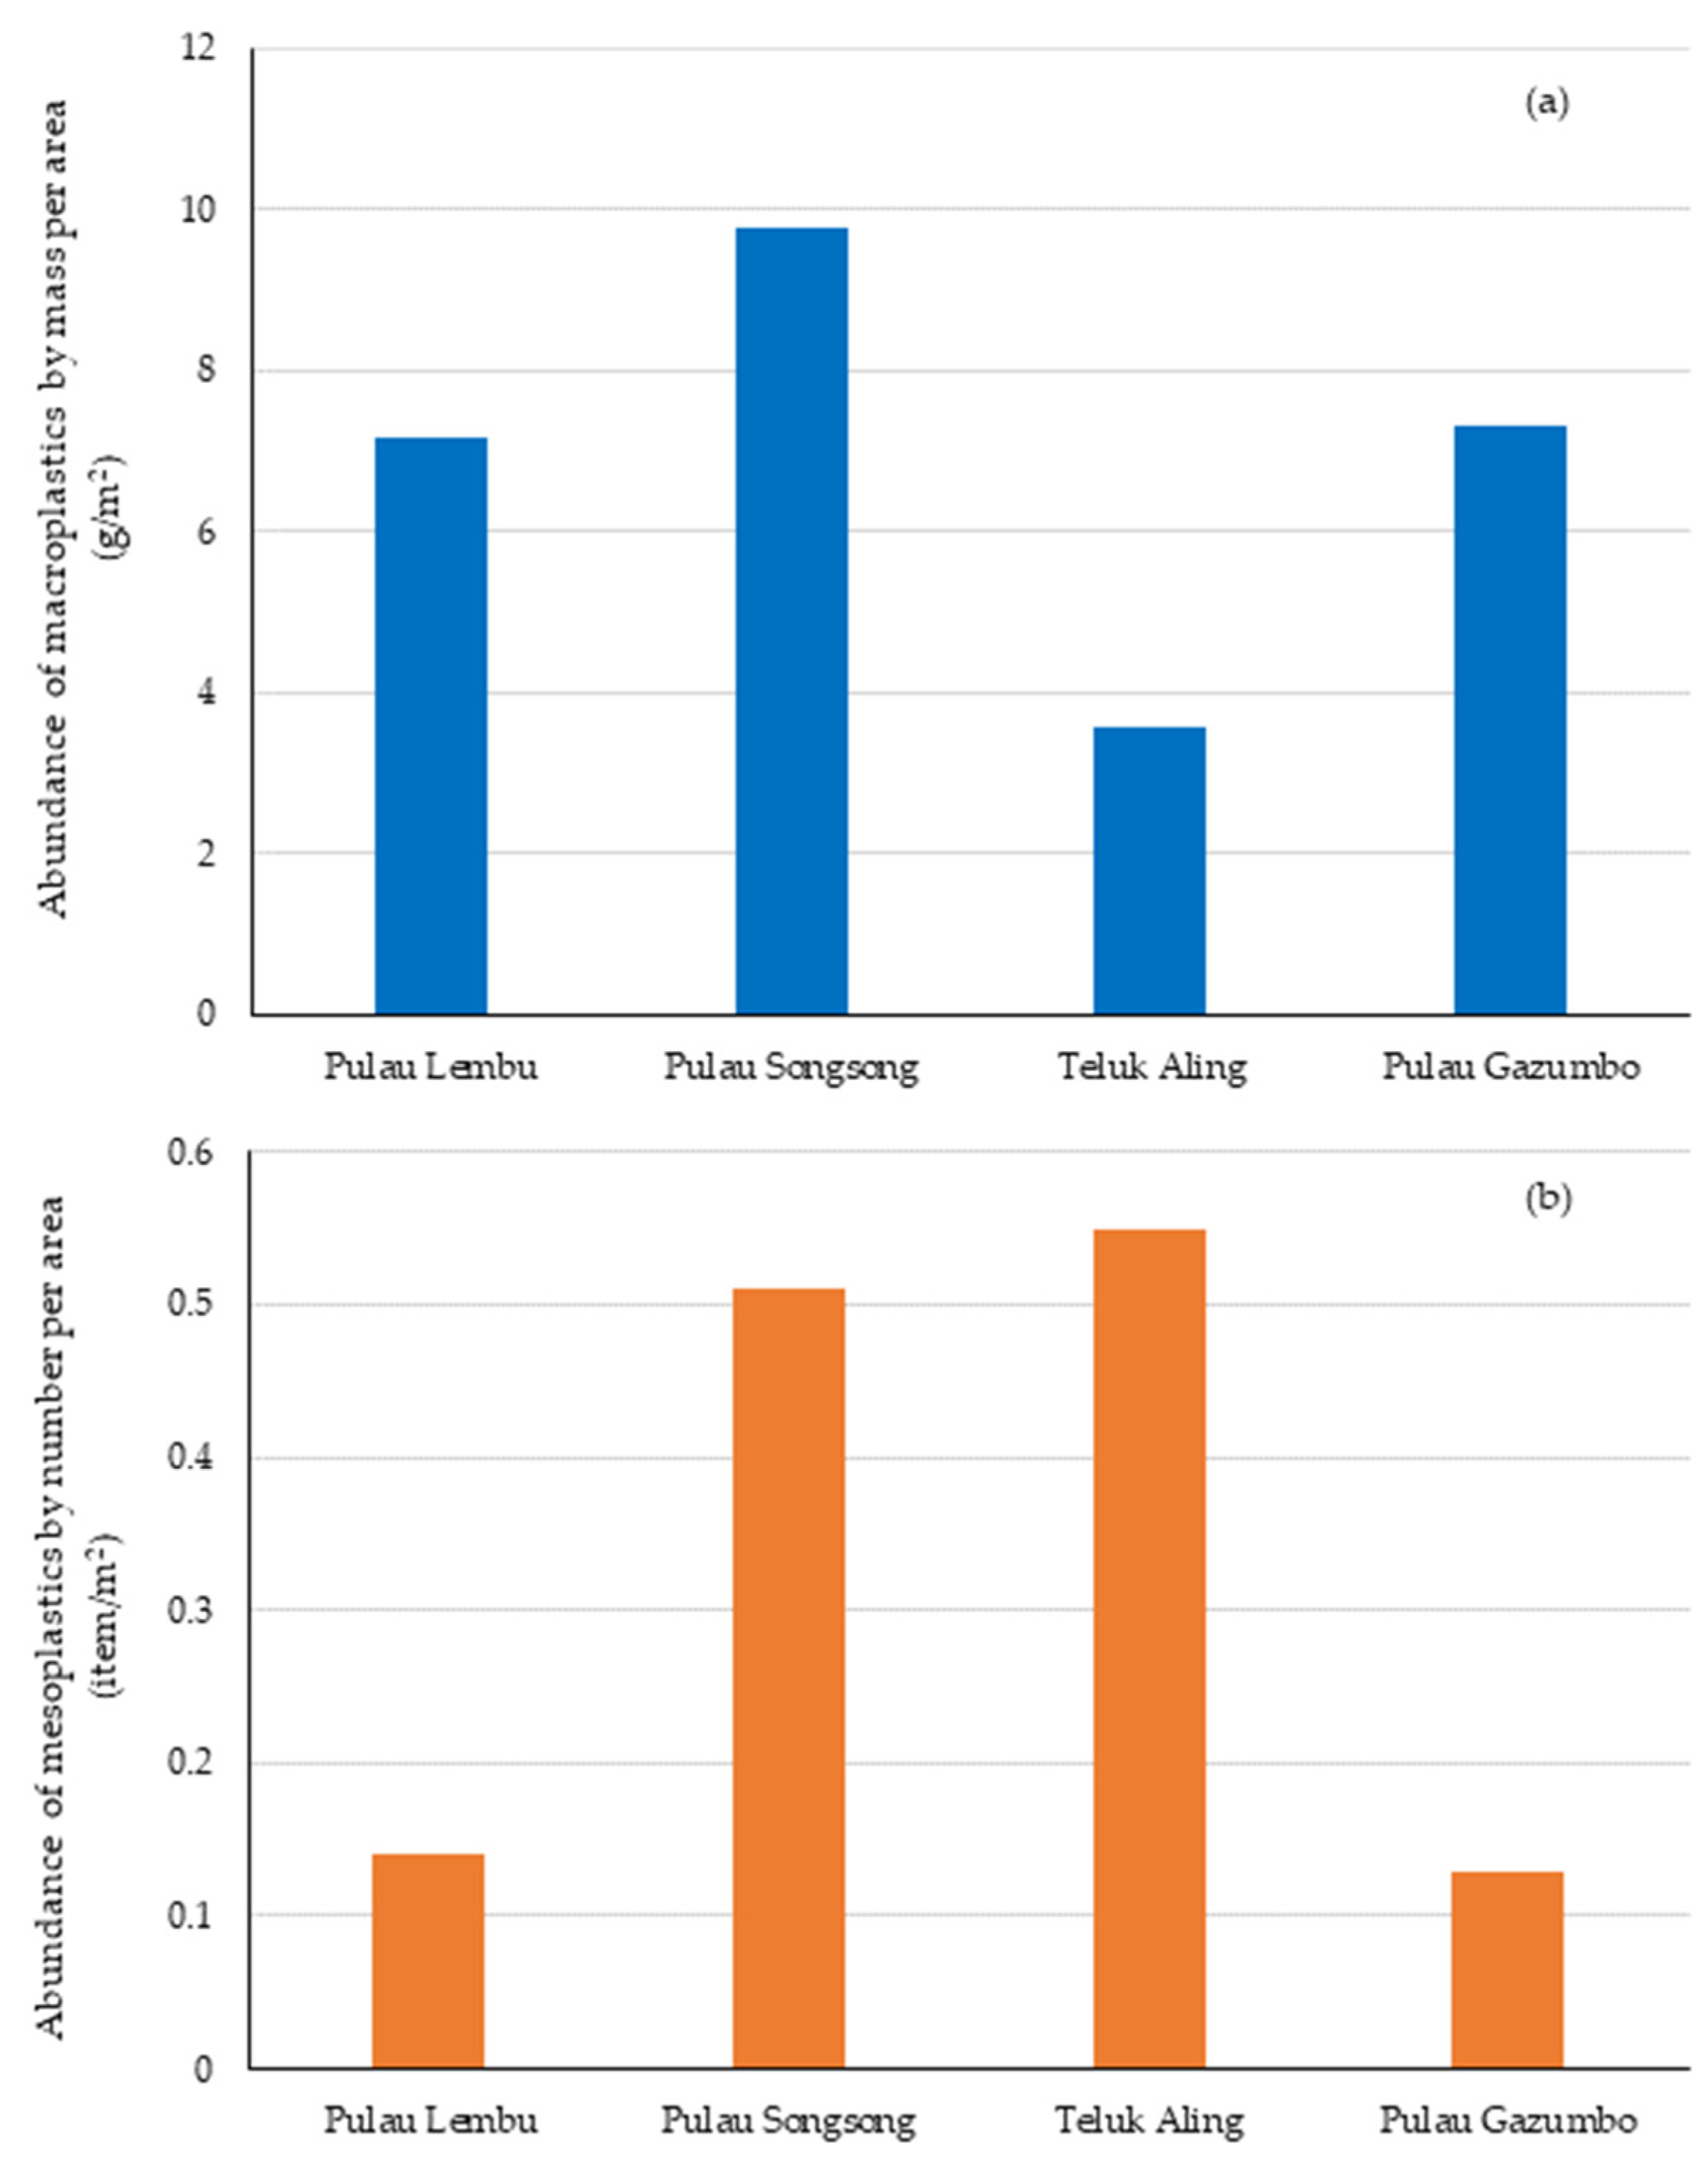
3.2. Abundance and Distribution of Plastic Debris

In terms of mass, most of the macroplastics (53–75% of total mass) were found at the backshore area, while in terms of number, most of the mesoplastics (52–80% of the total number) were also found at the backshore area, as shown in Figure 3 and Figure 4. The highest average abundance of total macroplastics by zone in terms of mass was found at Pulau Songsong, with 9.77 g/m2, followed by Pulau Gazumbo, with 7.32 g/m2, as shown in Figure 5. The lowest was found at Teluk Aling, with 3.58 g/m2. For mesoplastics, the highest was found at Teluk Aling, with 0.55 items/m2 in terms of number, followed by Pulau Songsong, with 0.51 items/m2, as shown in Figure 5. The lowest was found at Pulau Lembu and Pulau Gazumbo, with 0.14 items/m2 and 0.13 items/m2, respectively.
The macroplastics collected were categorised according to the plastic market segment of Malaysia. The market segment with the most macroplastics categorised into it was the packaging market segment, as shown in Figure 6. The highest percentage of the packaging market segment of macroplastics can be found at Pulau Gazumbo, followed by Pulau Lembu and Teluk Aling, where most of the packaging macroplastics were plastic bottles, containers, and polystyrene foam debris, as shown in the example in Figure 7. For Teluk Aling, the packaging macroplastics found were mostly film debris, such as plastic bags, food wraps, snack bags, and Tetra Pak, as shown in Figure 7a,b. At Teluk Aling, there was the second-highest percentage of the plastic market segment, which differs only by 11% from the packaging market segment, which was the agriculture segment. It comprised fragmented parts of nets and lines, buoys, and raffia strings, as shown in Figure 7c.
The mesoplastics collected were categorised into fragment, foam, filament, or film form and their respective transect zone, as shown in Figure 4. The highest average number of fragment form of mesoplastics per area by zone was found at Pulau Songsong, with 0.36 items/m2, followed by Teluk Aling, with 0.16 items/m2. For foam of mesoplastics, the highest was found at Pulau Gazumbo, with 0.11 items/m2, followed by Pulau Songsong, with 0.10 items/m2.
For the filament form of mesoplastics, the highest was found at Teluk Aling, with 0.23 items/m2, followed by Pulau Songsong, with 0.04 items/m2. For film form mesoplastics, the highest was found at Teluk Aling, with 0.15 items/m2, followed by Pulau Lembu, with 0.04 items/m2.
A further search of secondary data was conducted to determine whether the weather factor affects the abundance of plastic debris found in this study. Weather observation data obtained from external sources [40,41,42,43] show the frequencies of rainfall in that particular sampling month show a similar pattern as the abundance of macroplastics by mass, where the higher the number of occurrences of rainfall, the higher the mass of macroplastics, as shown in Figure 8. However, no apparent relationship was observed between the number of mesoplastics and the number of occurrences of rainfall in the particular months when samplings were conducted.

4. Discussion

Factors related to the environment, such as the patterns of local water currents, weather conditions, the level of exposure, and the profile of the beach, such as the type of substrate, slope, and curvature, may impact the accumulation of debris on the beach [44,45], in addition to the direct disposal of waste by beachgoers. Despite this, the initial study did not take these factors into account. Therefore, further research will be necessary to assess the impact of these variables on the spatial and temporal trends of debris deposition and subsequently forecast the occurrence and location of plastic accumulation. In this study, most of the plastic debris was deposited at the backshore of the study sites. Similar to other studies, Lee et al. (2017) [18] found that the backshore had more mesoplastic debris than the other lines at the beaches studied in Korea. Noik and Tuah (2015) [46], Razlan (2011) [47], Fauziah et al. (2015b) [48], and Fauziah et al. (2015a) [33] also found a higher amount of debris at the higher strandline, berm area, or near the vegetation line in some beaches in Malaysia. This suggested that debris is usually washed by ocean waves towards the onshore area and accumulated at the higher area of the beach along with other natural debris. Lee et al. (2015) [38] also showed that most of the debris accumulated at the backshore was more than the strandline. Therefore, the sampling zone should be carefully selected for the plastic debris survey [38]. The debris found in this study was also dominated by debris that is less dense than seawater, such as plastic bottles, Styrofoam debris, plastic bags, and plastic containers, which can be easily transported by the ocean to the backshore [49].
There was some debris collected from the area before the strandline and water edge of the study sites, especially at Pulau Lembu, Teluk Aling, and Pulau Gazumbo. Forseberg et al. (2020) [50] showed that film debris with a high drag force is more sensitive to return flow and can be easily backwashed to the surf zone. Light debris can be easily blown onshore or offshore, depending on the direction of the wind. These might explain the presence of foam and film throughout the beach, at the area before the strandline and water edge, as well as backshore and strandline. Other factors, such as beach morphodynamics, will influence the debris’s deposition. A study by Tsukada et al. (2021) in southeastern Brazil [20] showed that a long beach with a lower slope can accumulate more microplastics than a shorter beach with a higher slope. By recording the length and slope of the beach and other physical measurements, the specific beach profile can be described, and the deposition of macro- and mesoplastics may be elucidated as well.
The lowest BCI index was attributed to Pulau Gazumbo and the second lowest to Pulau Lembu and Pulau Songsong. This is due to the lower frequency of cleaning at Pulau Gazumbo compared to Pulau Songsong. However, more activities are being conducted at Pulau Songsong, which can be reflected in the abundance of macroplastics. Pulau Songsong also had the highest mass of macroplastics, which could be due to camping overnight, and this might generate waste, such as plastic bottles, within a few days at the beach. Furthermore, there is no consistent cleaning schedule at Pulau Songsong compared to Teluk Aling, which has regular cleaning activities by the local authority. According to reports on social media by local communities, irresponsible visitors left garbage at the beach, although they were told to bring it out. On the other hand, the beach at Pulau Gazumbo does not have a waste bin. It is also located at the Penang Strait, joining the Strait of Malacca, one of the busiest shipping routes in the world, joining the Pacific Ocean and the Indian Ocean [51]. It is also surrounded by urban activities such as shipping and landfilling nearby and is influenced by the Perai River.
Packaging debris was the highest mass of debris found at the study sites, which can be explained by the data that 48% of all the plastics consumed by Malaysia are packaging [25]. Takeaway bags, containers, bottles, and cups make up more than 80% of the plastic waste in Malaysia [25]. Matching the global pattern, 40.5% of end-use plastic products in Europe in 2020 were packaging [52]. Single-use plastics, such as plastic bags, containers, and bottles, are the majority of plastic packaging products [53]. Furthermore, 50% of the commonly found items in beach clean-ups worldwide are plastic packaging [26]. Therefore, besides the possibility of littering by tourists, the ocean and winds could also transport the debris present at the study sites from places far away. Plastic debris on the remote island of Canary Island, Cocos Islands, and St. Brandon’s Rock shows the possibility of transboundary movement of plastic debris through the ocean or humans [54,55,56]. There is less activity at Pulau Lembu compared to other study sites in this study. The debris collected from Pulau Lembu could be transported by the ocean and wind to the island. The source of plastic debris may be sourced from the debris released from the rivers into the Northern Hemisphere Indian Ocean [57]. Malaysia, along with several countries bordering the Bay of Bengal, could be receiving the debris throughout the year due to the annual mean eastward flow in the equatorial region [58], as well as anti-cyclonic and cyclonic gyres in the Bay of Bengal [59], and especially during the southwest monsoon current season. Furthermore, plastic debris tends to accumulate in the same region or country where it was initially produced and discarded. However, more studies need to be conducted to confirm if it applies to the current study sites.
Agricultural debris, such as buoys and fragments of net, ropes, and lines, could originate from the fishing activities surrounding the beach, especially at Teluk Aling. Similar to other beaches in Malaysia, such as Penarak Beach, Kedah, Sibu Island, Johor and Pasir Panjang Beach, Negeri Sembilan, that have fishing activities, fishing-related debris was spotted [30,60].
Mesoplastics could be generated through embrittlement by ultraviolet light and various forms of mechanical stress, such as ocean waves [61,62]. Garello et al. (2021) [63] found a significant relationship between the number of macroplastics and mesoplastics, indicating that mesoplastics are the result of macroplastic fragmentation. For example, the filament mesoplastics collected from Teluk Aling might have originated from their larger counterparts, such as ropes, which are used in fishing or boating activities, where the filaments fragmented and became smaller in size. Mesoplastics can be used as an indicator of pollution hotspots. There is also a correlation between the number of mesoplastics and microplastics based on, for example, studies at beaches around the Korean Peninsula and the Algerian western coast [38,64]. Future studies can provide more data on microplastics at the study sites and their relationship with macro- and mesoplastics, which will also provide a better picture of the possible impact on the habitat.
Table 4 shows some of the plastic pollution studies at the Strait of Malacca on the abundance of macroplastics and mesoplastics at the beaches. Table 5 shows some studies in other countries. The abundance of macroplastics at Kuala Perlis coastal areas and beaches of Port Dickson, such as Pasir Panjang, Saujana, Nelayan, Bagan Pinang, and Cermin Beach, was higher than the macroplastics found at the current study site. Similar to the current study, for the beaches of Port Dickson, the debris was mainly sourced from active tourism activities, while for Kuala Perlis, it can be sourced from recreational activities, smoking-related activities, dumping, and hygiene issues. Certain sites with fishing activity were found to have fishing-related plastic debris, such as parts of ropes, nets, and lines. Tires were also used as an artificial reef at Penarak Beach [31]. Globally, Korea has high marine activity, especially aquaculture activity. Coupled with inadequate maintenance, waste management, and knowledge, these led to the coastlines being polluted by Styrofoam buoys, which were heavily used as floats at the aquaculture farms. These indicate that the activities surrounding the area play a role in contributing to the type of debris found if the waste is not managed well.
In addition, rainfall may influence the deposition of macroplastics at the current study sites, as in Teluk Aling, the rainfall occurrence time was lower than the other sites, which could be one of the factors for the lower abundance of plastic debris than other study sites besides the management of the beach and human activities. However, this was inconclusive, as this preliminary study did not consider the influence of seasonal variation on the study sites. Rainfall could cause debris runoff from the land through rivers and enter the marine environment [65]. Similar to the study of [66], on the east and west coasts of Hong Kong, the abundance of plastic debris was higher during the wet season, which was accompanied by higher rainfall than in the dry season. However, the east coasts of Hong Kong were not influenced by the different seasons due to their further distance from the Pearl River estuary. This may apply to current study sites, where the season and rainfall might not influence certain locations. Nevertheless, more comprehensive studies are needed to confirm the seasonal variation in the abundance of plastic debris at the study sites. Other variations that might influence the deposition of debris at the beach during the different monsoon seasons could be wind exposure and water current. Besides, other factors, such as the rate of embrittlement and fragmentation of macroplastics, could also influence the number of mesoplastics at the study sites.
Table 4. Plastics pollution studies at some beaches in Malaysia at the Strait of Malacca.
No.LocationMethodTypes of BeachQuantity of MacroplasticsQuantity of MesoplasticsMost Abundance Waste CompositionReferences
1.Kuala Perlis coastal area, PerlisSampling within a determined areaUrban/recreational/fishing53,150 g/m2-Plastics[67]
2.Pasir Panjang, Port Dickson, Negeri
Sembilan
Sampling within a determined areaFishing27.575 g/m2-Plastics, bulky waste[60]
3.Teluk Kemang, Port Dickson, Negeri
Sembilan
Sampling within a determined areaRecreational1.021 g/m2--Plastics,
paper
[60]
4.Pasir Panjang, Port Dickson, Negeri
Sembilan
Sampling within a determined areaFishing20.408 g/m2-Plastics, bulky waste[68]
5.Teluk
Kemang, Port Dickson, Negeri
Sembilan
Sampling within a determined areaRecreational0.644 g/m2-Plastics,
paper
[68]
6.Pasir Panjang, Port Dickson Negeri
Sembilan
Sampling within a determined areaFishing6.803 g/m2-Plastics, bulky waste[69]
6.Sungai Lurus, JohorSampling within a determined areaFishing, recreational0.0868 g/m2-Plastics,
paper
[70]
7.Minyak Beku, JohorSampling within a determined areaFishing, recreational, tourism, historical landmark0.1722 g/m2-Glass,
plastics
[70]
8.Saujana BeachSampling within a determined areaRecreational0.00000094 g/m2-Plastics[71]
9.Saujana, Nelayan, Bagan Pinang, and Cermin Beach, Port Dickson, Negeri
Sembilan
Sampling within a determined areaFishing26.2570
g/m2
-Plastic (hard and film plastic, foamed
plastic)
[72]
10.Pulau Besar mainland,
Malacca
Sampling within a determined areaRecreational0.299 g/m2-Ceramics[31]
11.Pulau Besar facing sea,
Malacca
Sampling within a determined areaRecreational0.314 g/m2-Plastic, newspaper[31]
12.Penarak Beach, LangkawiSampling within a determined areaFishing
village
0.092 g/m2-Rubber for fishing
activity
[31]
13.Tengah Beach, LangkawiSampling within a determined areaRecreational0.335 g/m2-Plastic[31]
Table 5. Plastics pollution studies at some beaches of other countries.
No.LocationMethodTypes of BeachQuantity of MacroplasticsQuantity of MesoplasticsMost Abundance Waste CompositionReferences
1.Tae-An,
Republic of Korea
Sampling within a determined area of high tide lineFishing and aquaculture6.588 g/m2-Rope[73]
Shin-An,
Republic of Korea
Sampling within a determined area of high tide line 30.788 g/m2-
Go-Heung, Republic of KoreaSampling within a determined area of high tide line 7.604 g/m2-
Yeo-Su,
Republic of Korea
Sampling within a determined area of high tide line 3.52 g/m2-
U1-Jin,
Republic of Korea
Sampling within a determined area of high tide line 0.216 g/m2-
Gang-Reung, Republic of KoreaSampling within a determined area of high tide line 0.304 g/m2-
2Twelve beaches along the west, south, and east coast, Republic of KoreaHigh strandlineMost beaches have aquaculture activities at the sea18.50 g/m237.7 particle/m2Styrofoam buoy for aquaculture[38]
3Twenty beaches along the west, south, and east coast, Republic of KoreaOverall of backshore, middle line, and water edgeSome coastlines have high aquaculture activity coastlines-13.2 ± 28.7 items/m2
(0–44 items/m2)
Styrofoam packaging and buoy, hard plastic for daily life[18]
4Eight beaches along the Guangdong coast, South ChinaHigh strandlineDensely
populated beaches
-163 ± 154 items/m2
(0.5–1 cm)
Styrofoam disposable food boxes, heat-insulated boxes, buoys[74]
5Eight Japanese beaches10 m by 10 m
survey unit from the water edge to backshore; two or three lines of units parallel to the coastline;
maximum of 10 units
-13.74 g/m2-Fragments, resin pellets[75]
The possible impact of marine litter on the organisms in the habitat has been discussed by Mazarrasa et al. (2019) [76]. Based on the assessment of the possible impact, plastic bags, wraps, and industrial packaging could cause light reduction and hypoxia. String and cord less than 1 cm long could cause encroachment and erosion, while big plastic fragments could cause light reduction and erosion to the habitat. Nevertheless, the impact assessment was not highlighted in this study and can be a future suggestion for the study. To ensure the conservation success of the ecosystem at Pulau Lembu as an MPA, the beaches need to be maintained by frequently removing the debris washed onshore. Diverse corals are present at Pulau Lembu and Pulau Songsong, which are important for their productivity and economic value [77].
Together with other study sites, the potential impacts are the unattended plastic debris at the beaches could also generate microplastics from their larger counterparts through embrittlement and abrasion by UV photooxidation, heat, waves, humans, and others [78]. The smaller-sized microplastics have higher bioavailability for a wide range of organisms. Especially at Pulau Songsong and Pulau Lembu, the corals are vulnerable to different sizes of plastic debris, which can cause coral diseases, tissue necrosis, and bleaching [79,80]. On other beaches, for example, the health of invertebrates, such as bivalves, could be affected, including a drop in energy uptake and decreased fecundity [81].
To reduce the possible impact, the frequency of cleaning and availability of waste bins at Pulau Songsong, Pulau Gazumbo, and Pulau Lembu can be increased to improve the BCI value, which would help to reduce marine debris, including plastic debris, at the location. Khairunnisa et al. (2012) [60] compared their study site’s abundance of debris and its management status. They deduced that regular cleanup and the availability of waste bins could help reduce the amount of waste. The reduced aesthetic value of a beach is common globally due to the presence of plastic litter [64]. As shown in this study, better waste management could help improve cleanliness. Subsequently, the attractiveness and conservation of the beaches can be improved, as can the economic opportunities provided.
Based on the results, as with most of the previous studies, packaging debris was the highest debris found and should be prioritised to reduce plastic pollution. The “no plastic bag” and, in addition, “no straw by default” policies mentioned in the Malaysia Roadmap Towards Zero Single-use Plastics 2018–2030 should be more strictly enforced, especially in small-scale shops, including street markets. Recycling bags should be made available in shops. Consideration should be given to enforcing bringing personal food containers to limit single-use containers for appropriate takeaway food. Research and development should focus on alternative food wrappers and snack films to reduce waste. Developing better recycling technologies and offering subsidies to research and development as well as consumer of alternative plastics can help reduce plastic waste. Fishing gear and nets should be recycled or upcycled, and biodegradable nets could be adopted [82]. Tracking dangerous areas can make fishing safer by not casting the net over the dangerous area [82], which could damage the net. Waste issues in the fishing and aquaculture areas should be addressed more as well.
Recycling with an incentive program can be done and raises awareness of the importance of 3R and waste segregation at the source [83]. A long-term plan for reducing marine debris issues would include the plastic pollution topic in the syllabus of the current education system, along with other pollutants that cause climate change and its related issues.

5. Conclusions

Based on the calculated BCI index, Pulau Gazumbo (−3.99) was the dirtiest site, while Teluk Aling (−1.63) was the cleanest site, corresponding to the weight of microplastic debris found. However, all the study sites’ cleanliness may not be ideal, as the indexes were less than zero due to the low availability of waste bins and insufficient frequency of beach cleaning. Consequently, this may not be able to curb the effect of high anthropogenic activities conducted in addition to uncontrollable natural factors. This study shows that Pulau Lembu, although located in an MPA, is not immune to plastic debris.
The dataset collected in this study can be further used to identify the types and quantities of plastics most commonly found in the study areas and identify priority areas for action. Although this study was done on a small scale, the location covered in this study, the Strait of Malacca, is one of the marine litter hotspots due to the high level of shipping activity in the area, combined with inadequate waste management infrastructure in some coastal areas. This study provides baseline data for future research and assessments on whether our remediation plans are effective. It is vital to protect Malaysia as a biodiversity hotspot [84]. Education is of utmost importance to instil an understanding of the harmful effect of plastic debris on the environment and the associated organisms, which ultimately affects us as humans. Besides that, international collaboration, enforcement, and responses from policy, law, and governance are vital to remediating the plastic pollution problem before it becomes exacerbated. With the expected outcomes listed in the Malaysia Plastic Sustainability Roadmap 2021–2030, such as the problematic design of plastics being phased out, 50% of plastic packaging being recycled, higher plastic waste recovery for recycling, and consumer behaviour changes, the expected results of the future similar study, as we are progressing towards achieving the target of the roadmap, should be a reduction in the overall abundance of plastic debris, a reduction in packaging plastic, and a reduction in unrecyclable plastic waste, indicating the viability of our action plan.

Supplementary Materials

The following supporting information can be downloaded at: https://www.mdpi.com/article/10.3390/jmse11051057/s1.

Author Contributions

E.V.L. methodology, formal analysis, investigation, data curation, writing—original draft preparation, visualization; N.N. conceptualization, investigation, resources, project administration, funding acquisition; N.M.R. conceptualization, methodology, software, formal analysis, investigation, resources, data curation, writing—original draft preparation, writing—review and editing, visualization, project administration, funding acquisition; S.Z. methodology, resources, supervision; H.L. resources, supervision; M.L.H. software, investigation resources, project administration; A.L.A. supervision; Z.Y. conceptualization, methodology, resources, supervision, project administration, funding acquisition; N.M.Z. conceptualization, resources, supervision, project administration, funding acquisition; A.T.S.H. conceptualization, resources, supervision, project administration, funding acquisition. All authors have read and agreed to the published version of the manuscript.

Funding

This research was funded by Ministry of Higher Education Malaysia (MOHE) for Fundamental Research Grant Scheme (FRGS) with Project Code: FRGS/1/2020/STG03/USM/02/20, Universiti Sains Malaysia (USM) for Short Term Research Grant with Project Code: 304/PPANTAI/6315453, and Partnership for Observation of the Global Ocean (POGO) Project – South East Asia project for General Regional Awareness of Seagrass by Society (SEAGRASS) with Project Code: POGO-2021-6229.

Institutional Review Board Statement

Not applicable.

Informed Consent Statement

Not applicable.

Data Availability Statement

Currently, no open access dataset is created for this initial finding.

Acknowledgments

This study was supported by the Fundamental Research Grant Scheme (FRGS) from MOHE, Short Term Research Grant from Universiti Sains Malaysia, POGO and SEAGRASS project. Authors would like to thank CEMACS and the Marine Science Laboratory, USM for their field and laboratory support. This study was also conducted in collaboration with the Department of Marine Park Malaysia and the IOC Sub-Commission for the Western Pacific (IOC-WESTPAC).

Conflicts of Interest

The authors declare no conflict of interest. The funders had no role in the design of the study; in the collection, analyses, or interpretation of data; in the writing of the manuscript; or in the decision to publish the results.

References

  1. Ryan, P.G. A brief history of marine litter research. In Marine Anthropogenic Litter; Bergmann, M., Gutow, L., Klages, M., Eds.; Springer: Cham, Switzerland, 2015; pp. 1–25. [Google Scholar] [CrossRef]
  2. van Emmerik, T. Macroplastic research in an era of microplastic. Micropl. Nanopl. 2021, 1, 4. [Google Scholar] [CrossRef]
  3. Andrady, A.L. Microplastics in the marine environment. Mar. Pollut. Bull. 2011, 62, 1596–1605. [Google Scholar] [CrossRef] [PubMed]
  4. Wright, S.L.; Thompson, R.C.; Galloway, T.S. The physical impacts of microplastics on marine organisms: A review. Environ. Pollut. 2013, 178, 483–492. [Google Scholar] [CrossRef] [PubMed]
  5. Gusmão, F.; Di Domenico, M.; Amaral, A.C.Z.; Martínez, A.; Gonzalez, B.C.; Worsaae, K.; da Cunha Lana, P. In situ ingestion of microfibres by meiofauna from sandy beaches. Environ. Pollut. 2016, 216, 584–590. [Google Scholar] [CrossRef]
  6. Lourenço, P.M.; Serra-Gonçalves, C.; Ferreira, J.L.; Catry, T.; Granadeiro, J.P. Plastic and other microfibers in sediments, macroinvertebrates and shorebirds from three intertidal wetlands of southern Europe and west Africa. Environ. Pollut. 2017, 231, 123–133. [Google Scholar] [CrossRef]
  7. Costa, L.L.; Arueira, V.F.; da Costa, M.F.; Di Beneditto, A.P.M.; Zalmon, I.R. Can the Atlantic ghost crab be a potential biomonitor of microplastic pollution of sandy beaches sediment? Mar. Pollut. Bull. 2019, 145, 5–13. [Google Scholar] [CrossRef]
  8. Costa, L.L.; da Costa, M.F.; Zalmon, I.R. Macroinvertebrates as biomonitors of pollutants on natural sandy beaches: Overview and meta-analysis. Environ. Pollut. 2021, 275, 116629. [Google Scholar] [CrossRef]
  9. Krelling, A.P.; Williams, A.T.; Turra, A. Differences in perception and reaction of tourist groups to beach marine debris that can influence a loss of tourism revenue in coastal areas. Mar. Policy 2017, 85, 87–99. [Google Scholar] [CrossRef]
  10. Aarif, K.M.; Nefla, A.; Athira, T.R.; Prasadan, P.K.; Muzaffar, S.B. The costs of migration: Injuries in migratory waterbirds along the west coast of India. Saudi J. Biol. Sci. 2021, 28, 6030–6039. [Google Scholar] [CrossRef]
  11. Jambeck, J.R.; Geyer, R.; Wilcox, C.; Siegler, T.R.; Perryman, M.; Andrady, A.; Law, K.L. Plastic waste inputs from land into the ocean. Science 2015, 34, 768–771. [Google Scholar] [CrossRef]
  12. Auta, H.S.; Emenike, C.U.; Fauziah, S.H. Distribution and importance of microplastics in the marine environment: A review of the sources, fate, effects, and potential solutions. Environ. Int. 2017, 102, 165–176. [Google Scholar] [CrossRef] [PubMed]
  13. Zhang, H. Transport of microplastics in coastal seas. Estuar. Coast. Shelf Sci. 2017, 199, 74–86. [Google Scholar] [CrossRef]
  14. Lebreton, L.; Van Der Zwet, J.; Damsteeg, J.W.; Slat, B.; Andrady, A.; Reisser, J. River plastic emissions to the world’s oceans. Nat. Commun. 2017, 8, 15611. [Google Scholar] [CrossRef]
  15. Mobilik, J.M.; Ling, T.Y.; Husain, M.L.; Hassan, R. Type and quantity of shipborne garbage at selected tropical beaches. Sci. World J. 2016, 2016, 5126951. [Google Scholar] [CrossRef]
  16. Garcés-Ordóñez, O.; Díaz, L.F.E.; Cardoso, R.P.; Muniz, M.C. The impact of tourism on marine litter pollution on Santa Marta beaches, Colombian Caribbean. Mar. Pollut. Bull. 2020, 160, 111558. [Google Scholar] [CrossRef]
  17. Md Amin, R.; Sohaimi, E.S.; Anuar, S.T.; Bachok, Z. Microplastic ingestion by zooplankton in Terengganu coastal waters, southern South China Sea. Mar. Pollut. Bull 2020, 150, 110616. [Google Scholar] [CrossRef]
  18. Lee, J.; Lee, J.; Hong, S.; Hong, S.H.; Shim, W.J.; Eo, S. Characteristics of meso-sized plastic marine debris on 20 beaches in Korea. Mar. Pollut. Bull. 2017, 123, 92–96. [Google Scholar] [CrossRef] [PubMed]
  19. Daniel, D.B.; Thomas, S.N.; Thomson, K.T. Assessment of fishing-related plastic debris along the beaches in Kerala Coast, India. Mar. Pollut. Bull. 2020, 150, 110696. [Google Scholar] [CrossRef]
  20. Tsukada, E.; Fernandes, E.; Vidal, C.; Salla, R.F. Beach morphodynamics and its relationship with the deposition of plastic particles: A preliminary study in southeastern Brazil. Mar. Pollut. Bull. 2021, 172, 112809. [Google Scholar] [CrossRef]
  21. Critchell, K.; Lambrechts, J. Modelling accumulation of marine plastics in the coastal zone; what are the dominant physical processes? Estuar. Coast. Shelf Sci. 2016, 171, 111–122. [Google Scholar] [CrossRef]
  22. TheStar. Malaysia Top Plastic Consumer in Asia, Says WWF. Available online: https://www.thestar.com.my/news/nation/2020/02/17/malaysia-top-plastic-ocean-polluter-in-asia-says-wwf (accessed on 28 September 2022).
  23. World Population Review. Plastic Pollution by Country. 2021. Available online: https://worldpopulationreview.com/country-rankings/plastic-pollution-by-country (accessed on 29 September 2022).
  24. TheStar. Generating More Waste than Ever. Available online: https://www.thestar.com.my/news/nation/2019/07/30/generating-more-waste-than-ever (accessed on 28 September 2022).
  25. The World Bank Group. Market Study for Malaysia: Plastics Circularity Opportunities and Barriers. Available online: https://www.worldbank.org/en/country/malaysia/publication/market-study-for-malaysia-plastics-circularity-opportunities-and-barriers (accessed on 28 September 2022).
  26. WWF. Plastic Packaging in Southeast Asia and China. Available online: https://wwflac.awsassets.panda.org/downloads/wwf_plastic_packaging_in_se_asia_2020_v8_0214_final_.pdf (accessed on 28 September 2022).
  27. Fauziah, S.H.; Rizman-Idid, M.; Cheah, W.; Loh, K.H.; Sharma, S.; NoorMaiza, M.R.; George, M. Marine debris in Malaysia: A review on the pollution intensity and mitigating measures. Mar. Pollut. Bull. 2021, 167, 112258. [Google Scholar] [CrossRef]
  28. Malaysia’s Roadmap Towards Zero Single-Use Plastics 2018–2030. Available online: https://www.moe.gov.my/images/KPM/UKK/2019/06_Jun/Malaysia-Roadmap-Towards-Zero-Single-Use-Plastics-2018-2030.pdf (accessed on 28 September 2022).
  29. TheStar. Malaysia Plastics Sustainability Roadmap 2021–2030 Launched. Available online: https://www.thestar.com.my/news/nation/2021/12/10/malaysia-plastics-sustainability-roadmap-2021-2030-launched (accessed on 29 September 2022).
  30. Ministry of Environment and Water, Malaysia (KASA). Malaysia Plastics Sustainability Roadmap 2021–2030: Catalysing Sustainability and Circularity Towards a New Plastics Economy. Available online: https://kasa.gov.my/resources/malaysia-plastics-sustainability-roadmap-2021-2030/ (accessed on 22 December 2022).
  31. Nurul Nadia, A. Macro and Microplastics Abundance on Beaches of Selected Islands in Peninsular Malaysia. Master’s Thesis, Universiti of Malaya, Kuala Lumpur, Malaysia, 2019. [Google Scholar]
  32. Lim, L.C. Carrying Capacity Assessment of Pulau Payar Marine Park, Malaysia—Bay of Bengal Programme. Available online: https://www.fao.org/3/x5626e/x5626e00.htm (accessed on 14 August 2022).
  33. Fauziah, S.H.; Liyana, I.A.; Agamuthu, P. Plastic debris in the coastal environment: The invincible threat? Abundance of buried plastic debris on Malaysian beaches. Waste Manag. Res. 2015, 33, 812–821. [Google Scholar] [CrossRef] [PubMed]
  34. Lippiatt, S.; Opfer, S.; Arhur, C. Marine Debris Monitoring and Assessment. 2013. Available online: https://marinedebris.noaa.gov/marine-debris-monitoring-and-assessment-recommendations-monitoring-debris-trends-marine-environment (accessed on 13 January 2023).
  35. De Witte, B.; Devriese, L.; Bekaert, K.; Hoffman, S.; Vandermeersch, G.; Cooreman, K.; Robbens, J. Quality assessment of the blue mussel (Mytilus edulis): Comparison between commercial and wild types. Mar. Pollut. Bull. 2014, 85, 146–155. [Google Scholar] [CrossRef] [PubMed]
  36. National Solid Waste Management Department. A Study on Plastic Management in Peninsular Malaysia. Available online: https://jpspn.kpkt.gov.my/resources/index/user_1/Sumber_Rujukan/kajian/JPSPN%20Plastic%20Study%20-%20Final%20Report%20GESB%20-%20Softcopy%20English%20Ed2.pdf (accessed on 28 September 2022).
  37. Lee, J.; Hong, S.; Song, Y.K.; Hong, S.H.; Jang, Y.C.; Jang, M.; Shim, W.J. Relationships among the abundances of plastic debris in different size classes on beaches in South Korea. Mar. Pollut. Bull. 2013, 77, 349–354. [Google Scholar] [CrossRef]
  38. Lee, J.; Lee, J.S.; Jang, Y.C.; Hong, S.Y.; Shim, W.J.; Song, Y.K.; Hong, S. Distribution and size relationships of plastic marine debris on beaches in South Korea. Arch. Environ. Contam. Toxicol. 2015, 69, 288–298. [Google Scholar] [CrossRef] [PubMed]
  39. Crawford, C.B.; Quinn, B. Microplastics, standardization, and spatial distribution. In Microplastic Pollutants; Elsevier Science: Amsterdam, The Netherlands, 2017; pp. 101–130. [Google Scholar]
  40. TuTiempo.net. Climate Alor Star: October 2018. Available online: https://en.tutiempo.net/climate/10-2018/ws-486030.html (accessed on 9 January 2023).
  41. TuTiempo.net. Climate Alor Setar: September 2017. Available online: https://en.tutiempo.net/climate/09-2017/ws-486030.html (accessed on 9 January 2023).
  42. TuTiempo.net. Climate Penang/Bayan Lepas: January 2022. Available online: https://en.tutiempo.net/climate/01-2022/ws-486010.html (accessed on 9 January 2023).
  43. TuTiempo.net. Climate Penang/Bayan Lepas: November 2021. Available online: https://en.tutiempo.net/climate/11-2021/ws-486010.html (accessed on 9 January 2023).
  44. Haarr, M.L.; Westerveld, L.; Fabres, J.; Iversen, K.R.; Busch, K.E.T. A novel GIS-based tool for predicting coastal litter accumulation and optimising coastal cleanup actions. Mar. Pollut. Bull. 2019, 139, 117–126. [Google Scholar] [CrossRef]
  45. Corbau, C.; Buoninsegni, J.; Olivo, E.; Vaccaro, C.; Nardin, W.; Simeoni, U. Understanding through drone image analysis the interactions between geomorphology, vegetation and marine debris along a sandy spit. Mar. Pollut. Bull. 2023, 187, 114515. [Google Scholar] [CrossRef]
  46. Noik, V.J.; Tuah, P.M. A first survey on the abundance of plastics fragments and particles on two sandy beaches in Kuching, Sarawak, Malaysia. IOP Conf. Ser. Mater. Sci. Eng. 2015, 78, 012035. [Google Scholar] [CrossRef]
  47. Azam, R.B.N. A Study of Marine Debris on Beach of Bidong Island, Terengganu. Bachelor’s Thesis, Universiti Malaysia Terengganu, Kuala Terengganu, Malaysia, 2011. [Google Scholar]
  48. Fauziah, S.H.; Nurul, A.A.I. Plastic Debris Pollution on Recreational Beaches: A Malaysian case study. Appl. Mech. Mater. 2015, 768, 804–809. [Google Scholar] [CrossRef]
  49. Browne, M.A.; Galloway, T.S.; Thompson, R.C. Spatial patterns of plastic debris along estuarine shorelines. Environ. Sci. Technol. 2010, 44, 3404–3409. [Google Scholar] [CrossRef]
  50. Forsberg, P.L.; Sous, D.; Stocchino, A.; Chemin, R. Behaviour of plastic litter in nearshore waters: First insights from wind and wave laboratory experiments. Mar. Pollut. Bull. 2020, 153, 111023. [Google Scholar] [CrossRef]
  51. Maritime Institute of Malaysia. The Prosperity of the Straits of Malacca as a Major Maritime Trade Route. Available online: https://www.mima.gov.my/news/the-prosperity-of-the-straits-of-malacca (accessed on 28 September 2022).
  52. Plastics Europe. Plastics—The Facts 2021: An Analysis of European Plastic Production, Demand and Waste Data. Available online: https://plasticseurope.org/wp-content/uploads/2021/12/Plastics-the-Facts-2021-web-final.pdf (accessed on 28 September 2022).
  53. UNEP. Single-Use Plastics: A Roadmap of Sustainability. Available online: https://www.unep.org/resources/report/single-use-plastics-roadmap-sustainability (accessed on 28 September 2022).
  54. Herrera, A.; Asensio, M.; Martínez, I.; Santana, A.; Packard, T.; Gómez, M. Microplastic and tar pollution on three Canary Islands beaches: An annual study. Mar. Pollut. Bull. 2018, 129, 494–502. [Google Scholar] [CrossRef]
  55. Lavers, J.L.; Dicks, L.; Dicks, M.R.; Finger, A. Significant plastic accumulation on the Cocos (Keeling) Islands, Australia. Sci. Rep. 2019, 9, 7102. [Google Scholar] [CrossRef]
  56. Bouwman, H.; Evans, S.W.; Cole, N.; Yive, N.S.C.K.; Kylin, H. The flip-or-flop boutique: Marine debris on the shores of St Brandon’s rock, an isolated tropical atoll in the Indian Ocean. Mar. Environ. Res. 2016, 114, 58–64. [Google Scholar] [CrossRef] [PubMed]
  57. Van Der Mheen, M.; Van Sebille, E.; Pattiaratchi, C. Beaching patterns of plastic debris along the Indian Ocean rim. Ocean Sci. 2020, 16, 1317–1336. [Google Scholar] [CrossRef]
  58. Schott, F.A.; Xie, S.P.; McCreary, J.P., Jr. Indian Ocean circulation and climate variability. Rev. Geophys. 2009, 47, 1–46. [Google Scholar] [CrossRef]
  59. Paul, S.; Chakraborty, A.; Pandey, P.C.; Basu, S.; Satsangi, S.K.; Ravichandran, M. Numerical simulation of Bay of Bengal circulation features from ocean general circulation model. Mar. Geod. 2009, 32, 1–18. [Google Scholar] [CrossRef]
  60. Khairunnisa, A.K.; Fauziah, S.H.; Agamuthu, P. Marine debris composition and abundance: A case study of selected beaches in Port Dickson, Malaysia. Aquat. Ecosyst. Health Manag. 2012, 15, 279–286. [Google Scholar] [CrossRef]
  61. Cooper, D.A.; Corcoran, P.L. Effects of mechanical and chemical processes on the degradation of plastic beach debris on the island of Kauai, Hawaii. Mar. Pollut. Bull. 2010, 60, 650–654. [Google Scholar] [CrossRef] [PubMed]
  62. Song, Y.K.; Hong, S.H.; Jang, M.; Han, G.M.; Jung, S.W.; Shim, W.J. Combined effects of UV exposure duration and mechanical abrasion on microplastic fragmentation by polymer type. Environ. Sci. Technol. 2017, 51, 4368–4376. [Google Scholar] [CrossRef]
  63. Garello, N.; Blettler, M.C.; Espínola, L.A.; Wantzen, K.M.; González-Fernández, D.; Rodrigues, S. The role of hydrodynamic fluctuations and wind intensity on the distribution of plastic debris on the sandy beaches of Paraná River, Argentina. Environ. Pollut. 2021, 291, 118168. [Google Scholar] [CrossRef] [PubMed]
  64. Taïbi, N.E.; Bentaallah, M.E.A.; Alomar, C.; Compa, M.; Deudero, S. Micro-and macro-plastics in beach sediment of the Algerian western coast: First data on distribution, characterization, and source. Mar. Pollut. Bull. 2021, 165, 112168. [Google Scholar] [CrossRef]
  65. Lincoln, S.; Andrews, B.; Birchenough, S.N.; Chowdhury, P.; Engelhard, G.H.; Harrod, O.; Townhill, B.L. Marine litter and climate change: Inextricably connected threats to the world’s oceans. Sci. Total Environ. 2022, 837, 155709. [Google Scholar] [CrossRef] [PubMed]
  66. Cheung, P.K.; Cheung, L.T.O.; Fok, L. Seasonal variation in the abundance of marine plastic debris in the estuary of a subtropical macro-scale drainage basin in South China. Sci. Total Environ. 2016, 562, 658–665. [Google Scholar] [CrossRef] [PubMed]
  67. Odli, Z.S.M.; Abdullah, A.L.; Saad, F.N.M.; Fadzillah, N.S.A. The relationship between land use and marine litter at Kuala Perlis coastal area. IOP Conf. Ser. Earth Environ. Sci. 2020, 476, 012109. [Google Scholar] [CrossRef]
  68. Agamuthu, P.; Fauziah, S.H.; Khairunnisa, A.K. Marine Debris on Selected Malaysian Beaches, Impacts of Human Ignorance. In Proceedings of the 10th Expert Meeting on Solid Waste Management in Asia and Pacific Islands, Tottori, Japan, 20–22 February 2012. [Google Scholar]
  69. Khairunnisa, A.K. Solid Waste Debris Management on Selected Beaches in Malaysia. Master’s Thesis, University of Malaya, Kuala Lumpur, Malaysia, 2019. [Google Scholar]
  70. Kadir, A.A.; Hasni, A.F.; Sarani, N.A. Marine debris composition in Batupahat, Johor: A comparison between Sungai Lurus and Minyakbeku beaches. ARPN J. Eng. Appl. Sci. 2015, 10, 6553–6557. [Google Scholar]
  71. Mobilik, J.M.; Ling, T.Y.; Lokman, H.M.; Ruhana, H. Seasonal trends in abundance and composition of marine debris in selected public beaches in Peninsular Malaysia. AIP Conf. Proc. 2015, 1678, 020020. [Google Scholar] [CrossRef]
  72. Chong, J.Y.; Kannan, N. Solid waste transportation through ocean currents: Marine debris sightings and their waste quantification at Port Dickson beaches, Peninsular Malaysia. EnvironmentAsia 2016, 9, 39–47. [Google Scholar] [CrossRef]
  73. Jang, Y.C.; Lee, J.; Hong, S.; Lee, J.S.; Shim, W.J.; Song, Y.K. Sources of plastic marine debris on beaches of Korea: More from the ocean than the land. Ocean Sci. 2014, 49, 151–162. [Google Scholar] [CrossRef]
  74. Fok, L.; Cheung, P.K.; Tang, G.; Li, W.C. Size distribution of stranded small plastic debris on the coast of Guangdong, South China. Environ. Pollut. 2017, 220, 407–412. [Google Scholar] [CrossRef]
  75. Kusui, T.; Noda, M. International survey on the distribution of stranded and buried litter on beaches along the Sea of Japan. Mar. Pollut. Bull. 2003, 47, 175–179. [Google Scholar] [CrossRef] [PubMed]
  76. Mazarrasa, I.; Puente, A.; Núñez, P.; García, A.; Abascal, A.J.; Juanes, J.A. Assessing the risk of marine litter accumulation in estuarine habitats. Mar. Pollut. Bull. 2019, 144, 117–128. [Google Scholar] [CrossRef] [PubMed]
  77. Huang, W.; Chen, M.; Song, B.; Deng, J.; Shen, M.; Chen, Q.; Liang, J. Microplastics in the coral reefs and their potential impacts on corals: A mini-review. Sci. Total Environ. 2021, 762, 143112. [Google Scholar] [CrossRef] [PubMed]
  78. Van Cauwenberghe, L.; Devriese, L.; Galgani, F.; Robbens, J.; Janssen, C.R. Microplastics in sediments: A review of techniques, occurrence and effects. Mar. Environ. Res. 2015, 111, 5–17. [Google Scholar] [CrossRef]
  79. Lamb, J.B.; Willis, B.L.; Fiorenza, E.A.; Couch, C.S.; Howard, R.; Rader, D.N.; Harvell, C.D. Plastic waste associated with disease on coral reefs. Science 2018, 359, 460–462. [Google Scholar] [CrossRef]
  80. de Oliveira Soares, M.; Matos, E.; Lucas, C.; Rizzo, L.; Allcock, L.; Rossi, S. Microplastics in corals: An emergent threat. Mar. Pollut. Bull. 2020, 161, 111810. [Google Scholar] [CrossRef]
  81. Sussarellu, R.; Suquet, M.; Thomas, Y.; Lambert, C.; Fabioux, C.; Pernet, M.E.J.; Huvet, A. Oyster reproduction is affected by exposure to polystyrene microplastics. Proc. Natl. Acad. Sci. USA 2016, 113, 2430–2435. [Google Scholar] [CrossRef]
  82. Loctier, D. Reducing Plastic in Fishing and Aquaculture: What Alternatives to Protect Our Oceans? 2021. Available online: https://www.euronews.com/green/2021/04/27/alternatives-to-plastic-help-lower-pollution-in-the-oceans (accessed on 22 December 2022).
  83. United Nations Environment Programme (UNEP). Waste Segregation at Source: Solving Plastic Pollution in Penang—Malaysia Case Study. Available online: https://wedocs.unep.org/20.500.11822/40344 (accessed on 22 December 2022).
  84. Chen, H.L.; Nath, T.K.; Chong, S.; Foo, V.; Gibbins, C.; Lechner, A.M. The plastic waste problem in Malaysia: Management, recycling and disposal of local and global plastic waste. SN Appl. Sci. 2021, 3, 437. [Google Scholar] [CrossRef]
Figure 1. Map of Peninsular Malaysia (a) showing the sampling location in (b) region with the location of Pulau Lembu, Pulau Songsong, Teluk Aling, and Pulau Gazumbo.
Jmse 11 01057 g001
Figure 2. Example of sampling layout at the beach of the study site (not to scale).
Jmse 11 01057 g002
Figure 3. The abundance and distribution of macroplastics collected at each transect zones of the study site in g/m2.
Jmse 11 01057 g003
Figure 4. The abundance and distribution of different forms of mesoplastic debris collected from each transect zone of the study site by items/m2. An example of the form of mesoplastics is shown on the right side of the corresponding graph.
Jmse 11 01057 g004
Figure 5. The average abundance and distribution of macro- (a) and mesoplastics (b) debris collected from the study sites, by g/m2 and items/m2, respectively.
Jmse 11 01057 g005
Figure 6. The abundance and distribution of macroplastic debris found at the sampling sites according to the plastic market segment of Malaysia by number of items.
Jmse 11 01057 g006
Figure 7. Example of packaging plastic debris collected from Pulau Gazumbo (a) and Teluk Aling (b) and agriculture debris collected from Teluk Aling (c).
Jmse 11 01057 g007
Figure 8. Relationship between rainfall occurrences in the respective sampling month of the study site and the mass of macroplastics per area (a) and number of mesoplastics per area (b) collected from the study sites.
Jmse 11 01057 g008
Table 1. Study site description and detail of sampling.
Study SiteDescriptionUse of Beach and
Surrounding Area
Pulau LembuLocated in a marine parkRecreational
Pulau SongsongLocated 7.9 west off to the nearest land of Yan District, KedahRecreational
Teluk AlingLocated in
Penang national park
Recreational beach; fishing; shipping
Pulau GazumboLocated at the South of
Penang Straits between the residential and industrial area
Recreational beach
Table 2. Details of sampling at the study sites.
Study SiteSampling
Period
Length of the
Transect Line
(m)
Width of the
Transect Line
(m)
Pulau LembuOctober 2018301
Pulau SongsongSeptember 20171001
Teluk AlingJanuary 2022501
Pulau GazumboNovember 2021501
Table 3. Beach cleanliness index established for the study sites.
Study Sites
ElementPulau LembuPulau
Songsong
Teluk AlingPulau
Gazumbo
BC0.081.152.370.1
AB0110
AA1332
NF2222
BCI Index−2.92−2.85−1.63−3.99
Disclaimer/Publisher’s Note: The statements, opinions and data contained in all publications are solely those of the individual author(s) and contributor(s) and not of MDPI and/or the editor(s). MDPI and/or the editor(s) disclaim responsibility for any injury to people or property resulting from any ideas, methods, instructions or products referred to in the content.

