
Compressive Damage and Failure Behavior of Plain-Woven GFRP Sandwich Composite L-Joints of Ships: Experiment and Simulation


Abstract
1. Introduction
2. Tests
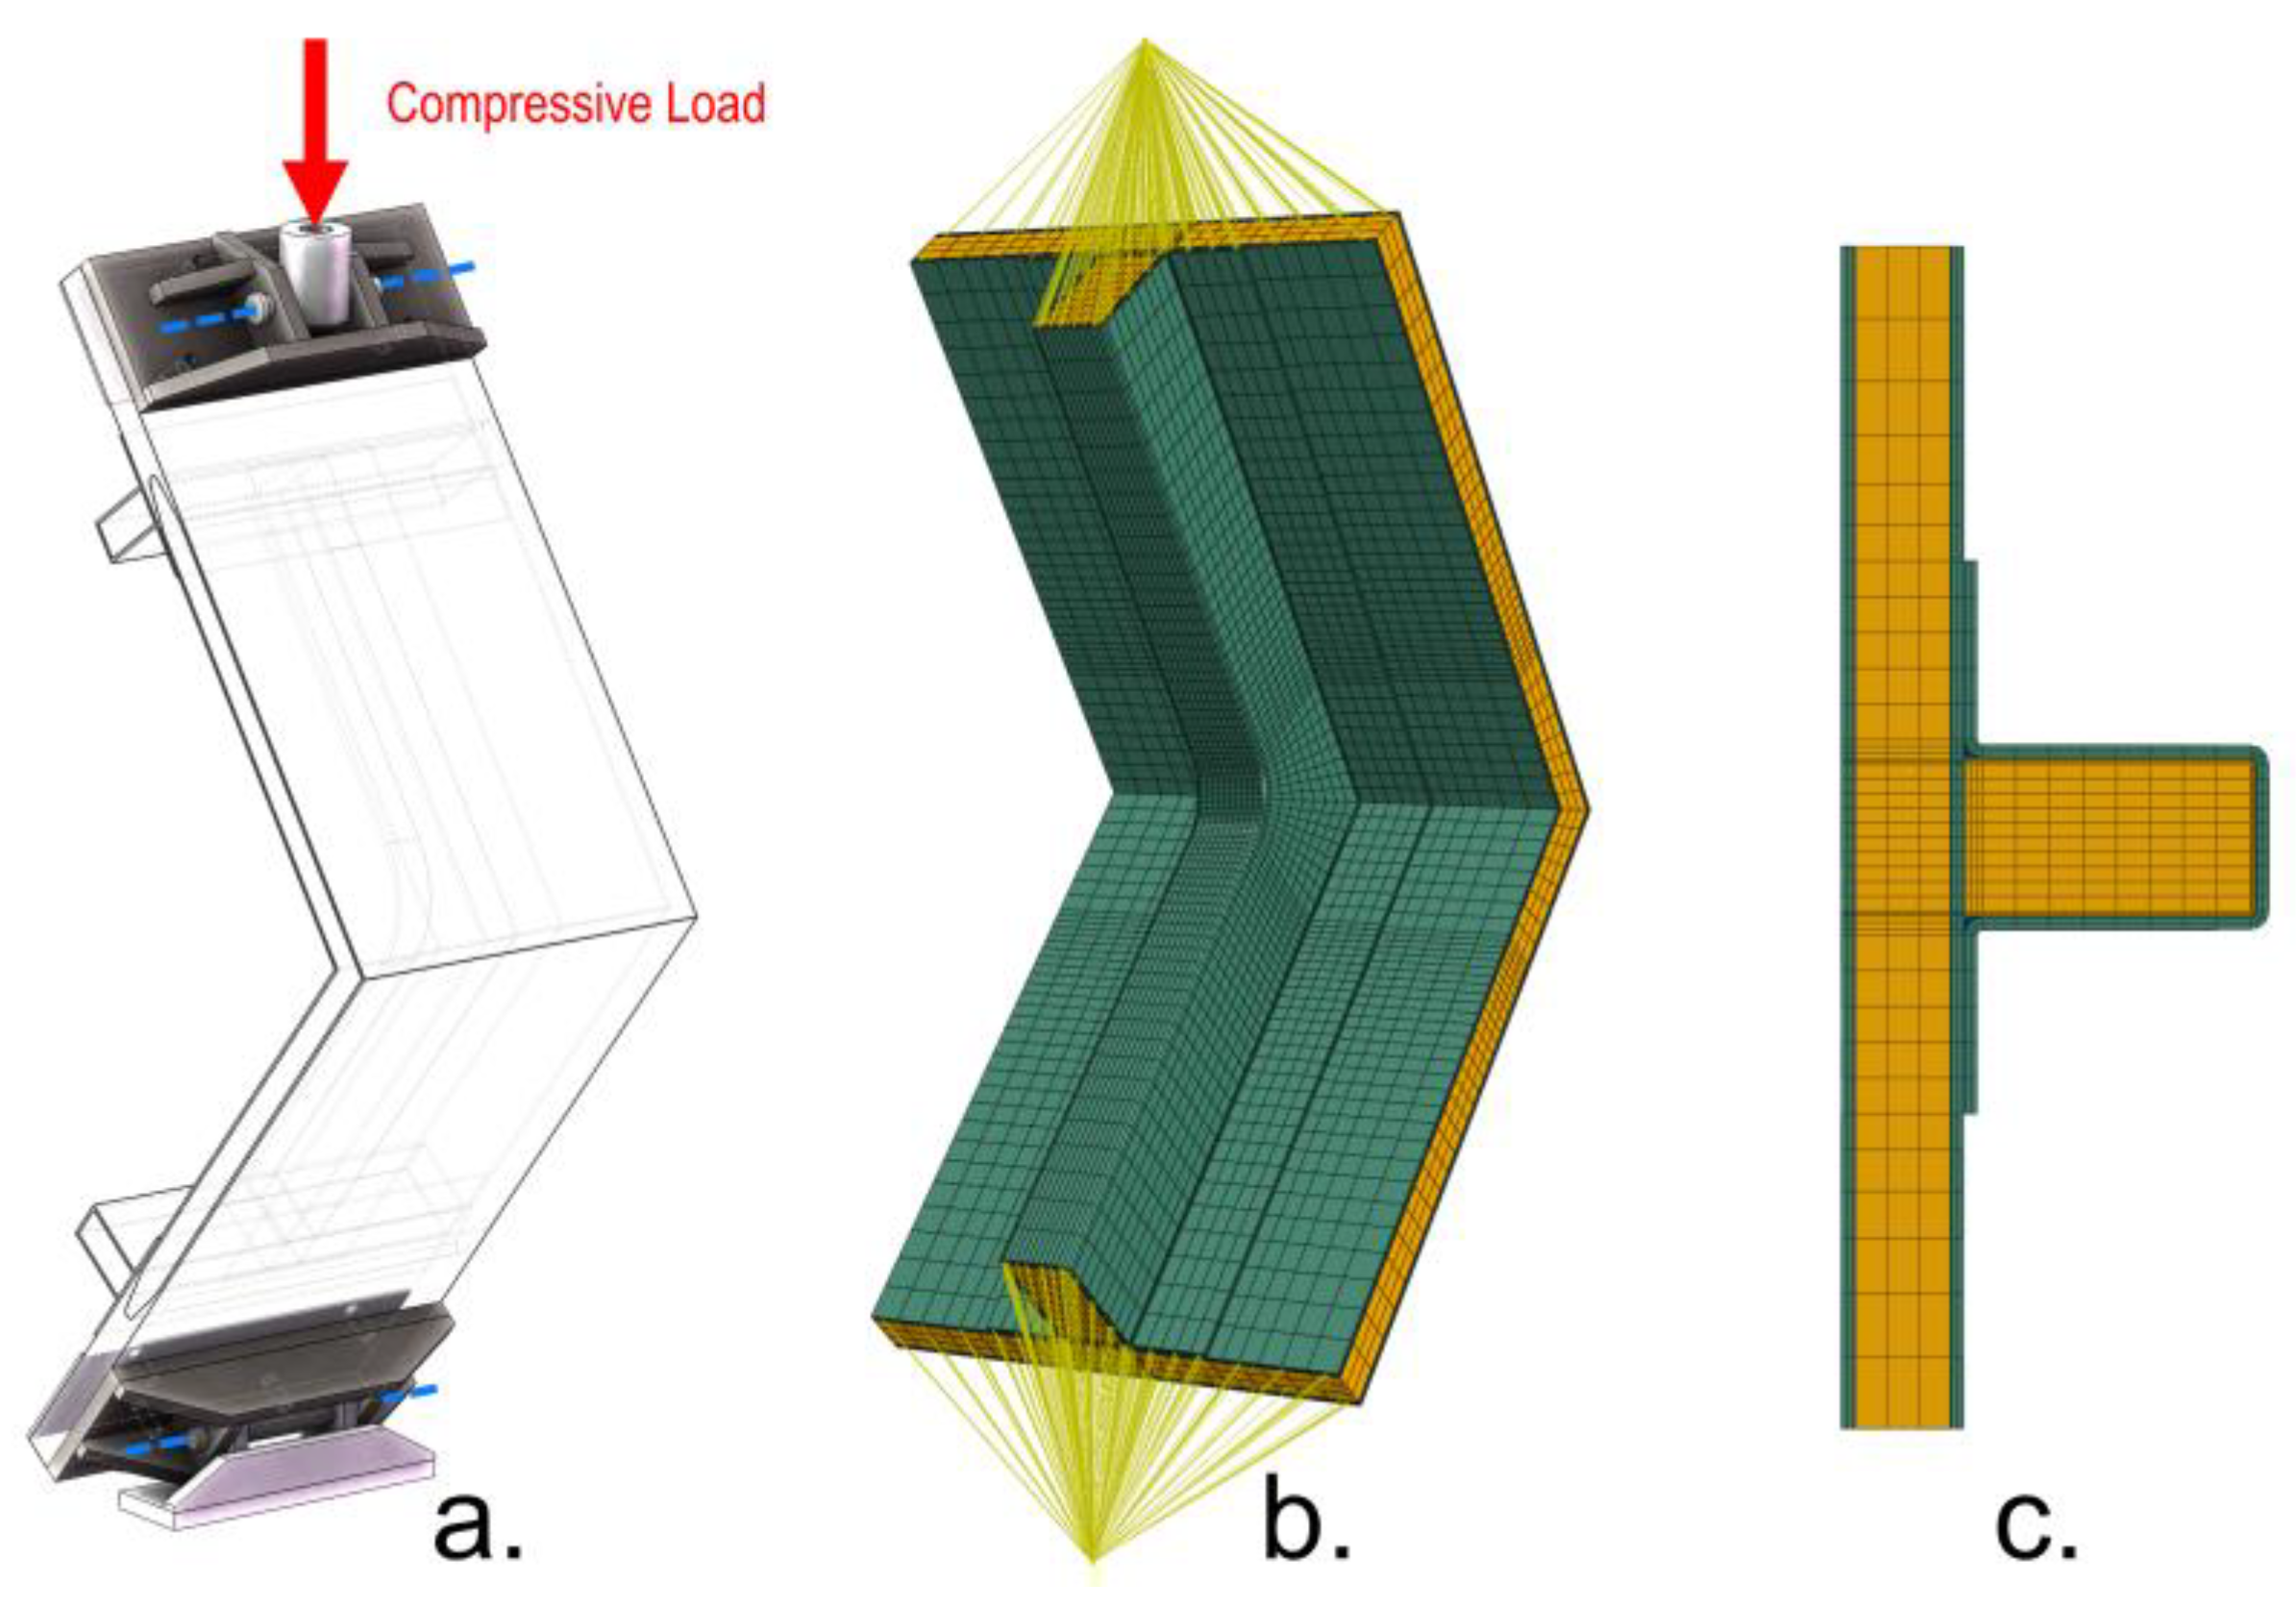
2.1. L-Joint Specifications and Test Setup
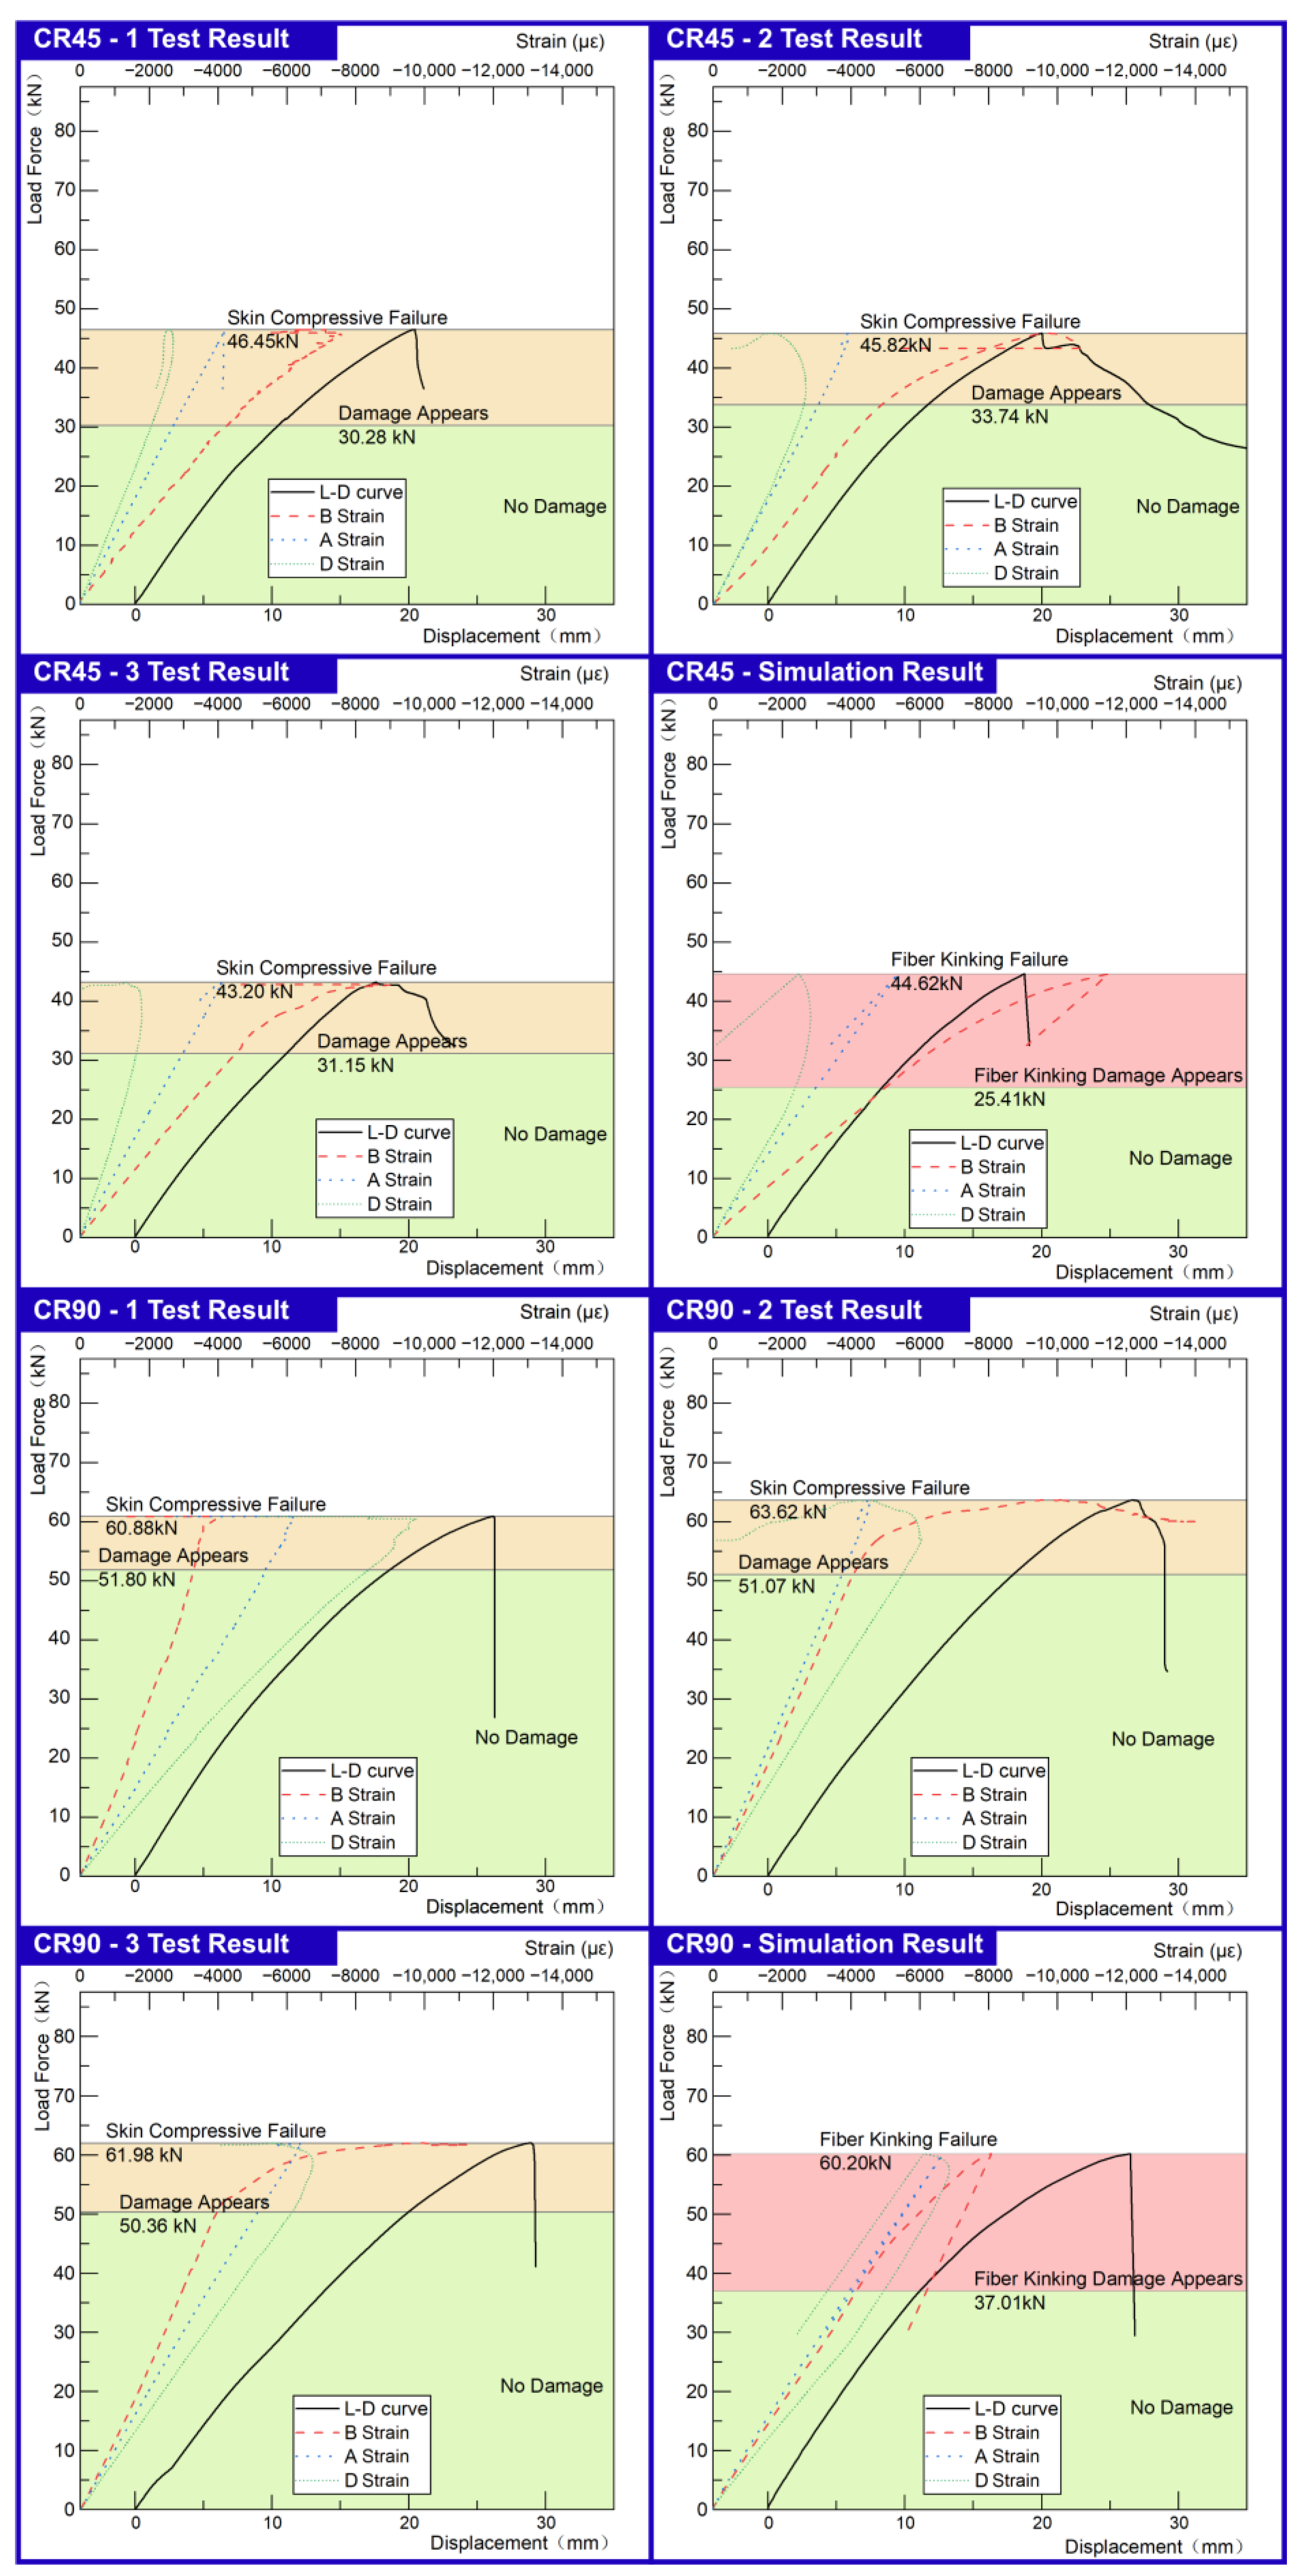
2.2. Test Results
2.3. Test Data Analysis
3. Damage Criterion
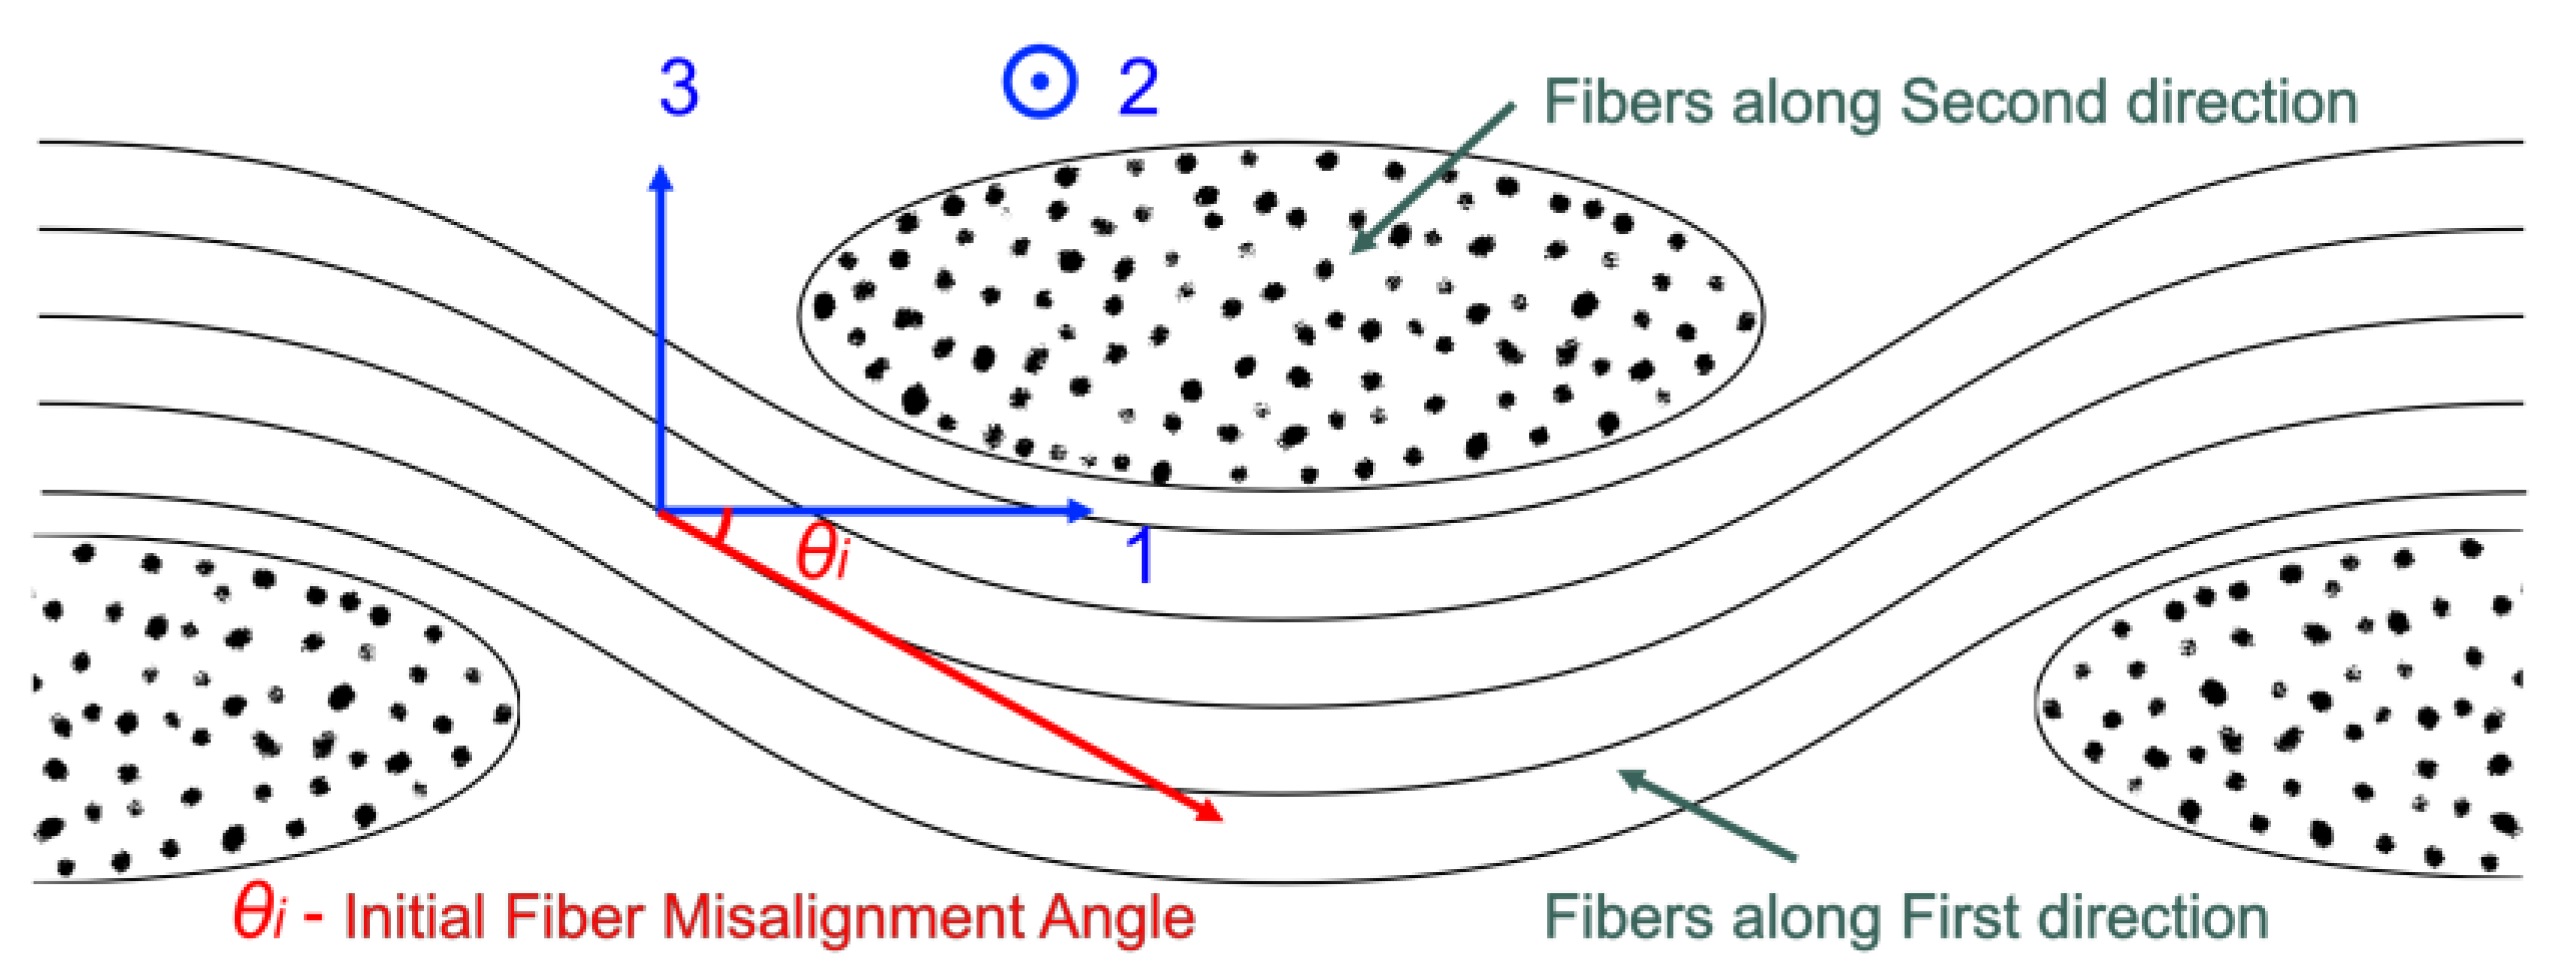
3.1. Fiber Kinking
3.2. Fiber Kinking Damage Criterion for Plain-Woven Fabrics
4. Material Degradation Model
4.1. Damage Variables and the Damaged Stiffness Matrix
4.2. Damage Evolution
5. Simulation Setup
6. Results and Analysis
6.1. Comparison between Simulation and Test Results
6.2. Simulation Results Comparison between Theories
6.3. Discussion
7. Conclusions
Author Contributions
Funding
Data Availability Statement
Conflicts of Interest
References
- Mouritz, A.P.; Gellert, E.; Burchill, P.; Challis, K. Review of advanced composite structures for naval ships and submarines. Compos. Struct. 2001, 53, 21–42. [Google Scholar] [CrossRef]
- Qin, K.; Jin, H.; Yan, R.; Xu, L.; Hu, Y. Ultimate bearing force and failure process of corner joint under compressive load. In Proceedings of the International Offshore and Polar Engineering Conference, San Francisco, CA, USA, 25–30 June 2017. [Google Scholar]
- Qiu, J.; Zhu, X.; Mei, Z. Bending Load-bearing capacity and damage mechanism of composite sandwich L-joint with stiffeners. J. Nav. Univ. Eng. 2015, 3, 23–27. [Google Scholar]
- Li, H.; Tu, S.; Liu, Y.; Lu, X.; Zhu, X. Mechanical properties of L-joint with composite sandwich structure. Compos. Struct. 2019, 217, 165–174. [Google Scholar] [CrossRef]
- Zeng, H.; Yan, R.; Xu, L. Failure prediction of composite sandwich L-joint under bending. Compos. Struct. 2018, 197, 54–62. [Google Scholar] [CrossRef]
- Shen, W.; Luo, B.; Yan, R.; Zeng, H.; Xu, L. The mechanical behavior of sandwich composite joints for ship structures. Ocean Eng. 2017, 144, 78–89. [Google Scholar] [CrossRef]
- Hashin, Z.; Rotem, A. A Fatigue Failure Criterion for Fiber Reinforced Materials. Compos. Mater. 1973, 7, 448. [Google Scholar] [CrossRef]
- Hashin, Z. Failure Criteria for Unidirectional Fiber Composites. J. Appl. Mech. 1980, 47, 329–334. [Google Scholar] [CrossRef]
- Nassiraei, H.; Rezadoost, P. Static capacity of tubular X-joints reinforced with fiber reinforced polymer subjected to compressive load. Eng. Struct. 2021, 236, 112041. [Google Scholar] [CrossRef]
- Hinton, M.J.; Kaddour, A.S.; Soden, P.D. The World-Wide Failure Exercise: Its Origin, Concept and Content; Elsevier Ltd.: Amsterdam, The Netherlands, 2004. [Google Scholar]
- Kaddour, A.; Hinton, M.; Smith, P.; Li, S. The background to the third world-wide failure exercise. J. Compos. Mater. 2013, 47, 2417–2426. [Google Scholar] [CrossRef]
- Soden, P.D.; Kaddour, A.S.; Hinton], M.J. Recommendations for designers and researchers resulting from the world-wide failure exercise. Compos. Sci. Technol. 2004, 64, 589–604. [Google Scholar] [CrossRef]
- Shokrieh, M.; Poon, C.; Lessard, L. Three-Dimensional Progressive Failure Analysis of Pin/Bolt Loaded Composite Laminates. In Proceedings of the 83rd Meeting of the AGARD Structures and Materials Panel, Florence, Italy, 2–3 September 1996. [Google Scholar]
- Sun, C.T.; Quinn, B.J.; Tao, J. Comparative Evaluation of Failure Analysis Methods for Composite laminates; The National Academies of Sciences: Washington, DC, USA, 1996. [Google Scholar]
- Jadee, K.J. Progressive Failure Analysis and Failure Map into Plain Weave Glass Fibre Reinforced Polymer Bolted Joint. Am. J. Mater. Sci. Eng. 2015, 3, 21–28. [Google Scholar]
- Jebri, L.; Abbassi, F.; Demiral, M.; Soula, M.; Ahmad, F. Experimental and numerical analysis of progressive damage and failure behavior of carbon Woven-PPS. Compos. Struct. 2020, 243, 112234. [Google Scholar] [CrossRef]
- Davila, C.G.; Camanho, P.P.; Rose, C.A. Failure Criteria for FRP Laminates. J. Compos. Mater. 2005, 39, 323–345. [Google Scholar] [CrossRef]
- John, A. Nairn Fracture Mechanics of Unidirectional Composites. J. Reinf. Plast. Compos. 2016, 9, 91–101. [Google Scholar]
- Pinho, S.T. Modelling Failure of Laminated Composites Using Physically-Based Failure Models. Ph.D. Thesis, Imperial College, London, UK, 2005. [Google Scholar]
- Pinho, S.T.; Iannucci, L.; Robinson, P. Physically-based failure models and criteria for laminated fibre-reinforced composites with emphasis on fibre kinking: Part I: Development. Compos. Part A Appl. Sci. Manuf. 2006, 37, 63–73. [Google Scholar] [CrossRef]
- Johnson, W.; Masters, J.; O’Brien, T.; Blackketter, D.; Walrath, D.; Hansen, A. Modeling Damage in a Plain Weave Fabric-Reinforced Composite Material. J. Compos. Technol. Res. 1993, 15, 136. [Google Scholar] [CrossRef]
- Matzenmiller, A.; Lubliner, J.; Taylor, R.L. A constitutive model for anisotropic damage in fiber-composites. Mech. Mater. 1995, 20, 125–152. [Google Scholar] [CrossRef]
- Mao, J.Z.; Sun, X.S.; Ridha, M.; Tan, V.B.C.; Tay, T.E. A Modeling Approach across Length Scales for Progressive Failure Analysis of Woven Composites. Appl. Compos. Mater. 2013, 20, 213–231. [Google Scholar] [CrossRef]
- Warren, K.C.; Lopez-Anido, R.A.; Vel, S.S.; Bayraktar, H.H. Progressive failure analysis of three-dimensional woven carbon composites in single-bolt, double-shear bearing. Compos. Part B Eng. 2016, 84, 266–276. [Google Scholar] [CrossRef]
- Camanho, P.P.; Matthews, F.L. A Progressive Damage Model for Mechanically Fastened Joints in Composite Laminates. J. Compos. Mater. 1999, 33, 2248–2280. [Google Scholar] [CrossRef]
- Lapczyk, I.; Hurtado, J.A. Progressive damage modeling in fiber-reinforced materials. Compos. Part A Appl. Sci. Manuf. 2007, 38, 2333–2341. [Google Scholar] [CrossRef]
- Maimí, P.; Camanho, P.P.; Mayugo, J.A.; Dávila, C.G. A continuum damage model for composite laminates: Part I–Constitutive model. Mech. Mater. 2007, 39, 897–908. [Google Scholar] [CrossRef]
- Maimí, P.; Camanho, P.P.; Mayugo, J.A.; Dávila, C.G. A continuum damage model for composite laminates: Part II–Computational implementation and validation. Mech. Mater. 2007, 39, 909–919. [Google Scholar] [CrossRef]
- Kang, H.; Shan, Z.; Zang, Y.; Liu, F. Progressive damage analysis and strength properties of fiber-bar composites reinforced by three-dimensional weaving under uniaxial tension. Compos. Struct. 2016, 141, 264–281. [Google Scholar] [CrossRef]
- Fang, G.; Liang, J. A review of numerical modeling of three-dimensional braided textile composites. J. Compos. Mater. 2011, 45, 2415–2436. [Google Scholar] [CrossRef]
- Kai, Q.; Renjun, Y.; Wei, S.; Yaoyu, H. Research on the tension damage behavior of sandwich composite L-joints: Experiment and simulation. Compos. Struct. 2020, 232, 111566. [Google Scholar] [CrossRef]
- Kai, Q.; Renjun, Y.; Mingen, C.; Haiyan, Z. Failure mode shift of sandwich composite L-Joint for ship structures under tension load. Ocean Eng. 2020, 214, 107863. [Google Scholar] [CrossRef]
- Chen, B. PVC Foam Sandwich of Carbon Fiber/Epoxy Sandwich panel of Low Velocity Impact Numerical Simulation. Master’s Thesis, North University of China, Taiyuan, China, 2016. [Google Scholar]
- Maio, U.D.; Greco, F.; Leonetti, L.; Pranno, A.; Sgambitterra, G. Nonlinear analysis of microscopic instabilities in fiber-reinforced composite materials. Procedia Struct. Integr. 2020, 25, 400–412. [Google Scholar] [CrossRef]
- Schultheisz, C.R.; Waas, A.M. Compressive failure of composites, part I: Testing and micromechanical theories. Prog. Aerosp. Sci. 1996, 32, 1–42. [Google Scholar] [CrossRef]
- Hapke, J.; Gehrig, F.; Huber, N.; Schulte, K.; Lilleodden, E.T. Compressive failure of UD-CFRP containing void defects: In situ SEM microanalysis. Compos. Sci. Technol. 2011, 71, 1242–1249. [Google Scholar] [CrossRef]
- Rosen, W. Mechanics of composite strengthening. Fiber Compos. Mater. 1965, 72, 74. [Google Scholar]
- Kabiri Ataabadi, A.; Hosseini-Toudeshky, H.; Ziaei Rad, S. Experimental and analytical study on fiber-kinking failure mode of laminated composites. Compos. Part B Eng. 2014, 61, 84–93. [Google Scholar] [CrossRef]
- Kabiri Ataabadi, A.; Ziaei-Rad, S.; Hosseini-Toudeshky, H. An Improved Model for Fiber Kinking Analysis of Unidirectional Laminated Composites. Appl. Compos. Mater. 2011, 18, 175–196. [Google Scholar] [CrossRef]
- Puck, A.; Schürmann, H. Failure analysis of FRP laminates by means of physically based phenomenological models. Compos. Sci. Technol. 1998, 62, 1633–1662. [Google Scholar] [CrossRef]
- Bishara, M.; Rolfes, R.; Allix, O. Revealing complex aspects of compressive failure of polymer composites–Part I: Fiber kinking at microscale. Compos. Struct. 2017, 169, 105–115. [Google Scholar] [CrossRef]
- Opelt, C.V.; Cândido, G.M.; Rezende, M.C. Compressive failure of fiber reinforced polymer composites–A fractographic study of the compression failure modes. Mater. Today Commun. 2018, 15, 218–227. [Google Scholar] [CrossRef]
- Toribio, M.G.; Spearing, S.M. Compressive response of notched glass-fiber epoxy/honeycomb sandwich panels. Compos. Part A Appl. Sci. Manuf. 2001, 32, 859–870. [Google Scholar] [CrossRef]
- Khan, A.S.; Colak, O.U.; Centala, P. Compressive failure strengths and modes of woven S2-glass reinforced polyester due to quasi-static and dynamic loading. Int. J. Plast. 2002, 18, 1337–1357. [Google Scholar] [CrossRef]
- Camanho, P.P.; Davila, C.G.; de Moura, M.F. Numerical Simulation of Mixed-Mode Progressive Delamination in Composite Materials. J. Compos. Mater. 2003, 37, 1415–1438. [Google Scholar] [CrossRef]
- Camanho, P.P. Mixed-Mode Decohesion Finite Elements for the Simulation of Delamination in Composite Materials. Compos. Mater. 2002, 43, 211737. [Google Scholar]


| Material Properties for pw-GFRP Skin (Material Data are Provided by the Manufacturer, Xianning Haiwei Composite Materials Co., Ltd.) | ||
| Elastic Modulus | Fiber Directions | Layup Direction |
| Shear Modulus | ||
| Poisson’s Ratio | ||
| Axile Strength | ||
| Shear Strength | ||
| Fracture Energy | ||
| Damage Variable | ||
| Material Properties for H100 PVC Foam (Material data are acquired through sample tests.) | ||
| Engineering Properties | Elastic Modulus | Poisson’s Ratio |
| Crushable Foam | Compressive Yield Strength Ratio k | Hydrostatic Compressive Yield Strength Ratio kt |
| where is the initial yield stress in uniaxial compression; is the initial yield stress in hydrostatic compression. Hydrostatic compression tests are difficult to conduct. Here k takes the value of 1.625 by referring to this article [33]. | where Pt is the yield strength in hydrostatic tension; = 1.172 MPa is acquired from material tests. The value of Pt and are difficult to acquire. Therefore kt is estimated using | |
| Volumetric Hardening | ||
| Specimen 1 | Specimen 2 | Specimen 3 | Mean | Std. Deviation | |
|---|---|---|---|---|---|
| CR45 Damage Observed | 30.28 | 33.74 | 31.15 | 31.72 | 1.800 |
| CR45 Ultimate Strength | 46.45 | 45.82 | 43.2 | 45.16 | 1.724 |
| CR90 Damage Observed | 51.8 | 51.07 | 56.36 | 53.08 | 2.867 |
| CR90 Ultimate Strength | 60.88 | 63.62 | 61.98 | 62.16 | 1.379 |
Disclaimer/Publisher’s Note: The statements, opinions and data contained in all publications are solely those of the individual author(s) and contributor(s) and not of MDPI and/or the editor(s). MDPI and/or the editor(s) disclaim responsibility for any injury to people or property resulting from any ideas, methods, instructions or products referred to in the content. |
© 2023 by the authors. Licensee MDPI, Basel, Switzerland. This article is an open access article distributed under the terms and conditions of the Creative Commons Attribution (CC BY) license (https://creativecommons.org/licenses/by/4.0/).
Share and Cite
Qin, K.; Yan, R.; Shen, W.; Gui, S. Compressive Damage and Failure Behavior of Plain-Woven GFRP Sandwich Composite L-Joints of Ships: Experiment and Simulation. J. Mar. Sci. Eng. 2023, 11, 1056. https://doi.org/10.3390/jmse11051056
Qin K, Yan R, Shen W, Gui S. Compressive Damage and Failure Behavior of Plain-Woven GFRP Sandwich Composite L-Joints of Ships: Experiment and Simulation. Journal of Marine Science and Engineering. 2023; 11(5):1056. https://doi.org/10.3390/jmse11051056
Chicago/Turabian StyleQin, Kai, Renjun Yan, Wei Shen, and Siyuan Gui. 2023. "Compressive Damage and Failure Behavior of Plain-Woven GFRP Sandwich Composite L-Joints of Ships: Experiment and Simulation" Journal of Marine Science and Engineering 11, no. 5: 1056. https://doi.org/10.3390/jmse11051056
APA StyleQin, K., Yan, R., Shen, W., & Gui, S. (2023). Compressive Damage and Failure Behavior of Plain-Woven GFRP Sandwich Composite L-Joints of Ships: Experiment and Simulation. Journal of Marine Science and Engineering, 11(5), 1056. https://doi.org/10.3390/jmse11051056