Article

Effects of Acute High-Temperature Stress on Physical Responses of Yellowfin Tuna (Thunnus albacares)

1
College of Fisheries and Life, Shanghai Ocean University, Shanghai 201306, China
2
Key Laboratory of Efficient Utilization and Processing of Marine Fishery Resources of Hainan Province, Sanya Tropical Fisheries Research Institute, Sanya 572018, China
3
South China Sea Fisheries Research Institute, Chinese Academy of Fishery Sciences, Guangzhou 510300, China
4
College of Science and Engineering, Flinders University, Adelaide 5001, Australia
5
National Marine Environmental Center, Dalian 116023, China
*
Authors to whom correspondence should be addressed.
These authors contributed equally to this work.
J. Mar. Sci. Eng. 2022, 10(12), 1857; https://doi.org/10.3390/jmse10121857
Submission received: 3 November 2022 / Revised: 21 November 2022 / Accepted: 24 November 2022 / Published: 2 December 2022
(This article belongs to the Special Issue New Techniques in Marine Aquaculture)

Abstract

:
To understand the physiological reactions of juvenile yellowfin tuna (Thunnus albacares) under acute high-temperature stress, this study measured the changes in biochemical indexes of serum, liver, gill, and muscle of yellowfin tuna under acute high-temperature stress (HT, 34 °C) and a control group (28 °C) for 0 h and 6 h, 24 h and 48 h. The rising speed of water temperature in the HT group was 2 °C/h and the timing started when the temperature reached 34 °C. In the HT group, there was no significant difference between the four adjacent times in cortisol and lactic acid concentration. Serum triglyceride, cholesterol, and alkaline phosphatase concentration were significantly different from the four adjacent times. The superoxide dismutase (SOD) activity in the liver and gills increased at 6 h and 24 h, and the gills and liver had antioxidant reactions in a short time. The malondialdehyde (MDA) concentration in the gills changed significantly at 6 h, while that in the liver did not change significantly. The gills were more sensitive to temperature stress than the liver and muscle. Acute high-temperature stress affected yellowfin tuna’s antioxidant enzymes and metabolic indexes, resulting negative trend in physiological indexes, indicating that yellowfin tuna juveniles are susceptible to elevated temperature.

1. Introduction

Fish often live in various water environments. It is a significant physiological process for fish to adjust to environmental pressure. Temperature change is one of the most common environmental changes, which is considered the main abiotic factor affecting aquatic animals [1]. At present, there are many related studies on the impact of temperature on fish, including killifish (Oryzias latipes) [2], sardine (Sardine pilchardus) [3], grass carp (Ctenophryngodon Idella) [4], black head minnow (Fathead minnow) [5]. The change in water temperature can lead to changes in the immune system, metabolism, oxidative stress, and other physiological changes to adjust to the environment [6,7,8,9]. Temperature fluctuations cause physiological changes in fish that generally begin by causing stress and then metabolic rates change [1]. Metabolic changes cause the production of reactive oxygen species [10]. Excessive reactive oxygen species will damage DNA, protein, and lipids [11], resulting in oxidative damage. At the same time, temperature also affects fish feeding and digestive processes, thus affecting their metabolism [12]. Unsuitable water environment temperature also leads to slow growth and poor appetite of fish. Therefore, studying the impact of temperature on the physical responses in fish is crucial.
The temperature change can cause stress, composed of components characterized by sympathetic nerve activation and the secretion of adrenaline and cortisol [13]. The second stage is the increase in plasma glucose and the disorder of osmotic pressure regulation [13]. Cortisol (COR) is a steroid hormone [14], which has many biological activities, including maintaining osmotic pressure, regulating blood glucose, and inhibiting immunity [15]. Fish can also adapt to temperature changes by changing the superoxide dismutase (SOD) activity and then influencing the content of malondialdehyde (MDA) [16]. SOD is an important antioxidant enzyme that catalyzes the disproportionation of free superoxide anion radicals to hydrogen peroxide, which is then converted into water and oxygen by catalase or glutathione peroxidase [17]. Elevated MDA levels are an indicator of lipid peroxidation, which results from oxidative stress damage caused by exposure of fish to environmental changes or pollutants [18]. SOD can alleviate the oxidative damage caused by MDA produced by lipid peroxidation. Heat stress can also lead to significant changes in the metabolism-related indicators of fish, such as triglyceride, cholesterol [19] and plasma components calcium and magnesium, alanine aminotransferase (ALT), and alkaline phosphatase (ALP) [20].
Tuna is a highly demanded marine fish. Its back muscle contains 26.2% crude protein and 0.2% fat. It has rich nutrition [21]. Additionally, it is one of the most important economic fish in the world [22,23]. Tuna products are exported to more than 60 countries worldwide, of which three major markets are Japan, the European Union, and the United States [24]. In the 50 years from 1950 to 2000, the total catch of commercial tuna stocks increased from 4000 tons to 3.9 million tons [25]. Yellowfin tuna is an important species caught by fisheries in the Pacific region [26] and the global average annual capture production has increased year by year since the 1960s, but with significant volatility after 2004 [27]. The reason was mainly due to the exhaustion of wild resources. Resource survey results show that since the 1970s, wild yellowfin tuna spawning has been in a long-term decline, and the fishing mortality of adults and juveniles has continued to increase [28]. Wild resources of yellowfin tuna in the Central and Western Pacific Oceans have been fully exploited [29], and resources are declining. Therefore, it is urgent to conduct research related to the artificial culture of yellowfin tuna.
Yellowfin tuna (Thunnus albacares) belongs to the mackerel family and the tuna genus [30]. It is a highly migratory fish species in the ocean. It can swim at high speed and in deep water. It can quickly dive to the cold-water area below the thermocline (20 °C isotherms) to feed, and the maximum depth exceeds 1000 m [31]. Tuna can automatically adjust the active water depth when encountering temperature changes in the sea [32], but in the cage or land-based culture, the active space is limited, and high temperatures cannot be avoided. The appropriate temperature for yellowfin tuna larval is 28.0 ± 1.0 °C [33], and after our observation, we found that the summer temperature of the land-based culture pond in the tropics can be as high as 34 °C. In fish farming, the aquaculture water temperature is easy to maintain at a high level in summer, and summer is the season of increased fish diseases [34]. Therefore, it is essential to explore the expression and change of fish’s physiological and biochemical indicators, immune function, and oxidative stress parameters under acute high-temperature conditions and analyze fish’s response to high temperature. In this experiment, the water temperature is raised to 34 °C. By measuring the relevant indicators of serum, gills, liver, and muscle of young yellowfin tuna at 0 h and 6 h, 24 h and 48 h after the change of environmental conditions, the effects of acute temperature rise on osmotic physiology and oxidative stress parameters of young yellowfin tuna are discussed, it provides a theoretical basis for in-depth study of the stress response of the organism caused by environmental changes, provides a reference for yellowfin tuna aquaculture.

2. Materials and Methods

2.1. Experiment Design and Sample Collection

Juvenile yellowfin tuna used in the experiment were cultured in offshore sea cages near Xincun Harbour, Xincun Town, Lingshui County, Hainan Province. It was temporarily raised for seven days in the Tropical Aquaculture Research and Development Center, South China Sea Fisheries Research Institute, Chinese Academy of Fishery Sciences. A total of 60 fish were randomly collected before the experiment and transferred into two indoor cement tanks (5 m in diameter and 2.5 m deep) with a recirculating water system. The water temperature was controlled at 28.0 ± 0.5 °C, dissolved oxygen > 5.27 mg/L, ammonia nitrogen < 0.1 mg/L, pH 7.57 ± 0.12, salinity 32‰. Fish were fed daily from 08:30 to 09:00. Fresh miscellaneous fish (4 cm × 2 cm pieces; Trachurus japonicus, Mene maculata) were fed with 5–8% body weight daily by satiety.
Upon the experiment conducted, the mean body length and wet weight were 28.03 ± 1.78 cm and 503.23 ± 36.78 g, respectively. At the beginning of the experiment, 60 fish were randomly collected and divided into two groups. The temperature of the control group and the high-temperature group were set at 28 °C (control group) and 34 °C (HT group) in 3000 L tanks with three replicates each. The rising speed of water temperature is 2 °C/h, and the timing starts when the temperature reaches 34 °C. The water temperature of the HT group was raised and maintained by heating rods (Sensen Group Co., Ltd., Zhoushan, China)
The sampling time was at 0 h, 6 h, 24 h, and 48 h after stress. When the stress time was up, the samples were taken immediately. Three fish from each rearing tank were randomly collected and anesthetized with 0.03% MS-222, and body length and weight were measured. Liver, gill, red muscle, white muscle, and blood were taken. Blood was taken from the caudal vein, the white muscle from 2 cm below the dorsal fin, and the red muscle from near the spine perpendicular to the dorsal fin. Each tissue was stored in 2 mL RNA-free tubes at −80 °C until enzyme activity measurement. Store the extracted blood in a 2 mL centrifuge tube and use a desktop high-speed freezing centrifuge (EXPERT 18K-R) for centrifugation (temperature 4 °C, rotating speed 3000 R·min−1, lasting for 10 min) after standing for 1 h, and store it at −80 °C until analysis.

2.2. Enzyme Activity Measurement

All the tissue samples were partially thawed and homogenized mechanically using a tissue homogenizer on ice. The suspensions were centrifuged according to the requirements of the kits and the protein content in the supernatant was determined by the BCA Protein Assay kit (A045-4-2). The activities of SOD (A001-3-2) and MDA (A003-1-2) contents in the gill, liver, red muscle, and white muscle were measured. The concentration of COR (H094), triglyceride, cholesterol, ALP, osmotic blood glucose, lactic acid, K+, Na+, Cl, C3, and C4 in the serum were measured, and the concentration of ALP in the liver was measured. All of the above assays were determined using commercial kits (Nanjing Jiancheng Bioengineering Institute, Nanjing, China) in triplicates. Ion concentration, osmotic pressure, glucose, and lactic acid in serum were measured by a blood gas analyzer (PL2000 Plus, Nanjing Perlang Medical Equipment Co., Ltd., Nanjing, China), triglyceride, cholesterol, ALP, C3, C4, LDH, and liver antioxidant index ALP, LDH was measured by the biochemical analyzer (PVZS-300X, Beijing Prolong New Technology Co., Ltd., Beijing, China). The above measurements using the blood gas analyzer and biochemical analyzer were carried out in accordance with the instructions in triplicates.

2.3. Calculations and Statistical Analysis

Excel 2021 software was used for data sorting, Origin 2021 was used for drawing, and SPSS 26.0 software was used for significant difference analysis. Comparisons between different groups at the same time were conducted by independent t-test, comparisons between different times in the HT group were conducted by independent one-way ANOVA and least significant difference (LSD) test, and significant difference was set at p < 0.05.

3. Results

3.1. Changes in Serum Indexes of Juvenile Yellowfin Tuna under an Acute Temperature Rise

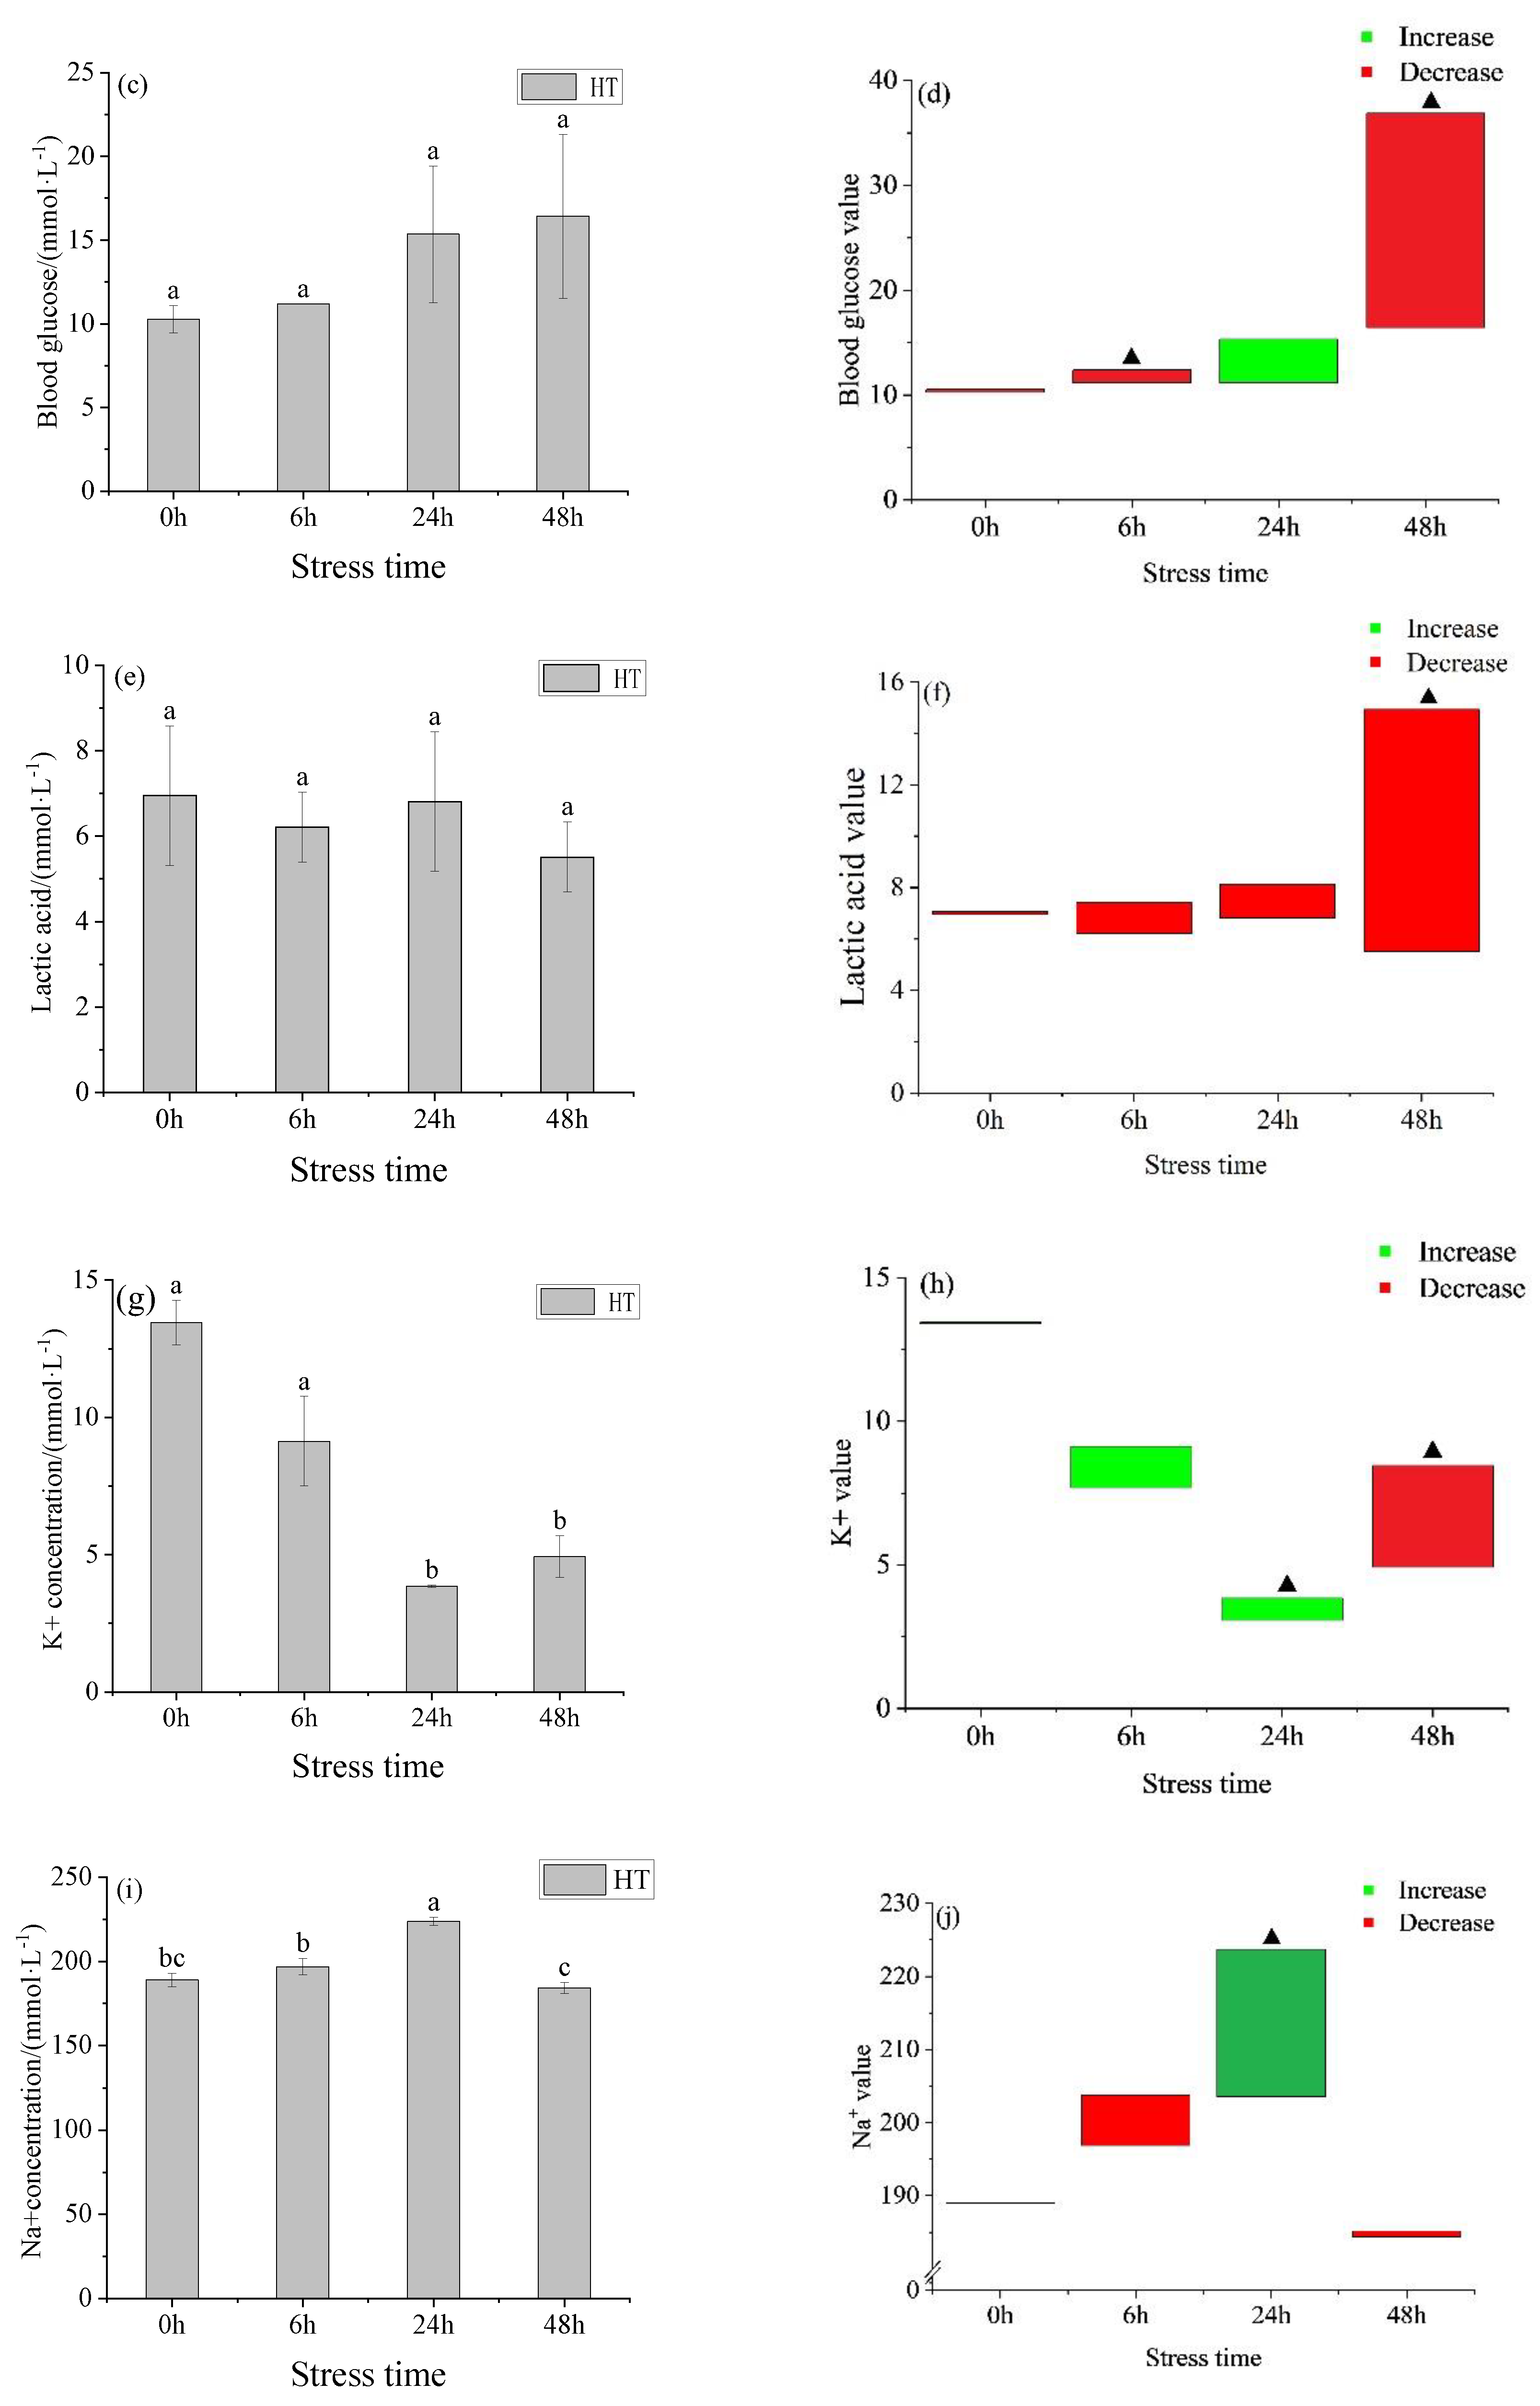
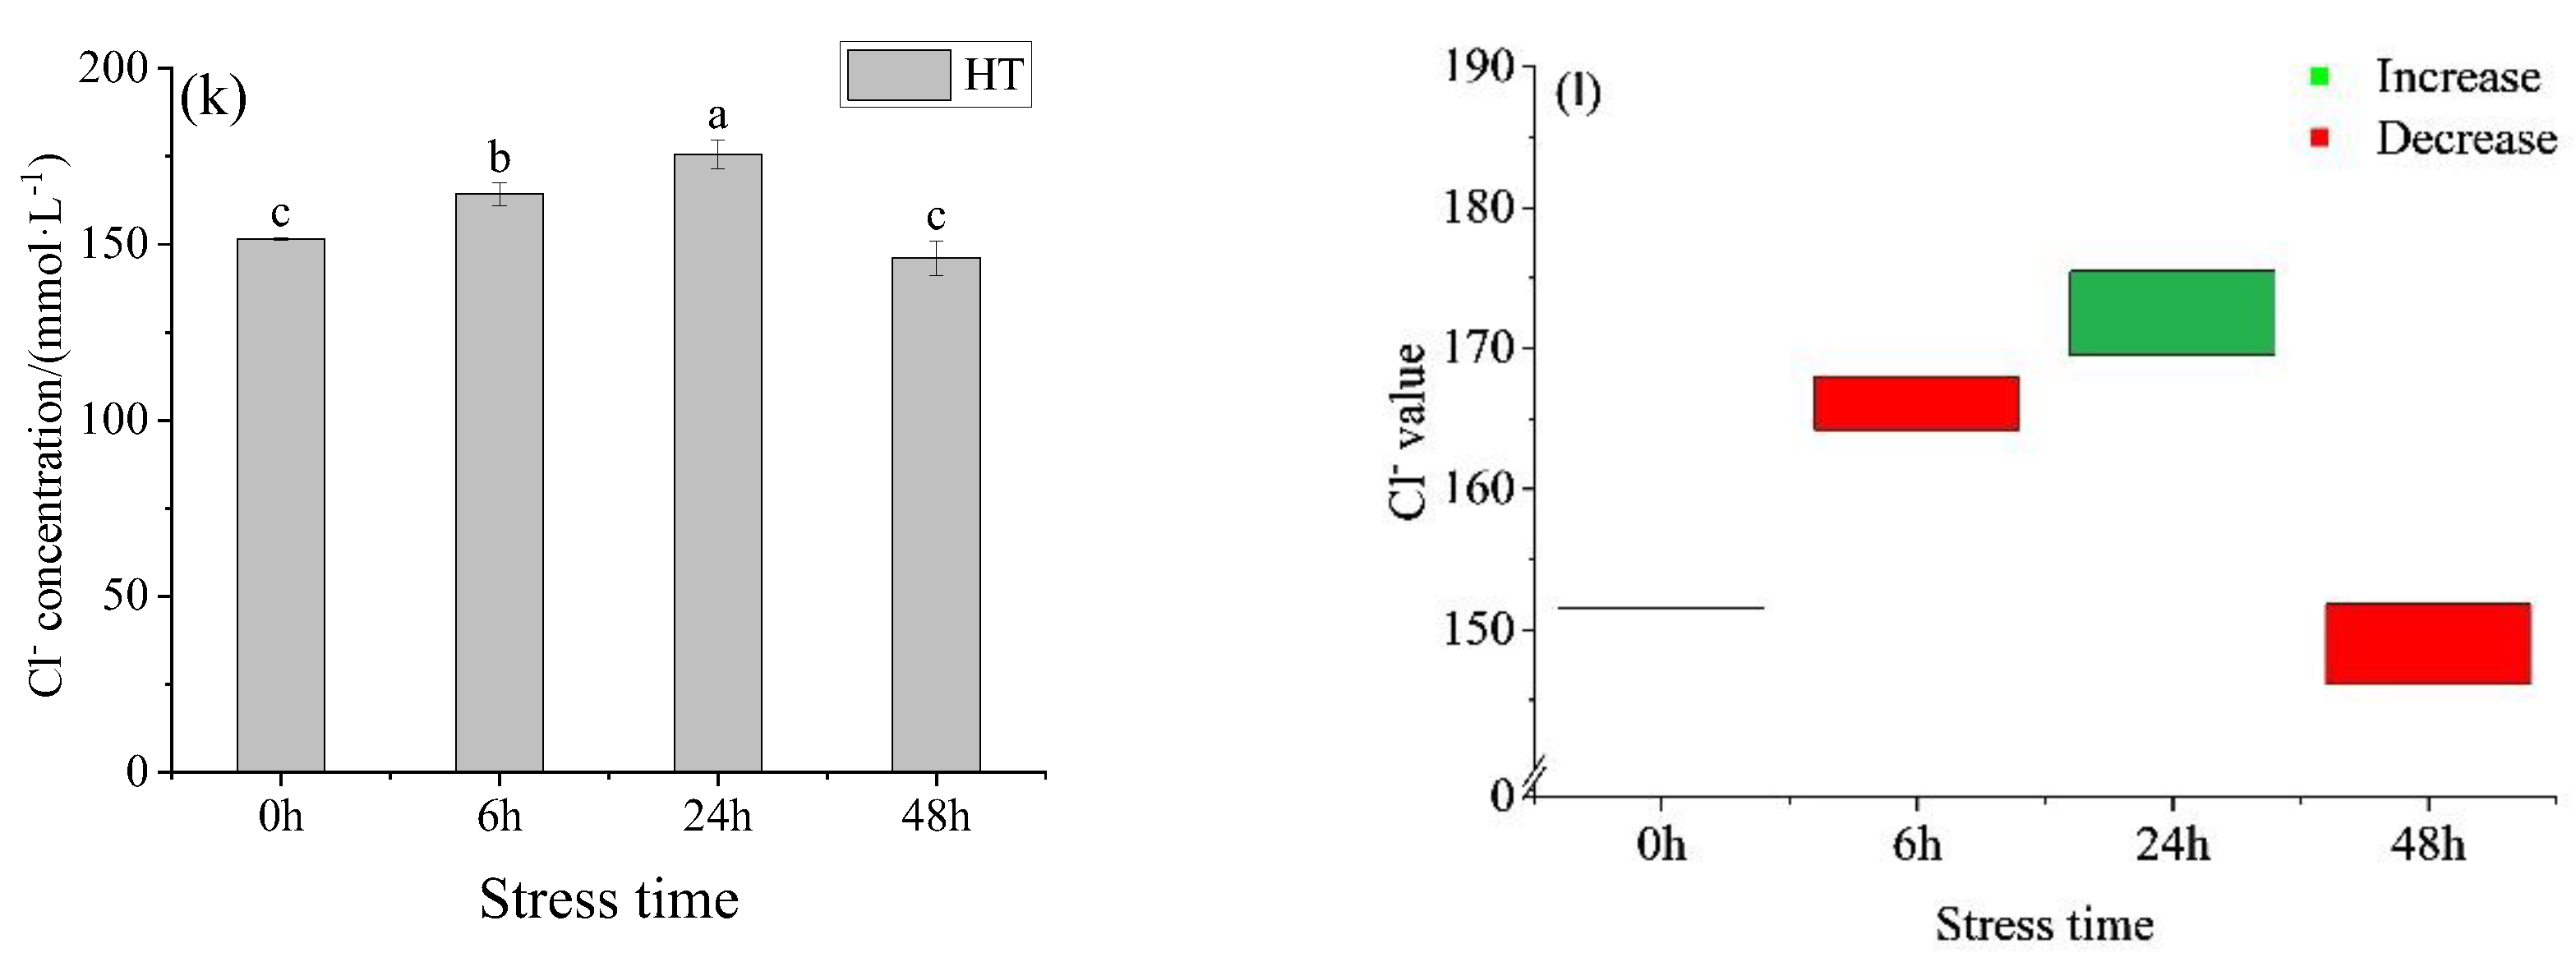
3.1.1. Changes in Ion Concentration, Osmotic Pressure, Blood Glucose, and Lactic Acid in the Serum of Juvenile Yellowfin Tuna under an Acute Temperature Rise

The osmotic pressure of the HT group (Figure 1a) showed a trend of increasing first and then decreasing with time, reaching the highest value at 24 h. There was a significant difference between 6 h, 24 h, and 48 h. At 6 h and 48 h, the osmotic pressure of the HT group was lower than the concentration in the control group and higher than the control group at 0 h and 24 h (Figure 1b). At 0 h, the osmotic pressure between the HT group and 28 °C had no significant difference, but there was a significant difference at 6 h, 24 h, and 48 h. The blood glucose in the HT group did not change with time (Figure 1c), there was a gradual increase, but it was not significant. At 24 h, the blood glucose in the HT group was higher than the concentration in the control group and lower than the concentration in the control group at other time points (Figure 1d). At 0 h and 24 h, there was no significant difference in blood glucose levels between the HT group and control group, but there was a significant difference at other time points. There was no significant difference between the lactic acid groups in the HT group (Figure 1e), but it fluctuated up and down, but not significantly (Figure 1f).
The K+ concentration in the HT group (Figure 1g) showed a trend of first decreasing and then increasing with the prolongation of time. There was no significant difference between 0 h and 6 h, 24 h, and 48 h. At 48 h, K+ in the HT group was lower than in the control group and higher than in the control group at other time points (Figure 1h). The concentration of Na+ and Cl increased first and then decreased with the extension of stress time, with the same trend, and reached the peak at 24 h. Na+ concentration in the HT group (Figure 1i) had significant differences at 6 h, 24 h, and 48 h. At 24 h, the Na+ concentration in the HT group was higher than that in the control group and lower than that in the control group at other times (Figure 1j). The concentration of Cl in the HT group (Figure 1k) was significantly different between adjacent groups. At 24 h, the Cl concentration in the HT group was higher than that in the control group and lower than that in the control group at other times (Figure 1l). The concentration order of three ions in each group was Na+ > Cl > K+.

3.1.2. Changes in Serum Cortisol in Juvenile Yellowfin Tuna under an Acute Temperature Rise

After the acute temperature increase, the cortisol in the HT group first decreased and then increased with the prolongation of stress (Figure 2a), and there was no significant difference between adjacent groups. Among them, the difference between the HT group and the control group (Figure 2b), during 48 h, the HT group was higher than the control group. There was no significant difference in serum cortisol concentration between the control group and the HT group at 0 h, 6 h, and 24 h, but there was a significant difference between the control group and the HT group at 48 h.

3.1.3. Changes of Metabolic Indexes in Serum of Juvenile Yellowfin Tuna under an Acute Temperature Rise

The serum triglyceride and cholesterol concentration in the HT group (Figure 3a,c) showed a trend of first decreasing and then increasing with time, there were significant differences between the groups. The concentration of serum triglycerides in the HT group was lower than the corresponding concentration in the control group at four times point (Figure 3b). There was no significant difference between the HT group and the control group at 0 h, but there were significant differences at the other points. The cholesterol concentration in the HT group was lower than the control group at 6 h and higher than at the other points (Figure 3d). There was no significant difference in serum cholesterol concentration between the HT group and 28 °C at 0 h, but there was a significant difference between 6 h, 24 h, and 48 h. The activity of alkaline phosphatase in the serum of the HT group (Figure 3e) showed a trend of first decreasing and then increasing. The lowest value was reached at 6 h, and it reached to gradually stable after 6 h. The activity of alkaline phosphatase of the HT group was higher than the control group all the time. There was no significant difference in serum alkaline phosphatase concentration between the HT group and the control group at 0 h, but there was a significant difference at the other times point.

3.1.4. Changes of Immune Indexes in Serum of Juvenile Yellowfin Tuna under an Acute Temperature Rise

After acute temperature increase, the concentration of C3 (Figure 4a) in serum in the HT group showed a downward trend, and it remained stable with time, there was no significant difference between 6 h, 24 h, and 48 h. At 0 h, there was no significant difference between the HT group and 28 °C, and there was a significant difference at other time points. The C3 concentration in the serum of the HT group was higher than the corresponding concentration in the control group at 0 h and 6 h, and lower than the corresponding concentration in the control group at 24 h and 48 h. The concentration of complement C4 (Figure 4c) in the serum of the HT group showed a trend of first decreasing and then increasing with the prolongation of time, and there was a significant difference between each time point. At 0 h, there was no significant difference between the HT group and 28 °C, and there was a significant difference between 6 h, 24 h, and 48 h.

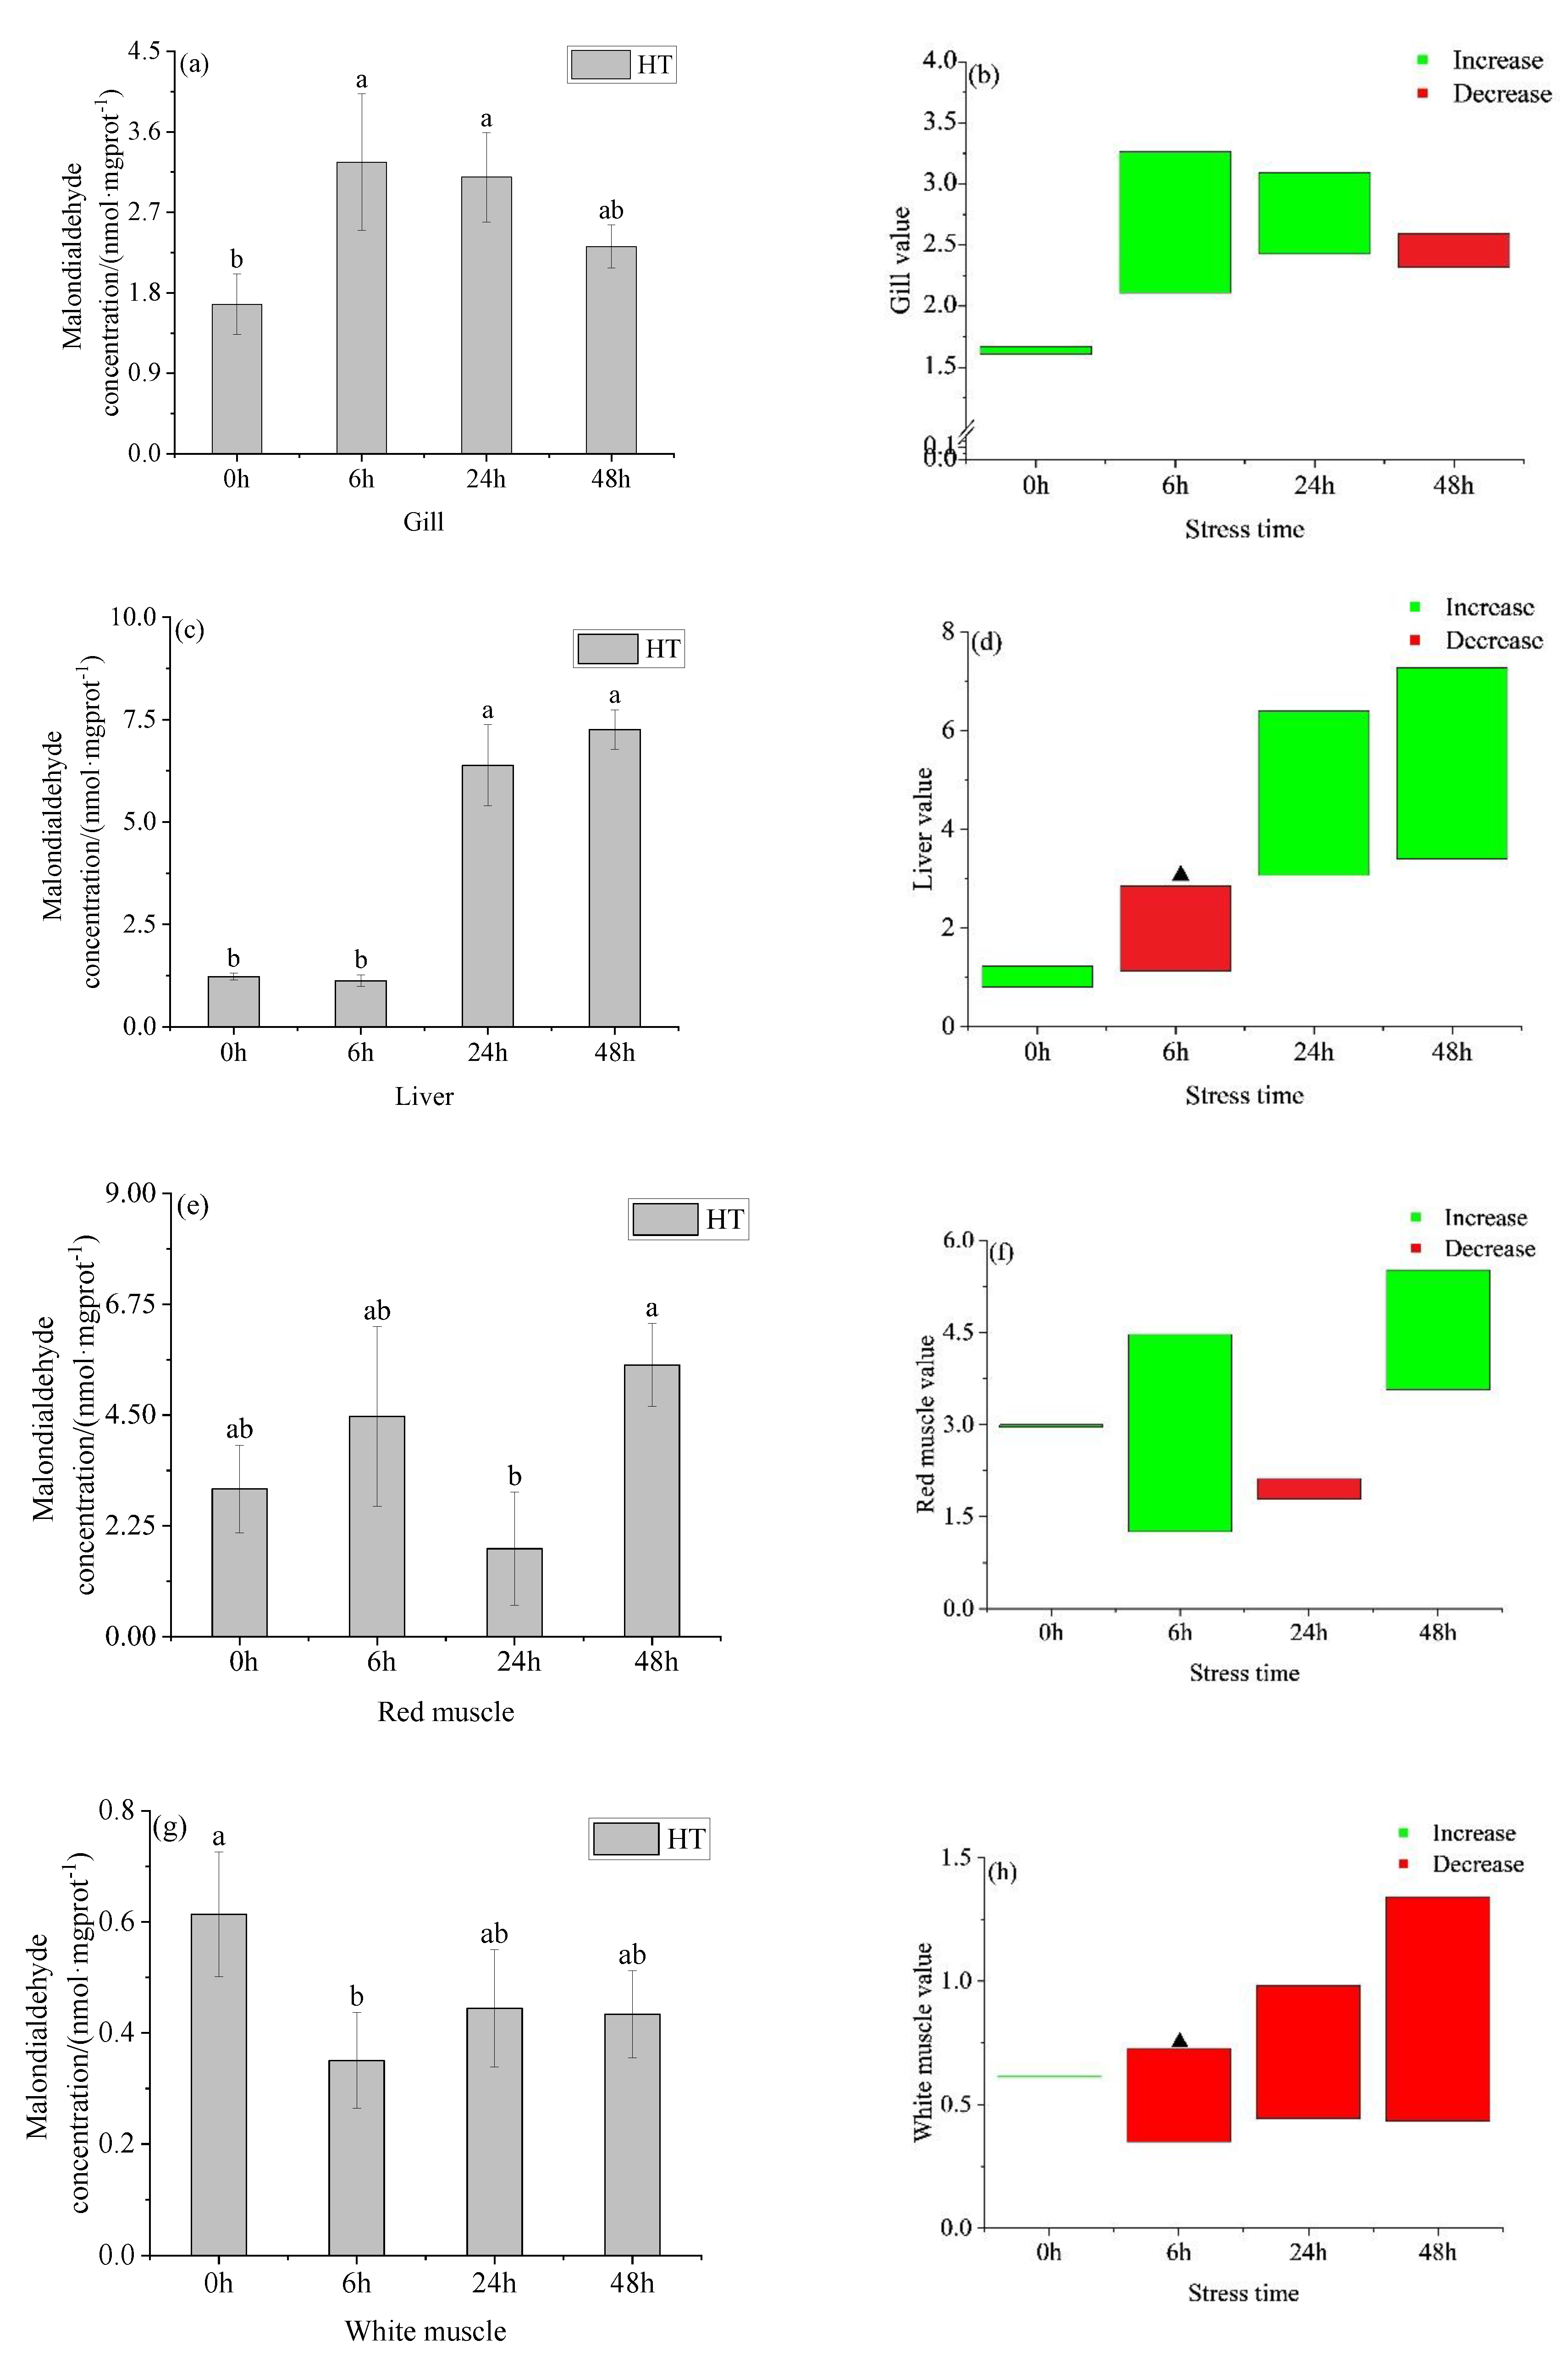
3.2. Changes in Oxidative Stress Parameters in Organs of Juvenile Yellowfin Tuna under an Acute Temperature Rise

The superoxide dismutase (SOD) in the gills of the HT group (Figure 5a) showed an increasing and gradually stable trend, and there was no significant difference at 6 h, 24 h, and 48 h. The activity of SOD in the gills in the HT group gills was higher than in the control group at all times (Figure 5b). There was no significant difference between the HT group and the 28 °C at all times. The activity of SOD in the liver (Figure 5c) in the HT group first increased and then decreased with time, and the activity reached the highest value at 24 h, and there was no significant difference between 6 h and 24 h. At 6 h and 24 h, the liver SOD activity of the HT group and control group was significantly different (Figure 5d).
The activity of SOD in the red and white muscle of the HT group (Figure 5e,g) showed a decreasing and then increasing trend, with a significant difference between adjacent groups in the red muscle. The activity in the red muscle of the HT group was higher than the corresponding time concentration in the control group at 0 h, 6 h, and 48 h, and lower than the control group at 24 h (Figure 5f). There was no significant difference in the activity of SOD in red muscle between the HT group and control group at 0 h and 6 h, but there was a significant difference between 24 h and 48 h. The activity in the white muscle was no significant difference at 6 h and 24 h. The activity in the white muscle of the HT group was higher than the control group at 0 h and 24 h, and lower than the control group at 6 h and 48 h. There was no significant difference in SOD activity between the HT group and control group at the corresponding time at 0 h, but there had a significant difference at the other times.
After acute heating, the concentration of malondialdehyde in the gills of the HT group (Figure 6a) increased first and then decreased with time, and there was no significant difference between 6 h and 24 h. The concentration of malondialdehyde in the gills of the HT group was higher than that in the control group at 0 h, 6 h, and 24 h, and lower than 48 h (Figure 6b). There was no significant difference in the concentration of malondialdehyde in the gills of the HT group and control group all the time.
The MDA concentration of the liver in the HT group (Figure 6c) showed an upward trend with the prolongation of the temperature stress time. There was no significant difference between the concentrations at 0 h and 6 h, 24 h, and 48 h. The MDA concentration in the liver of the HT group was higher than that in the control group at 0 h, 24 h, and 48 h, and lower than that in the control group at 6 h (Figure 6d). At 0 h and 24 h, there was no significant difference in the concentration of malondialdehyde in the liver between the HT group and control group, but there was a significant difference at 24 h and 48 h. There was no significant difference in the concentration of MDA between 0 h and 6 h (Figure 6e) in the red muscle of the HT group, there was a significant difference between 24 h and 48 h. Concentrations in the HT group were higher than those in the control group at 0 h, 6 h, and 48 h, and lower than those in the control group at 24 h (Figure 6f). The MDA in the red muscle of the HT group was not significantly different from that in the control group at all times. The concentration of MDA in the white muscle of the HT group (Figure 6g) showed a trend of first decreasing and then increasing with the prolongation of stress time, and there was a significant difference between 0 h and 6 h, and 24 h and 48 h had no significant difference. At 6 h, 24 h, and 48 h, the concentration of MDA in the white muscle of the HT group was lower than that in the control group (Figure 6h). At 6 h, the concentration of malondialdehyde in the white muscle of the HT group had significant difference from that in the control group, but there had no significant difference at the other times.

3.3. Changes in Immune Indexes in the Liver of Juvenile Yellowfin Tuna under an Acute Temperature Rise

The alkaline phosphatase activity in the liver in the HT group (Figure 7a) decreased at first and then increased with prolonged stress time. The concentration at 24 h was significantly lower than the other three time points, and there was no significant difference between 6 h and 48 h. After temperature stress, the hepatic alkaline phosphatase activity of yellowfin tuna in the HT group was higher than the corresponding concentration in the control group (Figure 7b) at 0 h and lower than the control group at the other points. At 0 h and 48 h, there was no significant difference in the concentration of hepatic alkaline phosphatase between the HT group and control group, but there was a significant difference at 6 h and 24 h.

4. Discussion

4.1. Changes in Serum Indexes of Juvenile Yellowfin Tuna under an Acute Temperature Rise

4.1.1. Changes in Ion Concentration, Osmotic Pressure, Blood Glucose, Lactic Acid, and Cortisol in Serum of Juvenile Yellowfin Tuna under an Acute Temperature Rise

The change trend of osmotic pressure in the HT group was first increased and then decreased. This was because the fish maintained its own pressure by regulating its own osmotic pressure to regulate the concentration of ions after stress. The research showed that [35] the effect of environmental temperature stress on juvenile catfish plasma ion concentration and osmotic pressure concentration, and found that Na+, Cl and osmotic pressure showed an upward trend, while K+ remained roughly unchanged. The results of Na+, Cl, and osmotic stress were similar to those of this study, but K+ was different. It is found that the ionic permeability increases [36] when the temperature rises, so Na+, Cl, and osmotic pressure show an upward trend. The change in K+ concentration may be due to the fact that after the increase in cell membrane permeability, K+ needs to enter the cell to play a balancing role, leading to the decrease in the concentration. The Na+ and Cl concentration change at 48 h, which may be due to the balance of K+.
The research reported that blood glucose increased with the increase in temperature in carp and Senegalese sole (Solea senegalensis Kaup) under high temperatures [37,38,39]. The changing trend in this study is the same as that in previous studies, indicating that the metabolism is more vigorous and more glycogen is needed. In this study, the lactic acid content in the HT group is lower than the control group most of the time, and lactic acid in the HT group shows a downward trend. This indicates that to adapt to the environment under high-temperature stress, lactic acid was taken to the liver and decomposed into CO2 and H2O, reducing the lactic acid content. The research showed that the plasma cortisol concentration of the fish adapted to high temperature was about twice that of the control fish, which was consistent with the results of carp [40,41] and black snapper (Acantopagrus schlegelii) [42] adapting to the high temperature previously reported. The result of this study is that it decreases first and then increases, which is different from the results of other studies. This may be because the yellowfin tuna is a kind of temperate fish, which has a tolerance to temperature for a short period of time. The HT group rises at 48 h, which may be due to the stress response gradually enhanced with the extension of time.

4.1.2. Changes of Metabolic Indexes in Serum of Juvenile Yellowfin Tuna under an Acute Temperature Rise

The research showed that [43] the growth performance and metabolism of Roche Labeo (Labeo rohita) rohita under heat stress and found that the triglycerides and cholesterol concentrations in serum decreased gradually. The research showed [19] the physiological and biochemical reactions of fat short cap carp (Piaractus brachypomus) under temperature stress. The results showed that the contents of triglycerides and cholesterol in plasma decreased after heat shock. The results of this study showed that the triglyceride concentration of the control group and the experimental group decreased gradually after 6 h, which was consistent with the previous study. However, the concentration increased after 24 h, which may be due to the prolonged stress time, the body’s adaptation to environmental changes, and the gradual recovery of triglyceride metabolism, leading to the increase in triglyceride concentration. Alkaline phosphatase (ALP) is an essential non-specific immune marker enzyme and metabolic regulator enzyme. This enzyme has detoxification, defense, and digestion functions and is also an essential metabolic regulating enzyme involved in phosphate group transport and metabolism and is a sign of fish health [44]. Environmental changes affect its content, reflecting the stress state of fish [45]. The research showed that [46] rainbow trout’s physiological and biochemical reactions to heat stress. The results showed that the alkaline phosphatase decreased significantly after the temperature increased. This study showed that the serum alkaline phosphatase concentration in the HT group decreased first and then increased, similar to the previous study. This is because alkaline phosphatase promotes fat degradation and reduces concentration under high-temperature stress. Under long-term pressure, the body’s triglyceride, cholesterol, and alkaline phosphatase concentrations increase. The results showed that acute heat stress could promote the lipid metabolism of fish in a short time.

4.2. Changes in Oxidative Stress Parameters and Immune Indexes of Juvenile Yellowfin Tuna under an Acute Temperature Rise

Superoxide dismutase can maintain the superoxide anion free radicals produced under normal conditions and maintain balance [47]. The research showed that [48] the changes of oxidative stress and related enzyme activities in goldfish tissues caused by temperature rise, indicating that the activity of SOD in the liver has increased by about twice, showing a similar trend in the muscle, which is consistent with the results of this study. The activity of SOD in the liver decreases at 48 h, this may result in the decreased antioxidant capacity in the liver of juvenile yellowfin tuna due to the prolonged stress time. The research showed that [49] the antioxidant response of carp liver under temperature stress. The results showed that under the same conditions, the activity of SOD in the liver decreased with the increase in temperature, under the same salinity, SOD in gills gradually decreased with the temperature increase. This study may differ from the results of our study because the heat stressors previously studied by researchers hinder intestinal digestion and local immunity, thereby inhibiting systemic immunity. In this study, heat stress improved the antioxidant capacity of yellowfin tuna, but did not inhibit it. The results showed that the time after the high temperature had little effect on the SOD in gills, and the SOD in gills tended to be stable after gradually adapting. The change trend of SOD in the red and white muscle of the experimental group was the same, but the red power was more sensitive to temperature. In this study, the muscle content is the highest, which may be because different experimental times have different effects on each organ or other species.
Malondialdehyde (MDA) is a substance with strong toxicity to organisms after the decomposition of lipid peroxide. It can directly reflect the degree of lipid peroxidation and cell damage, and indirectly reflect the ability of cells to remove free radicals [50]. The research showed [51] the tissue oxidative stress response of Nile tilapia under temperature shock. The results showed that the level of malondialdehyde in gills increased significantly. In this study, the concentration of MDA in the gills of the experimental group gradually increased and then decreased, which is similar to the previous study results. Dawood, MAO [51] found that under the same salinity, MDA in gills gradually increased with the increase in temperature, which is also similar to the results of this study. With the extension of time, fish gradually adapt to the environment, SOD increases, and MDA decreases. The MDA had no significant change at the 6th hour in the liver. It may be that the gills are more sensitive to changes in environmental conditions than the liver, so the MDA content in the gills is significantly increased. In this study, the change of MDA in red muscle is more obvious than that in white muscle, and the MDA content in white muscle gradually decreases and tends to be stable because red muscle is more sensitive to temperature changes than white muscle. According to the analysis of MDA concentration in various organs, acute warming affects the content of the liver, and MDA in gills and red muscles is more sensitive to temperature.
The research showed [52] the effect of different temperature stress on the immune indexes of crucian carp. The results showed that the alkaline phosphatase activity first increased and then decreased with the temperature increase, which was different from the results of this study. This may be because acute warming causes yellowfin tuna to consume a large amount of alkaline phosphatase for non-specific immunity. Additionally, it increases over 48 h, this is because the fish adapt to the temperature change for 48 h, and the non-specific immune function is enhanced. This shows that acute temperature stress significantly changes the non-specific immunity of juvenile yellowfin tuna. The research showed [53] the effect of temperature on the immunity of juvenile carp. The results showed that the activities of C3 and C4 in the liver increased significantly with the temperature increase. This study showed that C3 and C4 decreased first and then increased after high-temperature stress, which was different from previous studies. This may be because heat stress causes cannot be synthesized in a short time, and with the extension of non-specific immune time, the addition of complement gradually increases. These results indicate that the ability of yellowfin tuna to synthesize complement is weak in a short time.

5. Conclusions

The result shows that the serum ion concentration and osmotic pressure, biochemical indicators of blood glucose, and lactate were changed after acute temperature stress. Acute temperature stress can cause excessive free radicals in the body and reduce immune indicators (e.g., ALP in the liver and the complement C3 and C4 in serum). Under acute temperature rise stress, antioxidant enzymes and metabolic indicators of the juvenile yellowfin tuna changed significantly. The triglycerides, cholesterol, and alkaline phosphatase in serum have changed significantly and gradually adapted to the environment with time. The gills and liver also improve the activities of SOD to eliminate free radicals, but still could not stop the increase in MDA, which may cause peroxidation damage to the body. In this study, the juvenile yellowfin tuna is sensitive to temperature rise, and the tendency of physiological activity disorder was aggravated over time within 48 h. Therefore, in actual production and large-scale intensive aquaculture, it is necessary to avoid sharp temperature changes as much as possible, reduce the frequency and duration of acute temperature stress, and make it a suitable breeding and growing environment.

Supplementary Materials

The following supporting information can be downloaded at: https://www.mdpi.com/article/10.3390/jmse10121857/s1, Table S1: Statistical values of HT group (including the squares of F, df, P and eta). Table S2: Statistical values between the control group and experimental group (including the squares of df, P and Sig).

Author Contributions

Conceptualization, G.Y. and H.Z.; methodology, Z.M.; software, Z.M.; validation, H.Z. and H.L.; formal analysis, G.Y.; investigation, Z.F.; resources, Z.M.; data curation, H.L.; writing—original draft preparation, H.L.; writing—review and editing, Z.M. and Z.F.; visualization, H.L.; supervision, G.Y.; project administration, Z.M.; funding acquisition, Z.M. All authors have read and agreed to the published version of the manuscript.

Funding

This work was supported by Hainan Major Science and Technology Project (ZDKJ2021011); Central Public-interest Scientific Institution Basal Research Fund, CAFS (2020TD55), and Central Public-Interest Scientific Institution Basal Research Fund South China Sea Fisheries Research Institute, CAFS (2021SD09).

Institutional Review Board Statement

The animal study protocol was approved by the Institutional Review Board (or Ethics Committee) of Animal Care and Use Committee of South China Sea fisheries Research Institute, Chinese Academy of Fishery Sciences (BIOL5346, 9 May 2022).

Data Availability Statement

The original contributions presented in the study are included in the article/Supplementary Materials. Further inquiries can be directed to the corresponding authors.

Acknowledgments

The authors would like to thank Jicai Liu for his support and help in sample determination.

Conflicts of Interest

The authors declare no conflict of interest.

References

  1. Joy, S.; Alikunju, A.P. Oxidative stress and antioxidant defense responses of Etroplus suratensis to acute temperature fluctuations. J. Therm. Biol. 2017, 70, 20–26. [Google Scholar] [CrossRef] [PubMed]
  2. Leggatt, R.A.; Brauner, C.J. Effects of acclimation and incubation temperature on the glutathione antioxidant system in killifish and RTH-149 cells. Comp. Biochem. Physiol. Mol. Integr. Physiol. 2007, 146, 317–326. [Google Scholar] [CrossRef] [PubMed]
  3. Maltar-Strmecki, N.; Ljubic-Beer, B. Effect of the gamma radiation on histamine production, lipid peroxidation and antioxidant parameters during storage at two different temperatures in sardine (Sardina pilchardus). Food Control 2013, 34, 132–137. [Google Scholar] [CrossRef]
  4. Li, Z.H.; Li, P. Regulation of glutathione-dependent antioxidant defense system of grass carp Ctenopharyngodon idellaunder the combined stress of mercury and temperature. Environ. Sci. Pollut. Res. 2020, 28, 1689–1696. [Google Scholar] [CrossRef]
  5. Clotfelter, E.D.; Lapidus, S.J.H. The effects of temperature and dissolved oxygen on antioxidant defences and oxidative damage in the fathead minnow Pimephales promelas. J. Fish Biol. 2013, 82, 1086–1092. [Google Scholar] [CrossRef]
  6. Wen, X.; Chu, P. Combined effects of low temperature and salinity on the immune response, antioxidant capacity and lipid metabolism in the pufferfish (Takifugu fasciatus). Aquaculture 2020, 531, 735866. [Google Scholar] [CrossRef]
  7. Pereira, L.A.L.; Amanajas, R.D. Health of the Amazonian fish tambaqui (Colossoma macropomum): Effects of prolonged photoperiod and high temperature. Aquaculture 2021, 541, 736836. [Google Scholar] [CrossRef]
  8. Ainsworth, A.J.; Dexiang, C. Effect of temperature on the immune system of channel catfish (Ictalurus punctatus)—I. Leucocyte distribution and phagocyte function in the anterior kidney at 10 degrees C. Comparative biochemistry and physiology. Comp. Physiol. 1991, 100, 907–912. [Google Scholar]
  9. Zapata, A.G.; Varas, A. Seasonal variations in the immune system of lower vertebrates. Immunol. Today 1992, 13, 142–147. [Google Scholar] [CrossRef]
  10. Boveris, A.; Chance, B. The mitochondrial generation of hydrogen peroxide. General properties and effect of hyperbaric oxygen. Biochem. J. 1973, 134, 707–716. [Google Scholar] [CrossRef]
  11. Rubbo, H.; Radi, R. Nitric oxide regulation of superoxide and peroxynitrite-dependent lipid peroxidation. Formation of novel nitrogen-containing oxidized lipid derivatives. J. Biol. Chem. 1994, 269, 26066–26075. [Google Scholar] [CrossRef] [PubMed]
  12. Volkoff, H.; Ronnestad, I. Effects of temperature on feeding and digestive processes in fish. Temperature 2020, 7, 307–320. [Google Scholar] [CrossRef] [PubMed]
  13. Davis, K.B. Temperature affects physiological stress responses to acute confinement in sunshine bass (Morone chrysops x Morone saxatilis). Comp. Biochem. Physiol. Mol. Integr. Physiol. 2004, 139, 433–440. [Google Scholar] [CrossRef] [PubMed]
  14. Mommsen, T.P.; Vijayan, M.M. Cortisol in teleosts: Dynamics, mechanisms of action, and metabolic regulation. Rev. Fish Biol. Fish. 1999, 9, 211–268. [Google Scholar] [CrossRef]
  15. Iversen, M.; Finstad, B. Stress responses in Atlantic salmon (Salmo salar L.) smolts during commercial well boat transports, and effects on survival after transfer to sea. Aquaculture 2005, 243, 373–382. [Google Scholar] [CrossRef]
  16. Liu, H.Y.; Fu, Z.Y. Effect of Transport Density on Greater Amberjack (Seriola dumerili) Stress, Metabolism, Antioxidant Capacity and Immunity. Front. Mar. Sci. 2020, 9, 931816. [Google Scholar] [CrossRef]
  17. Heink, A.E.; Parrish, A.N. Oxidative stress among SOD-1 genotypes in rainbow trout (Oncorhynchus mykiss). Aquat. Toxicol. 2014, 144, 75–82. [Google Scholar] [CrossRef]
  18. Garcia, D.; Lima, D. Decreased malondialdehyde levels in fish (Astyanax altiparanae) exposed to diesel: Evidence of metabolism by aldehyde dehydrogenase in the liver and excretion in water. Ecotoxicol. Environ. Saf. 2020, 190, 110107. [Google Scholar] [CrossRef]
  19. Ale, A.; Bacchetta, C. Low temperature stress in a cultured fish (Piaractus mesopotamicus) fed with Pyropia columbina red seaweed-supplemented diet. Fish Physiol. Biochem. 2021, 47, 829–839. [Google Scholar] [CrossRef]
  20. Kim, J.H.; Park, H.J. Changes in Hematological Parameters and Heat Shock Proteins in Juvenile Sablefish Depending on Water Temperature Stress. J. Aquat. Anim. Health 2019, 31, 147–153. [Google Scholar] [CrossRef]
  21. Nakamura, Y.N.; Ando, M. Changes of proximate and fatty acid compositions of the dorsal and ventral ordinary muscles of the full-cycle cultured Pacific bluefin tuna Thunnus orientalis with the growth. Food Chem. 2007, 103, 234–241. [Google Scholar] [CrossRef]
  22. Pang, J.H.; Cheng, Q.Q. The sequence and organization of complete mitochondrial genome of the yellowfin tuna, Thunnus albacares (Bonnaterre, 1788). Mitochondrial DNA Part A 2016, 27, 3111–3112. [Google Scholar] [CrossRef] [PubMed]
  23. Jeyasekaran, G.; Arunkumar, G. Authentication of commercially important tuna species landed in Tuticorin coast of Tamil Nadu, India by SE-AFLP method. Indian J. Fish. 2018, 64, 254–259. [Google Scholar] [CrossRef] [Green Version]
  24. Nguyen, K.Q.; Phan, H.T. Length-length, Length-weight, and Weight-weight Relationships of Yellowfin (Thunnus Albacares) and Bigeye (Thunnus Obesus) Tuna Collected from the Commercial Handlines Fisheries in the South China Sea. Thalass. Int. J. Mar. Sci. 2022, 1–7. [Google Scholar] [CrossRef]
  25. Shen, H.H. Study on Management System of Tuna Fishery Resources. Ph.D. Thesis, Shanghai Ocean University, Shanghai, China, 2019. [Google Scholar]
  26. Benetti, D.D.; Partridge, G.J. Overview on status and technological advances in tuna aquaculture around the world. In Advances in Tuna Aquaculture; Benetti, D.D., Partridge, G.J., Buentello, A., Eds.; Academic Press: Cambridge, MA, USA, 2016; pp. 1–19. [Google Scholar]
  27. FAO. Thunnus albacares (Bonnaterre, 1788). 2022. Available online: https://www.fao.org/fishery/en/aqspecies/2497/en (accessed on 2 November 2022).
  28. WCPFC. WCPO Yellowfin Tuna (Thunnus albacares) Stock Status and Management Advice. Available online: https://www.wcpfc.int/doc/02/yellowfin-tuna (accessed on 17 February 2021).
  29. Zhang, P.; Yang, L. Current situation and prospect of tuna and squid resources exploitation in South China Sea. South. Fish. 2010, 6, 68–74. [Google Scholar]
  30. Liu, H.Y.; Fu, Z.Y. The Complete Mitochondrial Genome of Pennella sp. Parasitizing Thunnus albacares. Front. Cell. Infect. Microbiol. 2022, 12, 945152. [Google Scholar] [CrossRef] [PubMed]
  31. Schaefer, K.M.; Fuller, D.W. Movements, behavior, and habitat utilization of yellowfin tuna (Thunnus albacares) in the northeastern Pacific Ocean, ascertained through archival tag data. Mar. Biol. 2007, 152, 503–525. [Google Scholar] [CrossRef]
  32. Aoki, Y.; Aoki, A. Physiological and behavioural thermoregulation of juvenile yellowfin tuna Thunnus albacares in subtropical waters. Mar. Biol. 2020, 167, 1–14. [Google Scholar] [CrossRef]
  33. Kim, Y.S.; Delgado, D.I. Effect of temperature and salinity on hatching and larval survival of yellowfin tuna Thunnus albacares. Fish. Sci. 2015, 81, 891–897. [Google Scholar] [CrossRef]
  34. Woo, K.J.; Jeong, S.-H. Monitoring of Pathogens in Cultured Fish of Korea for the Summer Period from 2000 to 2006. J. Fish Pathol. 2006, 19, 207–214. [Google Scholar]
  35. Nordlie, F.G. Influence of environmental temperature on plasma ionic and osmotic concentrations in Mugil cephalus Lin. Comp. Biochem. Physiol. Comp. Physiol. 1976, 55, 379–381. [Google Scholar] [CrossRef] [PubMed]
  36. Rasio, E.A.; Bendayan, M.; Goresky, C.A. Effect of temperature change on the permeability of eel rete capillaries. Circ. Res. 1992, 70, 272–284. [Google Scholar] [CrossRef] [PubMed] [Green Version]
  37. Shahjahan, M.; Khatun, M.S. Nuclear and Cellular Abnormalities of Erythrocytes in Response to Thermal Stress in Common Carp Cyprinus carpio. Front. Physiol. 2020, 11, 543. [Google Scholar] [CrossRef]
  38. Costas, B.; Aragao, C. Different environmental temperatures affect amino acid metabolism in the eurytherm teleost Senegalese sole (Solea senegalensis Kaup, 1858) as indicated by changes in plasma metabolites. Amino Acids 2012, 43, 327–335. [Google Scholar] [CrossRef] [PubMed]
  39. Fan, X.P.; Qin, X.M. Effects of temperature on metabolism function and muscle quality of grouper during process of keeping alive with water. Trans. Chin. Soc. Agric. Eng. 2018, 24, 241–248. [Google Scholar]
  40. Arends, R.J.; van der Gaag, R. Differential expression of two pro-opiomelanocortin mRNAs during temperature stress in common carp (Cyprinus carpio L.). J. Endocrinol. 1998, 159, 85–91. [Google Scholar] [CrossRef] [PubMed] [Green Version]
  41. Metz, J.R.; van den Burg, E.H. Regulation of branchial Na+/K+-ATPase in common carp Cyptinus carpio L. acclimated to different temperatures. J. Exp. Biol. 2003, 206, 2273–2280. [Google Scholar] [CrossRef] [Green Version]
  42. Choi, C.Y.; Min, B.H. Molecular cloning of PEPCK and stress response of black porgy (Acanthopagrus schlegeli) to increased temperature in freshwater and seawater. Gen. Comp. Endocrinol. 2007, 152, 47–53. [Google Scholar] [CrossRef]
  43. Roychowdhury, P.; Aftabuddin, M. Thermal stress altered growth performance and metabolism and induced anaemia and liver disorder in Labeo rohita. Aquac. Res. 2020, 51, 1406–1414. [Google Scholar] [CrossRef]
  44. Hoseinifar, S.H.; Roosta, Z. The effects of Lactobacillus acidophilus as feed supplement on skin mucosal immune parameters, intestinal microbiota, stress resistance and growth performance of black swordtail (Xiphophorus helleri). Fish Shellfish Immunol. 2015, 42, 533–538. [Google Scholar] [CrossRef]
  45. Silva, M.J.D.; da Costa, F.F.B. Biological responses of Neotropical freshwater fish Lophiosilurus alexandri exposed to ammonia and nitrite. Sci. Total Environ. 2018, 616, 1566–1575. [Google Scholar] [CrossRef] [PubMed]
  46. Li, S.W.; Liu, Y.J. Physiological responses to heat stress in the liver of rainbow trout (Oncorhynchus mykiss) revealed by UPLC-QTOF-MS metabolomics and biochemical assays. Ecotoxicol. Environ. Saf. 2020, 242, 113949. [Google Scholar] [CrossRef] [PubMed]
  47. Cheng, C.H.; Guo, Z.X. Effect of dietary astaxanthin on the growth performance, non-specific immunity, and antioxidant capacity of pufferfish (Takifugu obscurus) under high temperature stress. Fish Physiol. Biochem. 2018, 44, 209–218. [Google Scholar] [CrossRef] [PubMed]
  48. Lushchak, V.I.; Bagnyukova, T.V. Temperature increase results in oxidative stress in goldfish tissues. 2. Antioxidant and associated enzymes. Comp. Biochem. Physiol. Toxicol. Pharmacol. 2006, 143, 36–41. [Google Scholar] [CrossRef]
  49. Dawood, M.A.O.; Alkafafy, M. The antioxidant responses of gills, intestines and livers and blood immunity of common carp (Cyprinus carpio) exposed to salinity and temperature stressors. Fish Physiol. Biochem. 2022, 48, 397–408. [Google Scholar] [CrossRef] [PubMed]
  50. Duran, A.; Talas, Z.S. Biochemical changes and sensory assessment on tissues of carp (Cyprinus carpio, Linnaeus 1758) during sale conditions. Fish Physiol. Biochem. 2009, 35, 709–714. [Google Scholar] [CrossRef]
  51. Phrompanya, P.; Panase, P. Histopathology and oxidative stress responses of Nile tilapia Oreochromis niloticus exposed to temperature shocks. Fish. Sci. 2021, 87, 491–502. [Google Scholar] [CrossRef]
  52. Wang, B.; Ma, G.X. Effects of Different Temperatures on the Antibacterial, Immune and Growth Performance of Crucian Carp Epidermal Mucus. Fishes 2022, 6, 66. [Google Scholar] [CrossRef]
  53. Huang, J.F.; Xu, Q.Y. Effects of temperature and dietary protein on gene expression of Hsp70 and Wap65 and immunity of juvenile mirror carp (Cyprinus carpio). Aquac. Res. 2015, 46, 2776–2788. [Google Scholar] [CrossRef]
Figure 1. Changes in osmotic pressure (a), osmotic pressure value (b), blood glucose (c), blood glucose value (d), lactic acid (e), lactic acid value (f), K+ concentration (g), K+ value (h), Na+ concentration (i), Na+ value (j), Cl concentration (k) and Cl value (l) in the serum of young yellowfin tuna under acute high–temperature stress. The value is the gap of the experimental group minus the control group. Red means down and green means up. The significantly different between the control group and the HT group was represented by a ▲. Different and the same letters indicate a significant difference (p < 0.05) and insignificant difference (p > 0.05).
Jmse 10 01857 g001aJmse 10 01857 g001bJmse 10 01857 g001c
Figure 2. Changes of serum cortisol (a) and cortisol value (b) in young yellowfin tuna under acute high-temperature stress. The value is the gap of the experimental group minus the control group. Red means down and green means up. The significantly different between the control group and the HT group was represented by a ▲. Different and the same letters indicate a significant difference (p < 0.05) and insignificant difference (p > 0.05).
Jmse 10 01857 g002
Figure 3. Changes in triglyceride (a), triglyceride value (b), cholesterol (c), cholesterol (d), alkaline phosphatase (e), and alkaline phosphatase value (f) in serum of young yellowfin tuna under acute high–temperature stress. The value is the gap of the experimental group minus the control group. Red means down and green means up. The significantly different between the control group and the HT group was represented by a ▲. Different and the same letters indicate a significant difference (p < 0.05) and insignificant difference (p > 0.05).
Jmse 10 01857 g003
Figure 4. Changes in complement C3 concentration (a), C3 value (b), complement C4 concentration (c) and C3 value (d) in serum of young yellowfin tuna under acute high–temperature stress. The value is the gap of the experimental group minus the control group. Red means down and green means up. The significantly different between the control group and the HT group was represented by a ▲. Different and the same letters indicate a significant difference (p < 0.05) and insignificant difference (p > 0.05).
Jmse 10 01857 g004
Figure 5. Changes in gill superoxide dismutase (SOD) (a), gill SOD value (b), liver SOD (c), liver SOD value (d), red muscle SOD (e), red muscle SOD value (f), white muscle SOD (g) and white muscle SOD value (h) in organs of young yellowfin tuna under acute high–temperature stress. The value is the gap of the experimental group minus the control group. Red means down and green means up. The significantly different between the control group and the HT group was represented by a ▲. Different and the same letters indicate a significant difference (p < 0.05) and insignificant difference (p > 0.05).
Jmse 10 01857 g005
Figure 6. Changes in gill malondialdehyde (MDA) (a), gill MDA value (b), liver MDA (c), liver MDA value (d), red muscle MDA (e), red muscle MDA value (f), white muscle MDA (g) and white muscle MDA value (h) in organs of young yellowfin tuna under acute high–temperature stress. The value is the gap of the experimental group minus the control group. Red means down and green means up. The significantly different between the control group and the HT group was represented by a ▲. Different and the same letters indicate a significant difference (p < 0.05) and insignificant difference (p > 0.05).
Jmse 10 01857 g006
Figure 7. Changes in alkaline phosphatase (a) and alkaline phosphatase value (b) in the liver of young yellowfin tuna under acute high–temperature stress. The value is the gap of the experimental group minus the control group. Red means down and green means up. The significantly different between the control group and the HT group was represented by a ▲. Different and the same letters indicate a significant difference (p < 0.05) and insignificant difference (p > 0.05).
Jmse 10 01857 g007
Publisher’s Note: MDPI stays neutral with regard to jurisdictional claims in published maps and institutional affiliations.

