Article

Growth and Physiological Responses of Chrysotila roscoffensis (Coccolithales) to Different Phosphorus Resources

1
College of Food and Pharmaceutical Sciences, Ningbo University, Ningbo 315211, China
2
Key Laboratory of Applied Marine Biotechnology of Ministry of Education, Ningbo University, Ningbo 315211, China
3
School of Marine Sciences, Ningbo University, Ningbo 315211, China
4
Li Dak Sum Yip Yio Chin Kenneth Li Marine Biopharmaceutical Research Center, Ningbo University, Ningbo 315211, China
*
Author to whom correspondence should be addressed.
These authors contributed equally to this work.
J. Mar. Sci. Eng. 2022, 10(12), 1860; https://doi.org/10.3390/jmse10121860
Submission received: 12 October 2022 / Revised: 17 November 2022 / Accepted: 20 November 2022 / Published: 2 December 2022
(This article belongs to the Section Marine Biology)

Abstract

:
The growth and physiological process of microalgae interact with environmental nutrients. In the present study, we compared the growth and physiological characteristics of coccolithophore Chrysotila roscoffensis under the effects of phosphate at high and low concentrations, and of organic phosphorus of adenosine triphosphate (ATP) and Na2-glycerophosphate (SG). The growth, photosynthesis, calcification, alkaline phosphatase activity, and inorganic nutrient absorption rate were comparatively studied. The results showed that the culture with a low concentration of initial phosphate (6 μM) had a lower growth rate than that with a high concentration (45 μM). However, a relatively similar maximum cell density could be achieved. Equimolar inorganic phosphorus supported a higher initial growth rate than organic phosphorus. ATP was better than SG at supporting higher growth rates, higher photosynthetic activity, and higher cell density. Cellular alkaline phosphatase (AP) responded rapidly to nutrient variations with sharp changes of activities, independent of the initial P resources. Cellular calcification was at a higher level in groups with lower growth rates. Phosphate in low concentration in the medium was not absorbed during the early growth period while that in high concentration was rapidly absorbed. Instead, phosphate in low concentration was rapidly absorbed in the late stationary phase. The absorption of nitrate was affected by the initial P resources as well. The DIN/DIP ratio in the water varied significantly during the growth periods. The results indicated that C. roscoffensis had flexible physiological strategies in utilizing varied phosphorus resources, and high cell density maintenance of C. roscoffensis may play roles in nutrient conditions in the water. This study may help to extend the understanding of nutrient utilization strategy in microalgae and to apply reference in the application of Chrysotila species in the removal of nutrient pollution.

1. Introduction

Phosphorus is one of the most important and vital elements for marine phytoplankton [1]. It has multiple chemical states in natural seawater. The efficiency of phosphorus utilization may vary in different algal species due to the different physiological adaptation and competition strategies [2].
It is commonly considered that, among the different chemical states of phosphorus compounds, dissolved inorganic orthophosphate (DIP) is the preferred resource of phosphorus for microalgae growth [2]. However, dissolved organic phosphates (DOPs) are also important phosphorus resources for microalgae [3]. Previous studies documented that most flagellate taxa grew better when they used dissolved organic phosphates compared to inorganic phosphorus resources [4]. Marine microalgae have the ability to convert organophosphates into inorganic phosphates through the phosphatase pathway [5]. Phosphatases are a group of extracellular enzymes that are bound to the cell surface [6,7]. The broad-spectrum activities of phosphatases make various resources of organic phosphorus substrates available to microalgae for growth [8]. Alkaline phosphatases (AP) are the most studied phosphatase group [9]. This phosphomonoesterase exhibits a high degree of activity in cleaving the ester linkages of organic phosphates to produce bioavailable phosphorus resources. Both inorganic and organic phosphorus conditions affect the activities and gene expressions of alkaline phosphatases [10,11,12].
The presence of different phosphorus chemical states is mostly significant in coastal seawater. Eutrophication in coastal seawater is evident owing to autochthonous cycles, terrestrial inputs, mariculture, and other anthropogenic factors [13,14,15,16]. The multiple resources of phosphorus in coastal ecosystems result in not only asymmetric ratios of N and P but also frequent changes in the compounds, which favor the growth of microbes that respond in a rapid and opportunistic manner [17,18]. In this niche, some microalgal species can obtain advantages by having extra abilities to convert and utilize dissolved organic phosphates. Coccolithophorid species Chrysotile spp. (ex Pleurochrysis genus, [19]), which usually presents in coastal seawaters [20], is suitable for such niches. The algae can develop into dense foaming blooms in estuaries, brackish waters, or mariculture pools and the bloom can last for weeks or months [21]. Such blooms affect not only the organisms but also the chemical element conditions in the water [22,23]. On the other hand, a mass culture of Chrysotila species has been studied and the species as candidates for high-value substances have been proposed because of the high content of carotenoids, polyunsaturated fatty acids, lipids, and calcium [24,25].
Coccolithophores are a group of unicellular microalgae belonging to clade Haptophyta and order Coccolithales, and these marine microalgae distribute throughout the seawaters, from oligotrophic oceanic waters to eutrophic coastal waters, with a generally high abundance, thus they play important roles in the biogeochemical cycle of carbon, nitrogen, and phosphorus as well as in climate-related events [26]. A particular characteristic of coccolithophores is the species-specific shells of calcium carbonate (CaCO3) on the cell surface [27,28]. The cellular calcification changed the concentration of dissolved carbon and lowered the alkalinity and the equilibrium of DOCs in the seawater [29]. The photosynthetic process in coccolithophorid species exerts the opposite effect by converting CO2 to particulate organic carbon. Both processes depend on environmental conditions. Although the roles of coccolithophores in carbon biogeochemical cycles have been extensively studied, the effect of different phosphorus resources on growth and physiological characteristics is not well understood.
Species of the genus Chrysotile usually bloom in coastal mariculture pools [21] where the nutrient condition is changeable and complex [30]. This phenomenon probably indicates that this species has the potential of mass culture in eutrophic waters and the ability to remove nutrient pollutants. The design for the present study was to determine how inorganic and organic phosphorus affect growth, photosynthesis, calcification, alkaline phosphatase activity, and the inorganic nutrient absorption rate of Chrysotile roscoffensis. Batch cultures were tested to determine (1) the growth and physiological responses of C. roscoffensis to different external phosphorus conditions and (2) how the physiological responses affected phosphorus and nitrate conditions in the culture medium. The study may extend the understanding of the algal flexibility in utilizing different phosphorus resources and the roles the algal culture play in nutrient conditions in the medium. The results from this study may help in the management of growing this species for high-value bioproducts and the removal of nutrient pollution in wastewater.

2. Materials and Methods

2.1. Algal Strain

C. roscoffensis was originally isolated from an aquaculture pond located in the tidal flat area of Xiangshan Bay, East China Sea, in 2016. Blooms of Chrysotila species as dominant occurred in the pond where the field sampling was conducted. The isolates were maintained in the Microalgae Collection Center at Ningbo University, Zhejiang, China. The cultures were growing in an f/2-Si medium [31] that was prepared with natural seawater (salinity 20–25 psu, pH 8–8.4). The conditions for the maintenance were 18 °C and under 35 μmol·m−2·s−1 of cool white fluorescent bulb illumination with a dark and light cycle of 12 h:12 h. Unialgal strain (NMBjih026-10) was further isolated by manual cell picking and applied in this study.

2.2. Experimental Design

To acclimate the C. roscoffensis strain to the artificial culture medium before experimentation, the C. roscoffensis culture was inoculated into fresh f/2-Si medium (1/3, v/v) prepared with artificial seawater [32]. The transfers were completed weekly for three weeks. To prepare the cultures for the experiments, acclimated algal cultures at the early stationary phase were inoculated into the medium without adding phosphates for 1 week to perform a phosphorus starvation treatment. To obtain zero phosphorus background, all the flasks were immersed in an HCl solution (0.1 mol/L) for 24 h and were completely washed with double distilled water before use. The cultures prepared for the experiment were made to be axenic by adding antibiotics. The antibiotics were formulated with ampicillin, kanamycin, neomycin, and streptomycin. The working concentration of each antibiotic was 100 μg/mL. The bacteria-free conditions were confirmed by checking bacterial colonies on agar plates (2216E) before the experiment. Freshly prepared artificial seawater solution was used to construct the experimental culture media.
For the DIP experiment, the high concentration group (HDIP) and low concentration group (LDIP) were set at 45 µM and 6 µM respectively by adding KH2PO4 in the culture medium respectively. For the DOP experiment, Na2-glycerophosphate (SG) and adenosine triphosphate (ATP) was used as organic phosphorus resources. Both of the DOP concentrations in the medium were at equimolar phosphorus concentrations in the HDIP groups. The DOP culture medium was formed by adding the respective DOP to the prepared culture medium with a low concentration of KH2PO4. The initial nitrogen concentration in all the experimental groups was set at 120 µM by adding NaNO3 as the nitrogen resource. The other nutrients in the culture medium followed the f/2-Si concentration. All the prepared culture media were sterile-filtered through GF membranes (0.22 µm pore size) before undergoing inoculation.
Aliquots of the C. roscoffensis P-starved culture were inoculated into 500 mL flasks with the different experimental culture media. The final volume of the algal culture was 400 mL. The initial cell density was set at 1.8 × 10⁵ cells/mL. All experiments were conducted in triplicate, and the cultures were grown at 22 °C under 60 μmol·m−2·s−1 of cool white fluorescent bulb illumination with a dark and light cycle of 12 h:12 h.
The cell concentration was measured daily using a hemocytometer. Cell growth rates rt (d−1) were calculated as follows: rt (d−1) = Ln (Ct2/Ct1)/T. C is the cell density at time t2 and t1. T is the time scale between sampling time t2 and t1 (d).

2.3. Oxygen Production and the Chlorophyll Fluorescence Parameters

Oxygen production and chlorophyll fluorescence parameters were measured for the first 2 d and then every other day until the end of the study. The concentrations of dissolved oxygen (DO, µM) were measured by using a Unisense oxygen microsensor (Unisense PA2000, Aarhus, Denmark). The measurement was performed at 2 h after the start of the light period.
Chlorophyll fluorescence parameters, the effective quantum yield of PSII (QY) and Ft, were measured by a PSI fluorometer (AquaPen-C100, Photon System Instruments, Drásov, Czech Republic). QY is the efficiency of photochemical quenching and a proxy of PSII efficiency [33]. It is equal to Fv′/Fm′ when the algal samples are not dark-adapted. Ft represents the steady-state fluorescence intensity. Fv′/Fm′ was measured during the middle of the light period with the light level of growth as the actinic light and was calculated as Fv′/Fm′ = (Fm − Ft)/Fm′, while Fm or Fm′ is the saturation pulse value with or without dark adaptation. Ft was measured only with the measurement light of the fluorometer. For all the measurements, 2 mL of each culture was sampled and measured according to the instruction manual.

2.4. Activity of Cellular Alkaline Phosphatases (AP)

Samples were collected daily for AP activity analysis. Alkaline phosphatase activity was measured based on the spectrophotometric method [34,35,36]. The mechanism of this method is that alkaline phosphatase can cleave the substrate disodium 4-nitrophenyl phosphate (pNPP) into the products paranitrophenol (NPP) and phosphate. NPP has a maximum absorption at 405 nm. Thus, AP activity can be calculated based on the regression curve of the OD405nm and the hydrolyzed NPP product.
In the present study, the cellular AP activity measurements were performed briefly according to the following process: 1 mL of each algal culture was sampled and centrifuged at 4 °C and 6000 rpm for 3 min. Supernatants were discharged, the algal pellets were resuspended in 1 mL of Tris-HCl (pH = 8.2), and the cells were ultrasonically broken for 2 min. All suspension solutions were centrifuged at 6000 rpm for 3 min at 4 °C. Two hundred µL of the supernatant was transferred into a well of a 96-well plate. 10 mL of pNPP (Sigma-Aldrich, Shanghai, China) was added to the well and cultivated for 1 h at 37 °C in the dark. To stop the reaction, 10 mL of 0.2 N NaOH was added to the well. The fluorescent signal (F) was measured by a microplate reader (Varioskan Flash, Thermo Scientific, Lenexa, KS, USA) at 405 nm. 10 mL of distilled water without pNPP was used as a control, and the fluorescence value (F0) was measured. ΔF(F − F0) was converted into the concentration of NPP utilizing the calibration curve. The calibration curve was prepared by diluting NPP Tris-HCL solution (10 mM, pH = 8.2) into a series of different concentrations, and the fluorescent signals of the solutions were measured at 405 nm. In the present study, one AP (U) enzymatic activity unit was considered as 1 µg of NPP released by AP in 1 h per million cells.

2.5. Cellular Calcification

Relative variations in cellular calcification were detected by measuring the changes in Ca2+ concentration in the solutions from decalcifying cells. The measurement was performed on the same day that oxygen production and chlorophyll fluorescence parameters were checked. To decalcify the cells, 2 mL of each culture was centrifuged at 5000 rpm for 5 min at 4 °C to collect the algal cells. Then, the supernatants were discharged and the cell pellets were added to 1 mL of an MES/NaOH solution (0.5 mol/L, pH 5.5) (Sigma-Aldrich, China), thoroughly mixed and maintained for 2 h to dissolve CaCO3 crystals on the cell surface. The solutions were further centrifuged at 5000 rpm for 5 min at 4 °C, and 200 μL of each supernatant was added to wells of 96-well fluorescent plates. 10 mL of 0.2 mM Fluo 3-AM (Sigma-Aldrich, China), a probe for calcium ions in the solutions, was added to each supernatant sample. The solutions were incubated in dark for 30 min at 25 °C to label calcium ions. The decalcified cell pellets were confirmed by microscopy. The fluorescence intensity (F) of the labeled calcium ion solution was measured by a microplate reader (Varioskan Flash, Thermo Scientific). The control (F0) was performed by adding 10 µL of deionized water instead of Fluo 3-AM into 200 μL of the supernatant. The excitation wavelength was 488 nm, and the emission wavelength was 526 nm. The relative degree of extracellular calcification was evaluated by calculation of ΔF(F − F0) per ten thousand cells.

2.6. Variations of Nitrate and Phosphate Concentration in the Water

The cultures (5 mL) were collected daily and centrifuged at 6000 rpm for 10 min. The supernatants were stored at −20 °C for further analysis of nitrate and phosphate concentrations. The concentrations were simultaneously measured using a Smartchem 200 Discrete Auto Analyzer (AMS, Pavia, Italy) according to the manufacturer’s protocol.
The daily decrease ratios of nitrate and phosphate (%·d−1) in the medium were calculated as follows:
RN% = [(Nt1 − Nt2)/Nt1]/T·100%, while RN% is the relative decrease ratio of nitrate from time t1 to time t2 (d); Nt1 and Nt2 are the nitrate concentrations at time t1 and t2 (d); T is the time scale between sampling time t1 and t2 (d).
RP% = [(Pt1 − Pt2)/Pt1]/T·100%, while RP% was the relative decrease ratio of phosphate from time t1 to time t2 (d); Pt1 and Pt2 were the phosphate concentrations at time t1 and t2 (d); T was the time scale between sampling time t1 and t2 (d).

2.7. Data Analysis

Data obtained from the experiments were averages of three replicates and the variance was standard deviation. The significance of the difference was assessed by Student’s t-test using SPSS 26.0 (SPSS Incorporation, Chicago, IL, USA) software. p < 0.05 was considered statistically significant.

3. Results

3.1. Population Growth

The growth process, growth rate, and maximum cell density were affected by the initial phosphorus resources in the batch cultures (Figure 1). All the cultures grew immediately after being inoculated and did not have a lag phase (Figure 1). In the two DIP groups (Figure 1A), the HDIP group reached the stationary phase at 3 d, the LDIP group reached the stationary phase at 5 d. In the two DOP groups (Figure 1B), the ATP group continued growing without an obvious stationary phase, while the SG group reached the stationary phase at 3 d.
In the two DIP groups (Figure 1A), the initial growth rate (0.56 day−1) in HDIP was significantly higher than that in LDIP. The cell density in HDIP was significantly higher at the early growth phase (1–4 d). It kept higher than that in LDIP at the stationary phase, however, no statistical significance existed (p > 0.05). In the two DOP groups (Figure 1B), the initial growth rates between the two groups were relatively the same (p > 0.05). However, the growth rate in the SG group decreased at 4 d. The cell densities in the ATP group were significantly higher than those in the SG group since 4 d (p < 0.05). The ATP group had the highest growth potential for a longer growth period among all the experimental groups, and it reached the highest maximum cell density at the end of the experiment (Figure 1).

3.2. Variations in the Chlorophyll Fluorescence Parameters and Oxygen Production

The chlorophyll fluorescence parameters Ft and QY varied during growth and were different, as the patterns were affected by the initial phosphorus conditions (Figure 2). Ft increased during the growth period in both DIP and DOP groups (Figure 2A,B). In the stationary phase, Ft in the LDIP and SG groups was lower than that in the HDIP and ATP groups, respectively (Figure 2A,B). For the first two days, Ft in both DIP groups did not significantly change (Figure 2A). However, in the two DOP groups (Figure 2B), Ft in the ATP group significantly increased at 2 d and remained significantly higher than that in the SG groups until the end of the experiment.
QY decreased during the growth period in all the groups (Figure 2C,D). There were no significant differences between the two DIP groups until 8 d when QY in HDIP was higher than in LDIP (Figure 2C). The difference in QY between the two DOP groups was significant after 2 d. In the ATP group, QY remained higher than that in SG during the population growth period (Figure 2D).
The dissolved oxygen concentration in the culture medium varied differently during the growth in the four groups (Figure 3A,B).
In the DIP groups (Figure 3A), the concentration in HDIP increased from 391.7 µM at 1 d to 441.9 µM at 2 d and remained the same until day 6 (p > 0.05). The concentration increased to 481.7 µM at 8 d. The concentration in LDIP decreased at 4 d and 6 d but increased at 8 d to 361.7 µM. The concentration in LDIP remained at a lower level than that in HDIP during the growth period (Figure 3A). In the two DOP groups (Figure 3B), the concentration at 2 d slightly increased to 428.9 µM in both DOP groups. The concentration remained at the same average level of 421.9 µM after 2 d in the SG group. The concentration in the ATP group increased significantly to 538.7 µM at 4 d and remained statistically the same at 6 d and 8 d (p > 0.05).

3.3. Algal Alkaline Phosphatase (AP) Activity Variations

The activity of AP varied during the growth in both the DIP and DOP groups (Figure 4).
By comparing the activities of AP in the first two days, the AP activities at 2 d were observed to increase significantly in all the experimental groups (Figure 4). In the first two days, the AP activities were the same without a significant difference (p > 0.05) among the groups (p > 0.05) (Figure 4). In all groups, the activities of AP starting at 3 d showed the same variation trends as follows: the activities decreased from the highest (2 d) to the lowest point (except for 1 d) and then increased again (Figure 4).
AP activities in LDIP and SG increased until 5 d and returned to the same highest level as that at 2 d (Figure 4A,B). The activities maintained the same high levels without significantly changing until the end of the experiment (p > 0.05).
AP activities in HDIP and ATP were relatively lower than that in LDIP and SG, respectively, during the stationary phase (5–7 d). The AP activities in both of these groups continued to increase during the late stationary phase and reached the same level as LDIP or SG.

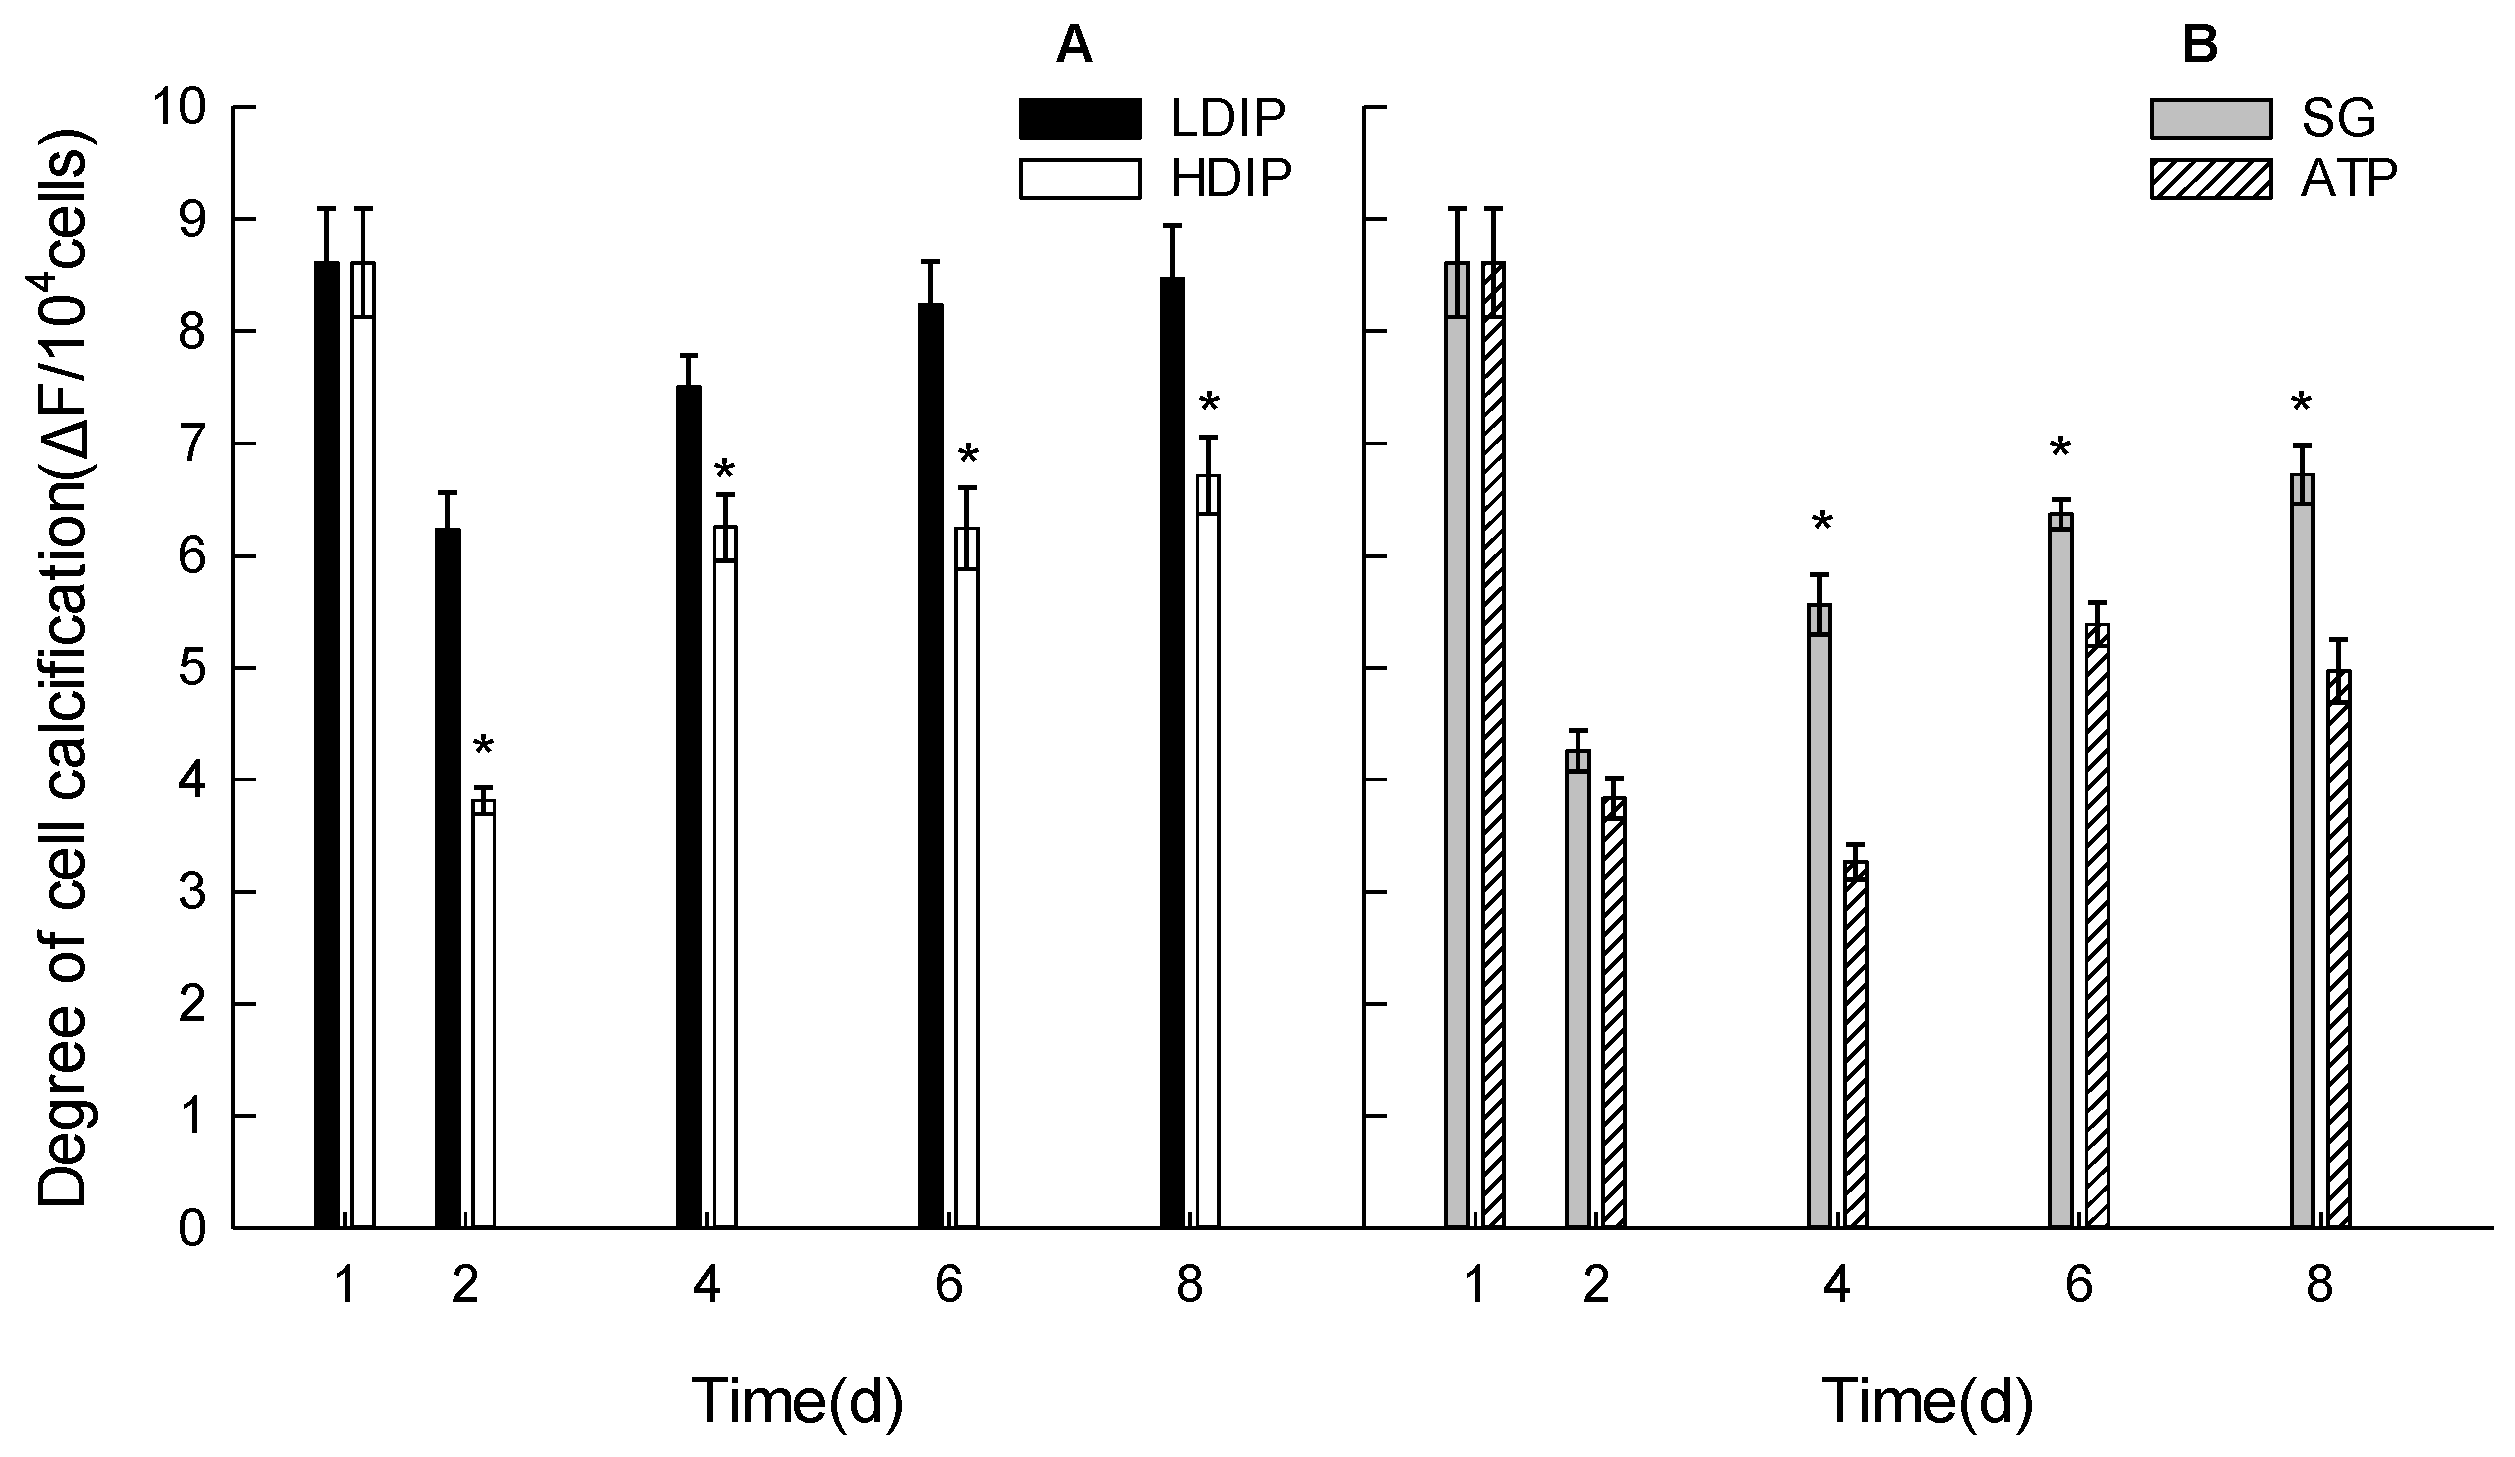
3.4. Extracellular Calcification Variations

Extracellular calcification varied during the growth and differed among the different groups (Figure 5A,B).
In the two DIP groups, the calcification level significantly decreased from the highest initial level (1 d) to the lowest level (2 d) in the LDIP and HDIP groups (Figure 5A). The calcification level increased thereafter at 4, 6, and 8 d and finally returned to the same level as that at 1 d. The calcification level in HDIP was significantly lower than that in LDIP.
In the two DOP groups, the calcification level also significantly decreased at 2 d (Figure 5B). The level in the SG group was higher than that in the ATP group after 2 d (Figure 5B). The level steadily increased from 2 d to 8 d in the SG group, while in the ATP group, the level decreased further at 4 d and then increased back to higher levels (Figure 5B). However, the calcification level in the DOP groups did not increase back to the same level as that at 1 d.

3.5. Variation in Nitrate and Phosphate Concentrations and the N/P Ratio in the Water

The variation in nitrate and phosphate concentrations in the medium depended on both the growth phase and the initial phosphorus resources (Figure 6).
For the two DIP groups, there was no significant difference in nitrate concentration until 5 d. At the late stationary phase (6–9 d), the nitrate concentration in HDIP was significantly lower than that in LDIP (p < 0.05) (Figure 6A).
For the two DOP groups, the initial nitrate concentration was statistically the same. However, the nitrate concentration in the SG group was significantly lower than that in the ATP group starting at 5 d (Figure 6B).
The concentration of phosphate in HDIP decreased from 46.7 μM to the same level as that in the LDIP group (5.7 μM) at 4 d and continued to decrease until 7 d when the phosphate concentration was the same as that in LDIP (Figure 6C) (3.0 μM). The phosphate concentration in LDIP did not significantly change until 6 d (p > 0.05) (Figure 6C); the concentration decreased significantly at 7, 8, and 9 d and to a final concentration of 1.2 µM (Figure 6C).
In the two DOP groups (Figure 6D), the phosphate concentration did not change in the SG group until day 4. The concentration decreased significantly (p < 0.05) at 5 d and reached a final concentration of 1.8 µM. In the ATP group, the phosphate concentration decreased by 23% to 5.9 µM from the initial concentration at 2 d. It oscillated around an average level of 6.4 µM until 5 d. The concentration also decreased significantly after 5 d and reached a final concentration of 2.3 µM (Figure 6D).
The daily decrease ratio of nitrate and phosphate varied depending on the initial phosphorus condition and the growth period. In the two DIP groups (Figure 7A), the relative daily decrease ratio of nitrate changed from 10.5 to 22.4%·d−1 in the LDIP group during the population growth stage. The ratios changed from 9.5 to 40.0%·d−1 in the HDIP group. There was no significant difference between the two DIP groups except for the ratio at 7 d, while the ratio in the HDIP group was higher than that in the LDIP group (p < 0.05).
For the nitrate absorption in the two DOP groups (Figure 7B), the daily decrease ratios of nitrate in the SG groups averaged 22.1%·d−1 during the population growth period. The ratios in the ATP group averaged in 14.7%·d−1. The ratio in the SG group was higher than that in the ATP group, even though there was no significance (p > 0.05).
For the phosphate absorption, in the two DIP groups (Figure 7C), the daily decrease ratios changed from 63.1 to 12.2%·d−1 in the HDIP group during the growth (Figure 7C). The ratios in the LDIP group changed from −7.9 to 41.1%·d−1. The variation trends in both the HDIP and LDIP groups were statistically significant (p < 0.05) (Figure 7C). In the two DOP groups (Figure 7D), the ratios in the SG group were −0.9 to −3.0%·d−1 before 4 d. The ratios increased to 23.5%·d−1 at 5 d and remained at a relatively high level (averaged 24.1%·d−1) until the end of the experiment. The ratios in the ATP group varied sharply during the growth period (Figure 7D) but showed the highest value (43.8%·d−1) at 7 d.
The DIN:DIP ratio in the medium varied during the growth period and was affected by the initial phosphorus conditions (Figure 8). In the HDIP group, the ratio increased until 4 d, remained constant until 6 d, and decreased at 8 d. The maximum ratio did not exceed the Redfield ratio (RR, 16:1) (Figure 8A). In the LDIP group, the ratio decreased from 22.6 to 13.0 until 6 d and gradually increased to 27.5 at 9 d (Figure 8A).
In the two DOP groups, the ratios did not change at 1 and 2 d (Figure 8B), and the average was 15.2. The ratio decreased significantly at 3 d in the SG group and remained constant without significant changes from 4 d until the end of the experiment (average 8.8). In the ATP group, the lowest ratio (9.2) appeared at 5 d. The ratios in DOP did not statistically exceed RR (Figure 8B).

4. Discussion

4.1. Population Growth

When compared with the DIP and DOP groups with equimolar concentrations of phosphorus, DIP supported significantly higher initial growth than that of DOP. This probably indicated that microalgae prefer DIP to DOP for growth [2]. Microalgae have different potentials for growth on different organic phosphorus [8]. The ability to use different phosphorus resources was species- or strain-dependent [37]. Our results showed that, when compared with equimolar inorganic phosphorus groups, C. roscoffensis not only used organic phosphorus SG and ATP, but also had similar or longer growth periods and achieved higher cell density. ATP showed to be a premium phosphorus resource for C. roscoffensis by supporting longer growth periods and by achieving the highest maximum final cell density. Coccolithophores usually bloom after other blooms and their blooms may maintain for a long time [22]. Species of the genus Chrysotila mostly distribute and bloom in coastal areas, particularly in land-based aquaculture pools, where both inorganic and organic substances can lead to eutrophication [38,39]. When ATP and other organic substances are released from dead or stressed organisms, they may serve as nutrient resources for the coccolithophores.
The culture of the LDIP group had the lowest initial growth rate and the lowest maximum cell density. However, after the delayed initial growth, the LDIP group was able to reach a cell density that was almost equal to the HDIP concentration group. This phenomenon suggested that when other nutrients were freshly available from the ambient environment, C. roscoffensis could grow into blooms even when the ambient phosphorus level was limited [1,40]. It probably was one of the reasons that the bloom in the field was able to maintain for a long time. On the other hand, however, the stable maintenance of high biomass probably is an advantage of the candidate species in the mass culture.

4.2. Nitrate and Phosphate Variations in the Water

The absorption of phosphate showed an obvious dependence on the initial phosphorus conditions. An initial high concentration of DIP was absorbed in the highest ratio. When the initial DIP concentration was as low as that in the LDIP and the two DOP groups, there was no obvious phosphate decrease during the early growth period. However, further DIP absorptions occurred in the late period of the stationary phase. During this period, the DIP absorption ratio increased significantly. Luxury absorption of phosphorus was widely found in coccolithophorid species [29]. Previous studies show that some species can increase DIP transport capacity under DIP-limiting conditions, leading to the internal P reserves being rapidly filled and rapid DIP depletion [41]. From our study, the following luxury phosphate absorption types occurred during the growth period: rapid DIP absorption when phosphate resource was abundant (in the HDIP group) and further DIP absorption of the residual phosphorus, which probably occurred when other phosphorus resources were depleted (in the LDIP and two DOP groups). In the groups of low DIP concentration, further DIP absorption occurred at relatively the same time when AP activities increased. The intracellular nutrient condition probably reached a similar P-limiting condition. While used as a promising biofactory to produce high-valued bioproducts, microalgae are applied in the deep purification of eutrophic wastewater [42,43]. The coccolithophore C. roscoffensis probably is one of the candidates with the ability to utilize various P resources for growth and to remove nutrient pollution from the wastewater.
For aquatic microalgae, both the concentration of N and P and the N/P ratio are important factors [44,45]. In the present study, both the N/P ratio and the variation pattern changed during the population growth period under the effect of different initial phosphorus states. Nitrogen and phosphorus are two essential elements for living organisms [1]. While the nitrate concentration was high, but the DIP concentration was low, C. roscoffensis tended to not use “rare” DIP in the medium. However, when both nitrate and phosphate concentrations were low, as in the late stationary phase, the phosphate with initial low concentrations was absorbed. This result showed that nitrate concentration also plays a role in the utilization of different phosphorus resources. For applications of microalgae in the removal of nutrients from wastewater, the original condition of nutrient composition may be one of the factors that determine the efficiency.

4.3. AP Activity

The most studied APs are part of a group of extracellular enzymes that bind to cell surfaces [6,7,36]. AP enzymes can also exist inside cells [46] or can be released into the culture medium [47,48]. Microalgae AP enzymes are species-specific or strain-dependent [49]. Previously, we lacked knowledge of how the AP enzymes of C. roscoffensis were located intracellularly or extracellularly. However, in the present study, the bulk AP activity of the C. roscoffensis culture was followed during the population growth period.
During the early growth phase after inoculation, the AP activity changed drastically, and the extent of changes was the same in all the groups. The cells were P-starvation treated in the pre-culture. AP activity surge at 2 d was probably caused by the initial high concentration of nitrate as well as by the pretreatment of P-starvation. The intracellular conditions in different groups were probably at equal P-limiting when the same amount of nitrate was absorbed. The similar increases in AP activity at 2 d showed that the initial different phosphorus resources in the medium did not play a role in this variation. However, the influence of initial phosphorus resources became relevant at the later growth phase, while the LDIP and SG groups had overall higher AP activities than that of the HDIP and ATP groups, respectively. The activity of AP is an important regulatory factor that influences the growth and phenotype of microalgae [50]. C. roscoffensis displayed rapid growth immediately after inoculation at 1 d. The abrupt increase in AP activity at 2 d probably indicated that inorganic phosphorus is extremely necessary for rapid early growth. The level of AP activity reflects the nutrient condition of the microalgae [51,52]. At the end of the experiment, when the phosphate concentration was very low in all the groups, the AP activity in the HDIP or ATP group increased to the same level as that in the LDIP or SG groups. It probably shows that, at this time, the cells in the culture from different initial P conditions reached a similar intracellular nutrient condition.
Most flagellates had better growth using DOP resources than using DIP resources [4]. The broad-spectrum activities of AP enable the availability of various resources of organic phosphorus substrates for the growth of microalgae [8]. When DOP was repleted, but DIP was low, C. roscoffensis did not use phosphate in the SG groups. ATP showed higher bioavailability than that of SG for C. roscoffensis. The phosphate concentration in the ATP group oscillated significantly. This result also showed that DOP composition in the water may influence the DIP level through microalgal nutrient metabolism, especially in the condition of low DIP concentration.

4.4. Photosynthetic Activity and Cellular Calcification

Both the calcification and photosynthesis of coccolithophores are affected by environmental nutrient conditions [53]. It is the balance between calcification (coccolith formation) and photosynthesis (organic carbon formation) that determined the growth of coccolithophores as net sinks of CO2 or net sources of CO2. In the present study, the different phosphorus conditions affected the two physiological activities. When comparing the two DIP groups, low phosphate resources caused lower oxygen production throughout the growth. The Ft value in the LDIP groups was lower than that in the HDIP groups. The lower oxygen concentration in the LDIP groups was probably because of the lower chlorophyll concentration. The same scenario was observed when comparing the two DOP groups in which the oxygen concentration and Ft value in the ATP group were higher than those in the SG group.
QY value decreased with the growth, indicating that the actual capture efficiency of the primary light energy of PSII decreased when the culture grew into the stationary phase. There was no significant difference between the two DIP groups, showing that these two initial phosphate resources played no significant role in the efficiency of PSII. This might be one of the reasons that this algal species had the potential to grow to relatively high cell density in the low phosphorus concentration group. However, the efficiency of PSII in the ATP group remained significantly higher than that in the SG group. ATP is a universal energy compound in living organisms. There is a significantly high content of dissolved free ATP in aquatic ecosystems [54]. In the light-dependent reactions of photosynthesis, ATP powers the Calvin cycle [55]. For phototrophic microalgae such as C. roscoffensis, extracellular ATP probably plays roles not only in supplying organic phosphorus but also in maintaining the high efficiency of PSII.
The nutritional condition inside or outside the algal cells may induce morphometric changes [37]. Cellular calcification was observed to be affected by the initial phosphorus conditions. For both the DIP and DOP groups, the samples that had a lower growth rate and lower photosynthetic activity had a higher degree of extracellular calcification. This phenomenon was the same as the observations in previous studies that examined other environmental stress factors [37,56]. In other words, the bioproduct of calcium from the algal culture was affected by the nutritional condition in the water.

5. Conclusions

The natural niche that the coccolithophore C. roscoffensis occupied enables this species the flexibility in utilizing varied resources of phosphorus, both organic and inorganic, abundant or rare. The ability of C. roscoffensis to respond rapidly to changes in phosphorus resources, and maintains high cell density for a long time, probably benefits from its high activity of alkaline phosphatases, flexible photosynthetic activity, and luxury phosphorus absorption. The flexible phosphorus utilization strategies in C. roscoffensis are carried out both in the period of rapid growth and high cell density maintenance. In the meanwhile, different organic phosphorus compositions in the culture water probably will affect the absorption of inorganic phosphorus resources. The intracellular changes of nutrient elements or the valued bioproducts under the effect of different nutrient conditions are worthy of further research.

Author Contributions

Conceptualization, L.Z., P.X. and C.Z.; methodology, L.Z. and P.X.; software, P.X. and B.L.; validation, J.H., Y.L. and C.Z.; formal analysis, P.X. and B.L.; investigation, B.L.; resources, L.Z. and B.L.; data curation, C.Z.; writing—original draft preparation, L.Z. and P.X.; writing—review and editing, C.Z.; visualization, C.Z.; supervision, C.Z.; project administration, C.Z.; funding acquisition, C.Z. All authors have read and agreed to the published version of the manuscript.

Funding

This research was funded by [the National Science and Technology Basic Resources Investigation Program of China] grant number [2018FY100206], [State Key Laboratory of Marine Geology, Tongji University] grant number [MGK202013], [Ningbo Science and Technology Research Projects, China] grant number [2019B10006; 2019C10023]. And The APC was funded by [2018FY100206].

Institutional Review Board Statement

Not applicable.

Informed Consent Statement

Not applicable.

Data Availability Statement

The datasets generated during and/or analyzed during the current study are available from the corresponding author upon reasonable request.

Acknowledgments

We would like to thank all the reviewers for their constructive comments and suggestions.

Conflicts of Interest

The authors declare no conflict of interest.

References

  1. Lin, S.J.; Litaker, R.W.; Sunda, W.G. Phosphorus physiological ecology and molecular mechanisms in marine phytoplankton. J. Phycol. 2016, 52, 10–36. [Google Scholar] [CrossRef] [PubMed]
  2. Cembella, A.D.; Antia, N.J.; Harrison, P.J. The utilization of inorganic and organic phosphorous compounds as nutrients by eukaryotic microalgae: A multidisciplinary perspective: Part I. Crit. Rev. Microbiol. 1982, 10, 317–391. [Google Scholar] [CrossRef] [PubMed]
  3. Benitez-Nelson, C.R.; Karl, D.M. Phosphorus cycling in the North Pacific Subtropical Gyre using cosmogenic 32P and 33P. Limnol. Oceanogr. 2002, 47, 762–770. [Google Scholar] [CrossRef] [Green Version]
  4. Wang, Z.H.; Liang, Y.; Kang, W. Utilization of dissolved organic phosphorus by different groups of phytoplankton taxa. Harmful Algae 2011, 12, 113–118. [Google Scholar] [CrossRef]
  5. Ghyoot, C.; Gypens, N.; Flynn, K.J.; Lancelot, C. Modelling alkaline phosphatase activity in microalgae under orthophosphate limitation: The case of Phaeocystis globosa. J. Plankton Res. 2015, 37, 869–885. [Google Scholar] [CrossRef] [Green Version]
  6. Ammerman, J.W. Role of Ecto-phosphohydrolases in phosphorus regeneration in estuarine and coastal ecosystems. In Microbial Enzymes in Aquatic Environments; Springer: New York, NY, USA, 1991; pp. 165–186. [Google Scholar]
  7. Tiwari, B.; Singh, S.; Kaushik, M.S.; Mishra, A.K. Regulation of organophosphate metabolism in cyanobacteria. A review. Microbiology 2015, 84, 291–302. [Google Scholar] [CrossRef]
  8. Xie, E.; Su, Y.P.; Deng, S.Q.; Kontopyrgou, M.; Zhang, D.Y. Significant influence of phosphorus resources on the growth and alkaline phosphatase activities of Microcystis aeruginosa. Environ. Pollut. 2021, 268, 115807. [Google Scholar] [CrossRef]
  9. Xie, C.S.; Lu, R.J.; Huang, Y.; Wang, Q.; Xu, X.H. Effects of ions and phosphates on alkaline phosphatase activity in aerobic activated sludge system. Bioresour. Technol. 2010, 101, 3394–3399. [Google Scholar] [CrossRef]
  10. Willsky, G.R.; Bennett, R.L.; Malamy, M.H. Inorganic phosphate transport in Escherichia coli: Involvement of two genes which play a role in alkaline phosphatase regulation. J. Bacteriol. 1973, 113, 529–539. [Google Scholar] [CrossRef] [Green Version]
  11. Nausch, M. Alkaline phosphatase activities and the relationship to inorganic phosphate in the Pomeranian Bight (southern Baltic Sea). Aquat. Microb. Ecol. 1998, 16, 87–94. [Google Scholar] [CrossRef]
  12. Shi, X.L.; Qian, S.Q.; Kong, F.X.; Zhang, M.; Yu, Y. Differences in growth and alkaline phosphatase activity between Microcystis aeruginosa and Chlorella pyrenoidosa in response to media with different organic phosphorus. J. Limnol. 2011, 70, 21–25. [Google Scholar] [CrossRef]
  13. Bopp, L.; Resplandy, L.; Orr, J.C.; Doney, S.C.; Dunne, J.P.; Gehlen, M.; Halloran, P.; Heinze, C.; Ilyina, T.; Séférian, R.; et al. Multiple stressors of ocean ecosystems in the 21st century: Projections with CMIP5 models. Biogeosciences 2013, 10, 6225–6245. [Google Scholar] [CrossRef] [Green Version]
  14. Wu, H.; Peng, R.H.; Yang, Y.; He, L.; Wang, W.Q.; Zheng, T.L.; Lin, G.H. Mariculture pond influence on mangrove areas in south China: Significantly larger nitrogen and phosphorus loadings from sediment wash-out than from tidal water exchange. Aquaculture 2014, 426, 204–212. [Google Scholar] [CrossRef]
  15. Deininger, A.; Frigstad, H. Reevaluating the role of organic matter sources for coastal eutrophication, oligotrophication, and ecosystem health. Front. Mar. Sci. 2019, 6, 210. [Google Scholar]
  16. Wang, Y.J.; Liu, D.Y.; Xiao, W.P.; Zhou, P.; Tian, C.G.; Zhang, C.S.; Du, J.Z.; Guo, H.; Wang, B.D. Coastal eutrophication in China: Trend, sources, and ecological effects. Harmful Algae 2021, 107, 102058. [Google Scholar] [CrossRef]
  17. Karl, D.M.; Björkman, K.M. Phosphorus cycle in seawater: Dissolved and particulate pool inventories and selected phosphorus fluxes. Methods Microbiol. 2001, 30, 239–270. [Google Scholar]
  18. Billen, G.; Garnier, J.; Rousseau, V. Nutrient fluxes and water quality in the drainage network of the Scheldt basin over the last 50 years. Hydrobiologia 2005, 540, 47–67. [Google Scholar] [CrossRef]
  19. Andersen, R.A.; Kim, J.I.; Tittley, I.; Yoon, H.S. A re-investigation of Chrysotila (Prymnesiophyceae) using material collected from the type locality. Phycologia 2014, 53, 463–473. [Google Scholar] [CrossRef]
  20. Fukuzaki, K.; Imai, I.; Fukushima, K.; Ishii, K.I.; Sawayama, S.; Yoshioka, T. Fluorescent characteristics of dissolved organic matter produced by bloom-forming coastal phytoplankton. J. Plankton Res. 2014, 36, 685–694. [Google Scholar] [CrossRef] [Green Version]
  21. Zhou, C.X.; Jiang, Y.; Liu, B.N.; Yan, X.J.; Zhang, W.D. The relationship between calcification and photosynthesis in the coccolithophorid Pleurochrysis carterae. Acta Ecol. Sin. 2012, 32, 38–43. [Google Scholar] [CrossRef]
  22. Reifel, K.M.; McCoy, M.P.; Tiffany, M.A.; Rocke, T.E.; Trees, C.C.; Barlow, S.B.; Faulkner, D.J.; Hurlbert, S.H. Pleurochrysis pseudoroscoffensis (Prymnesiophyceae) blooms on the surface of the Salton Sea, California. Hydrobiologia 2001, 466, 177–185. [Google Scholar] [CrossRef]
  23. Bautista-Chamizo, E.; De Orte, M.R.; DelValls, T.Á.; Riba, I. Simulating CO2 leakages from CCS to determine Zn toxicity using the marine microalgae Pleurochrysis roscoffensis. Chemosphere 2016, 144, 955–965. [Google Scholar] [CrossRef] [PubMed]
  24. Maria, P.; Evgeniy, G.; Boris, S.; Nikita, Z.; Anna, M.; Alla, F.; Maxim, K.; Yevhen, M.; Ilia, Y.; Elena, G.; et al. Fucoxanthin production by heterokont microalgae. Algal Res. 2017, 24, 387–393. [Google Scholar]
  25. Moheimani, N.R.; Webb, J.P.; Borowitzka, M.A. Bioremediation and other potential applications of coccolithophorid algae: A review. Algal Res. 2012, 1, 120–133. [Google Scholar] [CrossRef]
  26. Young, J.R. Functions of coccoliths. In Coccolithophores; Winter, A., Siesser, W.G., Eds.; Cambridge University Press: Cambridge, UK, 1994; pp. 63–82. [Google Scholar]
  27. De Vrind-de Jong, E.W.; Borman, A.H.; Thierry, R.; Westbroek, P.W.; Cruter, M.; Kanerling, J.P. Calcification in the coccolithophorids Emiliania huxleyi and Pleurochrysis carterae II. Biochem. Aspects. In Bioremediation in Lower Plants and Animals; Leadbeater, B.S.C., Ed.; Clarendon Press: Oxford, UK, 1986; pp. 205–217. [Google Scholar]
  28. Siesser, W.G. Historical background of coccolithophore studies. In Coccolithophores; Winter, A., Siesser, W.G., Eds.; Cambridge University Press: Cambridge, UK, 1994; pp. 51–62. [Google Scholar]
  29. Rost, B.; Riebesell, U. Coccolithophores and the biological pump: Responses to environmental changes. In Coccolithophores; Springer: Berlin, 2004; pp. 99–125. [Google Scholar]
  30. Kang, P.P.; Xu, S.G. The impact of mariculture on nutrient dynamics and identification of the nitrate sources in coastal waters. Environ. Sci. Pollut. Res. 2016, 23, 1300–1311. [Google Scholar] [CrossRef] [PubMed]
  31. Guillard, R.R. Culture of phytoplankton for feeding marine invertebrates. In Culture of Marine Invertebrate Animals; Springer: Boston, MA, USA, 1975; pp. 29–60. [Google Scholar]
  32. Harrison, P.J.; Waters, R.E.; Taylor, F.J.R. A broad spectrum artificial sea water medium for coastal and open ocean phytoplankton. J. Phycol. 1980, 16, 28–35. [Google Scholar] [CrossRef]
  33. Roháček, K. Chlorophyll fluorescence parameters: The definitions, photosynthetic meaning, and mutual relationships. Photosynthetica 2002, 40, 13–29. [Google Scholar] [CrossRef]
  34. Fitzgerald, G.P.; Nelson, T.C. Extractive and enzymatic analyses for limiting or surplus phosphorus in algae. J. Phycol. 1975, 11, 32–37. [Google Scholar] [CrossRef]
  35. Hadas, O.; Pinkas, R. Arylsulfatase and alkaline phosphatase (Apase) activity in sediments of Lake Kinneret, Israel. In The Interactions Between Sediments and Water; Springer: Dordrecht, The Netherlands, 1997; pp. 671–679. [Google Scholar]
  36. Xu, Y.; Wahlund, T.M.; Feng, L.; Shaked, Y.; Morel, F.M. A novel alkaline phosphatase in the coccolithophore Emiliania huxleyi (Prymnesiophyceae) and its regulation by phosphorus. J. Phycol. 2006, 42, 835–844. [Google Scholar] [CrossRef]
  37. Oviedo, A.M.; Langer, G.; Ziveri, P. Effect of phosphorus limitation on coccolith morphology and element ratios in Mediterranean strains of the coccolithophore Emiliania huxleyi. J. Exp. Mar. Biol. Ecol. 2014, 459, 105–113. [Google Scholar] [CrossRef]
  38. Godrijan, J.; Young, J.R.; Marić Pfannkuchen, D.; Precali, R.; Pfannkuchen, M. Coastal zones as important habitats of coccolithophores: A study of species diversity, succession, and life-cycle phases. Limnol. Oceanogr. 2018, 63, 1692–1710. [Google Scholar] [CrossRef] [Green Version]
  39. Kim, J.; Kim, Y.; Park, S.E.; Kim, T.; Kim, B.; Kang, D.J.; Rho, T. Impact of aquaculture on distribution of dissolved organic matter in coastal Jeju Island, Korea, based on absorption and fluorescence spectroscopy. Environ. Sci. Pollut. Res. 2022, 29, 553–563. [Google Scholar] [CrossRef] [PubMed]
  40. Dyhrman, S.T.; Ruttenberg, K.C. Presence and regulation of alkaline phosphatase activity in eukaryotic phytoplankton from the coastal ocean: Implications for dissolved organic phosphorus remineralization. Limnol. Oceanogr. 2006, 51, 1381–1390. [Google Scholar] [CrossRef]
  41. Riegman, R.; Stolte, W.; Noordeloos, A.A.; Slezak, D. Nutrient uptake and alkaline phosphatase (EC 3:1:3:1) activity of Emiliania huxleyi (Prymnesiophyceae) during growth under N and P limitation in continuous cultures. J. Phycol. 2000, 36, 87–96. [Google Scholar] [CrossRef]
  42. Li, D.; Liu, R.Q.; Cui, X.Y.; He, M.L.; Zheng, S.Y.; Du, W.J.; Gao, M.; Wang, C.H. Co-culture of bacteria and microalgae for treatment of high concentration biogas slurry. J. Water Process Eng. 2021, 41, 102014. [Google Scholar] [CrossRef]
  43. Xin, C.H.; Addy, M.M.; Zhao, J.Y.; Cheng, Y.L.; Cheng, S.B.; Mu, D.Y.; Liu, Y.H.; Ding, R.J.; Chen, P.; Ruan, R. Comprehensive techno-economic analysis of wastewater-based algal biofuel production: A case study. Bioresour. Technol. 2016, 211, 584–593. [Google Scholar] [CrossRef] [Green Version]
  44. Stockner, J.G.; Shortreed, K.S. Response of Anabaena and Synechococcus to manipulation of nitrogen: Phosphorus ratios in a lake fertilization experiment. Limnol. Oceanogr. 1988, 33, 1348–1361. [Google Scholar] [CrossRef]
  45. Cuvin-Aralar, M.L.; Focken, U.; Becker, K.; Aralar, E.V. Effects of low nitrogen-phosphorus ratios in the phytoplankton community in Laguna de Bay, a shallow eutrophic lake in the Philippines. Aquat. Ecol. 2004, 38, 387–401. [Google Scholar] [CrossRef]
  46. Zhang, T.X.; Lu, X.R.; Yu, R.D.; Qin, M.Y.; Wei, C.; Hong, S.J. Response of extracellular and intracellular alkaline phosphatase in Microcystis aeruginosa to organic phosphorus. Environ. Sci. Pollut. Res. 2020, 27, 42304–42312. [Google Scholar] [CrossRef]
  47. Chiaudani, G.; Vighi, M. Multistep approach to identification of limiting nutrients in Northern Adriatic eutrophied coastal waters. Water Res. 1982, 16, 1161–1166. [Google Scholar] [CrossRef]
  48. Quisel, J.D.; Wykoff, D.D.; Grossman, A.R. Biochemical characterization of the extracellular phosphatases produced by phosphorus-deprived Chlamydomonas reinhardtii. Plant Physiol. 1996, 111, 839–848. [Google Scholar] [CrossRef] [PubMed] [Green Version]
  49. Rengefors, K.; Pettersson, K.; Blenckner TM, A.D.; Anderson, D.M. Species-specific alkaline phosphatase activity in freshwater spring phytoplankton: Application of a novel method. J. Plankton Res. 2001, 23, 435–443. [Google Scholar] [CrossRef] [Green Version]
  50. Cañavate, J.P.; Armada, I.; Hachero-Cruzado, I. Aspects of phosphorus physiology associated with phosphate-induced polar lipid remodeling in marine microalgae. J. Plant Physiol. 2017, 214, 28–38. [Google Scholar] [CrossRef] [PubMed]
  51. Rose, C.; Axler, R.P. Uses of alkaline phosphatase activity in evaluating phytoplankton community phosphorus deficiency. Hydrobiologia 1997, 361, 145–156. [Google Scholar] [CrossRef]
  52. Jamet, D.; Amblard, C.; Devaux, J. Size-fractionated alkaline phosphatase activity in the Hypereutrophic Villerest Reservoir (Roanne, France). Water Environ. Res. 2001, 73, 132–141. [Google Scholar] [CrossRef]
  53. Jin, X.B.; Liu, C.L.; Poulton, A.J.; Dai, M.H.; Guo, X.H. Coccolithophore responses to environmental variability in the South China Sea: Species composition and calcite content. Biogeosciences 2016, 13, 4843–4861. [Google Scholar] [CrossRef] [Green Version]
  54. Azam, F.; Hodson, R.E. Dissolved ATP in the sea and its utilization by marine bacteria. Nature 1977, 267, 696–698. [Google Scholar] [CrossRef]
  55. Falkowski, P.G.; Raven, J.A. Aquatic Photosynthesis; Princeton University Press: Princeton, NJ, USA, 2007. [Google Scholar]
  56. Šupraha, L.; Gerecht, A.C.; Probert, I.; Henderiks, J. Eco-physiological adaptation shapes the response of calcifying algae to nutrient limitation. Sci. Rep. 2015, 5, 16499. [Google Scholar] [CrossRef]
Figure 1. Variations in the cell density and growth rate (columns) of C. roscoffensis in groups of inorganic (A) and organic (B) initial phosphorus resources. (LDIP): low concentration of inorganic phosphorus; (HDIP): high concentration of inorganic phosphorus; (SG): Na2-glycerophosphate; (ATP): adenosine triphosphate. * statistical significance, p < 0.05.
Jmse 10 01860 g001
Figure 2. Changes in the chlorophyll fluorescence parameters Ft and QY of C. roscoffensis in the groups of inorganic (A,C) and organic (B,D) initial phosphorus resources. (LDIP): low concentration of inorganic phosphorus; (HDIP): high concentration of inorganic phosphorus; (SG): Na2-glycerophosphate; (ATP): adenosine triphosphate. * statistical significance, p < 0.05.
Jmse 10 01860 g002
Figure 3. Changes in the oxygen concentration in the C. roscoffensis culture in the groups of inorganic (A) and organic (B) initial phosphorus resources. (LDIP): low concentration of inorganic phosphorus; (HDIP): high concentration of inorganic phosphorus; (SG): Na2-glycerophosphate; (ATP): adenosine triphosphate. * statistical significance, p < 0.05.
Jmse 10 01860 g003
Figure 4. Changes in the alkaline phosphatase activity of C. roscoffensis in the groups of inorganic (A) and organic (B) initial phosphorus resources. (LDIP): low concentration of inorganic phosphorus; (HDIP): high concentration of inorganic phosphorus; (SG): Na2-glycerophosphate; (ATP): adenosine triphosphate. * statistical significance, p < 0.05.
Jmse 10 01860 g004
Figure 5. Changes in the relative extracellular calcification level of C. roscoffensis in the groups of inorganic (A) and organic (B) initial phosphorus resources. (LDIP): low concentration of inorganic phosphorus; (HDIP): high concentration of inorganic phosphorus; (SG): Na2-glycerophosphate; (ATP): adenosine triphosphate. * statistical significance, p < 0.05.
Jmse 10 01860 g005
Figure 6. Changes of concentration of nitrate and phosphate in the water of C. roscoffensis culture in groups of inorganics (A,C) and organic (B,D) initial phosphorus resources. (LDIP): low concentration of inorganic phosphorus; (HDIP): high concentration of inorganic phosphorus; (SG): Na2-glycerophosphate; (ATP): adenosine triphosphate. * statistical significance, p < 0.05.
Jmse 10 01860 g006
Figure 7. Changes in the daily absorption rates of nitrate and phosphate in the water of C. roscoffensis culture groups of inorganic (A,C) and organic (B,D) initial phosphorus resources. (LDIP): low concentration of inorganic phosphorus; (HDIP): high concentration of inorganic phosphorus; (SG): Na2-glycerophosphate; (ATP): adenosine triphosphate. * statistical significance, p < 0.05.
Jmse 10 01860 g007
Figure 8. Changes in the N/P ratio in the water of C. roscoffensis culture groups of inorganic (A) and organic (B) initial phosphorus resources. (LDIP): low concentration of inorganic phosphorus; (HDIP): high concentration of inorganic phosphorus; (SG): Na2-glycerophosphate; (ATP): adenosine triphosphate. * statistical significance, p < 0.05.
Jmse 10 01860 g008
Publisher’s Note: MDPI stays neutral with regard to jurisdictional claims in published maps and institutional affiliations.

