Abstract
Intensive pig production generates significant emissions of ammonia (NH3) and methane (CH4), gases with both environmental and health impacts, primarily originating from slurry storage lagoons and their management. This study monitored a maternity pig farm over a 360 day period, using sensors located next to the slurry storage lagoon (Sensor 4) and in the immediate external surroundings of the facility, while simultaneously recording environmental variables (temperature, relative humidity, wind, and precipitation). The results showed that concentrations at the lagoon were thousands to tens of thousands of times higher than those measured in the surrounding area, with temperature and relative humidity emerging as key factors that increase volatilization and microbial generation, especially in summer under medium humidity conditions. Precipitation and wind modulate concentrations through resuspension and dispersion processes. Overall, the slurry storage lagoon constitutes the primary hotspot of emissions, and proper sensor placement is essential to accurately estimate its real impact, while integrating climatic and spatial conditions is crucial for designing and implementing effective mitigation strategies in intensive pig production systems.
1. Introduction
Intensive pig production is an agricultural activity of great economic and social relevance, but it also poses a considerable environmental challenge. Among the main concerns associated with these operations are emissions of polluting gases, particularly ammonia (NH3) and methane (CH4), which impact both air quality and global climate change. Livestock farming, and pig production in particular, significantly contributes to the release of these gases due to the handling and storage of slurry, which is organic waste rich in nitrogen compounds and organic matter susceptible to microbiological and physicochemical processes that generate NH3 and CH4, respectively [1,2].
Ammonia emitted by pig farms mainly originates from the volatilization of ammoniacal nitrogen contained in manure and slurry. This gas not only affects local air quality by contributing to the formation of fine particulate matter (PM2.5), with implications for human and animal respiratory health, but also participates in nitrogen deposition, which can alter sensitive ecosystems and increase eutrophication [3,4]. In parallel, methane is a greenhouse gas with a global warming potential much higher than that of carbon dioxide over short- and medium-term time horizons, generated mainly by the anaerobic activity of microorganisms in organic matter deposits, such as slurry storage lagoons on farms [5,6].
The magnitude and dynamics of these emissions vary depending on multiple interrelated factors. Meteorological conditions such as temperature, relative humidity, wind speed, and precipitation, as well as operational and management variables (feeding practices, storage systems, frequency of agitation or emptying of lagoons), determine the rate and amount of gas released into the atmosphere [7,8]. Understanding how these variables influence emissions is essential for developing tailored mitigation strategies, improving environmental management, and ensuring the sustainability of the sector. From a regulatory standpoint, Spain has legislation aimed at preventing and controlling pollutant emissions from industrial and agricultural activities, under the framework of Royal Decree 1054/2002, which regulates the Integrated Environmental Authorization applicable to intensive livestock farms. This framework is complemented by Law 16/2002 on the integrated prevention and control of pollution, as well as national inventories managed by the Ministry for the Ecological Transition and the Demographic Challenge (MITECO), which include pig sector emissions within official monitoring [9]. At the European level, Directives 2010/75/EU (IPPC (Integrated Pollution Prevention and Control)) and 2001/81/EC (NEC) [10,11] set limits and reduction targets for atmospheric pollutants, promoting the application of Best Available Techniques (BAT) to reduce NH3 and CH4 emissions in the agricultural sector. Additionally, Regulation (EU) No. 2016/2284 establishes national emission ceilings for ammonia and other pollutants [12], supported by technical guidelines and documents produced by the European Environment Agency [13] and the European IPPC Bureau [14] that provide recommendations on best practices in intensive pig rearing and waste management. This technical guidance emphasizes the need for rigorous monitoring, appropriate facility design, efficient slurry management through biological techniques, covers, acidification, or aeration, and operational protocols to mitigate emissions. These recommendations, grounded in scientific evidence and practical experience, form the basis for improving sustainability and minimizing environmental impact, pushing the pig sector toward meeting increasingly stringent regulatory and societal objectives.
Based on this context, it is important to note that the literature is currently scarce in providing continuous, long-term monitoring datasets similar to the one presented in this study. While most research on swine farm emissions relies on discrete sampling or short-term campaigns, our 360-day monitoring approach captures the full range of seasonal variability and episodic meteorological events in a semi-arid climate. Under this framework, the main objective of the present study is to comprehensively characterize the dynamics of NH3 and CH4 concentrations in a maternity pig farm, considering the influence of environmental variables—temperature, relative humidity, wind, and precipitation—and the spatial distribution of monitoring sensors. This approach will enable the identification of temporal and spatial patterns that help to understand fluctuations in these gases, locate critical concentration hotspots, and assess the actual environmental impact. Furthermore, the study seeks to provide useful information for planning targeted environmental mitigation strategies, managing sanitary risks, and ensuring regulatory compliance, thereby contributing to the improvement of sustainability in intensive pig production.
2. Materials and Methods
2.1. Experimental Design Context
Ammonia (NH3) and methane (CH4) s were quantified at a maternity pig farm housing 5518 animals, with an annual production of 11,827 m3 of liquid slurry, located in Murcia Region, in southeastern Spain. Ammonia and methane—pollutant gases released by livestock activities that impact air quality and contribute to climate change—were monitored with the objective of generating data to serve as a basis for environmental management strategies and for the validation of estimation models. In the present study, a network of 8 air quality sensors (Chao Sensor CC-G10), developed and installed by the company Libelium Comunicaciones Distribuidas S.L. (Zaragoza, Spain), were deployed to detect and record, in real time, NH3 and CH4 concentrations at different points around the farm’s external environment (Figure 1). These sensing nodes were specifically configured to monitor gas dynamics under the demanding conditions of livestock facilities, ensuring continuous data transmission to a centralized platform for further analysis. No sensors were placed inside the farm buildings. This strategy allowed the capture of both the spatial and temporal dispersion of emitted gases, taking into account local meteorological conditions and the operational dynamics of the facility.
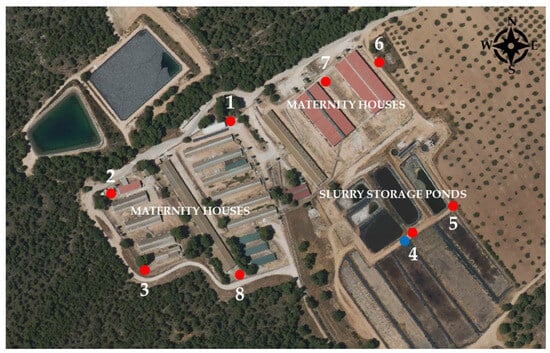
Figure 1.
Location of the 8 NH3/CH4 sensors (red dots 1–8) and 1 meteorological station (blue dot) in the maternity farm in southeastern Spain.
2.2. Environmental Monitoring Infrastructure, IoT System, and Data Analysis Methodology
The 8 sensors used are devices equipped with technology to detect concentrations of pollutant gases in real time. The term IoT refers to physical objects capable of measuring, processing, and transmitting information remotely through digital networks. Each sensor was calibrated to measure concentrations in parts per million (ppm), which were subsequently converted to milligrams per cubic meter (mg/m3) for both NH3 and CH4 to comply with standard environmental reporting units and international regulatory frameworks. These recorded values represent hourly averages calculated from instantaneous readings taken every 15 min. This averaging approach, standard in IoT platforms, was utilized to optimize power management and mitigate short-term fluctuations caused by signal noise or turbulent wind gusts, ensuring a more stable and representative interpretation of the gas dynamics. Sensors were strategically positioned around the perimeter of the farm, with locations selected according to: (1) prevailing wind direction and speed to capture the atmospheric dispersion of gases, (2) the main sources within the farm, particularly areas with high livestock activity and manure handling, and (3) physical and topographic factors that could influence gas transport. A weather station (model WS-3000, Ambient Weather, Chandler, AZ, USA) was installed next to one of the sensors to record environmental variables such as temperature and relative humidity, while wind speed and precipitation data were obtained from a nearby public meteorological station (Mula ML21, https://www.imida.es/siam (accessed 18 July 2025)). This station is located approximately 10.8 km from the pig farm. Given this geographical proximity, the recorded climatic data are considered highly representative of the local environmental conditions influencing gas dispersion dynamics at the study site. This information was essential for accurately interpreting gas concentration records and improving the estimation and modeling of dispersion. Data collection was continuous, generating records every few minutes, which were transmitted to a centralized platform, thus ensuring a robust and detailed database for subsequent statistical analysis and modeling.
To convert concentration data into emission flux estimates (mg/s), a combined approach using Monte Carlo methods and an inverse simulation was applied. This iterative process treats the emission flux as a random variable following a normal distribution, executing between 1000 and 10,000 simulations per monitoring point. Each iteration feeds a Gaussian plume dispersion model to compare simulated concentrations against real-time IoT sensor data, calculating the squared error for each run. The final emission flux is determined by selecting the simulation that minimizes this error, ensuring a statistically robust estimation. The farm’s effective area—defined as the primary space of emission influence—was carefully delimited to ensure that estimates exclusively reflected facility-related sources. These calculated fluxes were subsequently validated against public inventory data to evaluate differences across varying spatial and temporal scales. Although this methodology establishes the framework for emission estimation, the present publication is limited to the analysis of the NH3 and CH4 concentration measurements.
2.3. Statistical Analysis
Statistical analysis was performed using IBM SPSS Statistics (version 25). The normality of the data distribution was assessed using the Kolmogorov–Smirnov test, which confirmed that the NH3 and CH4 datasets did not follow a normal distribution. Consequently, non-parametric methods were employed to analyze the data. Correlations between gas concentrations and meteorological parameters were evaluated using Spearman’s rho coefficient. To determine significant differences between sampling points and time periods, a one-way ANOVA and pairwise comparison tests were applied. Although the data showed deviations from normality, the parametric approach was maintained due to the inherent robustness of the F-test against such violations and the fulfillment of the homoscedasticity assumption. In all cases, statistical significance was established at a p-value < 0.05.
3. Results
3.1. Spatio-Temporal Distribution of NH3 and CH4 Concentrations
Figure 2 and Figure 3 clearly indicate that the slurry storage lagoon is the primary and dominant source of both ammonia (NH3) and methane (CH4) concentrations during the 360-day monitoring period at the maternity pig farm. Sensor 4, located next to this lagoon, consistently recorded elevated values of a magnitude far exceeding those detected by the other sensors installed in the immediate exterior surroundings of the farm. Similarly, Sensor 5, also located near Sensor 4, reported high concentrations closely following those measured by Sensor 4. Specifically, during the warmest months, such as July and August 2024, Sensor 4 reported daily NH3 peaks that on multiple occasions exceeded 20,000 mg/m3, reaching maxima of 19,834 mg/m3 on 20 July and 20,133 mg/m3 on 1 August. In contrast, the exterior sensors, located several tens of meters away from the direct source, barely exceeded 1 mg/m3 (Sensor 1) and 0.2 mg/m3 (other sensors). This contrast—representing differences of more than 10,000-fold—highlights the critical importance of spatial location in determining measured concentrations.
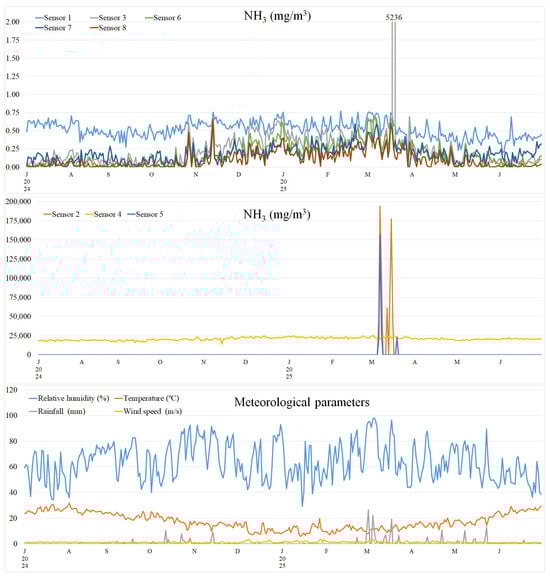
Figure 2.
Daily results of ammonia (NH3) concentrations and meteorological parameters in the 8 sensors from July 2024 to June 2025.
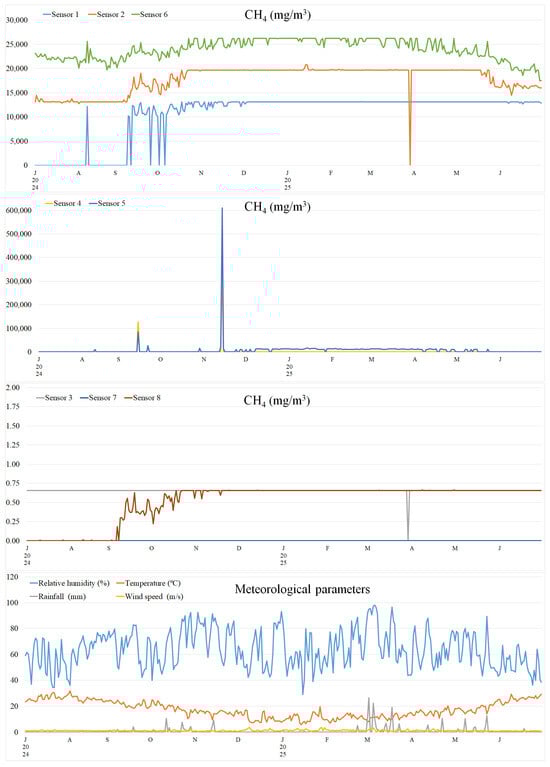
Figure 3.
Daily results of methane (CH4) concentrations and meteorological parameters in the 8 sensors from July 2024 to June 2025.
Regarding methane, a gas generated mainly by the anaerobic decomposition of organic matter in the slurry, a distinct pattern was observed. During summer and at certain times in other seasons, Sensor 4 recorded concentrations surpassing 10,000 mg/m3, reaching values such as 127,698 mg/m3 (15 September), 19,470 mg/m3 (22 September), and 370,728 mg/m3 (14 November). On other days, recorded values were below 1 mg/m3, possibly due to the presence of a solid crust on the emitting surface, which limits gas release. Sensors 1, 2, 5, and 6 also recorded significant sporadic concentrations, associated with cleaning operations and animal movement within the farm: Sensor 1 reached 13,169 mg/m3 (23 February), Sensor 2 reached 20,824 mg/m3 (14 January), Sensor 5 reported a maximum of 610,225 mg/m3 (14 November), and Sensor 6 registered peaks of 26,246 mg/m3 on multiple days during October, November, December, January, February, March, and April. In contrast, Sensors 7 and 8 reported values below 1 mg/m3 throughout the entire study period. The recorded results indicate that CH4 concentrations from the farm exhibit high spatial and temporal variability, influenced by both farm operational conditions and environmental factors affecting gas release and dispersion.
3.2. Influence of Meteorological Variables on Concentration Rates
Climatic conditions play a vital role in the dynamics and magnitude of NH3 and CH4 concentrations throughout the year. The variables examined—temperature, relative humidity, wind speed, and precipitation—proved to be key factors that modulate the volatilization and microbial generation of these gases, with clear repercussions on measured concentrations.
3.2.1. Temperature Effects on NH3 and CH4 Concentration Levels
A combined analysis of ammonia (NH3) and methane (CH4) concentration data obtained from the eight sensors distributed across the maternity pig farm revealed marked differences in how temperature influences each gas. For ammonia, the overall correlation between ambient temperature and levels measured by all sensors was predominantly negative (R = −0.396 **). This indicates that, on average, ammonia concentrations tend to increase as temperature decreases. Under colder conditions, greater atmospheric stability and reduced turbulence hinder dispersion, causing concentrations near the concentration source to build up. Furthermore, temperature affects relative humidity and the microclimate around tanks or slurry lagoons, influencing the persistence and behavior of the gas. In the present study, Sensor 4, located next to the slurry lagoon, registered a high ammonia peak on 17 March 2025 of 25,175 mg/m3 when the temperature was only 9.3 °C. Likewise, on 2 March 2025, the concentration measured was 24,861 mg/m3 at 8.1 °C, and another high value was recorded on 14 December 2024 (24,764 mg/m3 at 8.8 °C). These dates clearly show that NH3 concentrations reached their highest levels on cold days. In contrast, during warmer days such as 1 July 2024, with a temperature of 23.6 °C, Sensor 4 measured much lower concentrations (around 0.0048 mg/m3). For methane, the relationship with temperature was moderately negative (R = −0.195 **) and far less direct, suggesting that CH4 levels do not strongly respond to daily or seasonal temperature variability. Peaks and fluctuations in CH4 were more closely linked to internal biological processes of anaerobic digestion and specific operational events such as lagoon agitation or emptying, rather than to ambient temperature changes. These findings are consistent with sensor data from the pig farm, where methane peaks did not follow clear thermal patterns but were instead associated with specific events and complex biological processes.
3.2.2. Effect of Relative Humidity on Gas Concentrations
During the 360-day daily monitoring period, relevant NH3 and CH4 concentration data were collected in relation to environmental conditions on the farm, including relative humidity, temperature, rainfall, and wind. The meteorological values correspond to a representative measurement point for the entire area and were applied uniformly across all sensor locations. Relative humidity ranged widely, from lows near 29% on dry, hot days to highs above 98% during rainy, winter days, clearly reflecting seasonal influence and meteorological events. For example, in November 2024 and March 2025, frequent humidity peaks above 85% were recorded, whereas summer months were dominated by lower values, between 35% and 60%. Sensor 4, located next to the slurry lagoon, recorded the highest ammonia concentrations, reaching peaks of up to 20,594 mg/m3 on 29 October 2024 (autumn) when relative humidity was high (92.5%). The other sensors recorded considerably lower and more variable NH3 values, generally between 0.1 and 0.7 mg/m3, although episodic peaks occurred under high-humidity, low-wind conditions, such as 194,120 mg/m3 registered by Sensor 2 on 7 March (95.8% humidity). Regarding methane, Sensor 4 showed significant peaks associated with high humidity (85.4%), low temperatures (14.0 °C), and precipitation (9.20 mm), such as the 370,728 mg/m3 recorded on 14 November. Some external sensors captured extreme episodic values, such as Sensor 5, which recorded a maximum peak of 610,225 mg/m3 on that day (14 November), likely linked to lagoon disturbance or mobilization of organic matter. Methane production and concentration showed a weaker relationship with humidity (R = +0.038 *). However, prolonged rainfall combined with high humidity was found to favor the stabilization of anaerobic conditions in the lagoon, maintaining constant microbial methanogenesis and high CH4 levels. Daily analysis shows a positive but non-linear relationship between relative humidity—a common atmospheric condition across the farm at any given instant—and ammonia and methane concentrations, particularly accentuated in the vicinity of the slurry lagoon. This relationship is further modulated by sensor location and by additional meteorological variables such as temperature (R = −0.348 **), precipitation (R = +0.413 **), and wind speed (R = −0.288 **), which influence both dispersion and microbial activity.
3.2.3. Relationship Between Wind Speed and Gas Dispersion
Wind speed had a marked impact, especially on NH3 dispersion in the areas outside the lagoon. On days with moderate to strong winds (>1.4 m/s), reductions of up to 30% in NH3 concentrations were observed at the sensors, attributable to more efficient dispersion and shorter near-surface gas residence times. Days with little or no wind were associated with the highest ammonia and methane peaks, which dropped quickly once natural ventilation increased. Sensor 4, due to its proximity to the point source, showed minimal reduction in readings with wind, confirming that airflow alone is insufficient to mitigate the extremely high concentrations right at the lagoon. Although no hourly wind speed data were available, calm atmospheric conditions—especially at night or during seasons with near-calm winds—were associated with temporary accumulations that momentarily increased concentrations at the sensors, although still lower than those recorded by Sensor 4. For methane, its release is slow and originates from specific anaerobic sources, meaning that wind exerts no substantial influence on its concentration.
3.2.4. Impact of Precipitation on Concentration Levels
Precipitation showed a complex and variable influence, depending on its intensity and duration. Following heavy rainfall events, such as 12 October (10.60 mm) and 2 March (26.5 mm, the highest recorded), clear and sustained reductions in ammonia concentrations were observed at the sensors. These decreases were especially pronounced on the day of rainfall and the following day and are attributed to the washing, removal, and resuspension of ammonium and other nitrogen compounds from the lagoon surface, as well as slurry cooling, which reduces volatilization. In contrast, methane concentrations remained virtually unchanged, showing that precipitation is effective in reducing NH3 through washing, but has limited impact on CH4. The combination of heavy rain and moderate wind helped reduce ammonia peaks via simultaneous washing and dispersion, thereby lowering local exposure. However, methane levels were practically unaffected by these meteorological conditions.
3.3. Hourly Variability of NH3 and CH4 Concentrations
Although the continuous monitoring campaign comprised a total of eight sensors strategically distributed at different points around the maternity pig farm, for a detailed analysis of the hourly time series only Sensors 2, 4, 5, and 6 were selected (Figure 4 and Figure 5). This selection was based on technical and statistical criteria aimed at ensuring that the results reliably reflect both the spatial variability of concentrations and the different microenvironments generated by the layout and management of the facility. The coverage of the main concentration sources and internal microclimates is as follows:
- Sensor 2 represents areas of animal housing and direct handling, where NH3 accumulation depends strongly on ventilation, animal density, and cleaning routines. It is included because it provides a perspective on direct exposure in areas occupied by both animals and humans.
- Sensor 4 is located at the slurry storage lagoon, the main point source of methane (CH4) and also a significant source of ammonia (NH3) due to the decomposition of ammoniacal nitrogen. Its measurements allow characterization of the concentration patterns associated with anaerobic processes, which are highly dependent on temperature and events such as agitation or emptying.
- Sensor 5, situated in an intermediate area influenced by both internal sources and cross-drafts, enables the analysis of contaminant dispersion and transport within the facility. Its inclusion aids in interpreting mixing phenomena and micro-ventilation effects.
- Sensor 6, located near elements of natural or forced ventilation and partially exposed to the exterior, serves as a background and dispersion reference, indicating the impact of meteorological conditions (wind, temperature, humidity) on gas concentrations.
The hourly analysis of concentrations makes it possible to identify regular daily patterns, sporadic peaks, and seasonal variations. These patterns help to elucidate the effects of temperature, relative humidity, ventilation, and livestock operations (such as pits cleaning, slurry removal, or feeding) on concentrations dynamics widely supported by field studies. Between 10:00 and 17:00 h, the concentrations recorded by the sensors (for ammonia and, to a lesser extent, methane) display a downward trend, explained primarily by increased natural and/or forced ventilation (gas dilution), reduced direct concentration activity during these hours, and greater dispersion through thermal convection under warm conditions. During this time window, concentrations tend to decrease due to a combination of operational and environmental factors that simultaneously affect both gas production rates and their accumulation and dispersion in the air. This is typically when the ventilation system (natural or mechanical) is at maximum opening and efficiency, since, in the Region of Murcia, outdoor temperatures reach high values from late morning onwards. The most concentration-intensive operations—such as initial feeding, early-morning cleaning, or slurry removal—are generally concentrated before 10:00 h or in the late afternoon. Between 10:00 and 17:00 h, human activity inside the buildings is reduced to occasional tasks, with less direct disturbance of manure or slurry, thus avoiding sudden releases of NH3 and CH4. Finally, the increased thermal gradient between indoors and outdoors drives natural air convection, encouraging lighter gases such as ammonia to move upwards and vent to the exterior. This further enhances dispersion and reduces concentrations near the sensors.

Figure 4.
Monthly average and standard deviation (July 2024–June 2025) of ammonia (NH3) concentrations between 0:00 and 23:00 h in Sensors 2, 4 (storage pond), 5, and 6.
Figure 4.
Monthly average and standard deviation (July 2024–June 2025) of ammonia (NH3) concentrations between 0:00 and 23:00 h in Sensors 2, 4 (storage pond), 5, and 6.


Figure 5.
Monthly average and standard deviation (July 2024–June 2025) of methane (CH4) concentrations between 0:00 and 23:00 h in Sensors 2, 4 (storage pond), 5, and 6.
Figure 5.
Monthly average and standard deviation (July 2024–June 2025) of methane (CH4) concentrations between 0:00 and 23:00 h in Sensors 2, 4 (storage pond), 5, and 6.

Analysis of the full hourly dataset for NH3 and CH4 concentrations across all four sensors during the study period shows that the four-hour time block most representative of the farm’s daily average concentrations occurs in the central part of the day, specifically between 10:00 and 14:00 h, with slight variations depending on each sensor’s location and its exposure to direct concentration sources or ventilation. Maximum concentrations are observed consistently during the early-morning hours (00:00–07:00 h), when low temperatures and reduced ventilation lead to gas accumulation, keeping concentrations well above the daily average. In contrast, Sensor 5 exhibited irregular concentration peaks for both NH3 and CH4 that differ from the steady nocturnal accumulation of the other sensors; this erratic pattern is justified by its location adjacent to an external storage slurry lagoon, where emissions are highly influenced by outdoor wind conditions and manure management activities rather than the building’s internal ventilation cycle.
4. Discussion
4.1. General and Spatial Dynamics of NH3 and CH4 Concentrations
The spatial and temporal patterns observed in NH3 and CH4 concentrations suggest that both gases initially exhibit predominantly horizontal dispersion near the concentration source, where concentrations are very high and localized. This is followed by vertical dispersion as the gases mix with the atmosphere. Such dispersion is conditioned by environmental factors such as wind, temperature, and atmospheric stability, resulting in a dynamic and heterogeneous pattern in both directions [15]. Methane, in particular, shows predominantly horizontal dispersion near the source (Sensors 1, 2, 4, 5, and 6), being transported mainly by wind at the ground level before ascending and mixing vertically in the atmosphere. This dynamic is evidenced by high concentration peaks detected by sensors close to the direct source, which decrease rapidly with distance and height, indicating a steep and heterogeneous concentration gradient influenced by local and structural environmental conditions. Throughout the year, this spatial gradient remains relatively constant, although it experiences fluctuations in response to seasonal variations and operational events [16], such as lagoon emptying or agitation and animal movement, which mainly cause sharp increases in concentrations measured by Sensor 4. In contrast, the exterior sensors reflect a very stable and low environmental baseline across the annual cycle. This contrast underscores the need to position sensors in strategic locations [15]—such as directly adjacent to the slurry lagoon—in order to accurately capture the real dynamics and intensity of concentrations. Measuring only at distant environmental points is insufficient to properly assess the concentration potential and associated environmental or health risks. Therefore, a comprehensive monitoring strategy should include both near-source measurements and analysis of dispersion in the surrounding environment to obtain a complete picture of the impact of livestock concentrations.
4.2. Influence of Meteorological Factors on NH3 and CH4 Concentrations
The findings for ammonia (NH3) may be linked to reduced volatilization and atmospheric dispersion under cooler conditions, alongside microclimatic and operational factors that promote higher concentrations during colder months. Although lower temperatures typically reduce volatilization, this counterintuitive relationship stems from a complex interplay of environmental processes. Similar results were obtained by Kai et al. (2006) [17], who recorded consistently elevated ammonia concentrations in controlled pig chambers at temperatures around 10 °C. In contrast, methane (CH4) concentrations are primarily driven by anaerobic activity in slurry and management operations, showing limited and inconsistent responses to ambient temperature, as described by Blanes-Vidal et al. (2008) [16]. Likewise, Aneja et al. (2008) [18] point out that while temperature influences methanogenic activity, the most significant episodes relate to internal storage conditions, leading to a weak relationship with outside temperature. This divergence underlines the need for differentiated mitigation: while ammonia monitoring must consider thermal conditions, methane control should focus on operational practices and biological processes. Aneja et al. (2008) [18] also highlighted that relative humidity and temperature are key variables for ammonia; high humidity (>85%) combined with low temperatures favors volatilization (R = +0.117 **), as supported by this study. Nimmermark and Gustafsson (2005) [19] further found that increased humidity enhances both NH3 concentrations and emission rates. Regarding methane, the literature confirms that production during slurry storage is highly sensitive to humidity, as high levels increase anaerobic microbial activity and CH4 generation [20], consistent with the peak episodes detected in this study’s lagoon. Consequently, meteorological data must be considered as the broader context for targeted management in pig production facilities.
Wind is crucial for dispersing pollutants, yet its influence is complicated by temperature, humidity, and atmospheric stability. The limited effect of wind on Sensor 4’s readings indicates that airflow alone cannot sufficiently reduce high concentrations at the source. These dynamics align with studies showing that while wind speed enhances dispersion, it may be insufficient near the origin, particularly for methane, which is released slowly from anaerobic sources.
Finally, our results regarding the impact of precipitation are consistent with Martínez-Lagos et al. (2014) [21], who stressed that precipitation acts as a washing agent, facilitating ammonia removal and potentially mitigating concentrations by up to 30%. The significant reduction in ammonia levels recorded in this study during rainfall episodes, which was not observed for methane, aligns with their differing physicochemical behaviors. Methane, being less soluble and arising from deep anaerobic processes, is less susceptible to washout effects. This observed correlation in our data confirms that the combination of rainfall and moderate wind promotes more effective ammonia dispersion and deposition, lowering environmental exposure. These results underscore the importance of prioritizing ammonia control in pig farm management due to its high responsiveness to meteorological events like precipitation.
4.3. Hourly Temporal Variability of NH3 and CH4 Concentrations
The patterns of hourly temporal variability are widely supported by field studies [16,20,22], which highlight the impact of ventilation, temperature, and livestock operations on concentration dynamics. The downward trend in concentrations between 10:00 and 17:00 h is consistent with increased ventilation and reduced activity during these hours [22,23]. The peak ventilation period coincides with outdoor temperature increases, enhancing gas dilution and dispersion. The observed accumulation of concentrations during early-morning hours (00:00–07:00 h) aligns with reports indicating that low temperatures, absence of human activity, and reduced ventilation favor pollutant buildup. The natural convection driven by thermal gradients enhances vertical venting of gases such as ammonia, accelerating dispersion [24]. Identifying the window between 10:00 h and 14:00 h as the most representative of daily concentration averages provides a practical timeframe for concentration monitoring and mitigation strategy planning. This understanding is vital to minimize occupational exposure and reduce environmental impacts from pig farming operations.
5. Conclusions
The comprehensive characterization of the spatio-temporal dynamics of ammonia (NH3) and methane (CH4) concentrations at the maternity pig farm in Murcia, through continuous monitoring over 360 days and the use of strategically distributed sensors, has allowed the main objective of the study to be achieved: to gain a better understanding of how environmental and operational factors interact in the generation and dispersion of these pollutant gases. The results show that, while the slurry storage lagoon is identified as the primary concentration hotspot, hourly and spatial variability is strongly influenced by meteorological conditions—temperature, humidity, wind, and precipitation—and management activities, leading to critical peaks at specific times and locations. The analysis highlights the importance of identifying the hours and areas of greatest risk, revealing that NH3 concentrations peak in daily cycles linked to management practices and weather conditions, whereas CH4 follows patterns primarily associated with anaerobic processes in slurry, with less dependence on the immediate environment. In line with the study’s objectives, this information enables the precise location of critical concentration sources and the establishment of patterns that support the planning of targeted environmental mitigation measures, sanitary risk management, and regulatory compliance. Furthermore, the evidence gathered supports the value of environmental monitoring based on sensors and continuous records for informed decision-making and for improving sustainability in intensive pig production. Overall, the approach adopted in this study makes a significant contribution to advancing knowledge on integrated livestock waste management and concentration control, providing a robust basis for adjusting strategies both at the operational level and in response to current regulatory and environmental requirements.
Author Contributions
Conceptualization, M.G.-G., M.A.T.T., I.M.F.B. and Á.F.C.; methodology, M.G.-G., M.A.T.T., I.M.F.B. and Á.F.C.; software, M.G.-G., M.A.T.T. and I.M.F.B.; validation, M.G.-G., M.A.T.T. and I.M.F.B.; formal analysis, M.G.-G., M.A.T.T. and I.M.F.B.; investigation, M.G.-G., M.A.T.T. and I.M.F.B.; resources, I.M.F.B. and Á.F.C.; data curation, M.G.-G., M.A.T.T. and I.M.F.B.; writing—original draft preparation, M.G.-G., M.A.T.T., I.M.F.B. and Á.F.C.; writing—review and editing, M.G.-G., M.A.T.T. and I.M.F.B.; visualization, M.G.-G., M.A.T.T., I.M.F.B. and Á.F.C.; supervision, I.M.F.B. and Á.F.C.; project administration, I.M.F.B. and Á.F.C.; funding acquisition, I.M.F.B. and Á.F.C. All authors have read and agreed to the published version of the manuscript.
Funding
This research project, with file number CPP2022-009922, was funded by the Ministry of Science and Innovation (within the framework of the 2021–2023 State Plan for Scientific, Technical and Innovation Research, within the Framework of the Recovery, Transformation and Resilience Plan.
Institutional Review Board Statement
Not applicable.
Data Availability Statement
Restrictions apply to the availability of these data. Data was obtained from CEFUSA and are available from the authors with the permission of CEFUSA.
Conflicts of Interest
The authors declare no conflicts of interest.
References
- Antezana, W.; Cerisuelo, A.; Estellés, F.; Calvet, S. Analysis of Factors Affecting Ammonia And Methane Emissions From Pig Slurries: Slurry Composition And Dietary Factors. In Proceedings of the European Conference on Agricultural Engineering (AgEng2018), Wageningen, The Netherlands, 8–12 July 2018; pp. 817–823. [Google Scholar]
- Calvet, S.; Estellés, F.; Cartanyá, J.; Babot, D. Guía Para la Minimización de las Emisiones de Gases en Granjas Porcinas; Ministerio para la Transición Ecológica y el Reto Demográfico: Madrid, Spain, 2020. [Google Scholar]
- Sapek, A. Ammonia Emissions from Non-Agricultural Sources. Pol. J. Environ. Stud. 2013, 22, 63–70. [Google Scholar]
- Wyer, K.E.; Kelleghan, D.B.; Blanes-Vidal, V.; Schauberger, G.; Curran, T.P. Ammonia emissions from agriculture and their contribution to fine particulate matter: A review of implications for human health. J. Environ. Manag. 2022, 323, 116285. [Google Scholar] [CrossRef] [PubMed]
- Misselbrook, T.; Hunt, J.; Perazzolo, F.; Provolo, G. Greenhouse Gas and Ammonia Emissions from Slurry Storage: Impacts of Temperature and Potential Mitigation through Covering (Pig Slurry) or Acidification (Cattle Slurry). J. Environ. Qual. 2016, 45, 1520–1530. [Google Scholar] [CrossRef] [PubMed]
- VanderZaag, A.C.; Wagner-Riddle, C.; Park, K.H.; Gordon, R.J. Methane emissions from stored liquid dairy manure in a cold climate. Anim. Feed Sci. Technol. 2011, 166, 581–589. [Google Scholar] [CrossRef]
- Arogo, J.; Westerman, P.W.; Heber, A.J. A review of ammonia emissions from confined swine feeding operations. Trans. ASAE 2003, 46, 805. [Google Scholar] [CrossRef]
- Hung, C.Y.; Mjöfors, K.; Rennie, T.; Grant, B.; Smith, W.; VanderZaag, A. Manure temperature prediction for slurry storage in Sweden: Model validation including effects of shading, snow cover and mixing. Biosyst. Eng. 2024, 243, 70–81. [Google Scholar] [CrossRef]
- Ministerio para la Transición Ecológica y el Reto Demográfico (MITECO). Inventario Nacional de Emisiones a la Atmósfera: Emisiones del Sector Porcino; Gobierno de España: Madrid, Spain, 2023. [Google Scholar]
- European Union. Directive 2010/75/EU of the European Parliament and of the Council of 24 November 2010 on Industrial Emissions (Integrated Pollution Prevention and Control); OJ L 334; Publications Office of the European Union: Luxembourg, 2010. [Google Scholar]
- European Union. Directive 2001/81/EC of the European Parliament and of the Council of 23 October 2001 on National Emission Ceilings for Certain Atmospheric Pollutants; OJ L 309; Publications Office of the European Union: Luxembourg, 2001. [Google Scholar]
- European Union. Regulation (EU) 2016/2284 of the European Parliament and of the Council of 14 December 2016 on the Reduction of National Emissions of Certain Atmospheric Pollutants; OJ L 344; European Union: Brussels, Belgium, 2016. [Google Scholar]
- European Environment Agency (EEA). EMEP/EEA Air Pollutant Emission Inventory Guidebook. Technical Guidance to Prepare National Emission Inventories. EEA Report No 13/2019; European Environment Agency (EEA): Copenhagen, Denmark, 2019. [Google Scholar]
- European IPPC Bureau. Best Available Techniques (BAT) Reference Document for the Intensive Rearing of Poultry or Pigs; Joint Research Centre (JRC), European Commission: Brussels, Belgium, 2017. [Google Scholar]
- Sefeedpari, P.; Pishgar-Komleh, S.H.; Aarnink, A.J.A. Model Adaptation and Validation for Estimating Methane and Ammonia Emissions from Fattening Pig Houses: Effect of Manure Management System. Animals 2024, 14, 964. [Google Scholar] [CrossRef] [PubMed]
- Blanes-Vidal, V.; Hansen, M.N.; Pedersen, S.; Rom, H.B. Emissions of ammonia, methane and nitrous oxide from pig houses and slurry: Effects of rooting material, animal activity and ventilation flow. Agric. Ecosyst. Environ. 2008, 124, 237–244. [Google Scholar] [CrossRef]
- Kai, P.; Kaspers, B.; Van Kempen, T. Modeling sources of gaseous emissions in a pig house with recharge pit. Trans. ASABE 2006, 49, 1479–1485. [Google Scholar] [CrossRef]
- Aneja, V.P.; Schlesinger, W.H.; Erisman, J.W. Farming pollution. Nat. Geosci. 2008, 1, 409–411. [Google Scholar] [CrossRef]
- Nimmermark, S.; Gustafsson, G. Influence of temperature, humidity and ventilation rate on the release of odour and ammonia in a floor housing system for laying hens. Agric. Eng. Int. CIGR J. 2005, VII, BC 04 008. [Google Scholar]
- Sommer, S.G.; Petersen, S.O.; Søgaard, H.T. Greenhouse gas emission from stored livestock slurry. J. Environ. Qual. 2000, 3, 744–751. [Google Scholar] [CrossRef]
- Martínez-Lagos, J.; Salazar, F.; Alfaro, M.; Rosas, M.; Rampoldi, E.; Macías, F. Factores edafoclimáticos que afectan las emisiones de amoniaco por aplicación de urea y purín de lechería en Andosoles. Chil. J. Agric. Anim. Sci. 2014, 30, 15–18. [Google Scholar]
- Cabaraux, J.F.; Philippe, F.X.; Laitat, M.; Canart, B.; Vandenheede, M.; Nicks, B. Gaseous emissions from weaned pigs raised on different floor systems. Agric. Ecosyst. Environ. 2009, 130, 86–92. [Google Scholar] [CrossRef]
- Jeppsson, K.H. Diurnal variation in ammonia, carbon dioxide and water vapour emission from an uninsulated, deep litter building for growing/finishing pigs. Biosyst. Eng. 2002, 81, 213–223. [Google Scholar] [CrossRef]
- Philippe, F.X.; Nicks, B. Review on greenhouse gas emissions from pig houses: Production of carbon dioxide, methane and nitrous oxide by animals and manure. Agric. Ecosyst. Environ. 2015, 199, 10–25. [Google Scholar] [CrossRef]


Disclaimer/Publisher’s Note: The statements, opinions and data contained in all publications are solely those of the individual author(s) and contributor(s) and not of MDPI and/or the editor(s). MDPI and/or the editor(s) disclaim responsibility for any injury to people or property resulting from any ideas, methods, instructions or products referred to in the content. |
© 2026 by the authors. Licensee MDPI, Basel, Switzerland. This article is an open access article distributed under the terms and conditions of the Creative Commons Attribution (CC BY) license.