Abstract
A clear grasp of the interconnections among various drought types forms the foundation for effective drought mitigation policy-making. However, current research on the propagation of groundwater drought (GD) remains relatively limited. Therefore, this study employs a multi-source data approach, combining methods (such as Pearson correlation analysis, cross-convergence mapping systems, and Copula functions) to assess the characteristics and propagation patterns of meteorological (MD), agricultural (AD), and GD in the Yangtze River Basin (YRB). Findings demonstrated that (1) drought severity (mainly ranging from 3.25 to 6.49) and duration (mainly ranging from 2.6 to 5.4 months) in the upstream region (UR) of the YRB are relatively large. (2) A total of 79.92% of the regions showed a mutual feedback relationship between agricultural drought and groundwater drought. (3) The duration propagation threshold from MD to AD was relatively high in the source region (SR) (mainly ranging from 5.95 to 8.36) and the midstream region (MR) (mainly ranging from 5.68 to 7.39) under extreme drought conditions. The severity propagation threshold from AD to GD was relatively high in the MR (mainly ranging from 11.8 to 16.5) and the downstream region (DR) (mainly ranging from 14.5 to 20.2) under extreme drought conditions. This study is significant for the rational allocation of regional water resources and drought prevention policy formulation.
1. Introduction
Drought is a natural disaster characterized by a prolonged period of water scarcity [1,2,3,4]. Owing to the prolonged duration and widespread impacts of drought, its effects on ecology, agriculture, and social development cannot be neglected [5,6]. The Yangtze River Basin (YRB), also referred to as the Mother River of China, holds crucial significance in terms of ecology, agriculture, and socioeconomic development. However, the region faces the severe challenge of drought, with the frequency and intensity of this natural disaster indicating an increasing trend in recent years, posing a threat to the livelihoods of millions of residents who rely on basin resources [7,8]. Drought events in the YRB not only lead to water scarcity but also impact agricultural production, water quality, energy production, and the overall sustainability of the region [9,10,11,12]. Analyzing the processes governing drought development in the YRB is crucial for the rational allocation of water resources, agricultural planning, and disaster response.
Generally, four major types of droughts are identified in scientific literature: meteorological (MD), agricultural (AD), hydrological (HD), and socioeconomic drought [5]. MD typically results from precipitation deficits or evapotranspiration anomalies. AD is usually indicated by a shortage of soil moisture. HD is commonly characterized by a shortage of surface/groundwater runoff. Socioeconomic drought occurs when water resource systems fail to meet societal needs. Notably, all drought types are closely related to the water cycle, and there are close relationships among the different drought types [6]. Compared to HD studies based on discharge and runoff data, research on groundwater drought (GD) remains relatively limited. This is mainly because traditional groundwater studies primarily rely on data from observation wells [2]. The high cost associated with observation well data makes it challenging to apply in large-scale research [13]. In recent years, with the advancement of remote sensing technology, an increasing number of remote sensing data and datasets have been utilized in groundwater drought studies [14]. However, overall, research on groundwater drought is still relatively scarce.
Many studies have investigated the relationships between different types of droughts [15,16,17]. However, some methods can only indicate the similarity between two time series and cannot truly reflect the causal directionality between them [15]. The Convergent Cross Mapping (CCM) method is a causal inference technique developed for complex systems, which can effectively identify causal directionality between different variables. In recent years, it has been applied in hydrological and meteorological research [18,19]. If two time series show high correlation but no causality, a spurious correlation may exist. Therefore, considering the advantages of CCM and to avoid overreliance on correlation. This study adopts a combined approach using Pearson correlation analysis and CCM to examine the relationships between different drought types.
MD caused by insufficient precipitation may lead to a shortage of runoff and soil moisture through the hydrological cycle, leading to HD and AD [18,19,20]. The formation of HD and AD may lead to an imbalance in social water supply and demand levels, thereby resulting in socioeconomic drought [4]. The transition between these different types of droughts is known as drought propagation. Many scholars have investigated the propagation among different drought types [21,22,23]. However, research on GD propagation remains relatively limited.
To address this gap, the present research investigates YRB, thereby exploring relationships, characteristics, and resilience to drought from the perspective of the linkage chain of MD, AD, and GD. The primary goal of this research was (1) to assess the correlation and causal relationships among different drought types; (2) to evaluate drought interaction thresholds between MD, AD, and GD linkages; and (3) to assess variations in drought resilience among various regions of the YRB. The research results can improve the drought warning capability of the YRB and serve decision-making departments in formulating effective drought resistance policies.
2. Materials and Methods
2.1. Study Area
Encompassing a significant portion of southern China, the YRB holds a central position as the nation’s largest and most critical river basin [24]. The mainstream of the Yangtze River is 6300 km long, and the YRB covers an area of 1.8 million km2. Rising in the Tanggula Mountains of the Qinghai–Tibet Plateau, the Yangtze River courses eastward across China before emptying into the East China Sea at Shanghai’s Chongming Island. The YRB receives abundant rainfall and exhibits a multiyear average annual precipitation of 1100 mm. The YRB is highly prone to alternating episodes of drought and flood. On the basis of the geographical environment and hydrological characteristics, the YRB can be divided into the source region (SR), the upstream region (UR), the midstream region (MR) and the downstream region (DR), as shown in Figure 1.
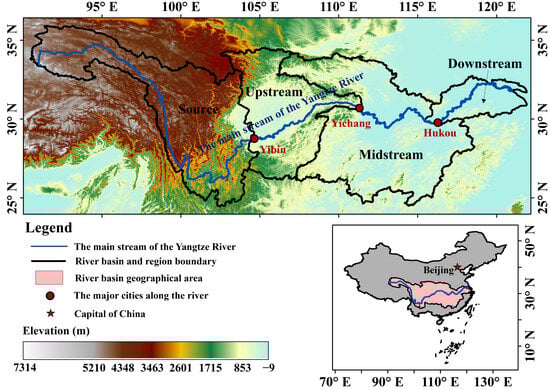
Figure 1.
Geography and topography of YRB.
2.2. Data Sources
The ERA5 dataset was developed on the basis of complex atmospheric circulation models and data assimilation techniques, thereby combining observations from weather stations, sensors, and satellites. The ERA5 dataset has been commonly adopted in drought research [25,26,27,28]. This research, precipitation and surface soil moisture data (0–7 cm) from 1950 to 2019 were obtained from the ERA5 dataset. The analysis employed the ERA5 reanalysis product at a resolution of 0.1° grid spacing and 1-month temporal output. We employed the ERA5 dataset to calculate MD and AD indices.
In this study, the data needed for calculating groundwater storage anomalies (GWSAs) were sourced from the Global Land Data Assimilation System (GLDAS) and the Gravity Recovery and Climate Experiment (GRACE). The above data have been extensively employed in GD research [13,29]. Specifically, the GLDAS-Noah dataset can provide data on soil water storage anomalies (SMSAs), snow water equivalent anomalies (SWEAs), and surface water storage anomalies (SWSAs). The temporal and spatial resolutions of the GLDAS-Noah dataset are 1 month and 0.25° × 0.25°, respectively. The GLDAS-Noah dataset time series spans the period from 1950 to 2019. Land water storage anomaly (TWSA) data were measured and provided by the GRACE dataset. Li developed a pioneering global-scale reconstruction method for long-term (1980–2019) TWSA data using a machine learning framework that integrates time series analysis and statistical decomposition techniques [30]. The above methods exhibit excellent reliability and complete spatial–temporal continuity [30]. A reconstructed long-term TWSA dataset was adopted in this study. The reconstructed TWSA dataset has a temporal coverage from 1980 to 2019 and a spatial resolution of 0.5° × 0.5°. To ensure consistency of the spatial resolution, we employed bilinear interpolation to regird all data to a uniform 0.1° × 0.1° spatial resolution.
2.3. Methods
2.3.1. Drought Index and Drought Characteristics
This study employed the standardized precipitation index (SPI), standardized soil moisture index (SSMI), and standardized groundwater drought index (SDGI) as proxies for MD, AD, and GD, respectively. Generally, drought index at a one-month scale can more sensitively capture the occurrence and development processes of different types of droughts [18]. To establish a unified drought propagation comparison framework among different drought types and capture the immediate transmission of fluctuation signals across different drought systems. Therefore, the 1-month version of each drought index was adopted in this paper. The SPI been widely applied in MD studies [15,25]. This study adopted the gamma distribution to model the probability density of precipitation, with parameter estimation conducted in accordance with Mckee [31].
In this study, AD and GD were calculated from soil moisture and GWSA data, respectively [14]. The calculation processes of the SSMI and SGDI are similar. The SSMI and SGDI can be calculated as follows:
where SM and GWSA are the time series of monthly soil moisture and GWSA data over a given period, respectively, and are the average values across the soil moisture time-series data and GWSA data, respectively, over the same period, and σ represents the joint standard deviation of the soil moisture and GWSA time series.
The calculation of GWSAs, based on the water balance principle, is given by:
GWSAs = TWSAs − SWSAs − SMSAs − SWEAs
The anomalies for each component were derived by subtracting the mean value for the entire study period from the data value for the specific month. SWSAs, SMSAs and SWEAs were estimated on the basis of GLDAS data, and TWSAs was estimated on the basis of GRACE data.
This study applied run theory to identify the characteristics (duration and intensity) of different types of drought events. Drought duration is defined as the continuous time interval during which the drought index remains under a specified threshold, while drought severity represents the cumulative deficit of the drought index throughout this period. Full computational details are provided in Wu et al. [32] and Dong et al. [14].
2.3.2. Pearson Correlation Coefficient and Convergent Cross-Mapping
The Pearson correlation coefficient quantifies the linear relationship between two continuous variables. Therefore, the Pearson correlation coefficient was used to assess the co-variability between different drought types. The complete calculation methodology is described in Shi et al. [16]. Even though the relationship between two variables can be determined, the above method can provide false correlations and fail to reflect the causal relationship between them.
Convergent cross-mapping (CCM) is a causal analysis method that is commonly employed in the assessment of complex systems [19,33]. The core assumption of CCM is that the system variables under study are nonlinearly and dynamically coupled, but the coupling strength is not so strong as to cause complete synchronization (causality indistinguishable). In this study, the presence of time lags and nonlinear relationships between different drought types aligns with the application conditions of CCM. Therefore, the CCM method was employed to evaluate the directionality and causality between different drought types.
The complete computational methodology is documented in the following studies [15,30]. The criteria for categorizing causal strength levels are summarized in Table 1. The categorizing causal strength levels of CCM in Table 1 can refer to the study by Zhou et al. [34].

Table 1.
Level division of causality.
2.3.3. Drought Propagation and Resistance Capacity
The application of copula models has become prevalent in examining drought cascading effects [13,35,36]. This study adopted a copula-based approach to model drought propagation dynamics. First, select marginal distribution functions (gamma, lognormal, Weibull (WBL), exponential (EXP), generalized extreme value (GEV), and generalized Pareto (GP) distributions) were used to match the duration and severity of drought events. The Kolmogorov–Smirnov goodness-of-fit test was used to assess conformity of the random variable to a specified marginal distribution, and the root mean square error (RMSE) was chosen to assess the goodness of fit of the marginal distribution functions that passed the Kolmogorov–Smirnov test [14]. Subsequently, a joint probability distribution was established using copula methodology (including the Archimedean copula family (Gumbel, Clayton, and Frank copula functions) and the elliptical copula (Student-t and Gaussian copula functions)). The squared Euclidean distance method was applied to evaluate the goodness of fit of the joint distribution function. We employed the AIC and BIC criteria to further evaluate the reliability of the selection of optimal copula functions for drought types. Third, on the basis of the joint distribution function and Bayesian theory, the propagation threshold was determined. Adopting MD and AD as examples, for a given AD event, with increasing MD conditions, the probability of AD occurrence becomes infinitely close to 1. A conditional probability threshold of 0.95 was used to identify the MD intensity required to initiate AD.
To assess Drought Resistance Capacity (DRC) changes, we adopted a sliding window approach to provide a time series of drought propagation thresholds. We defined a sliding window of 15 years and a step size of 1 year, and we calculated drought propagation thresholds for different sliding windows [37,38]. Subsequent analysis examined how drought propagation thresholds varied over time under different sliding windows. A rising trend in these thresholds suggests an increase in the system’s DRC increases. Conversely, the DRC decreases (Table 2).
Table 2.
Comparison of Professional Names and Abbreviations.
3. Results
3.1. Spatiotemporal Characteristics of Different Drought Types
Figure 2 illustrates the spatial distribution and temporal evolution of MD, AD, and GD events across the YRB. Figure 2 shows that the duration of MD is greater in the SR of the YRB, whereas the severity of MD is larger in the MR and DR. With respect to AD, both the duration and severity are larger in the northwestern part of the SR, while the severity is also greater in the central part of the UR. With respect to GD, the duration and severity are greater in the northwestern part of the SR and the central part of the UR, whereas the duration and severity are lower in the DR.
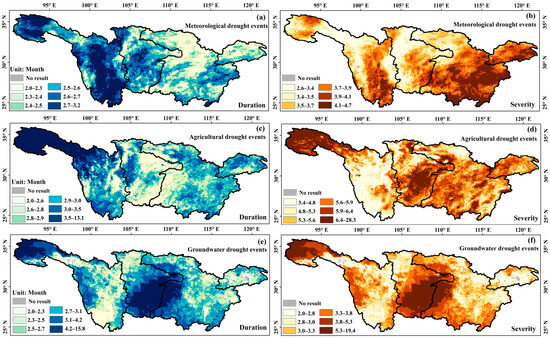
Figure 2.
Spatial distributions of the average duration (a,c,e) and severity (b,d,f) of MD, AD and GD.
Figure 3 illustrates the statistical distribution of key drought metrics in the different subregions. In the various subregions of the YRB, there was no significant difference in the duration or severity of MD. The duration of MD in the SR is relatively long, varying between 2.55 and 2.79 months, whereas the severity of MD in the MR and DR is relatively high, ranging from 3.63 to 4.12 and 3.81–4.05, respectively.
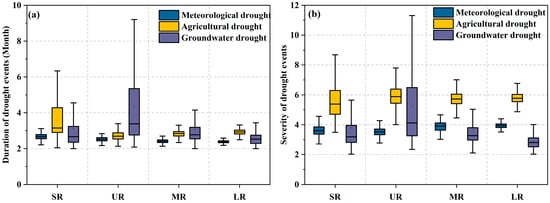
Figure 3.
Regional comparisons of (a) drought duration and (b) severity distributions across study areas.
The duration and severity of AD were generally greater than those of MD and GD. The duration of AD in the SR was greater, but the severity of AD did not significantly differ. In the UR and MR, the duration of GD was greater than that of AD, with relatively high severity of GD in the UR (mainly ranging from 3.25 to 6.49), whereas the severity and duration of GD were lowest in the DR.
3.2. Relationships Between Different Drought Types
This investigation, the correlation and causality between different drought types were computed, and the results are shown in Figure 4. Figure 4a,b show that MD and AD in the majority of the YRB were positively correlated, with a stronger correlation in the SR and the weakest correlation in the UR. In the majority of the YRB, AD and GD were positively correlated, with negative correlations in the northwestern and southeastern parts of the SR, some areas of the MR, and most areas of the DR.
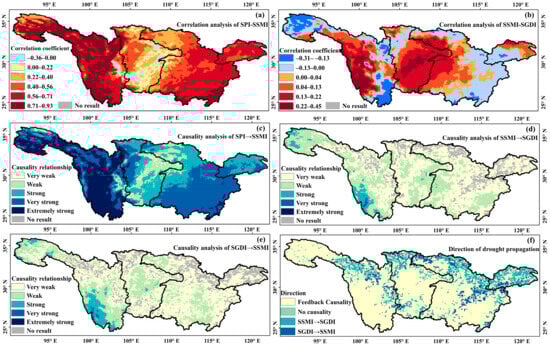
Figure 4.
Correlations between (a) the MD and AD (b) and between the AD and GD, unidirectional relationships of (c) MD → AD, (d) AD → GD, (e) and GD → AD, and (f) causality between AD and GD.
Figure 4c,d show the causal relationships between different drought types. Figure 4c shows that in the majority of the YRB, there was a strong causal relationship from MD to AD (MD → AD). In the majority of the SR (62.87% of the region), there were very strong and extremely strong causal relationships, whereas the southeastern part of the MR exhibited strong and very strong causal relationships. Weak causal relationships occurred in the northwestern parts of the UR and MR. Considering the physical mechanisms of drought occurrence and the main objectives of this study, causal relationships from AD to MD were not analyzed.
Compared with that from MD → AD, the causal relationship from AD to GD (AD → GD) was weaker. In the majority of the YRB (87.49% of the basin), there was a causal relationship from AD → GD. Apart from the strong causal relationships in the northwestern and southeastern parts of the SR, the majority of regions (83.59%) exhibited weak causal relationships. Figure 4e shows that in the majority of the YRB, there was a causal relationship from GD → AD. Except for the strong causal relationships observed in the southeastern part of the SR, weak causal relationships prevailed in most regions.
To illustrate the relationship between AD and GD, Figure 4f illustrates the regional dispersion of the unidirectional or bidirectional causal relationships between AD and GD in the YRB. In most areas of the YRB, there were bidirectional causal links between AD and GD, with 11.50% of the regions exhibiting a unidirectional causal relationship from AD → GD and 8.58% of the regions showing a unidirectional causal relationship from GD → AD.
Figure 5 shows a summary of the correlations and causalities in the different subregions of the YRB. In the various subregions, the correlation and unidirectional causal relationship from MD → AD were highest in the SR, relatively high in the MR and DR, and lowest in the UR.
Figure 5.
Statistical characteristics of the correlations between (a) the MD, AD and GD, (b) unidirectional relationships of MD → AD, (c) AD → GD and GD → AD, and (d) causality between AD and GD in the different geographical regions.
In terms of the relationships between AD and GD, both the correlation and causal relationship exhibited similar differential characteristics in the UR, MR, and DR. Most areas of the YRB indicated a bidirectional causal relationship between AD and GD (Figure 5d). The correlation and causal results were relatively high in the UR, whereas they were lower in the MR and DR. However, in the SR, the correlation results were lower than those in the UR, but the degree of causality was greater than that in the UR.
3.3. Drought Propagation Thresholds Among Different Drought Types
Figure 6 and Table 3 provide the optimal marginal distribution functions for the attributes of MD, AD, and GD. With respect to the duration of MD, the lognormal (45.7% of the area), gamma (11.6% of the area), and WBL (37.2% of the area) distributions were the optimal marginal distribution functions across the YRB. The lognormal distribution was the optimal choice in the eastern part of the YRB, while the gamma and WBL distributions were the optimal choices in the western portion of the YRB. With respect to the severity of MD, the lognormal (49.3% areas) and WBL (39.6% areas) distributions were identified for characterizing marginal behaviors in the YRB. Notably, the lognormal and WBL distributions were located mainly in the western and eastern parts, respectively, of the YRB. With respect to the duration of AD, the lognormal (59.5% areas) and WBL (26.6% areas) distributions were the optimal marginal fitted distributions in the YRB. In regard to the severity of AD, the EXP (24.4% of the area), GP (50.0% of the area), and WBL (14.7% of the area) distributions were the optimal marginal distribution functions across the YRB. With respect to the duration and severity of GD, the EX, GP, and GEV distributions were the main best-fit marginal fitted distributions in the YRB. The GEV distribution was located primarily in the central part of the YRB.
Figure 6.
Geospatial patterns of best-fit marginal distributions for (a) MD duration, (b) AD severity, (c) GD duration, (d) MD severity, (e) AD duration, and (f) GD severity.
Table 3.
Spatial coverage percentages of optimal marginal distribution functions for the different drought types.
Overall, the lognormal and WBL distributions were the most suitable for describing the durations of MD and AD in the YRB. The EXP, GP, and WBL distributions were more applicable for the severity of AD, whereas the EXP, GP, and GEV distributions were suitable for modeling GD.
Similarly, the areal distribution features and area percentages of the optimal copula functions were shown in Figure 7 and Table 4. We further employed the AIC and BIC criteria to validate the reliability of selecting the optimal copula functions for drought types, as shown in Table 5. From Table 5, Frank functions were optimal copula functions for multiple drought types in the YRB. In general, the Student-t, Gumbel, and Frank functions were the most suitable copula functions for multiple drought types in the YRB.
Figure 7.
Geospatial patterns of best-fit copula functions for (a) MD→AD duration, (b) MD→AD duration, (c) AD→GD duration, (d) AD→GD severity.
Table 4.
Spatial coverage percentages of optimal copula functions distributions for the different drought types.
Table 5.
Optimal copula functions for drought types based on AIC and BIC.
Figure 8, Figure 9 and Figure 10 visualize the geospatial patterns of drought propagation thresholds (MD → AD, AD → GD) across varying drought intensities in the Yangtze Basin. Figure 11 shows a summary of the regional variations in propagation thresholds.
Figure 8.
Propagation threshold for MD (AD) that causes moderate AD (GD) levels based on the drought duration (a,c) and drought severity (b,d).
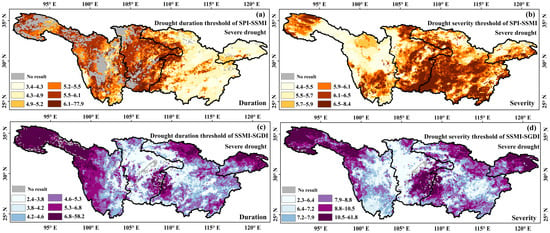
Figure 9.
Propagation threshold for MD (AD) that causes severe AD (GD) levels based on the drought duration (a,c) and drought severity (b,d).
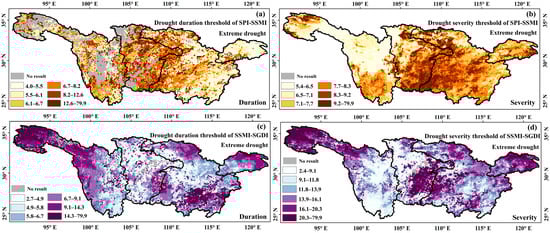
Figure 10.
Propagation threshold for MD (AD) that causes extreme AD (GD) levels based on the drought duration (a,c) and drought severity (b,d).
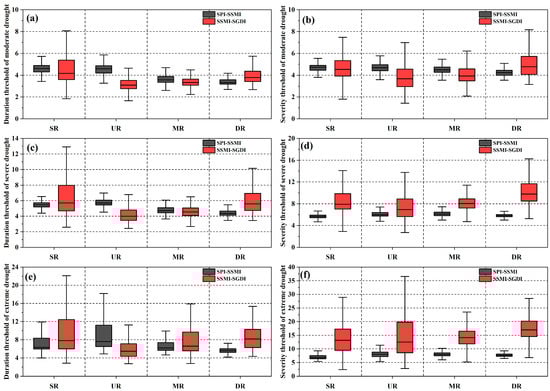
Figure 11.
Drought propagation thresholds based on the duration (left) and severity (right) under moderate (a,b), severe (c,d), and extreme (e,f) levels.
With respect to the drought propagation threshold for the duration from MD to AD, under moderate and severe droughts, the MD → AD propagation thresholds were elevated in both the SR and UR, with the lowest thresholds in the DR. The propagation thresholds from MD to AD during extreme drought showed distinct regional patterns, peaking in the UR and MR while reaching minima in the DR.
With respect to the drought propagation threshold for the severity, similar to that for the duration, under moderate and severe drought levels, The SR and UR showed higher propagation thresholds from MD to AD compared to other regions, with the lowest thresholds in the DR. Under extreme drought levels, the propagation thresholds from MD to AD were relatively high in the UR and MR, with the lowest thresholds in the DR.
With respect to the propagation thresholds under different levels from AD to GD (in terms of both the duration and severity), the SR and UR exhibited higher AD → GD propagation thresholds compared to other sub-basins (Figure 11).
The magnitude of the drought propagation thresholds can reflect the DRC in a given region. In the YRB, the soil water and groundwater systems exhibited relatively high DRC levels in the SR and UR, with relatively low DRC levels in the MR and DR.
3.4. Changes in the Drought Resistance Capacity
Figure 12 shows temporal evolution of drought propagation thresholds from MD to AD. In terms of the threshold duration of drought propagation (Figure 12a,c,e), the propagation thresholds in the SR and UR of the YRB exhibited decreasing trends. The propagation thresholds in the MR demonstrated relatively minor changes with no significant variations. The propagation thresholds in the DR exhibited a significant decrease before 2000–2004 and a notable increase afterward.
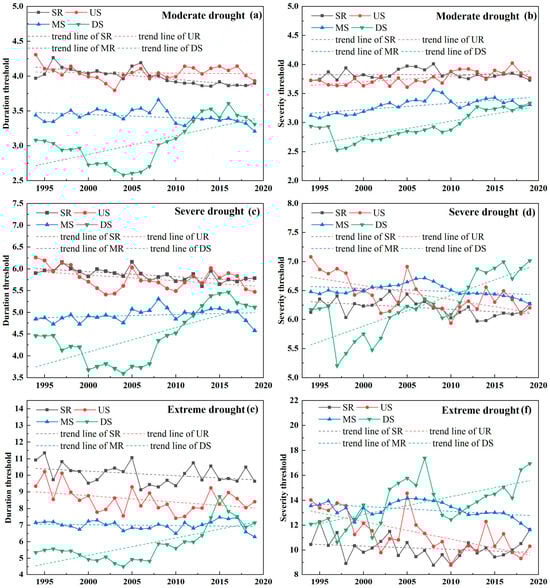
Figure 12.
Temporal evolution of drought propagation thresholds from MD to AD based on the duration (left) and severity (right) under moderate (a,b), severe (c,d), and extreme (e,f) levels.
With respect to the threshold severity of drought propagation, under moderate AD levels, the propagation thresholds in the YRB showed an overall increasing trend. The propagation thresholds in the DR significantly decreased before 2000–2004 and notably increased afterward (Figure 12b). During severe and extreme AD conditions, the propagation thresholds showed an overall decreasing trend in the SR, UR, and MR, whereas the DR exhibited an overall increasing trend (Figure 12d,e).
Overall, the soil moisture system exhibits significant drought resilience in the YRB to MD slightly decreased, indicating that more attention should be given to drought prevention in the SR and UR.
Figure 13 shows the dynamic changes in the propagation thresholds from AD to GD. In terms of the threshold duration of drought propagation, the propagation thresholds in the SR and UR showed decreasing trends. Propagation thresholds in the MR exhibited contrasting patterns dependent on drought intensity, increasing during moderate GD but decreasing under severe/extreme conditions (Figure 13a,c,e). The propagation thresholds in the DR demonstrated increasing trends, with a significant decrease in 2009 and 2010, followed by a continued upward trend.
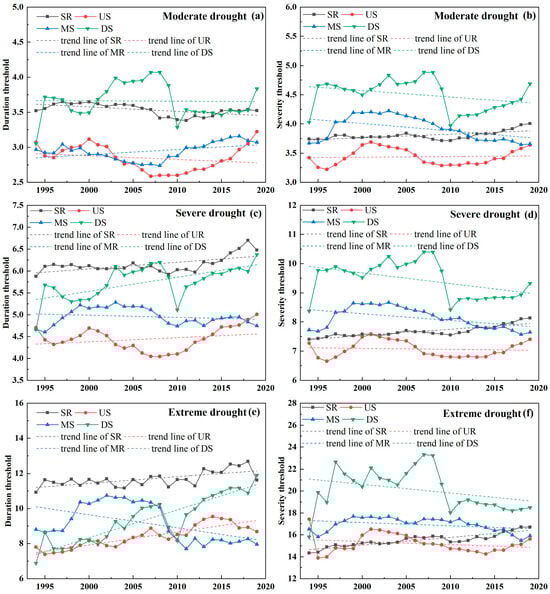
Figure 13.
Temporal evolution of drought propagation thresholds from AD to GD based on the duration (left) and severity (right) under moderate (a,b), severe (c,d), and extreme (e,f) levels.
Regarding drought propagation threshold severity, the SR demonstrated increasing trends, whereas the propagation thresholds in the UR, MR, and DR showed decreasing trends, with the most pronounced decrease occurring in the DR (Figure 13b,d,f, respectively). Notably, choosing the DR as an example, drought propagation thresholds based on duration and severity showed divergent trends, indicating the occurrence of prolonged but less intense GD events in the DR. Therefore, close monitoring of groundwater in the YRB is essential to prevent the occurrence of severe GD events.
4. Discussion
4.1. Comparison of the Correlations and Causal Relationships
Numerous studies have employed correlation analysis to investigate the linkages among various drought categories [15,16]. However, Previous research indicates that correlations do not necessarily indicate the true causal relationships and may involve spurious correlations [34]. Consequently, this study applies the CCM method to evaluate the relationships among various drought types. The CCM method was applied by Luo [39] to examine MD-to-HD propagation across China’s diverse climatic regions. Their research findings suggested that in regions where runoff changes are influenced primarily by precipitation and exhibit a strong causal relationship, the correlation can serve as a simple substitute for exploring the timing of drought propagation. Figure 4 shows that in the evaluation of the interaction between MD and AD, except for the UR and northwestern region of the SR, the correlation between MD and AD is relatively high. Su et al. [40] study used variable infiltration capacity land surface hydrologic model to simulate the physical mechanism of hydrological cycle in SR. The result indicates that precipitation is an important source of soil moisture and runoff in SR. This study used CCM and correlation analysis also proved that MD and AD had stronger relationship in SR. The northwestern region of the SR encompasses extensive seasonally frozen soil, and the freeze–thaw cycles of seasonally frozen soil may influence the interaction between MD and AD [41]. The UR mainly includes the Sichuan Basin, which encompasses well-developed agriculture and irrigation practices that supplement soil moisture, potentially affecting the interaction between MD and AD [42]. Compared with the correlation analysis results, the causal analysis results were more significant. However, the spatial distributions of the correlations and causal relationships between MD and AD were similar. Based on the findings of Luo et al. [39], it can be inferred that in regions where the causal relationship between MD and AD is strong, correlation analysis must be distinguished from causal inference in drought type relationship studies. Wang et al. [43] utilized the coupling model of Soil and Water Assessment Tool and Modular Groundwater Flow Model to simulate the physical processes of the hydrological cycle under both irrigated and non-irrigated conditions. The results indicated that groundwater extraction for irrigation lowers the water table, and that evapotranspiration removes a portion of the irrigated groundwater, demonstrating the interactive influence between groundwater and shallow soil moisture. The findings of this study also reveal that in the Sichuan Basin, a mutual feedback propagation relationship exists between AD and GD.
With respect to the relationship between AD and GD, the northwestern part of the SR exhibits extensive permafrost coverage, and seasonal freeze–thaw cycles inhibit the infiltration of precipitation, thus hindering the vertical exchange of soil water and groundwater, potentially causing them to become decoupled dynamically or even change along opposite directions [44]. The southeastern part of the SR contains karst landforms, where after precipitation events, especially under intense rainfall conditions, water quickly replenishes groundwater through shallow soil layers but fails to effectively replenish shallow soil water [45], thus exhibiting a negative correlation. The UR mainly includes the Sichuan Basin, which contains well-developed agriculture. Surface water irrigation in this region may facilitate soil water and groundwater replenishment, increasing the positive correlation between these two variables [46]. In the MR, soil water and groundwater are supplemented through irrigation canals (such as the return flow of water from the Han River) in rice cultivation areas (such as the Dongting Lake Plain), and human activities may enhance the positive correlation between these two variables. Some areas of the MR and DR are among the most developed in China, especially the Yangtze River Delta region, where frequent human activities and groundwater extraction may lead to a negative correlation between the occurrence of moist soil and groundwater depletion [47,48]. In the downstream estuary adjacent area, a positive correlation was observed, possibly due to tidal influences in this region [49], where seawater or brackish water enters soil pores, thus increasing soil moisture. Additionally, due to increasing water levels, groundwater is lifted, causing both variables to change synchronously and exhibit a positive correlation. Yang et al. [50] employed a hydrological-hydrodynamic coupling model to assess flood discharge changes before and after the construction of the Three Gorges Dam. Yang et al. [50] findings indicate that the dam significantly reduced flood volumes during the wet season. Similarly, Dai et al. [51] demonstrated that the Three Gorges Dam effectively mitigates both floods and droughts. The results of this study further reveal that the causal relationship between agricultural drought (AD) and groundwater drought (GD) is relatively weak, with substantial areas exhibiting no causal linkage in MR and DR, from Figure 5d.
In summary, a complex relationship exists between AD and GD. Figure 4 shows that feedback interaction occurs between AD and GD in the YRB. This study revealed that the correlation between AD and GD is relatively low, but the causal relationship is significant (whether AD → GD or GD → AD). This demonstrates the flexibility of the CCM method in analyzing the relationship between two variables, especially when complex interactions exist between them. Owing to its adaptability to varying data structures and research conditions, the CCM method is well suited for investigating natural phenomena involving intricate interactions.
4.2. Factors Influencing the Characteristics of Drought Propagation
As indicated in Section 3.3, the UR and MR of the YRB exhibit greater DRC than that in the DR. In the SR, the northwestern part is characterized by the occurrence of extensive seasonally frozen soil and significant snowmelt, which provide effective soil water and groundwater replenishment [46]. Additionally, owing to the lower levels of human activities and groundwater extraction in this region, the northwestern part of the SR demonstrates greater resilience to drought. Furthermore, this region comprises mainly alpine meadows with shallow root systems and high water-holding capacity, forming a biological sponge layer [41], this mechanism likely enhances the system’s drought resilience. Apart from the northwestern region, the SR is located mainly in the Hengduan Mountains, where multiple cascading reservoirs have been constructed [52]. The regulating effect of these reservoirs likely increases the DRC in this region. In the UR, which primarily includes the Sichuan Basin, agricultural activities such as irrigation may supplement soil water [42], thereby increasing the DRC for the propagation from AD to MD in the UR. However, the DRC for GD is relatively low, possibly due to groundwater extraction for irrigation. In the UR, irrigation water primarily originates from surface water, but significant amounts of groundwater are still extracted for irrigation during dry periods. This irrigation practice, while mitigating AD, may exacerbate GD [14], leading to a lower DRC for GD in the MR of the YRB. In the highly populated and heavily developed MR and DR of the YRB, extensive human activities and significant groundwater extraction, coupled with the high water demand of double-cropped rice in the MR (requiring 1200 mm/year of water), contribute to groundwater levels decreasing by as much as 0.5 m per day during dry periods. Consequently, the DRC for AD and GD in the MR and DR is generally lower.
As indicated in Section 3.4, the overall trend in drought propagation thresholds within the YRB decreased, suggesting a decreasing DRC in the basin. However, the change in the DRC in the MR was relatively minor, whereas the DR showed an increasing trend in the DRC. This trend may be closely related to various actions implemented by the Chinese government over the years, such as the Three Gorges Project, the return of farmland to lakes, and other initiatives [52,53,54]. The DRC in the DR has significantly increased since approximately 2003, occurring in the same year as the Three Gorges Project became operational, providing important hydrological context. Notably, in 2003, the drought propagation thresholds in the MR and DR of the YRB began to increase. The establishment of the Three Gorges Project may have contributed to the increased DRC in the DR [54]. There were notable decreases in the thresholds in 2009 and 2010. Notably, the Arctic Oscillation is a key teleconnection factor influencing GD in the YRB. Its abnormal fluctuations may indirectly reduce propagation thresholds by altering regional precipitation patterns [55].
4.3. Limitations and Perspectives
This study utilized multi-source data to assess the characteristics and propagation patterns of different drought types in the YRB. In terms of data, ERA5, although assimilated from multiple sources, still exhibits systematic errors in complex terrain and during strong convective events, particularly in precipitation and evapotranspiration prediction [56]. GLDAS soil moisture products are affected by model parameterization and forcing data uncertainties, with more pronounced errors in deep soil layers and densely vegetated regions [57]. GRACE despite post-processing (e.g., destriping, filtering), has a coarse spatial resolution, and uncertainties in separating shallow groundwater from soil moisture may attenuate groundwater drought signals [57,58]. The ERA5, GLDAS, and GRACE datasets used in this study span approximately 20 years. The relatively short time series may limit the capture of long-term drought patterns and could affect the statistical power of the CCM method in detecting causality with long time lags. Extending time series length of datasets in future studies would help improve the robustness of causal inference. The above errors may bias causality strength estimates in the following ways: If errors are correlated across different data sources, they may introduce spurious causal signals or lead to an overestimation of causality strength; If errors are non-systematic or random, they may obscure certain true causal links, resulting in an underestimation of causality strength; The spatial smoothing effect in GRACE data may weaken locally significant causal signals, affecting the accurate quantification of causality between groundwater drought and other drought types. This study is the lack of direct DRC observational data from monitoring networks in YRB, necessitating the use of reanalysis datasets, which somewhat constrains the validation of the absolute accuracy of the results.
Methodologically, the uniform adoption of 1-month drought indices facilitates a consistent propagation comparison framework but may not fully capture the delayed response characteristics of groundwater drought. For MD and AD, the 1-month scale effectively reflects their fast-response nature. For GD, the short scale may underestimate its cumulative memory effect, potentially masking part of its propagation lag in statistical tests. Future research should establish an analytical framework integrating multi-temporal scales (e.g., 1, 3, 6, 12, and 24 months) for GD. This approach will help distinguish short-term meteorological-driven groundwater anomalies from long-term climate memory-dominated systematic groundwater droughts, thereby enabling more precise quantification of the cumulative and lagged effects of meteorological and agricultural droughts on groundwater systems across different temporal scales. Although this study has certain limitations. However, this study can still serve as a reference for regional drought disaster warning and prevention.
Drought propagation entails a complex process in which MD is generally considered the precursor to other drought types. However, there is still debate regarding the propagation relationship between AD and HD. Van Lanen et al. [59] reported that MD leads to AD, which then results in HD. Other studies suggest that HD occurs before AD [60]. This discrepancy may arise from the complex interactions between AD and HD. The scope of this study was limited to characterizing multidimensional drought propagation through the MD-AD-GD cascade in the YRB, excluding HD from the analysis. Future research should aim to thoroughly investigate the systematic characteristics of long-term drought propagation. In addition to the complex relationship between AD and HD, the results shown in Figure 4 and Figure 5 indicate the presence of feedback interactions between AD and GD. This suggests that the drought propagation process may involve not only propagation from AD to GD but also that GD can trigger AD. These findings underscore the importance of identifying drought propagation sequences, while the datasets generated serve as a valuable benchmark for future research.
In this study, causal analysis was employed to investigate the relationships between MD, AD, and GD, thereby providing valuable insights for drought propagation research via the same approach, especially in terms of the direction of drought propagation. For example, in future drought propagation studies, causal analysis helps pinpoint the chronology of drought occurrence, after which the drought propagation time or propagation thresholds can be calculated. However, as mentioned by Zhou et al. [18] indicate that causal analysis applications in hydrometeorological research are still in an early developmental phase. Although emerging research has increasingly focused on causal analysis in drought studies, a substantial amount of research is still needed to demonstrate its applicability in hydrometeorological research.
Report on Policy Relevance and Practical Implications. (1) Differentiated Monitoring Strategies for Sub-regions. Given the higher propagation potential and stronger unidirectional causality from MD to AD in SR, as well as the notable agricultural and groundwater drought severity in parts of the SR and UR, intensified monitoring of soil moisture and groundwater dynamics is recommended in the SR and northwestern UR. In contrast, MR and DR show lower DRC in both soil and groundwater systems, warranting enhanced early-warning systems and preparedness measures for compound drought events in these areas. (2) Groundwater Management Priorities. The study identifies that the correlation and causality between AD and GD are relatively high in the UR, while the SR also shows significant GD severity and propagation from AD. Therefore, groundwater management and extraction policies should be particularly strengthened in the UR and SR, where groundwater systems are more sensitive to agricultural drought propagation. In the MR and DR, although groundwater drought severity is relatively low, the lower DRC suggests the need for sustainable groundwater recharge strategies and usage regulations to prevent future groundwater depletion under recurring meteorological and agricultural droughts. (3) Policy Formulation Informed by Propagation Thresholds. The spatial variability in drought propagation thresholds and DRC across the YRB supports a region-specific policy approach. For instance, the high MD → AD causality in the SR calls for integrated meteorology–agriculture drought response plans, while the UR’s strong AD → GD linkage suggests coordinated management of irrigation and groundwater resources. In the MR and DR, where drought resistance is generally lower, policies could focus on improving water retention infrastructure and promoting drought-resilient crops to mitigate cross-type drought propagation. (4) Enhanced Adaptive Management and Early-Warning Measures. The findings related to propagation thresholds enable authorities to refine drought trigger indicators within monitoring networks, particularly in high-propagation sub-regions. For example, in the SR and UR, where soil and groundwater DRC is higher yet still vulnerable under certain drought conditions, dynamic threshold-based early-warning systems could be implemented to activate preventive measures before droughts propagate across types. Meanwhile, the MR and DR would benefit from a policy emphasis on enhancing system-wide drought resilience through both structural and non-structural measures.
5. Conclusions
This study provided a comprehensive analysis, from the spatiotemporal distributions and interconnections of various drought types to the dynamics of their propagation thresholds and the resultant DRC within the YRB’s soil and groundwater systems. The main conclusions are as follows:
- (1)
- With respect to MD, the drought duration in the SR of the YRB is relatively long, and the drought severity in the MR and DR is relatively high. With respect to AD, the duration and severity in the northwestern part of the SR are relatively large, while the severity in the central part of the UR is also relatively large. With respect to GD, the duration and severity in the northwestern part of the SR are relatively high, whereas those in the DR are relatively low.
- (2)
- In the different regions, the correlation between MD and AD, as well as the unidirectional causal relationship of MD → AD, is highest in the SR, relatively high in the MR and DR, and lowest in the UR. The correlation and causality between AD and GD are relatively high in the UR and relatively low in the MR and DR. However, in the SR, the correlation results are lower than those in the UR, but the degree of causality is greater than that in the UR.
- (3)
- The soil water and groundwater systems in the YRB exhibit greater DRC in the SR and UR and lower DRC in the MR and DR. The soil moisture system’s DRC in the YRB slightly decreases in response to MD, requiring increased attention to drought prevention in the SR and UR. The groundwater system should be monitored closely to prevent the occurrence of severe GD events.
The findings of this study hold significant implications for the formulation of regional drought prevention policies. The spatiotemporal evolution characteristics of different drought types can assist relevant departments in better understanding drought patterns. The identification of propagation thresholds and the comparison of drought resistance capacities across the upper, middle, and lower reaches of the YRB will help relevant authorities develop appropriate and effective drought prevention policies, thereby enhancing drought monitoring and early warning capabilities.
Author Contributions
Conceptualization, Z.Z., and T.W.; data curation, Y.D.; formal analysis, T.W. and L.L.; investigation, L.L. and Z.Z.; methodology, T.W.; resources, T.W. and Z.Z.; software, T.W.; validation, Z.Z., B.S. and L.L.; writing—original draft, T.W. and B.S.; writing—review and editing, Z.Z., L.L. and B.S. All authors have read and agreed to the published version of the manuscript.
Funding
This research was funded by The Postdoctoral Fellowship Program and China Postdoctoral Science Foundation (BX20240442), the National Natural Science Foundation of China (Grant No. 52379083), the Significant Science and Technology Project of the Ministry of Water Resources, China (Grant No. SKR-2022055) and the Basic Scientific Research Project of the China Institute of Water Resources and Hydropower Research (Grant Nos. SE0145B042021 and SE110145B0022023).
Data Availability Statement
The data presented in this study are available on request from the corresponding author.
Acknowledgments
We gratefully acknowledge the helpful and constructive comments on the manuscript provided by the anonymous reviewers.
Conflicts of Interest
Author Yibo Ding was employed by the company Yellow River Engineering Consulting Co., Ltd. The remaining authors declare that the research was conducted in the absence of any commercial or financial relationships that could be construed as a potential conflict of interest.
References
- Wang, X.J.; Zhang, J.Y.; Tong, X.W.; Shamsuddin, S.; He, R.M.; Xia, X.H. Mechanism and comprehensive countermeasure for drought management from the view of catastrophe theory. Nat. Hazards 2014, 71, 823–835. [Google Scholar] [CrossRef]
- Berghuijs, W.R.; Collenteur, R.A.; Jasechko, S.; Jaramillo, F.; Luijendijk, E.; Moeck, C.; Ype, V.D.V.; Allen, S.T. Groundwater recharge is sensitive to changing long-term aridity. Nat. Clim. Change 2024, 14, 357–363. [Google Scholar] [CrossRef]
- Zheng, Y.; Liu, X.H.; Jiao, W.Z.; Zhao, L.J.; Zeng, X.M.; Xing, X.Y.; Zhang, L.N.; Hong, Y.X.; Lu, Q.Q. A new multi-variable integrated framework for identifying flash drought in the Loess Plateau and Qinling Mountains regions of China. Agric. Water Manag. 2022, 265, 107544. [Google Scholar] [CrossRef]
- Zarei, A.R. Spatiotemporal evaluation and prediction of drought susceptibility. Environ. Dev. Sustain. 2025. [Google Scholar] [CrossRef]
- Zhou, Z.Q.; Wang, P.; Li, L.Q.; Fu, Q.; Ding, Y.B.; Chen, P.; Xue, P.; Wang, T.; Shi, H.Y. Recent development on drought propagation: A comprehensive review. J. Hydrol. 2024, 645, 132196. [Google Scholar] [CrossRef]
- Zhang, X.; Hao, Z.C.; Singh, V.P.; Zhang, Y.; Feng, S.F.; Xu, Y.; Hao, F.H. Drought propagation under global warming: Characteristics, approaches, processes, and controlling factors. Sci. Total Environ. 2022, 838, 156021. [Google Scholar] [CrossRef]
- Shi, M.Q.; Yuan, Z.; Shi, X.L.; Li, M.X.; Chen, F.; Li, Y. Drought assessment of terrestrial ecosystems in the YRB, China. J. Clean. Prod. 2022, 362, 132234. [Google Scholar] [CrossRef]
- Zhang, Y.; Hu, X.; Zhang, Z.X.; Kong, R.; Peng, Z.H.; Zhang, Q.; Chen, X. The increasing risk of future simultaneous droughts over the YRB based on CMIP6 models. Stoch. Environ. Res. Risk Assess. 2023, 37, 2577–2601. [Google Scholar] [CrossRef]
- Yang, Y.H.; Weng, B.S.; Bi, W.X.; Xu, T.; Yang, D.M.; Ma, J. Climate Change Impacts on Drought-Flood Abrupt Alternation and Water Quality in the Hetao Area, China. Water 2019, 11, 652. [Google Scholar] [CrossRef]
- Qin, P.C.; Xu, H.M.; Liu, M.; Du, L.M.; Xiao, C.; Liu, L.L.; Tarroja, B. Climate change impacts on Three Gorges Reservoir impoundment and hydropower generation. J. Hydrol. 2020, 580, 123922. [Google Scholar] [CrossRef]
- Liang, H.X.; Zhang, D.; Wang, W.S.; Yu, S.Y.; Nimai, S. Evaluating future water security in the upper YRB under a changing environment. Sci. Total Environ. 2023, 889, 164101. [Google Scholar] [CrossRef]
- Meng, H.Y.; Qian, L.; Duan, K. Evaluating the impacts of flooding on crop yields by different meteorological indices: A regional case study in the middle-lower reach of the Yangtze River, China. Ecol. Indic. 2024, 162, 112068. [Google Scholar] [CrossRef]
- Han, Z.M.; Huang, S.Z.; Zhao, J.; Leng, G.Y.; Huang, Q.; Zhang, H.B.; Li, Z. Long-chain propagation pathways from mete-orological to hydrological, agricultural and groundwater drought and their dynamics in China. J. Hydrol. 2023, 625, 130131. [Google Scholar] [CrossRef]
- Dong, S.Q.; Li, L.Q.; Zhou, Z.Q.; Fu, Q.; Li, M.; Xue, P. Groundwater drought propagation and the drought resistance capacity in different climatic regions of China. Agric. Water Manag. 2025, 312, 109425. [Google Scholar] [CrossRef]
- Ding, Y.B.; Xu, J.T.; Wang, X.W.; Cai, H.J.; Zhou, Z.Q.; Sun, Y.N.; Shi, H.Y. Propagation of meteorological to hydrological drought for different climate regions in China. J. Environ. Manag. 2021, 283, 111980. [Google Scholar] [CrossRef]
- Shi, H.Y.; Zhou, Z.Q.; Liu, L.; Liu, S.N. A global perspective on propagation from meteorological drought to hydrological drought during 1902–2014. Atmos. Res. 2022, 280, 106441. [Google Scholar] [CrossRef]
- Wan, F.; Han, W.H.; Long, Q.B.; Wang, W.J.; Wang, G.Q.; Zhang, F. Study on the evolution law and stage response relationship between meteorological elements and hydrological drought in Xiangtan area. Front. Environ. Sci. 2023, 11, 1327622. [Google Scholar] [CrossRef]
- Zhou, Z.Q.; Ding, Y.B.; Zhao, Y.Y.; Chen, P.; Fu, Q.; Xue, P.; Liu, S.N.; Huang, S.Z.; Shi, H.Y. A new perspective for assessing hydro-meteorological drought relationships at large scale based on causality analysis. Environ. Res. Lett. 2023, 18, 104046. [Google Scholar] [CrossRef]
- Zhao, Y.Y.; Zhou, Z.Q.; Cao, Z.D.; Zou, Y.G.; Wang, Y. Capturing information about the nonlinear impact between droughts and vegetation dynamics based on nonlinear dynamical system theory. J. Hydrol. 2024, 643, 132011. [Google Scholar] [CrossRef]
- Dong, Q.; Chen, K.; Deng, W.; Zhang, H.; Zhang, J. Analysis of propagation thresholds and impact mechanisms from meteor-ological drought to hydrological drought in the middle and upper reaches of the Han River Basin, China. Environ. Monit. Assess. 2025, 197, 633. [Google Scholar] [CrossRef]
- Bhardwaj, K.; Shah, D.; Aadhar, S.; Mishra, V. Propagation of Meteorological to Hydrological Droughts in India. J. Geophys. Res. Atmos. 2020, 125, e2020JD033455. [Google Scholar] [CrossRef]
- Bai, M.; Li, Z.L.; Huo, P.Y.; Wang, J.W.; Li, Z.J. Propagation characteristics from meteorological drought to agricultural drought over the Heihe River Basin, Northwest China. J. Arid. Land 2023, 15, 523–544. [Google Scholar] [CrossRef]
- Wang, T.; Tu, X.J.; Singh, V.P.; Chen, X.H.; Lin, K.R.; Zhou, Z.L.; Zhu, J.L. A CMIP6-based framework for propagation from meteorological and hydrological droughts to socioeconomic drought. J. Hydrol. 2023, 623, 128782. [Google Scholar] [CrossRef]
- Liu, X.; Yue, F.; Li, L.; Zhou, F.; Wen, H.; Yan, Z.; Wang, L.; Wong, W.W.; Liu, C.; Li, S. Chronic nitrogen legacy in the aquifers of China. Commun. Earth Environ. 2025, 6, 58. [Google Scholar] [CrossRef]
- Zhou, Z.Q.; Shi, H.Y.; Fu, Q.; Ding, Y.B.; Li, T.X.; Liu, S.N. Investigating the propagation from meteorological to hydrological drought by introducing the nonlinear dependence with directed information transfer index. Water Resour. Res. 2021, 57, e2021WR030028. [Google Scholar] [CrossRef]
- Zhang, R.Q.; Lu, L.; Ye, Z.; Huang, F.N.; Li, J.D.; Wei, L.; Mao, T.N.; Xiong, Z.L.; Wei, S.G. Assessment of Agricultural Drought Using Soil Water Deficit Index Based on ERA5-Land Soil Moisture Data in Four Southern Provinces of China. Agriculture 2021, 11, 411. [Google Scholar] [CrossRef]
- Shah, J.G.; Kumar, R.; Samaniego, L.; Markonis, Y.; Hanel, M.; Attinger, S.; Hari, V.; Rakovecc, O. On the role of antecedent meteorological conditions on flash drought initialization in Europe. Environ. Res. Lett. 2023, 18, 064039. [Google Scholar] [CrossRef]
- Ding, Y.B.; Lu, Z.H.; Wu, L.L.; Zhou, Z.Q.; Ao, T.Q.; Xu, J.T.; Wei, R.J. Evaluating the spatiotemporal dynamics of driving factors for multiple drought types in different climate regions of China. J. Hydrol. 2024, 640, 131710. [Google Scholar] [CrossRef]
- Liu, Y.; Shan, F.Z.; Yue, H.; Wang, X.; Fan, Y.H. Global analysis of the correlation and propagation among meteorological, agricultural, surface water, and groundwater droughts. J. Environ. Manag. 2023, 333, 117460. [Google Scholar] [CrossRef]
- Li, F.; Kusche, J.; Chao, N.; Wang, Z.; Löcher, A. Long-Term (1979–Present) Total Water Storage Anomalies Over the Global Land Derived by Reconstructing GRACE Data. Geophys. Res. Lett. 2021, 48, e2021GL093492. [Google Scholar] [CrossRef]
- McKee, T.B.; Doesken, N.J.; Kleist, J. The relationship of drought frequency and duration to time scales. In Proceedings of the 8th Conference on Applied Climatology, Anaheim, CA, USA, 17–22 January 1993; pp. 179–184. [Google Scholar]
- Wu, J.F.; Chen, X.H.; Yao, H.X.; Zhang, D.J. Multi-timescale assessment of propagation thresholds from meteorological to hydrological drought. Sci. Total Environ. 2021, 765, 144232. [Google Scholar] [CrossRef]
- Shi, H.Y.; Zhao, Y.Y.; Liu, S.N.; Cai, H.J.; Zhou, Z.Q. A New Perspective on Drought Propagation: Causality. Geophys. Res. Lett. 2022, 49, e2021GL096758. [Google Scholar] [CrossRef]
- Zhou, Z.Q.; Xue, P.; Zhou, X.; Wang, T.; Ding, Y.B.; Zhao, Y.Y.; Chen, P.; Wang, X.W. Assessing the soil moisture-vegetation mutual feedback relationship in different climatic regions of mainland China. Catena 2025, 249, 108684. [Google Scholar] [CrossRef]
- Wei, X.T.; Huang, S.Z.; Li, J.F.; Huang, Q.; Leng, G.Y.; Guo, W.W.; Zheng, X.D.; Bai, Q.J. The negative-positive feedback transition thresholds of meteorological drought in response to agricultural drought and their dynamics. Sci. Total Environ. 2024, 906, 167817. [Google Scholar] [CrossRef] [PubMed]
- Wei, X.T.; Huang, S.Z.; Huang, Q.; Zheng, X.D.; Su, X.L.; Leng, G.Y.; Li, Z.Y.; Guo, Y.; Fang, W.; Liu, Y.J. Propagation characteristics and mechanism from meteorological to agricultural drought in various seasons. J. Hydrol. 2022, 610, 127897. [Google Scholar] [CrossRef]
- Towler, E.; Lazrus, H.; PaiMazumder, D. Characterizing the potential for drought action from combined hydrological and societal perspectives. Hydrol. Earth Syst. Sci. 2019, 23, 1469–1482. [Google Scholar] [CrossRef]
- Lai, Y.; Li, J.; Lee, T.C.; Tse, W.P.; Chan, F.K.S.; Chen, Y.D.; Gu, X. A 131-year evidence of more extreme and higher total amount of hourly precipitation in Hong Kong. Environ. Res. Lett. 2024, 19, 034008. [Google Scholar] [CrossRef]
- Luo, D.; Yang, X.L.; Xie, L.F.; Ye, Z.B.; Ren, L.L.; Zhang, L.Y.; Wu, F.; Jiao, D.L. Propagation characteristics of meteorological drought to hydrological drought in China. J. Hydrol. 2025, 656, 133023. [Google Scholar] [CrossRef]
- Su, T.; Miao, C.; Duan, Q.; Gou, J.; Guo, X.; Zhao, X. Hydrological response to climate change and human activities in the Three-River Source Region. Hydrol. Earth Syst. Sci. 2023, 27, 1477–1492. [Google Scholar] [CrossRef]
- Yang, B.; Duan, Y.H.; Zhao, J.Y.; Tan, C.H.; Gesang, J.M.; Chen, L.; Zhao, Y.G.; Zhang, X.X. Response of soil hydrothermal processes within the active layer to variable alpine vegetation in the Yangtze River Source Area, Qinghai-Tibet plateau. J. Hydrol. Reg. Stud. 2024, 54, 101850. [Google Scholar] [CrossRef]
- Qiu, J.X.; Gao, Q.Z.; Wang, S.; Su, Z.R. Comparison of temporal trends from multiple soil moisture data sets and precipitation: The implication of irrigation on regional soil moisture trend. Int. J. Appl. Earth Obs. Geoinf. 2016, 48, 17–27. [Google Scholar] [CrossRef]
- Wang, C.Y.; Liu, M.H.; Han, Y.P.; Chen, S.; Zhang, F.F.; Qiu, R.J.; Wu, D.F.; Zhang, G.C.; Wang, F.Q.; Liu, J.G. Assessing the impacts of irrigation and soil types on the water balance and groundwater depletion in an irrigation district of the North China Plain based on a coupled SWAT-MODFLOW model. Agric. Water Manag. 2025, 321, 109890. [Google Scholar] [CrossRef]
- Zhang, F.W.; Li, H.Q.; Li, Y.K.; Guo, X.W.; Dai, L.C.; Lin, L.; Cao, G.M.; Li, Y.N.; Zhou, H.K. Strong seasonal connectivity between shallow groundwater and soil frost in a humid alpine meadow, northeastern Qinghai-Tibetan Plateau. J. Hydrol. 2019, 574, 926–935. [Google Scholar] [CrossRef]
- Guo, Y.L.; Huang, F.; Sun, P.A.; Zhang, C.; Xiao, Q.; Wen, Z.; Yang, H. Hydrogeological Functioning of a Karst Underground River Basin in Southwest China. Groundwater 2023, 61, 895–913. [Google Scholar] [CrossRef] [PubMed]
- Li, Z.X.; Gui, J.; Cui, Q.; Xue, J.; Du, F.; Si, L.P. Soil water sources and their implications for vegetation restoration in the Three-Rivers Headwater Region during different ablation periods. Catena 2024, 28, 719–734. [Google Scholar] [CrossRef]
- Xie, W.P.; Yang, J.S. Assessment of Soil Water Content in Field with Antecedent Precipitation Index and Groundwater Depth in the Yangtze River Estuary. J. Integr. Agric. 2013, 12, 711–722. [Google Scholar] [CrossRef]
- Qiao, W.Y.; Hu, B.; Kattel, G.R.; Liu, J. Impact of urbanization on net carbon sink efficiency in economically developed area: A case study of the Yangtze River Delta urban agglomeration, China. Ecol. Indic. 2023, 157, 111211. [Google Scholar] [CrossRef]
- Shi, B.; Zhang, C.C.; Feng, K.; Shi, S.G.; Wei, G.Q.; Hoitink, A.J.F. Soil Stratum Tides. Geophys. Res. Lett. 2023, 50, e2022GL101621. [Google Scholar] [CrossRef]
- Yang, L.H.; Zeng, S.D.; Xia, J.; Wang, Y.L.; Huang, R.Y.; Chen, M.H. Effects of the Three Gorges Dam on the downstream streamflow based on a large-scale hydrological and hydrodynamics coupled model. J. Hydrol. Reg. Stud. 2022, 40, 101039. [Google Scholar] [CrossRef]
- Dai, Z.J.; Du, J.Z.; Li, J.F.; Li, W.H.; Chen, J.Y. Runoff characteristics of the Changjiang River during 2006: Effect of extreme drought and the impounding of the Three Gorges Dam. Geophys. Res. Lett. 2008, 35, L07406. [Google Scholar] [CrossRef]
- Yuan, X.; Wang, J.H.; He, D.M.; Lu, Y.; Sun, J.R.; Li, Y.; Guo, Z.P.; Zhang, K.Y. Influence of cascade reservoir operation in the Upper Mekong River on the general hydrological regime: A combined data-driven modeling approach. J. Environ. Manag. 2022, 324, 116339. [Google Scholar] [CrossRef]
- Xu, Y.Y.; Cheng, X.; Gun, Z. What Drove Regional Changes in the Number and Surface Area of Lakes Across the YRB During 2000–2019: Human or Climatic Factors? Water Resour. Res. 2022, 58, e2021WR030616. [Google Scholar]
- Liu, X.B.; Peng, J.; Liu, Y.X.; Yu, S.Y.; Wang, Y.L. The Three Gorges Dam has weakened the drought propagation process in the YRB. J. Hydrol. 2024, 632, 130875. [Google Scholar] [CrossRef]
- Zhu, Q.; Zhang, H. Groundwater drought characteristics and its influencing factors with corresponding quantitative contribution over the two largest catchments in China. J. Hydrol. 2022, 609, 127759. [Google Scholar] [CrossRef]
- Jiang, Q.; Li, W.Y.; Fan, Z.D.; He, X.G.; Sun, W.W.; Chen, S.; Wen, J.H.; Gao, J.; Wang, J. Evaluation of the ERA5 reanalysis precipitation dataset over Chinese Mainland. J. Hydrol. 2021, 595, 125660. [Google Scholar] [CrossRef]
- Hong, X.; Jia, S.F.; Zhu, W.B.; Song, Z.K. Evaluation of global seamless soil moisture products over China: A perspective of soil moisture sensitivity to precipitation. J. Hydrol. 2024, 641, 131789. [Google Scholar] [CrossRef]
- Amiri, V.; Ali, S.; Sohrabi, N. Estimating the spatio-temporal assessment of GRACE/GRACE-FO derived groundwater storage depletion and validation with in-situ water quality data (Yazd province, central Iran). J. Hydrol. 2023, 620, 129416. [Google Scholar] [CrossRef]
- Van Lanen, H.A.; Wanders, N.; Tallaksen, L.M. Hydrological drought across the world: Impact of climate and physical catchment structure. Hydrol. Earth Syst. Sci. 2013, 17, 1715–1732. [Google Scholar] [CrossRef]
- Li, R.H.; Chen, N.C.; Zhang, X.; Zeng, L.L.; Wang, X.P.; Tang, S.J.; Li, D.R.; Niyogi, D. Quantitative analysis of agricultural drought propagation process in the YRB by using cross wavelet analysis and spatial autocorrelation. Agric. For. Meteorol. 2020, 280, 107809. [Google Scholar] [CrossRef]
Disclaimer/Publisher’s Note: The statements, opinions and data contained in all publications are solely those of the individual author(s) and contributor(s) and not of MDPI and/or the editor(s). MDPI and/or the editor(s) disclaim responsibility for any injury to people or property resulting from any ideas, methods, instructions or products referred to in the content. |
© 2026 by the authors. Licensee MDPI, Basel, Switzerland. This article is an open access article distributed under the terms and conditions of the Creative Commons Attribution (CC BY) license.