Article

The Effects of Two New Fertilizers on the Growth and Fruit Quality of Actinidia eriantha Benth

1
Institute of Horticulture, Hangzhou Academy of Agricultural Sciences, Hangzhou 310024, China
2
Zhengzhou Fruit Research Institute, Chinese Academy of Agricultural Sciences, Zhengzhou 450009, China
3
Zhongyuan Research Center, Chinese Academy of Agricultural Sciences, Zhengzhou 450009, China
4
National Key Laboratory for Germplasm Innovation & Utilization of Horticultural Crops, Zhengzhou 450009, China
*
Authors to whom correspondence should be addressed.
These authors contributed equally to this work.
Agriculture 2025, 15(9), 982; https://doi.org/10.3390/agriculture15090982
Submission received: 3 April 2025 / Revised: 24 April 2025 / Accepted: 28 April 2025 / Published: 30 April 2025
(This article belongs to the Section Crop Production)

Abstract

This study investigated the physiological responses of Actinidia eriantha Benth. cv. ‘Zaoxu’ to water-soluble fertilizer (OWS) and microbial fertilizer (MF) under field conditions from 2022 to 2023. Utilizing a randomized block design, four sequential applications of OWS (T1, T2, and T3) and MF (T4 and T5) were applied at distinct dilution ratios during the shoot elongation phase. A multivariate analytical framework was employed to assess treatment effects on growth dynamics and fruit quality. Experimental data revealed that OWS applied at 1000× dilution significantly enhanced the growth of mother-bearing shoots and the bearing branch group. During the fruit development stage, both the longitudinal and transverse diameters exhibited differential expansion patterns, with the maximal dimensional increases observed under the 1000× and 1500× dilution OWS treatments. The 1000× dilution OWS treatment demonstrated a superior single-fruit weight, achieving a mean single-fruit weight of 57.07 g—a 32.23% increase relative to the control. Fruit quality analyses further indicated elevated concentrations of sugar components, ascorbic acid, and total phenols in the 1000× dilution OWS treatment group. Principal component analysis (PCA) generated a composite quality index (Z-value) yielding the following treatment ranking: T2 > T3 > T5 > T1 > T4 > control. These findings collectively indicate that the 1000× dilution OWS application demonstrated superior efficiency in enhancing both plant growth and fruit quality in ‘Zaoxu’, providing empirical support for optimized fertilization protocols in commercial cultivation systems.

1. Introduction

Kiwifruit (Actinidia Lindl.) constitutes a perennial deciduous vine species within the genus Actinidia. China maintains notably abundant kiwifruit genetic resources [1]. As documented by the Food and Agriculture Organization [2], global kiwifruit production reached 4.54 million metric tons in 2022, with China contributing 2.38 million tons from approximately 200,000 hectares under cultivation, establishing its position as the world’s predominant producer. This crop represents a principal horticultural product in northwestern China’s agricultural systems [3]. Actinidia eriantha Benth., a taxonomically distinct species within the Actinidia genus, exhibits notable phytochemical characteristics, including elevated ascorbic acid (AsA) concentrations, a pronounced fruit flavor, and enhanced environmental stress tolerance [4,5,6]. This species serves as a significant germplasm resource for kiwifruit improvement programs, which are predominantly distributed in China’s Yangtze River Basin, the Yunnan–Guizhou Plateau, and the Sichuan Basin (regions that belong to the subtropical zone) [7]. Following A. chinensis and A. deliciosa in commercial importance, A. eriantha demonstrates substantial potential for agricultural development due to its nutritional composition and economic viability.
However, wild A. eriantha populations present agronomic limitations characterized by reduced soluble solids contents (SSCs) and elevated fruit acidity, factors that constrain their utilization in contemporary breeding initiatives and commercial production systems. These phenotypic traits necessitate further investigation to optimize this species’ horticultural applications. Various agronomic practices have been implemented to enhance the fruit quality of kiwifruit, including the application of chemical fertilizers and plant growth regulators (PGRs) [8,9,10]. However, inappropriate utilization of PGRs has been associated with several adverse effects, including elevated rates of fruit deformity [10], undesirable peel pigmentation, premature physiological maturation, and increased postharvest losses, collectively resulting in the deterioration of kiwifruit quality parameters. Consequently, scientific fertilizer application represents an effective approach for improving the agronomic traits of A. eriantha. Currently, new fertilizers are increasingly being adopted in fruit tree cultivation, particularly organic water-soluble fertilizers (OWS) and microbial fertilizers (MFs). These differ fundamentally from conventional chemical fertilizers. While traditional water-soluble fertilizers primarily consist of mineral-based formulations, organic water-soluble and biofertilizers remain relatively underutilized.
In kiwifruit cultivation systems, the scientific application of organic water-soluble fertilizer (OWS) has demonstrated significant potential for soil amelioration. Through the enhancement of soil aggregate stability, these amendments improve soil aeration and porosity, thereby establishing optimal growth conditions for crop development. Furthermore, OWS provides essential mineral nutrients while exhibiting multiple beneficial properties, including moisture retention, nutrient conservation, and sustained nutrient release, ultimately contributing to enhanced yields, improved fruit quality parameters, and increased economic returns in kiwifruit production [11,12,13]. Microbial fertilizers (MFs), characterized by their bioactive microbial components, represent a distinct category of functional fertilizers. These formulations demonstrate multiple beneficial effects, including plant growth promotion, soil fertility enhancement, and phytopathogen suppression. Their unique properties have established their significance in sustainable agricultural practices, particularly in relation to food safety and fertilizer resource conservation [14]. Recent research has documented the successful application of MF across various fruit crop systems, including kiwifruit, apple, sweet orange, and strawberry [14,15,16,17].
In cultivation management systems, optimized use schemes for OWS or MF should be formulated based on cultivar characteristics and regional edaphic conditions to maximize fertilization efficiency, optimize fertilization costs, and enhance agricultural profitability. Nevertheless, current research demonstrates a paucity of empirical studies addressing standardized application protocols for OWS or MF in kiwifruit production systems. To address this knowledge gap, the present investigation systematically evaluated the physiological effects of two new fertilizers on ‘Zaoxu’, a new kiwifruit cultivar selected from wild A. eriantha Benth. populations for its high vitamin C content, enhanced stress tolerance, and high-yield characteristics. Specific objectives included (1) quantifying the effects of OWS and MF on plant growth parameters and (2) assessing their influence on fruit quality indices. This research aimed to establish evidence-based fertilization strategies and provide technical frameworks for nutrient management optimization in A. eriantha cultivation.

2. Materials and Methods

2.1. Experimental Site Characterization

This study was carried out in the kiwifruit orchard of the Zhijiang Test Base, Hangzhou Academy of Agricultural Sciences, Zhejiang Province. Grafted seedlings of ‘Zaoxu’ A. eriantha Benth planted in 2022 were used as test materials, and a multi-layer vertical kiwifruit cultivation system with 2 m × 3 m plant-row spacing was adopted. This experiment was carried out from 2022 to 2023. Hangzhou is situated within the subtropical monsoon climatic zone, which is characterized by distinct seasonal precipitation patterns. Meteorological data indicate an annual mean temperature of 17.8 °C, with summer maxima reaching 42 °C. This region receives approximately 1800 sunshine hours and averages 1450 mm of precipitation annually. The experimental plots were established on paddy soil. Pedological analysis of the surface horizon (depth: 0~20 cm) revealed the following edaphic characteristics: an alkaline pH (8.4), an organic matter content of 7.3 g/kg, an available nitrogen (NH4+-N and NO3-N) content of 34.5 mg/kg, an extractable phosphorus content of 23.8 mg/kg, and an exchangeable potassium content of 517.7 mg/kg.

2.2. Experimental Design and Treatments

Two new fertilizers were used in this experiment. “Zao Neng+” is an organic water-soluble fertilizer (OWS), and its active ingredients are organic matter ≥ 120 g/L, P2O5 + K2O ≥ 80 g/L, and seaweed polysaccharide ≥ 50 g/L. The other fertilizer was a microbial fertilizer (MF) named “Seawinner double seaweed 200”. Its active ingredients include an effective viable count ≥ 20 billion/g, alginate ≥ 1000 ppm, and seaweed polysaccharide ≥ 1 g/L. These two fertilizers were provided by Qingdao Seawin Biotech Group Co., Ltd., Qingdao, China. This study employed a randomized block design with six experimental treatments. Each experimental unit consisted of three uniformly sized grafted saplings. A consistent canopy volume and vegetative vigor were maintained. The treatments are shown in Table 1.
The experimental fertilizers were applied during two consecutive growing seasons (2022~2023) according to a standardized application protocol. Initial treatments were implemented during the new shoot elongation phase (early May), with subsequent applications at 30-day intervals, totaling four applications per growing season. Fertilizer solutions were delivered via targeted root-zone irrigation administered at four equidistant points (cardinal directions: east, south, west, and north) positioned 30~40 cm from the trunk base. A uniform irrigation volume of 5 kg per tree was maintained across all treatments. Organic fertilizer made of rapeseed cake was applied as a base fertilizer during the dormancy stage on both sides of all trees.

2.3. Plant Biomass

To quantify treatment effects on plant biomass accumulation, six mother-bearing shoots (primary fructification axes) per tree were tagged in 2022 for longitudinal monitoring. Growth dynamics were assessed through weekly measurements, with concurrent evaluations of all associated bearing branches (secondary fructification complexes). The lengths of the mother-bearing shoots and the bearing branch group were measured by a ruler, and an electronic vernier caliper was used to measure the branch coarseness.

2.4. Determination of Fruit Growth Parameters

In 2023, fruit development was monitored through five representative fruits per tree across all treatments. Phenological assessments were conducted at 15-day intervals, commencing 60 days after full bloom (DAFB60; 5 July), continuing through DAFB180 (4 November), and encompassing 9 distinct developmental stages. The longitudinal diameter and transverse diameter were measured using an electronic vernier caliper according to the above date. The fruit shape index was calculated as the longitudinal diameter/transverse diameter ratio. The single-fruit weight was measured by an electronic balance. Fruit firmness was determined with a digital fruit firmness meter (GY-4, TOP Cloud-agri, Hangzhou, China) according to the Agricultural Industry Standards of China [18].

2.5. Analysis of Fruit Pigment Parameters

Chlorophyll and carotenoid quantification was conducted according to established spectrophotometric and HPLC protocols. N,N-dimethylformamide (DMF) and hexane/acetone/ethanol (50:25:25 [v/v]) were used as extraction solutions according to the methodologies described by Moran [19] and Ma et al. [20].

2.6. Measurement of Fruit Quality

The soluble solid content (SSC) was determined by a portable digital refractometer (PAL-1, Atago, Tokyo, Japan). Sugar components in the fruits, including fructose, glucose, and sucrose, were measured by the LC–MS/MS method based on a previously reported method [21], and organic acid components were determined according to Flores et al. [22].

2.7. Measurement of Fruit Antioxidants

The antioxidant capacity of the fruits was evaluated through quantitative analysis of three key bioactive compounds: ascorbic acid (AsA), the total phenolic content (TPC), and the total flavonoid content (TFC). Each parameter was determined using validated analytical methods. The determination of the ascorbic acid in the fruit was based on the HPLC protocol outlined in the National Standard of China [23]. The Folin–Ciocalteu method was adopted to determine the total phenolic content in the fruits [24]. The total flavonoid content was determined using the aluminum nitrate chromogenic method [25].

2.8. Statistical Analysis

The experimental data were subjected to comprehensive statistical analysis using a suite of analytical software packages: Microsoft Excel 2016 for preliminary data organization, Origin 2018 for graphical representations, and IBM SPSS Statistics 25 for advanced statistical computations. Treatment effects were evaluated through a one-way analysis of variance (ANOVA), with post hoc comparisons conducted using Duncan’s new multiple range test at a significance level of 0.05.

3. Results

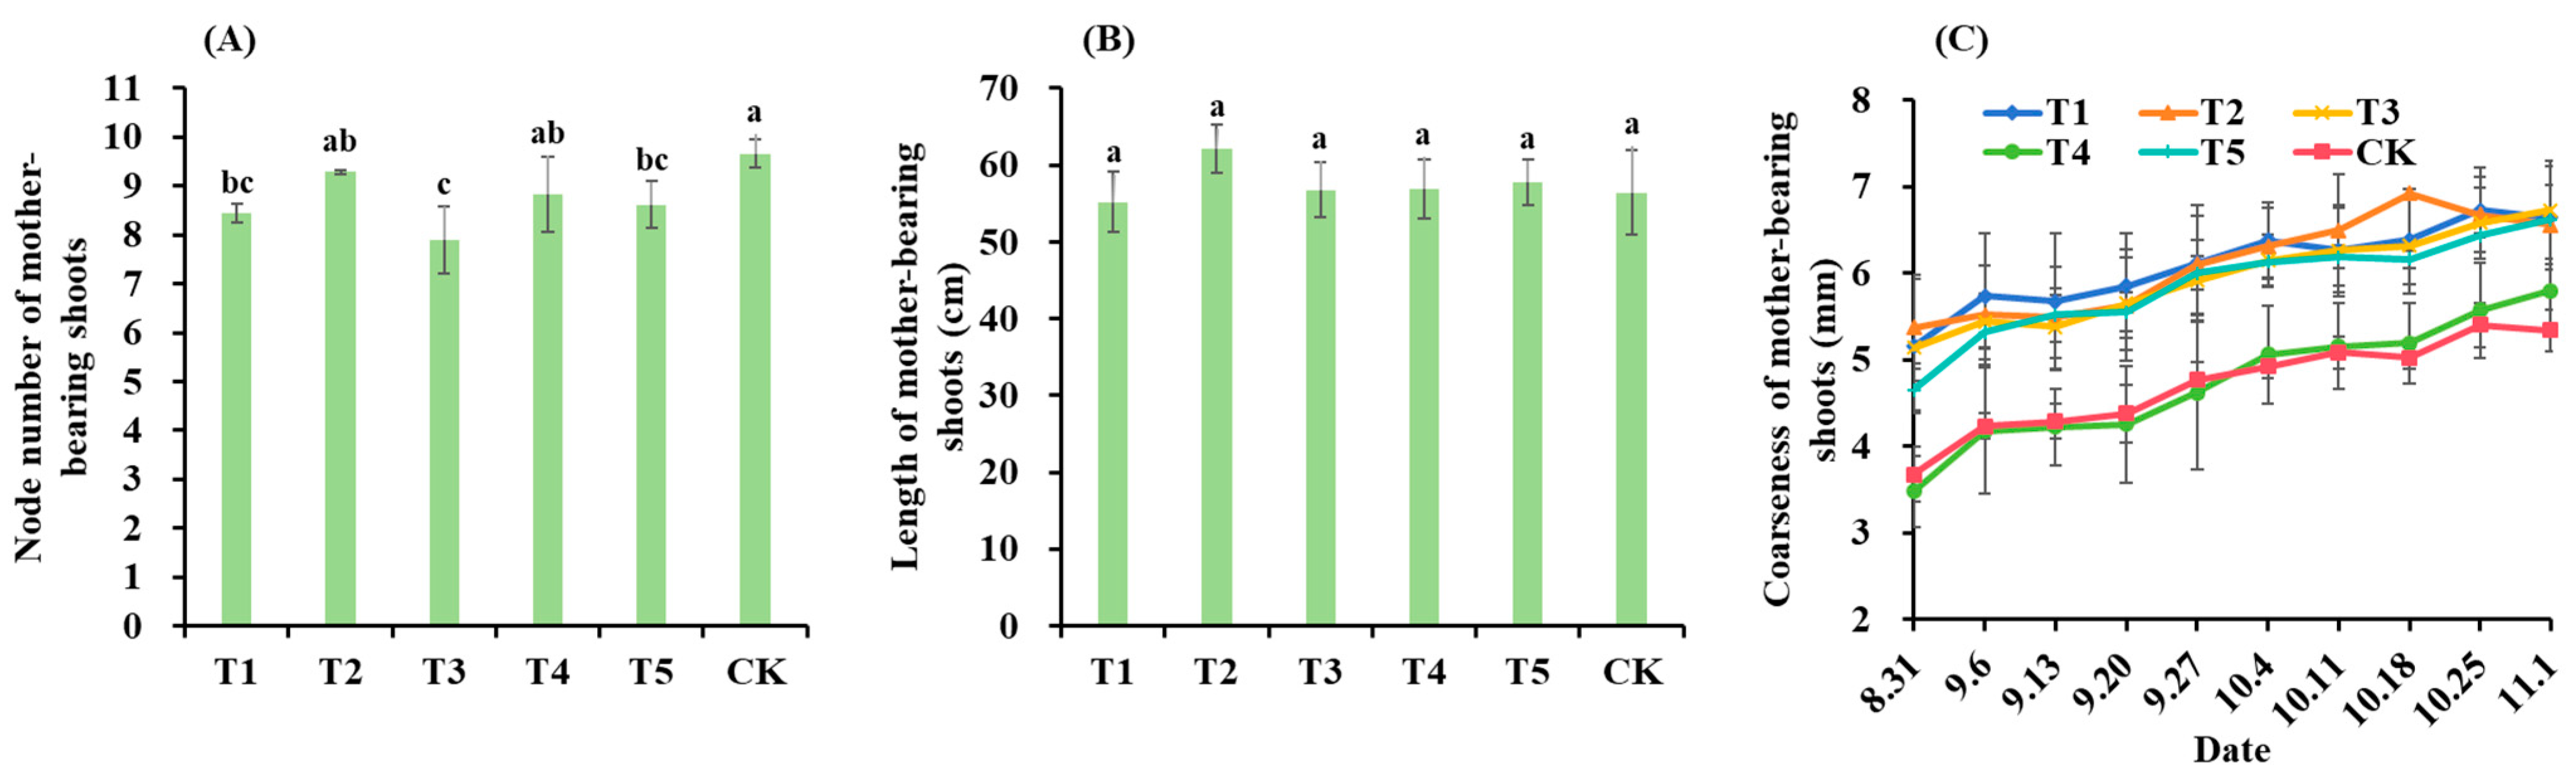
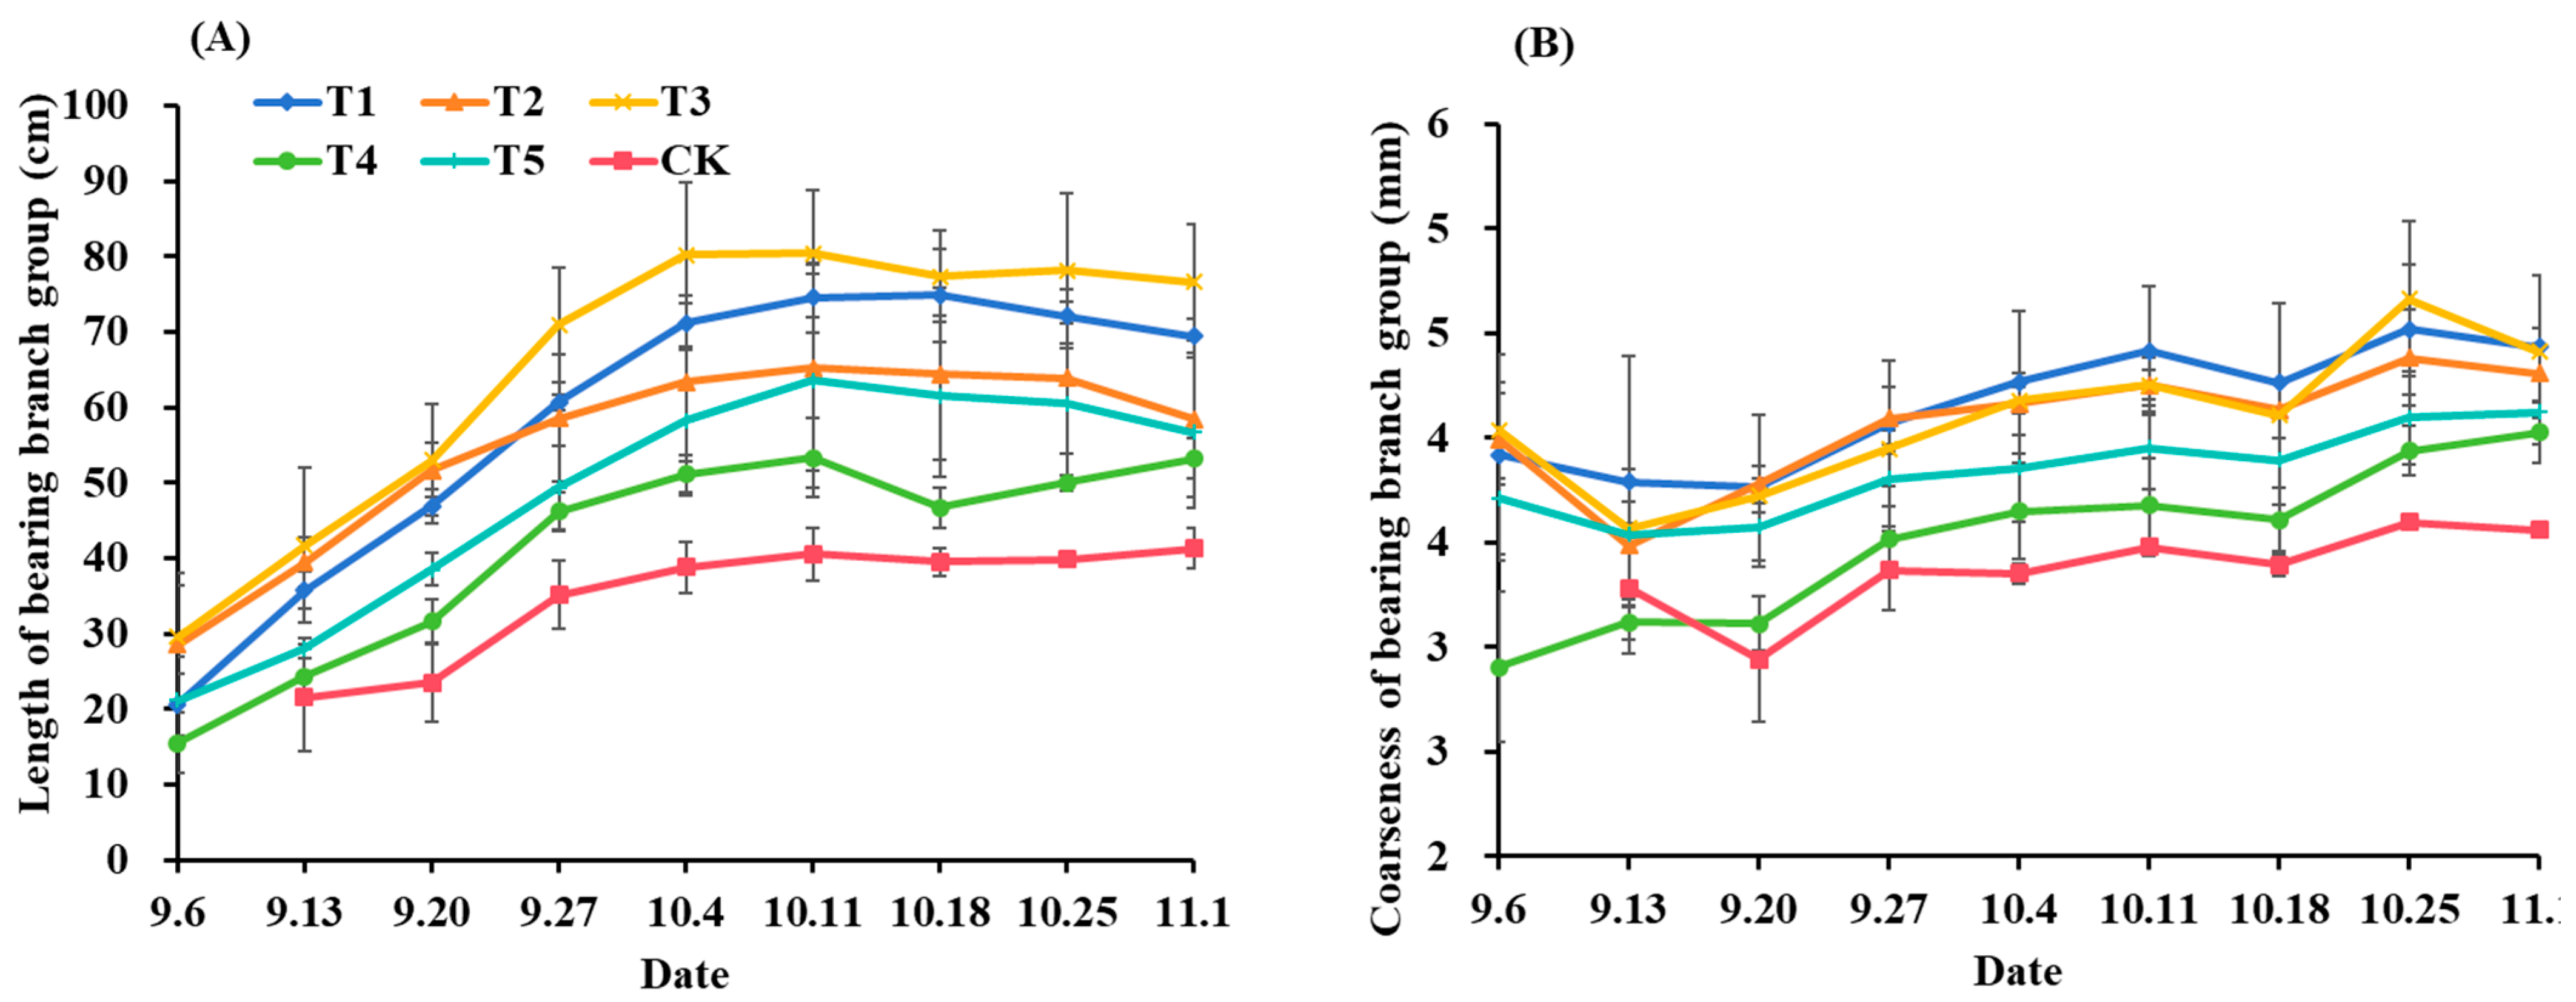
3.1. Growth of Mother-Bearing Shoots and Bearing Branch Group

The analysis of the growth parameters revealed distinct treatment effects on the development of mother-bearing shoots and the bearing branch group. The node number of the mother-bearing shoots demonstrated a consistent reduction across all treatments relative to the control (Figure 1A), with treatment T3 exhibiting the most pronounced decrease. Notably, treatments T2 and T4 showed node numbers comparable to the control, indicating non-significant differences. The longitudinal growth measurements of the mother-bearing shoots indicated enhanced shoot elongation in all treatments except treatment T1 (Figure 1B), with treatment T2 achieving maximal extension growth. However, inter-treatment variations in shoot length did not reach statistical significance. All treatments exhibited progressive increases in the coarseness of the mother-bearing shoots throughout the observation period (Figure 1C), with the control and T4 treatments demonstrating limited diameter expansion. In contrast, treatments T1, T2, T3, and T5 demonstrated enhanced coarseness.
In 2022, all treatments demonstrated rapid growth of the bearing branch group until October 4, and growth stabilization occurred between 4 October and 1 November (Figure 2A). Among them, treatment T3 showed the maximal growth speed, followed by treatments T1 and T2. However, treatments T4 and T5 demonstrated reduced extension in comparison. All fertilized treatments exceeded the control values for the final length of the bearing branch group. The change in the coarseness of the bearing branch group followed a more gradual development compared to the change in length. Treatments T1, T2, and T3 maintained superior coarseness, but treatment T4 and the control group showed limited coarseness expansion. These differential growth results indicate that the OWS applications, particularly at intermediate dilutions (T2), promoted more balanced development of the bearing branch group compared to the MF treatments.

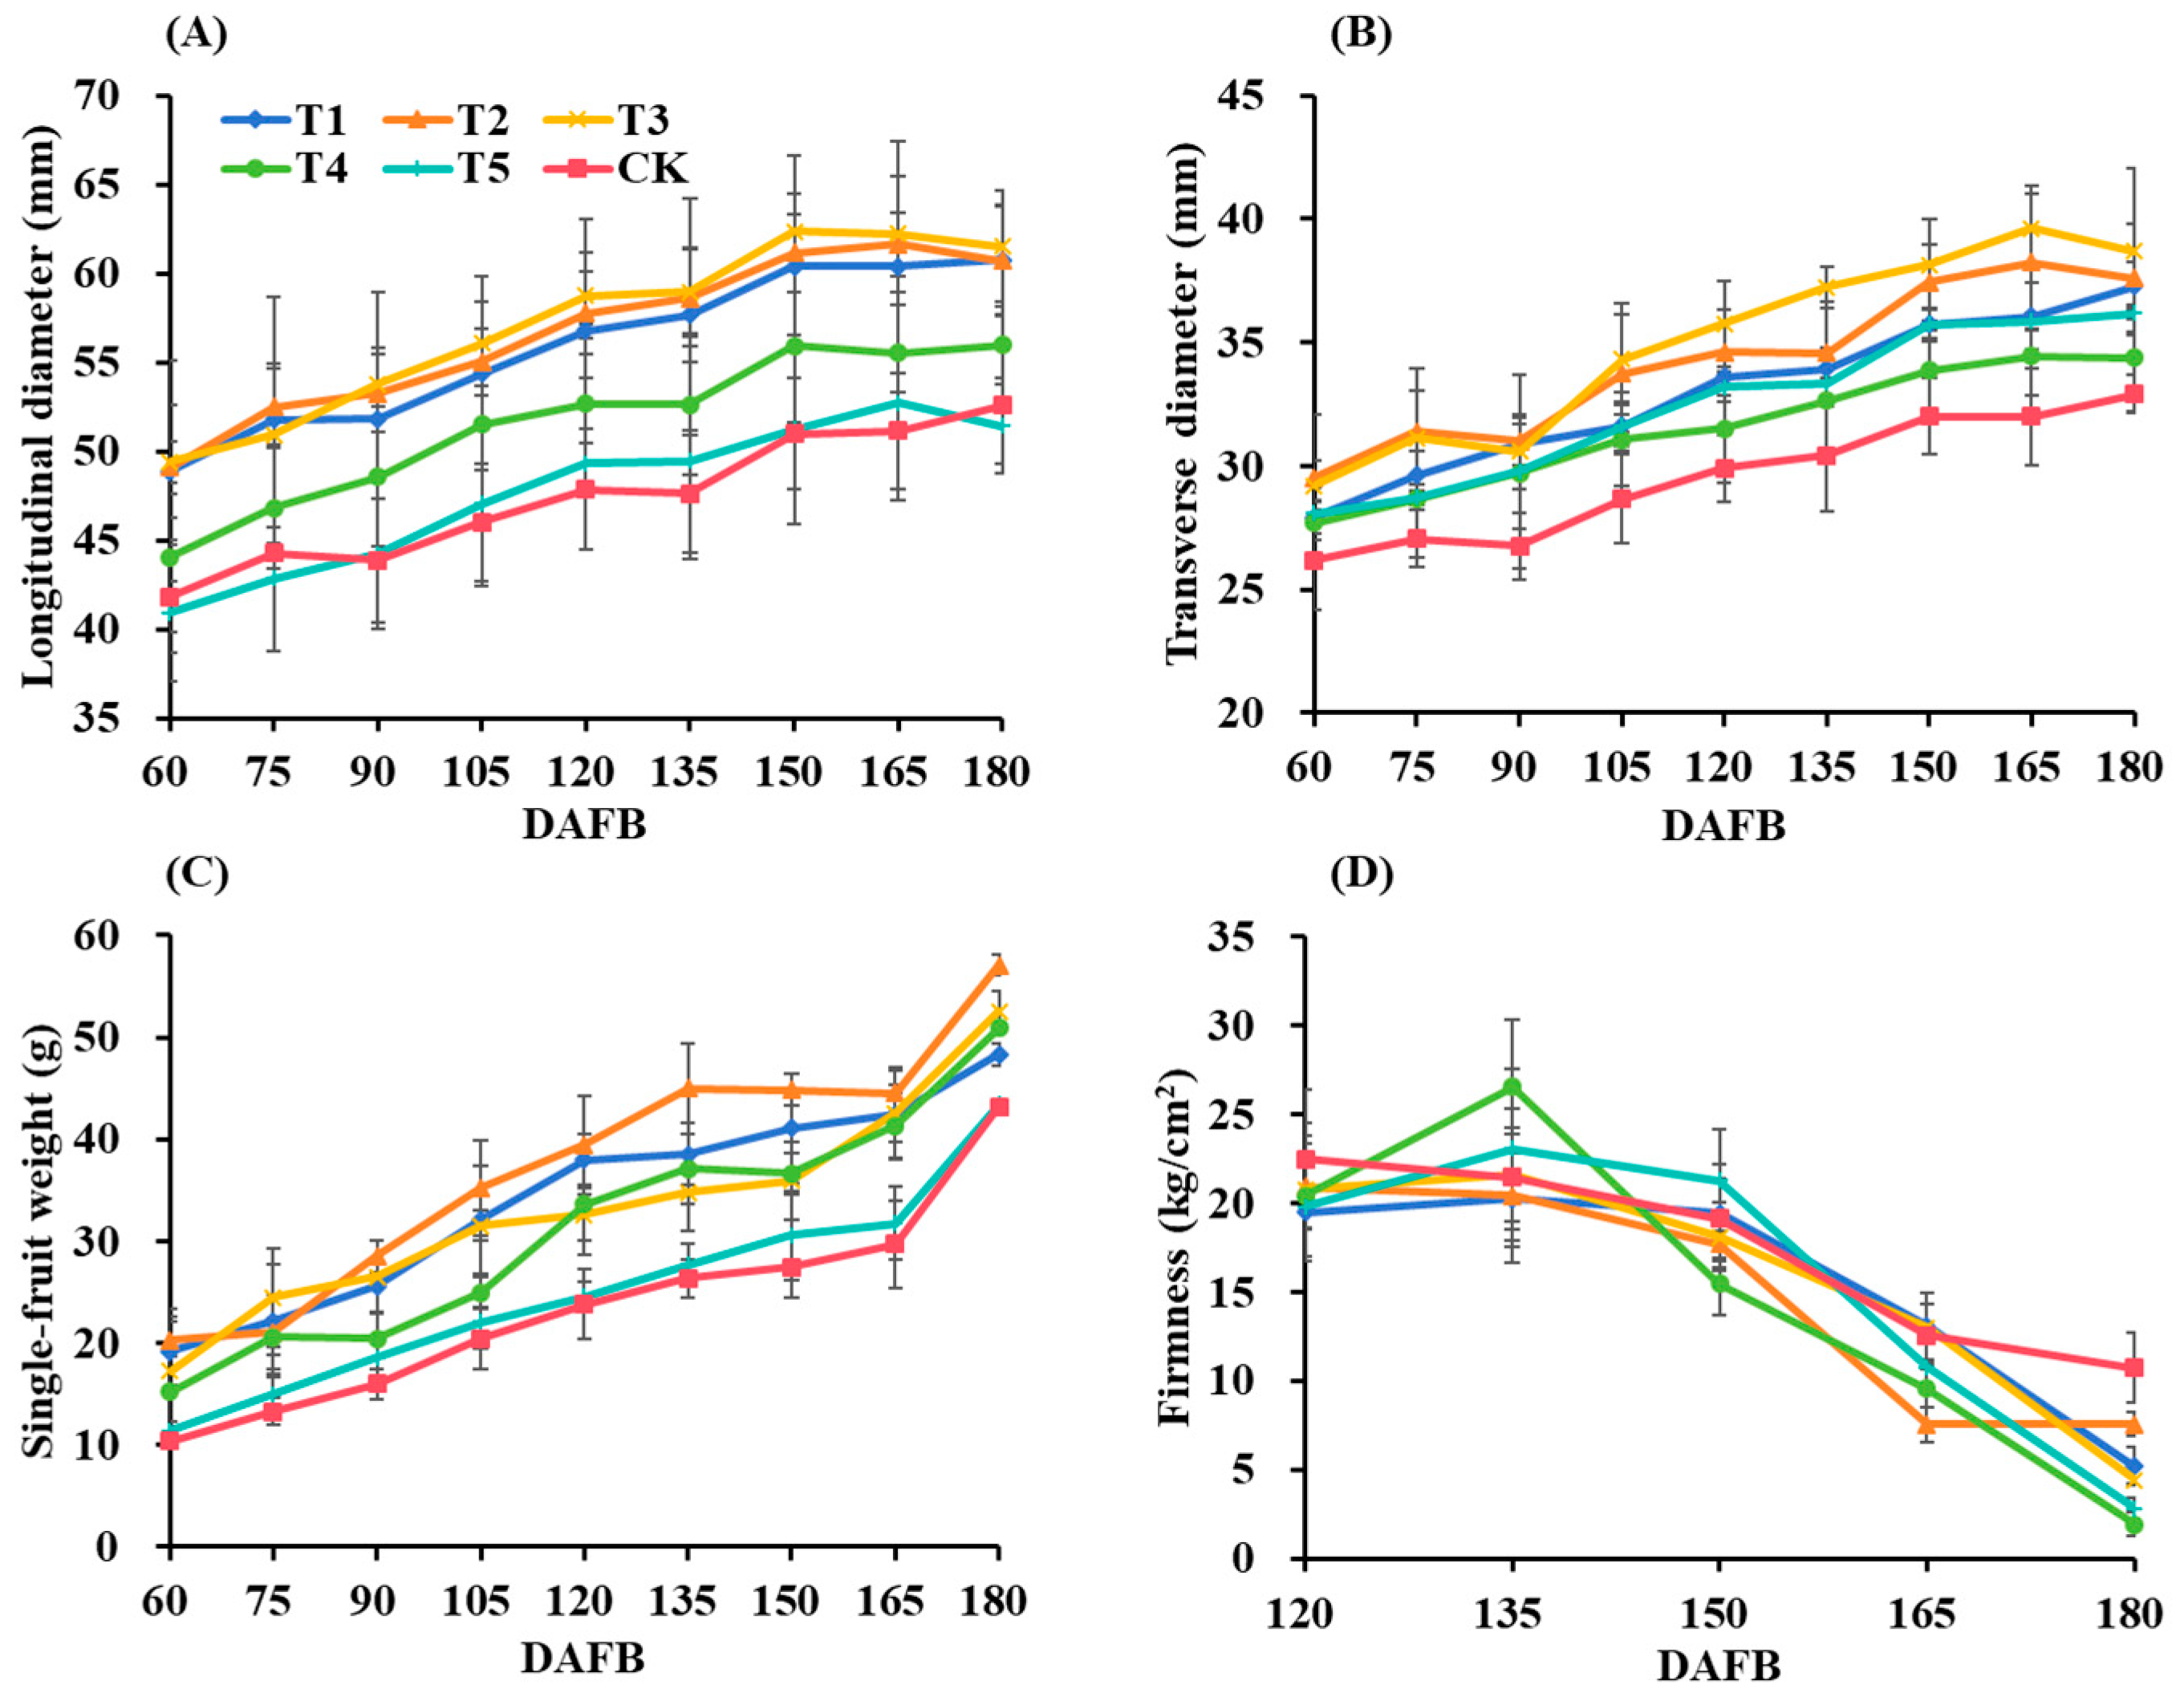
3.2. Fruit Growth Parameters

Both the longitudinal and transverse diameters of the fruits exhibited differential expansion patterns across the treatments (Figure 3A,B). Among them, T3 showed maximal diametral growth, followed by treatments T1 and T2. In contrast, treatments T4 and T5 and the control group exhibited significantly reduced dimensional expansion. The single-fruit weights of ‘Zaoxu’ under the different treatments followed treatment-specific patterns during the entire growth period (Figure 3C), with all fertilized treatments significantly exceeding the control values. Treatment T2 yielded the maximal single-fruit weight, and the values of treatments T1, T2, and T3 were higher than those of treatments T4 and T5, indicating that OWS (T1–T3) demonstrated superior performance relative to MF (T4 and T5) in biomass accumulation. With fruit ripening, the fruit firmness revealed distinct softening patterns during maturation (Figure 3D). Treatment T4 exhibited pronounced variability in firmness measurements, and treatments T4 and T5 demonstrated characteristics of accelerated softening. These results suggest that OWS promotes more balanced fruit development, while MF treatments may influence cell wall metabolism during ripening.
Quantitative evaluation of ‘Zaoxu’ fruit during the maturity period revealed significant treatment effects on fruit morphology and quality parameters (Table 2). The results demonstrated that the OWS treatments (T1, T2, and T3) significantly exceeded the control values for both the longitudinal and transverse diameters, while the MF treatments (T4 and T5) showed intermediate values. The fruit shape index (the longitudinal/transverse ratio) exhibited consistent reductions across all treatments relative to the control, though the inter-treatment differences were not statistically significant. The single-fruit weight was maximized in treatment T2, representing a 32.23% enhancement over the control. Firmness analysis revealed that the control fruits maintained superior firmness, significantly exceeding all treatment values, with treatments T4 and T5 showing the most pronounced softening.

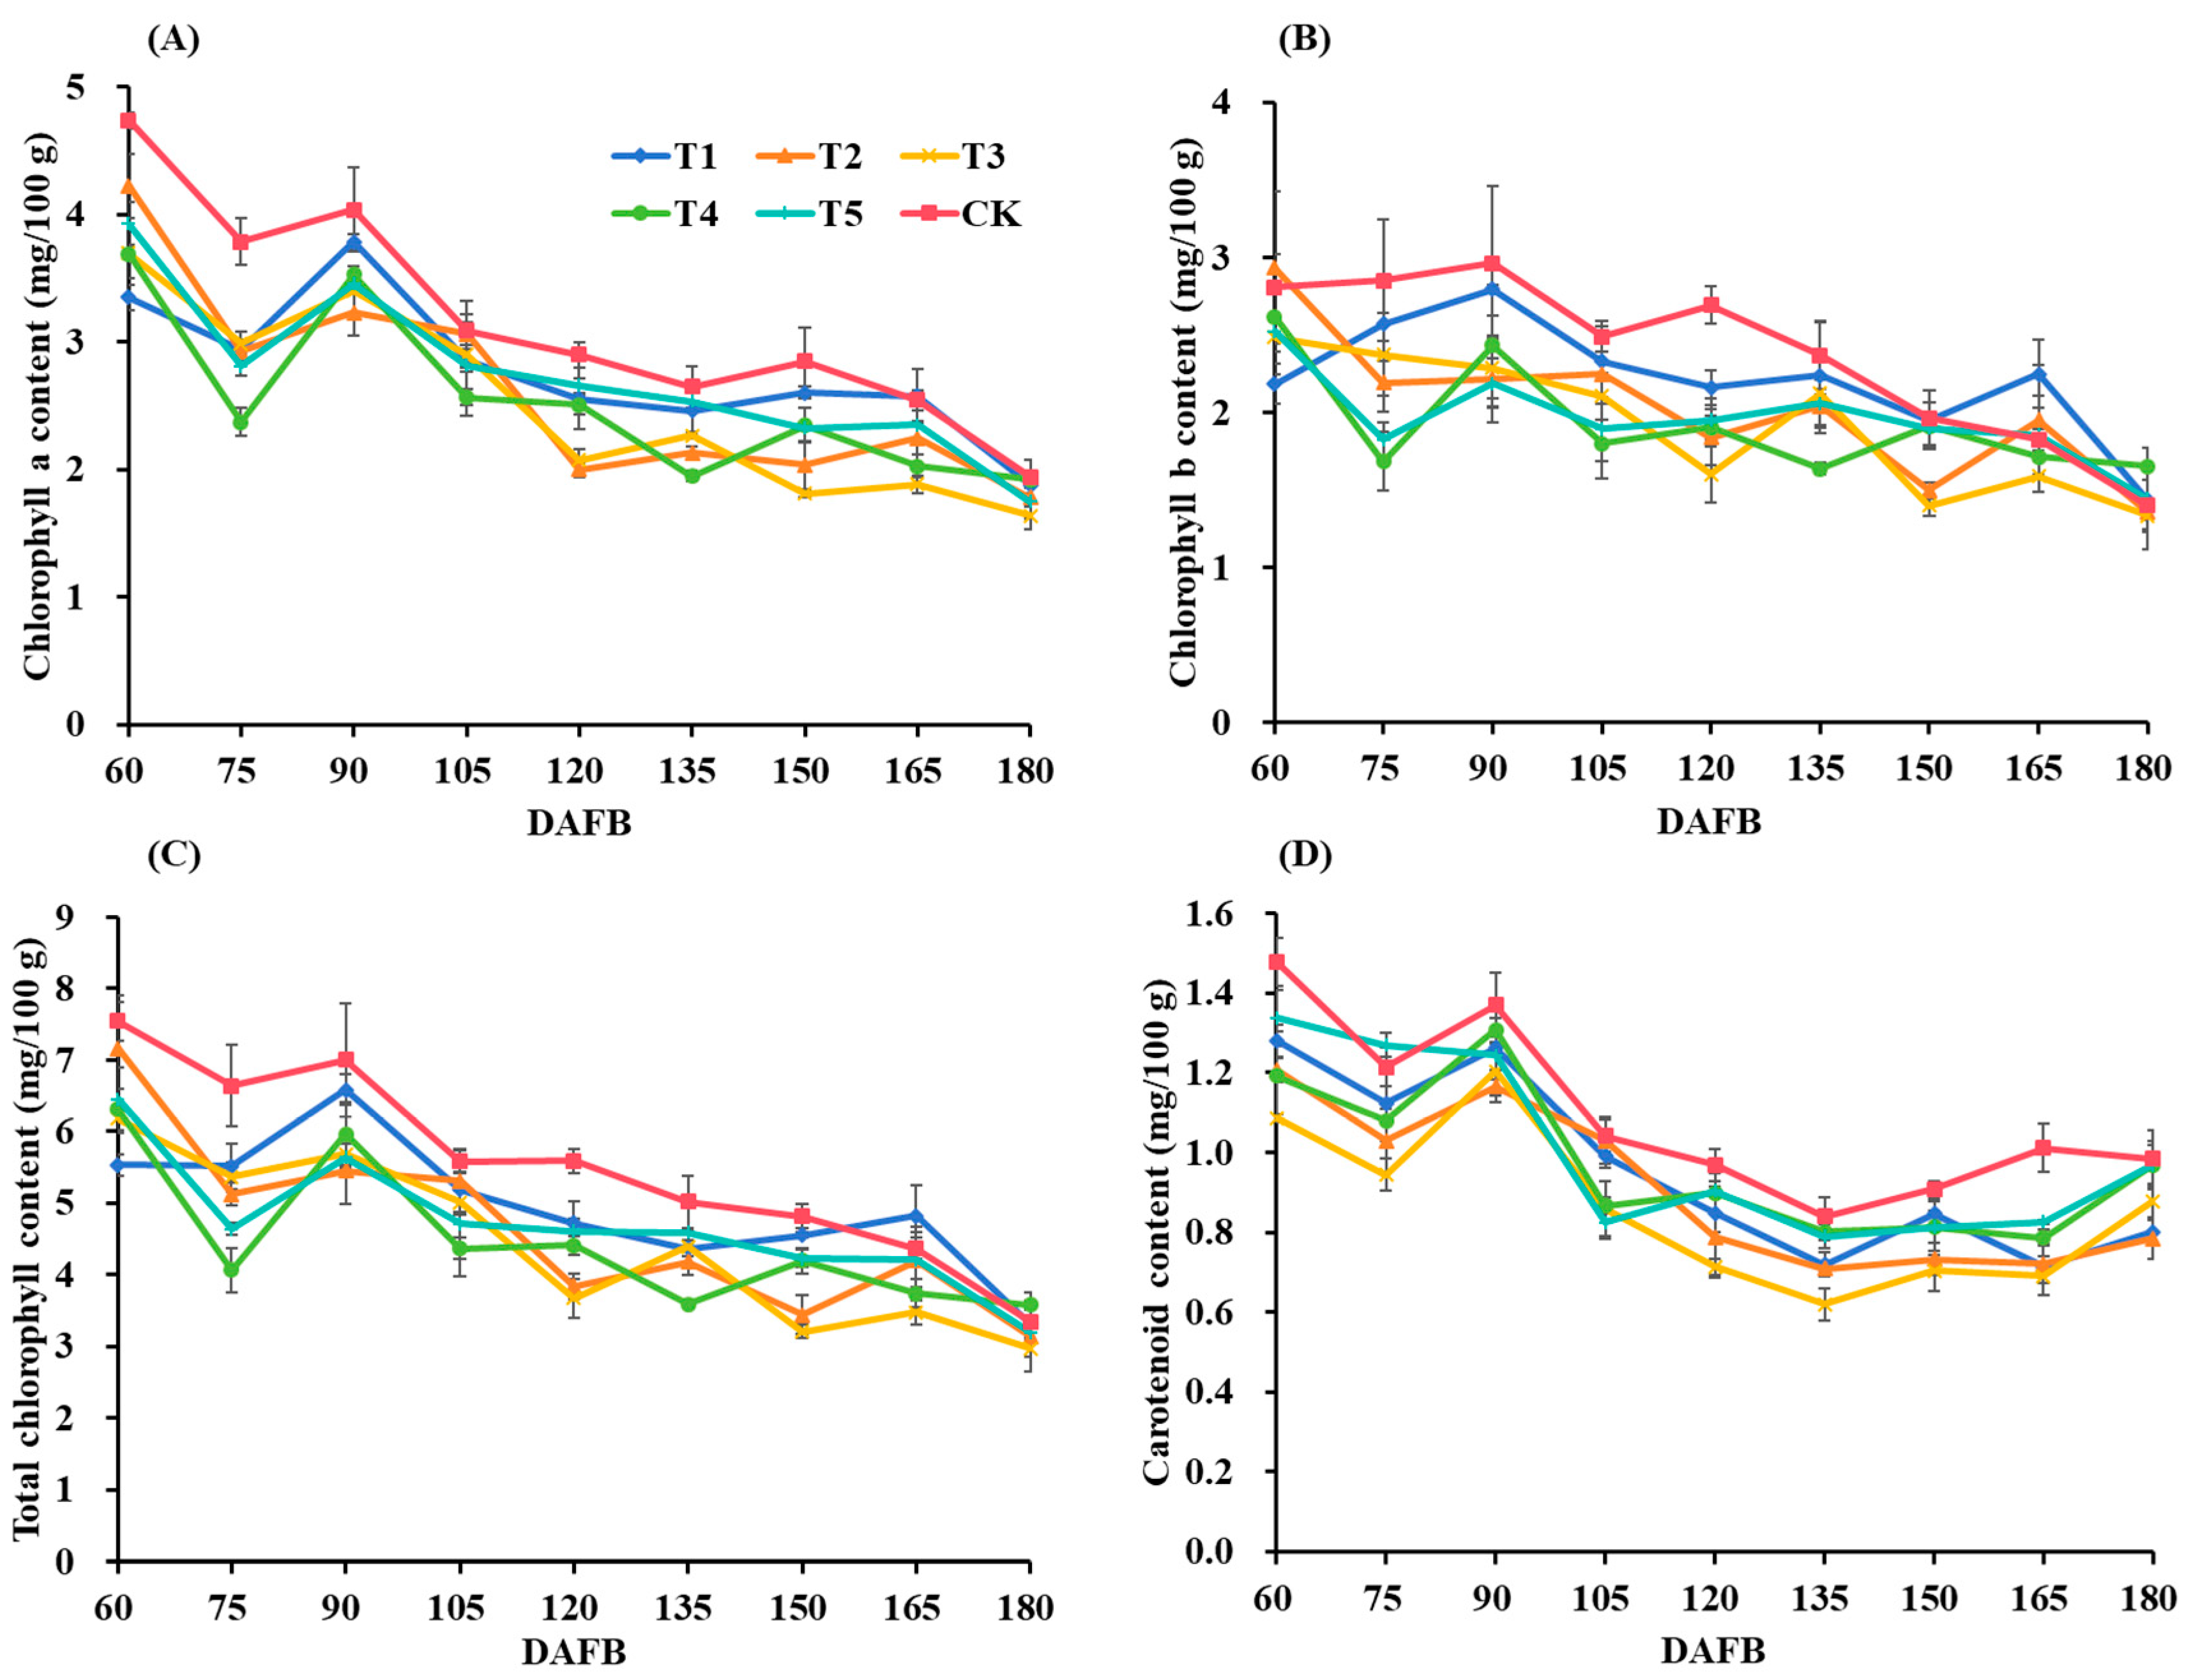
3.3. Pigment Parameters of Fruit

From DAFB60 to DAFB90, the content of chlorophyll a exhibited a trend of initial decline followed by a subsequent increase (Figure 4A). After DAFB90, the values of all treatments decreased gradually, and minimal values were observed during the maturity period. The control maintained a consistently higher chlorophyll a content during development. Chlorophyll b displayed marked fluctuations and a general decreasing trend, reaching minimal values during the maturity period (Figure 4B). While the control showed superior chlorophyll b retention, all treatments except T4 tended to be consistent at maturity. The trend of the total chlorophyll content of all treatments was similar to that of chlorophyll a, demonstrating sustained degradation throughout fruit development (Figure 4C). In general, the control fruits maintained significantly higher chlorophyll concentrations during the active growth phases.
The carotenoid profiles were different than the chlorophyll patterns, exhibiting an initial decline followed by recovery (DAFB60-90) before progressive degradation until DAFB135 (Figure 4D). Post-DAFB135 fluctuations showed treatment-specific variations, with the control samples maintaining consistently elevated carotenoid levels during active growth. These differential pigment paths suggest treatment-specific modulation of chloroplast maintenance and carotenoid metabolism during fruit maturation.
The experimental results demonstrate that the fertilizers differentially influenced pigment retention and composition during the maturity period of the ‘Zaoxu’ fruit (Table 3). The chlorophyll a and total chlorophyll contents demonstrated superior retention in the control, T1, and T4 treatments, with T3 exhibiting 15.83% and 11.19% reductions relative to the control, respectively. Chlorophyll b accumulation peaked in treatment T4, while T3 showed minimal retention; however, the inter-treatment differences in chlorophyll b did not reach statistical significance. The carotenoid profiles showed differential accumulation patterns, with the control, T4, and T5 treatments maintaining significantly higher concentrations compared to treatments T1 and T2. These findings demonstrate that OWS at higher dilutions may accelerate chlorophyll degradation and MF treatments may enhance specific pigment retention. In contrast, carotenoid metabolism is differentially regulated by the fertilizer type and concentration.

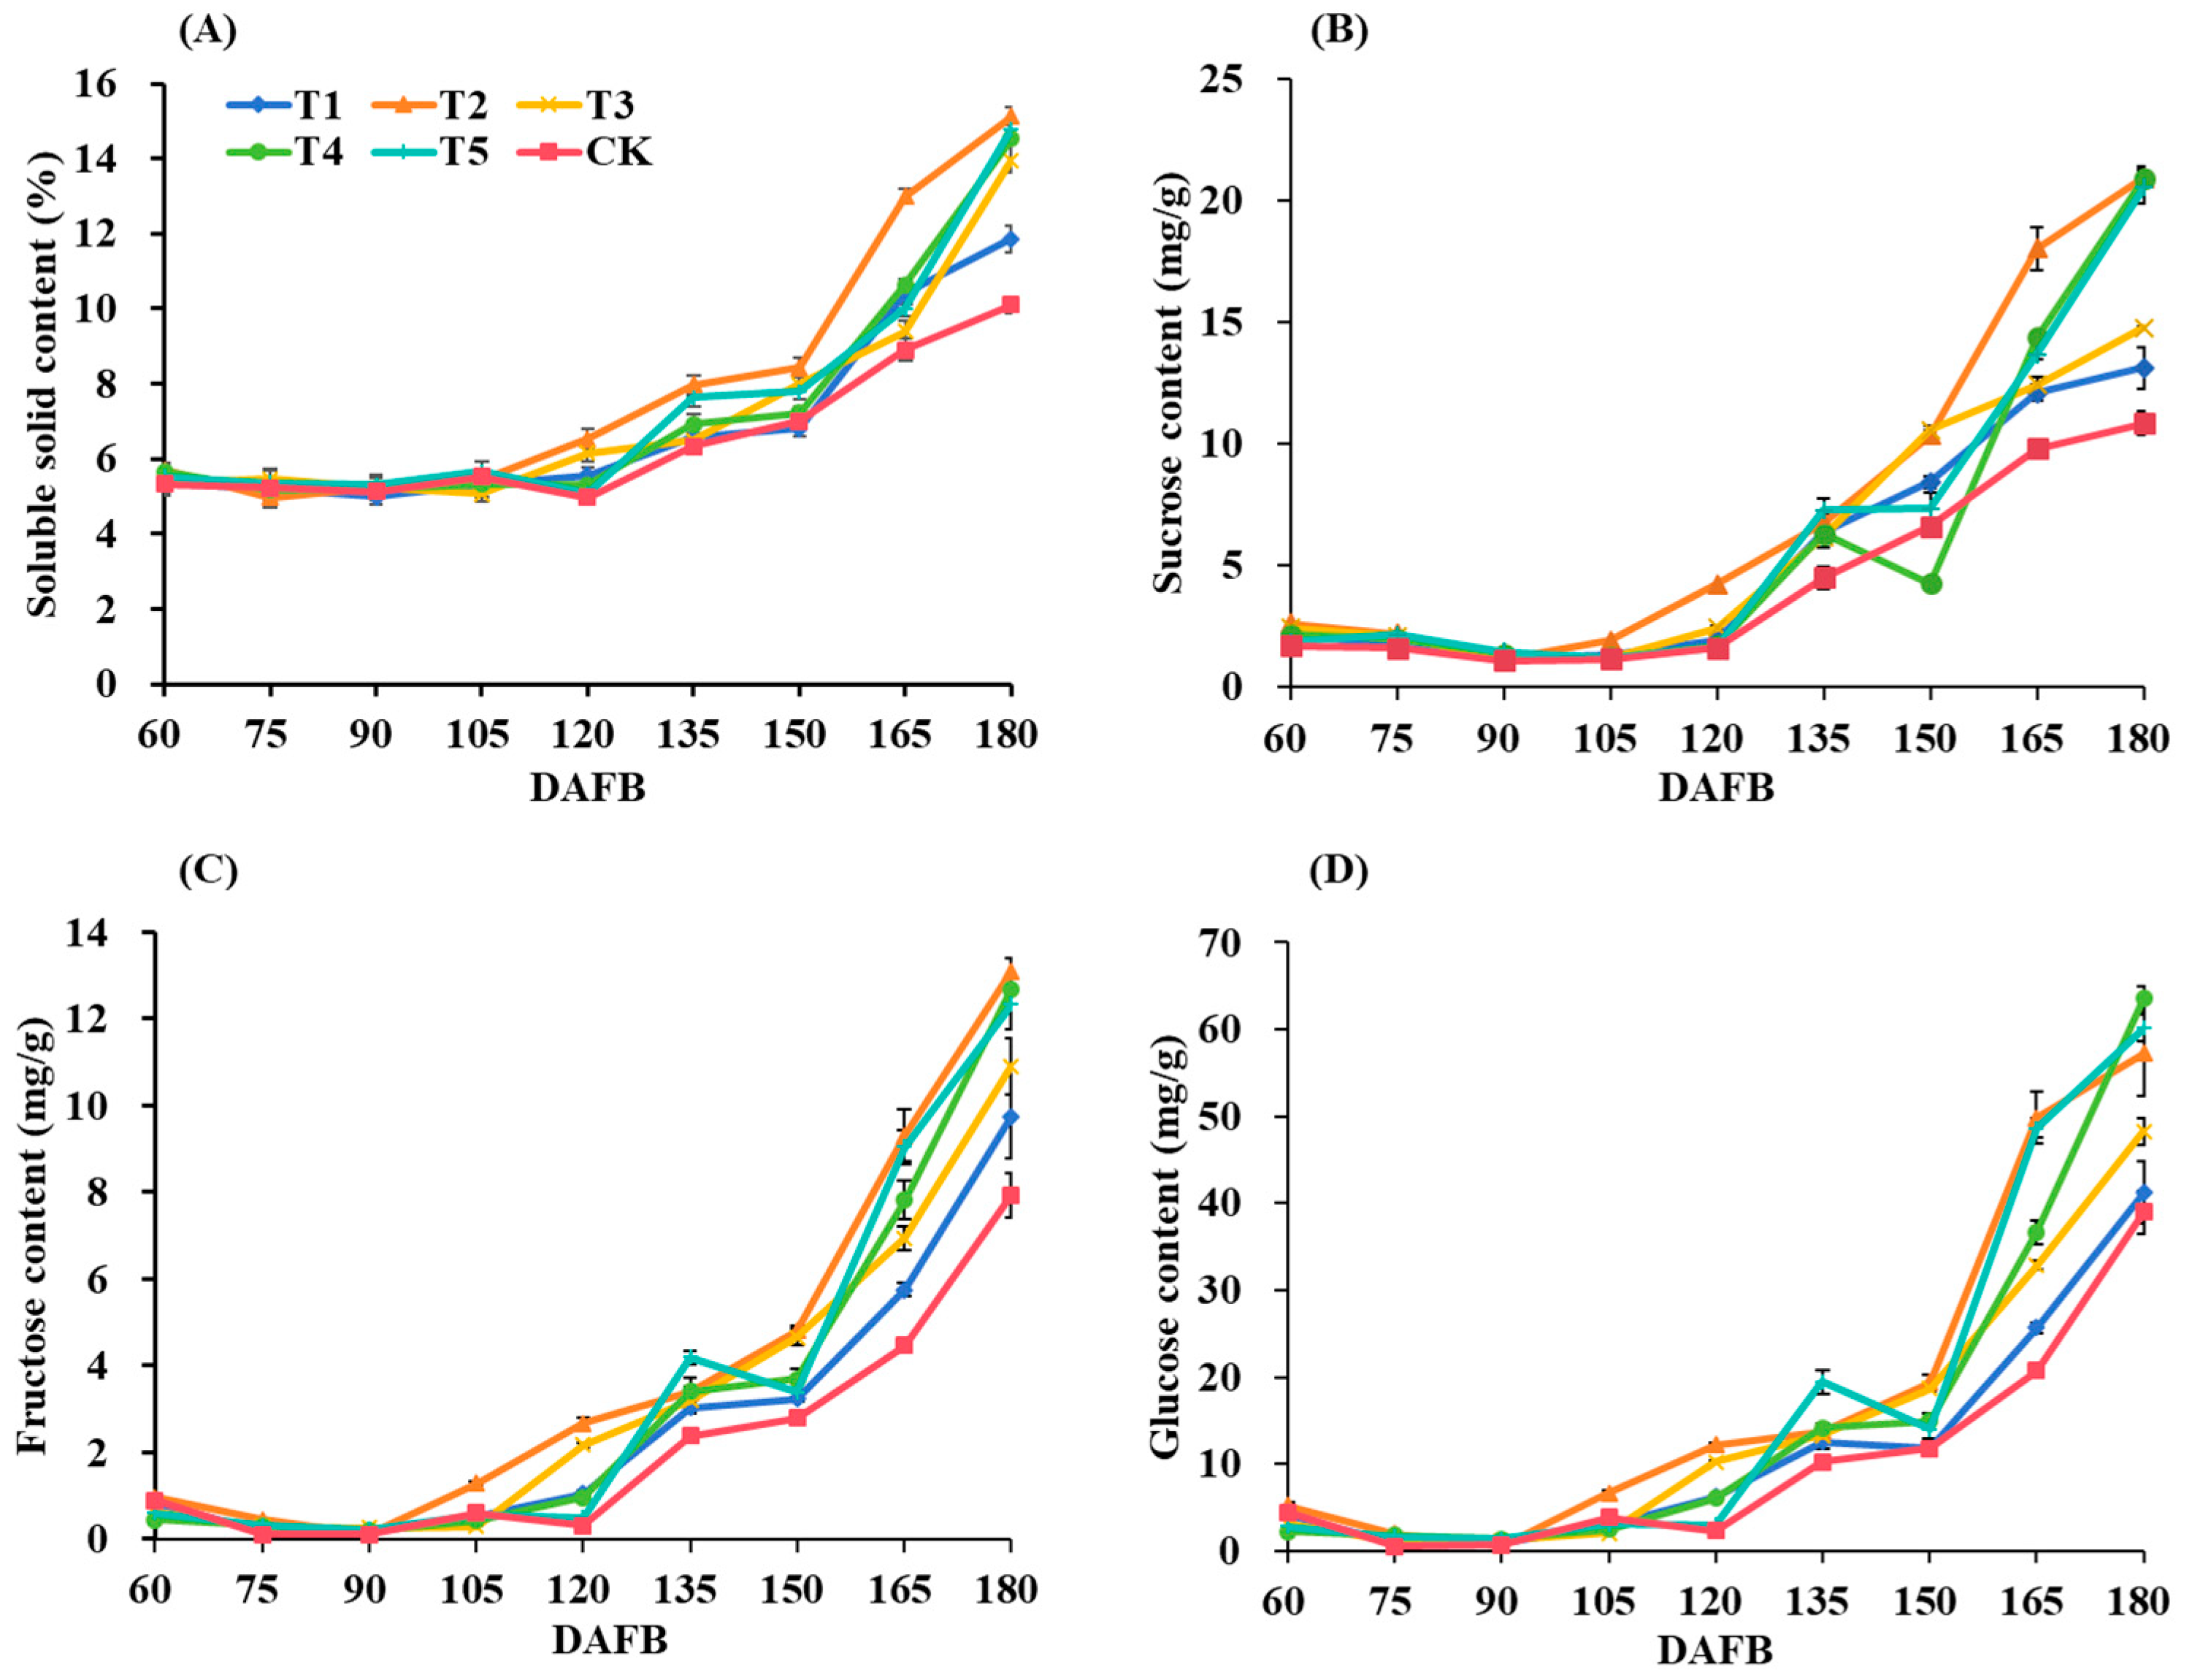
3.4. Sugar Components

The temporal progression of the sugar components in the ‘Zaoxu’ fruits exhibited distinct developmental patterns (Figure 5). The soluble solid content (SSC) demonstrated a biphasic accumulation pattern. Stability was maintained during early development (pre-DAFB105), followed by a pronounced escalation phase commencing at DAFB105, with treatment T2 exhibiting the most marked increase. All fertilized treatments significantly surpassed the control values for final SSC accumulation. Sugar metabolism revealed a compound-specific pattern: the sucrose and fructose concentrations initially declined from DAFB60 to DAFB90, subsequently gradually recovered between DAFB90 and DAFB120, and ultimately rapidly accumulated during late maturation. Notably, treatment T2 displayed superior accumulation rates. The glucose dynamics paralleled the sucrose patterns at substantially elevated concentrations, demonstrating a consistent monotonic increase throughout development. The treatment efficiency remained consistent across the sugar components, with the control fruits maintaining significantly depressed sugar levels. These metabolic patterns suggest differential treatment effects on sugar-metabolizing enzyme activities, and the optimal performance of treatment T2 indicates intermediate-concentration OWS most effectively enhances carbohydrate accumulation in developing kiwifruit.
Quantitative evaluation of the soluble sugar profiles of the ‘Zaoxu’ during the maturity period revealed significant treatment-induced variations (Table 4). Treatment T2 exhibited the maximal SSC accumulation (15.13%), representing a 49.83% enhancement relative to the control. Subsequent treatments demonstrated decreasing efficiency, with all fertilized treatments significantly surpassing the control values. The sucrose and fructose concentrations followed similar distribution patterns, with treatment T2 achieving the highest values, followed by treatments T4 and T5. Glucose emerged as one of the predominant sugar components, maintaining concentrations 2.7~5.0-fold greater than other measured sugars. Notably, treatment T4 demonstrated superior glucose accumulation, while the control samples consistently showed depressed values across all measured parameters. These results demonstrate that fertilization significantly altered the sugar accumulation patterns and that treatment T2 optimally enhanced overall sugar accumulation.

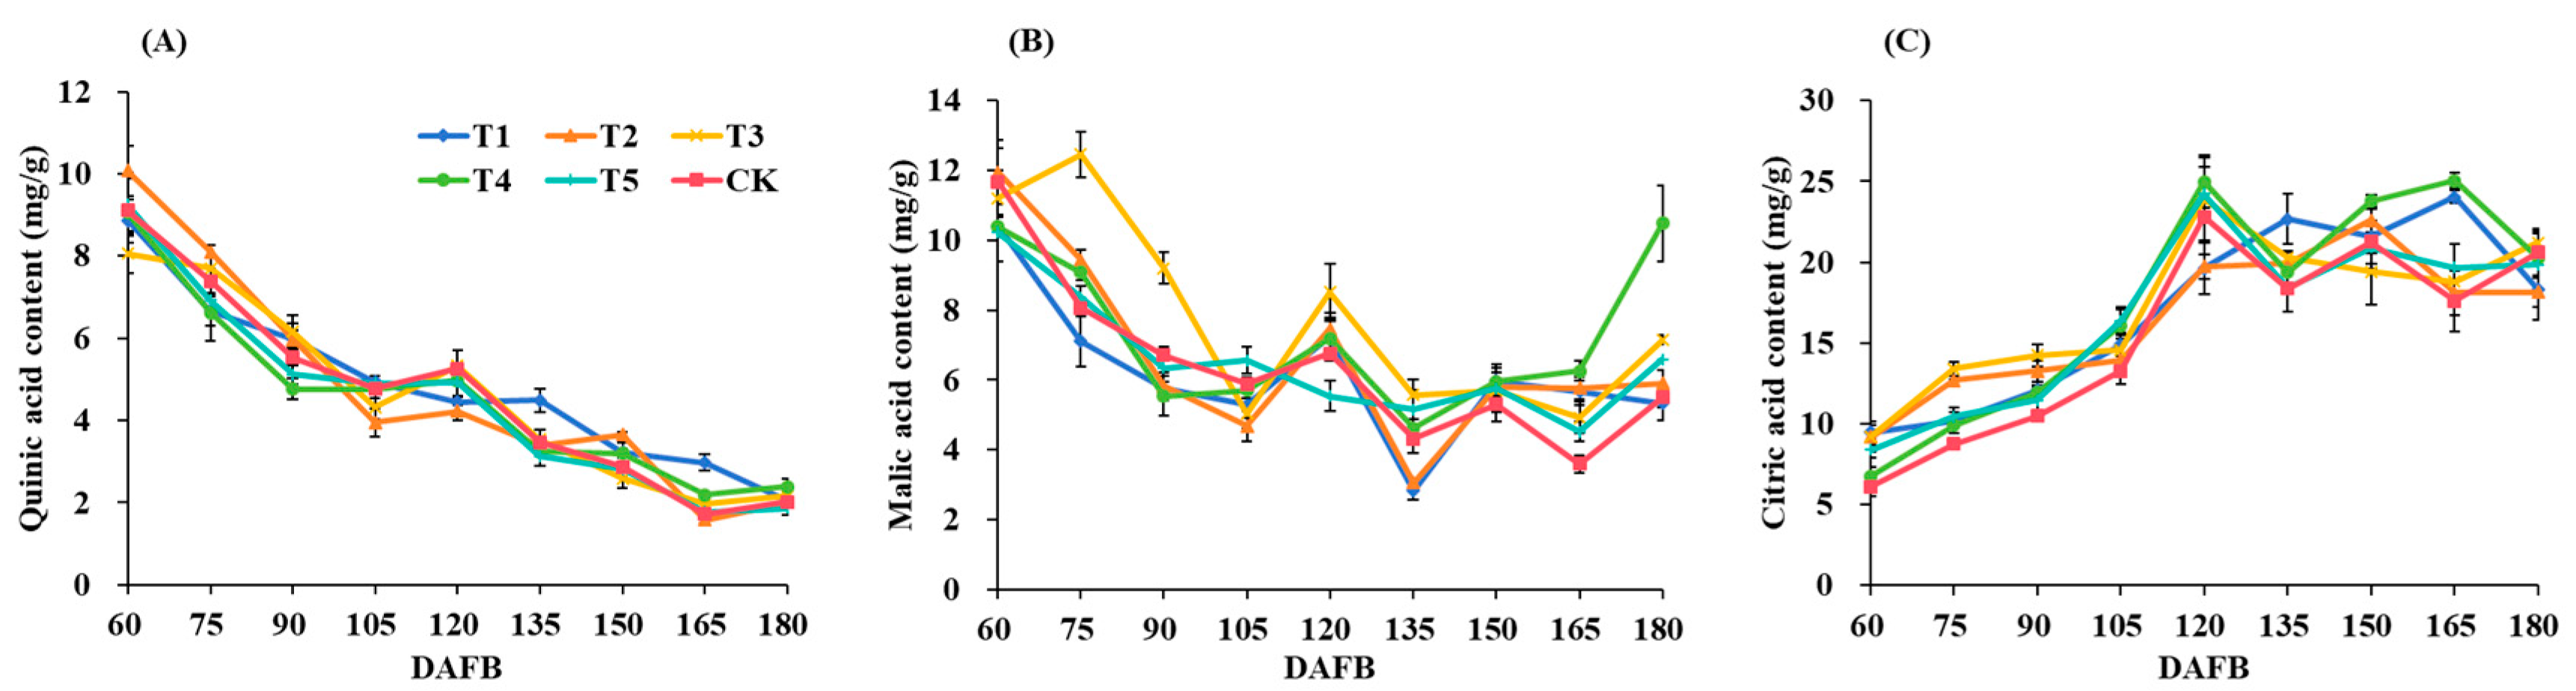
3.5. Organic Acid Profiles

Analysis of the organic acid profiles of the ‘Zaoxu’ fruit revealed distinct temporal patterns during fruit maturation (Figure 6). Quinic acid exhibited a consistent trend of degradation across all treatments, characterized by rapid decline from DAFB60 to DAFB90, followed by progressive decreases with minor fluctuations throughout maturity (Figure 6A). Malic acid demonstrated pronounced treatment-specific variability, with all treatments except T3 showing substantial reductions during early development (DAFB60-105), followed by fluctuant patterns (Figure 6B). Notably, treatment T4 exhibited anomalous rapid accumulation during the maturity period. Citric acid displayed inverse accumulation patterns relative to other organic acids, with an exponential increase during the early growth stage (DAFB60-120) before entering a fluctuation phase (Figure 6C). The control fruits consistently maintained depressed citric acid levels throughout development. These differential patterns suggest that quinic acid degradation is developmentally programmed and that malic acid metabolism can be modulated greatly by treatments. Moreover, citric acid serves as the dominant organic acid during active fruit expansion.
Similar to the soluble sugars, the fruit organic acids of the ‘Zaoxu’ fruit during the maturity period revealed significant treatment effects (Table 5). Citric acid emerged as the predominant organic acid fraction, followed by malic acid and quinic acid, while shikimic and succinic acids were present in trace amounts. Treatment T4 demonstrated superior accumulation of both malic and quinic acids, significantly exceeding the other treatments. Conversely, treatment T3 showed the maximal citric acid concentration, representing a 17.10% enhancement over treatment T2. These results suggest that organic acids are strongly influenced by the fertilizer type and concentration.

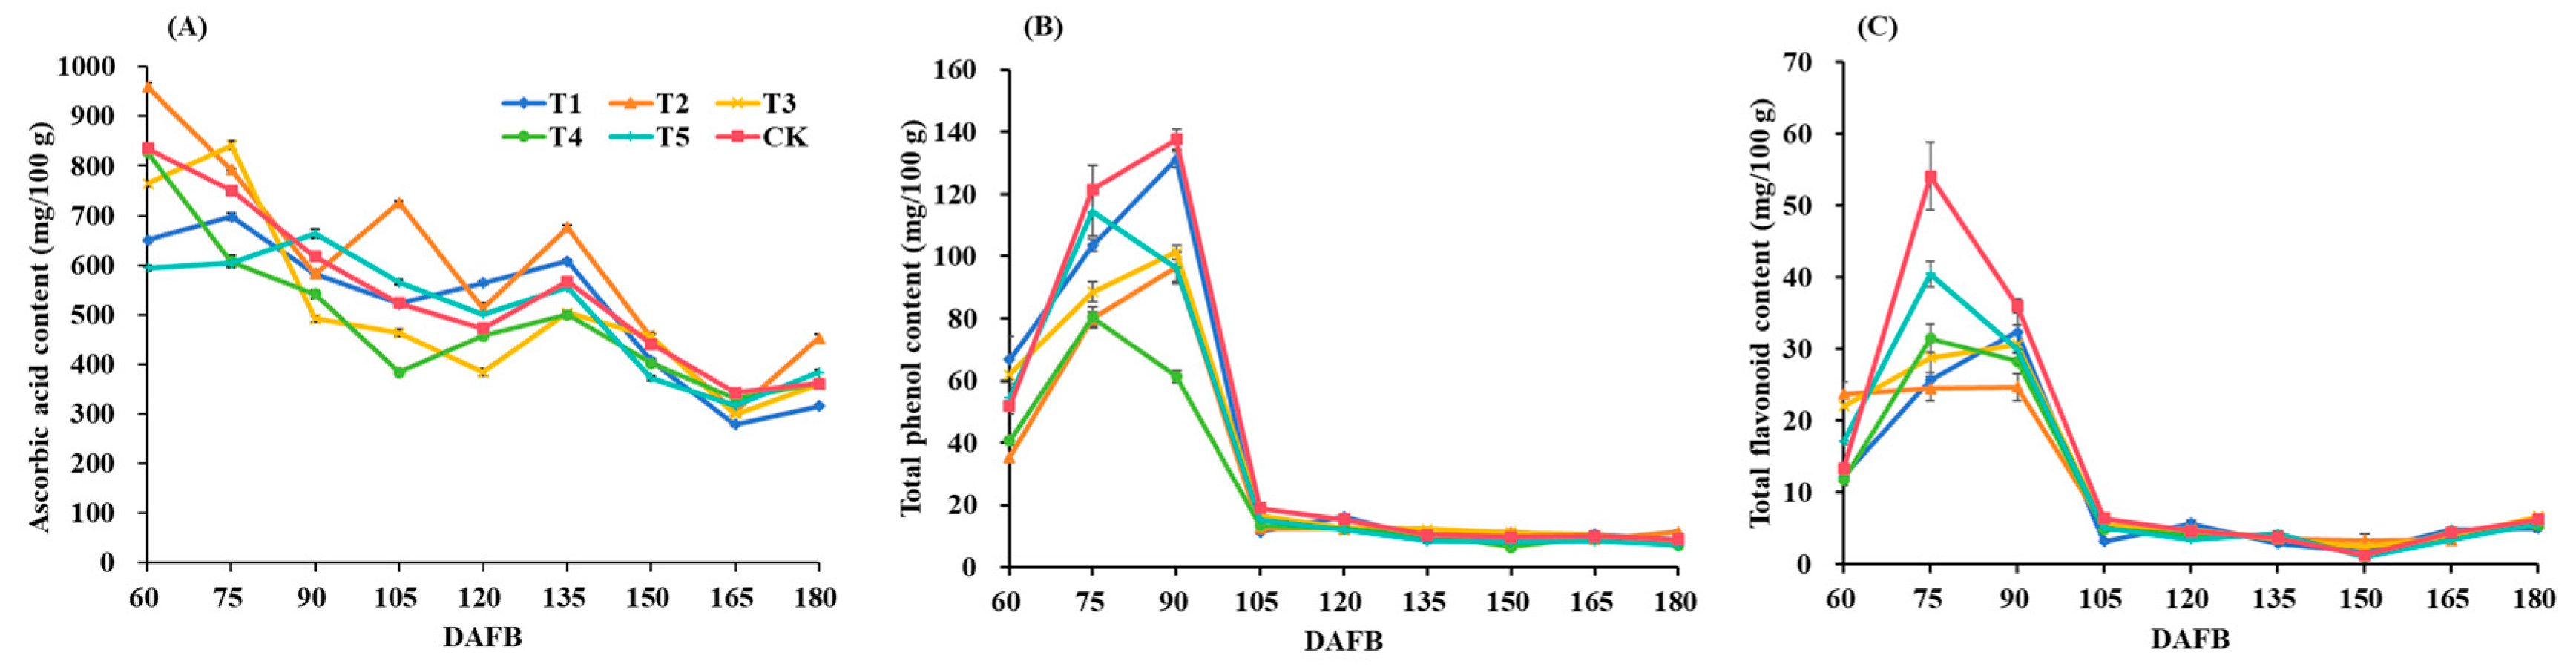
3.6. Fruit Antioxidants

The ascorbic acid (AsA) concentrations peaked during early fruit development (Figure 7A), followed by progressive declines across all treatments, with treatment T2 maintaining superior retention throughout the growth period. The total phenol and flavonoid contents exhibited biphasic accumulation patterns characterized by rapid increases during early development (DAFB60-105), followed by marked reductions and stabilization at lower concentrations (DAFB105-180). The control samples consistently demonstrated elevated phenol and flavonoid levels during the accumulation phase, while the contents of all treatments were relatively consistent during late maturation. These patterns suggest differential regulation of antioxidant biosynthesis pathways during distinct developmental stages, with fertilization treatments exerting stage-specific influences on redox metabolite accumulation.
Quantitative evaluation of the antioxidant compounds in the ‘Zaoxu’ fruit during the maturity period revealed significant treatment-dependent variations (Table 6). Treatment T2 demonstrated superior ascorbic acid accumulation, representing a 25.39% enhancement over the control, while treatment T1 showed minimal retention. The total phenol content followed a similar pattern, with T2 achieving the maximal concentration (11.32 mg/100 g FW), significantly exceeding the control, T4, and T5 treatments. In contrast, flavonoid accumulation peaked in treatment T3, followed by the control, with T1 displaying the lowest values. These differential accumulation patterns indicate that the intermediate-concentration OWS fertilization (T2) optimally enhanced antioxidant compounds and that the higher-dilution OWS treatment (T3) preferentially promoted flavonoid accumulation.

3.7. Principal Component Analysis

Principal component analysis (PCA) was employed to comprehensively evaluate the effects of the different fertilizer treatments on the growth and quality parameters of the ‘Zaoxu’. The analysis extracted five principal components with a cumulative variance contribution rate of 100%, effectively capturing the total variability in the dataset (Table 7). The primary principal component (PC1), representing 33.22% of the variance, demonstrated predominant associations with six quality-related parameters. It exhibited strong loading coefficients for eight morpho-physiological traits: the longitudinal diameter, transverse diameter, firmness, chlorophyll b, total chlorophyll, carotenoids, malic acid, and total phenols. The secondary component (PC2), representing 31.75% of the variance, demonstrated predominant associations with six quality-related parameters: the single-fruit weight, soluble solid content, sucrose, fructose, glucose, and ascorbic acid. Subsequent components exhibited progressively diminishing explanatory power, with PC3 (16.28% of variance) capturing variations in chlorophyll a, citric acid, and total flavonoids, while PC4 (11.40%) primarily reflected quinic acid dynamics. The terminal component (PC5) contributed minimally (7.35%) to the overall variance decomposition, suggesting limited discriminatory capacity within the evaluated parameter space.
The comprehensive principal component score (Z-value) revealed the following treatment effect ranking based on overall performance: T2 > T3 > T5 > T1 > T4 > control (Table 8). These results demonstrate that the OWS treatments consistently outperformed the microbial fertilizer across multiple quality parameters and that intermediate-concentration organic fertilization (T2) achieved optimal integration of plant growth and fruit quality enhancement. The PCA outcomes provide strong statistical evidence supporting the superior efficiency of 1000× dilution OWS application for comprehensive quality improvement in ‘Zaoxu’ kiwifruit cultivation.

4. Discussion

Actinidia eriantha Benth. is recognized as a commercially valuable kiwifruit species due to its high ascorbic acid (AsA) content; favorable peelability; extended postharvest stability; and enhanced resistance to biotic and abiotic stresses, including disease and high temperatures [26]. In commercial cultivation, the implementation of optimized agronomic practices, particularly fertilization strategies, plays a critical role in improving fruit quality. Fertilization serves as a fundamental determinant of both plant growth and fruit biochemical composition; however, achieving maximal quality enhancement necessitates the strategic selection of fertilizer formulations and application protocols to ensure physiological efficiency and economic viability.
Fruit quality is principally determined by the synergistic integration of external and internal characteristics [26]. External quality attributes, including dimensional parameters (the longitudinal and transverse diameters), fruit color, visual freshness, and morphological indices (the fruit shape index), demonstrated significant treatment-dependent variations during ‘Zaoxu’ development. Quantitative analysis revealed superior dimensional expansion in the OWS treatments, particularly at the 1000× and 1500× dilutions, with the 1000× dilution achieving the maximal single-fruit weight (57.07 g), representing a 32.23% enhancement over the control values. Fruit firmness analysis indicated differential softening patterns among the treatments, with all experimental groups showing accelerated firmness reductions compared to the control. These results demonstrate that while fertilization enhances fruit size and weight, it may concomitantly accelerate ripening-related textural changes. with the MF treatments exhibiting the most substantial effects on fruit softening.
Pigment profiling demonstrated the predominance of chlorophyll a throughout fruit development. This chlorophyll distribution pattern correlates with the characteristic green flesh pigmentation in kiwifruit, consistent with previous findings by Zhang et al. [3]. The sustained chlorophyll retention observed in this study suggests treatment-specific modulation of chlorophyll stability during fruit maturation, potentially influencing both visual quality and internal quality in developing fruits.
Soluble sugars constitute fundamental components in the development of fruit flavor profiles, with glucose, fructose, and sucrose representing the predominant soluble sugars in horticultural crops [27,28]. The present study observed that ‘Zaoxu’ exhibited initial stability in sugar accumulation during the early developmental period, followed by rapid elevation in later stages, a pattern consistent with previous reports on the A. eriantha cultivars ‘6113’ and ‘White’ [29,30]. Notably, glucose emerged as the dominant sugar component throughout fruit maturation. Concurrently, organic acids, which are critical modulators of fruit flavor [31], demonstrated distinct accumulation patterns, with citric acid representing the predominant organic acid component in ‘Zaoxu’. Overall, treatment T2 demonstrated optimal modulation of flavor-related metabolites, characterized by significant enhancement of soluble sugar accumulation coupled with a marked reduction in the organic acid content. This coordinated metabolic shift resulted in a substantial improvement in the sugar-to-acid ratio, thereby producing a more balanced and pronounced sweet flavor profile. Such favorable biochemical modifications effectively enhanced the organoleptic quality of the ‘Zaoxu’ kiwifruit, rendering it more palatable and commercially appealing to consumers.
A. eriantha Benth. fruits are recognized for their high concentrations of bioactive compounds with antioxidant potential, which may contribute to immunomodulatory effects by inhibiting carcinogen formation and delaying cellular senescence [32,33]. Notably, the ascorbic acid (vitamin C) content has been established as a key determinant of overall antioxidant capacity in fruits [34]. In the present study, fruits treated with 1000× dilution OWS exhibited elevated levels of soluble sugars, ascorbic acid, and total phenols, suggesting enhanced antioxidant activity compared to the other treatments. These biochemical characteristics indicate that optimized fertilization can significantly influence the nutritional quality of A. eriantha Benth., potentially enhancing its health-promoting properties.
Principal component analysis (PCA), a statistical methodology for multidimensional data reduction and comprehensive evaluation, has been widely employed in fruit quality assessment [35,36,37]. The composite Z-values derived from our PCA demonstrated clear treatment efficiency, with the 1000× dilution OWS (T2) achieving the maximal Z-value and significantly outperforming the other treatments. This optimal performance indicates that intermediate-concentration OWS fertilization most effectively enhances both plant growth and fruit quality parameters in ‘Zaoxu’, as evidenced by its superior integration of morphometric, biochemical, and antioxidant characteristics. The PCA results provide strong support for the application of 1000× dilution OWS in commercial cultivation systems to maximize fruit quality outcomes. However, this study was limited to a comprehensive investigation of the fertilizer’s effects on a single kiwifruit cultivar, focusing primarily on growth parameters, yield, and fruit quality. Future studies should extend these investigations to multiple kiwifruit cultivars and other fruit tree species while incorporating analyses of soil physicochemical properties and soil microbial community structure and functionality to elucidate the underlying mechanisms driving the observed growth enhancement.

5. Conclusions

This study systematically evaluated the effects of two new fertilizers (an organic water-soluble fertilizer and a microbial fertilizer) on plant growth and fruit quality parameters in A. eriantha Benth. cv. ‘Zaoxu’. The results demonstrate that application of organic water-soluble fertilizer at 1000× dilution (T2) can improve the yield and quality of kiwifruit by increasing its biomass, mainly in the mother-bearing shoots and the bearing branch group. These findings provide empirical support for adopting intermediate-concentration organic fertilization as an effective strategy to enhance both the horticultural performance and market competitiveness of A. eriantha cultivars while providing a reference for green production of kiwifruit and reducing fertilizer application in fruit tree production, ultimately establishing a scientific basis for optimized nutrient management protocols in commercial production systems.

Author Contributions

Conceptualization, H.L., L.L., J.P. and J.C.; Methodology, H.L., L.L. and J.P.; Software, L.L. and S.H.; Validation, L.L., S.H. and D.C.; Formal analysis, L.L.; Investigation, D.X., C.Z. and J.P.; Resources, J.C.; Data curation, H.L. and J.P.; Writing—original draft preparation, L.L. and S.H.; Writing—review and editing, H.L., L.L., D.C., J.P. and J.C.; Supervision, H.L. and J.C.; Project administration, H.L. and J.C.; Funding acquisition, H.L. All authors have read and agreed to the published version of the manuscript.

Funding

This work was supported by the Hangzhou Agricultural Bureau and Municipal Academy Cooperation Project (2021-5803), the Scientific and Technological Project in Henan Province (242102110221), the Zhejiang Fruit Industry Technology Project (2024QYGP01), the Special Fund for the Henan Agriculture Research System (HARS-22-09-S), and the Agricultural Science and Technology Innovation Program of the Chinese Academy of Agricultural Sciences (CAAS-ASTIP-2024-ZFRI-03).

Institutional Review Board Statement

Not applicable.

Data Availability Statement

The data presented in this study are available on request from the corresponding author.

Conflicts of Interest

The authors declare that they have no conflicts of interest.

References

  1. Chen, C.J.; Tao, J.J.; Qu, X.Y.; Huang, C.H.; Xu, X.B. Dynamic Variation in Sugar, Acid, and ASA Contents of ‘Ganmi 6′ Kiwifruit (Actinidia eriantha Benth) Fruits. Agric. Sci. Technol. 2015, 16, 2589–2591+2595. [Google Scholar]
  2. Food and Agriculture Organization of the United Nations. FAOSTAT Database, Production Module. Available online: http://www.fao.org/faostat/en/#data (accessed on 22 November 2024).
  3. Zhang, L.H.; Li, S.F.; Liu, X.H.; Song, C.L.; Liu, X. Effects of ethephon on physicochemical and quality properties of kiwifruit during ripening. Postharvest Biol. Technol. 2011, 65, 69–75. [Google Scholar] [CrossRef]
  4. Jia, D.F.; Gao, H.; He, Y.Q.; Liao, G.L.; Lin, L.T.; Huang, C.H.; Xu, X.B. Kiwifruit Monodehydroascorbate reductase 3 gene negatively regulates the accumulation of ascorbic acid in fruit of transgenic tomato plants. Int. J. Mol. Sci. 2023, 24, 17182. [Google Scholar] [CrossRef]
  5. Jia, D.F.; Xu, Z.Y.; Chen, L.; Huang, Q.; Huang, C.H.; Tao, J.J.; Qu, X.Y.; Xu, X.B. Analysis of organic acid metabolism reveals citric acid and malic acid play major roles in determining acid quality during the development of kiwifruit (Actinidia eriantha). J. Sci. Food Agr. 2023, 103, 6055–6069. [Google Scholar] [CrossRef]
  6. Xu, X.B.; Liao, G.L.; Huang, C.H.; Jia, D.F.; Zhong, M.; Qu, X.Y.; Liu, Q.; Gao, H. A novel sweet aromatic cultivar of Actinidia eriantha ‘Ganlü No. 1′. J. Fruit Sci. 2024, 41, 358–361. [Google Scholar]
  7. Liao, G.L.; Xu, X.B.; Huang, C.H.; Zhong, M.; Jia, D.F. Resource evaluation and novel germplasm mining of Actinidia eriantha. Sci. Hortic. 2021, 282, 110037. [Google Scholar] [CrossRef]
  8. Wu, L.; Lan, J.B.; Xiang, X.X.; Xiang, H.Y.; Jin, Z.; Khan, S.; Liu, Y.Q. Transcriptome sequencing and endogenous phytohormone analysis reveal new insights in CPPU controlling fruit development in kiwifruit (Actinidia chinensis). PLoS ONE 2020, 15, e0240355. [Google Scholar] [CrossRef]
  9. Bi, Y.Y.; Qiao, C.K.; Han, L.J.; Xie, H.Z.; Xu, Y.J.; Wu, D.; Zhuang, M.; Lv, X.R.; Cao, M.Y. Key metabolites and mechanistic insights in forchlorfenuron controlling kiwifruit development. Food Res. Int. 2023, 164, 112412. [Google Scholar] [CrossRef]
  10. Wan, H.L.; Kong, X.B.; Liu, Y.H.; Jin, F.; Han, L.X.; Xu, M.; Li, X.M.; Li, L.; Yang, J.; Lai, D.N.; et al. Residue analysis and effect of preharvest forchlorfenuron (CPPU) application on quality formation of kiwifrut. Postharvest Biol. Technol. 2023, 195, 112144. [Google Scholar] [CrossRef]
  11. Zhao, Z.P.; Duan, M.; Yan, S.; Liu, Z.F.; Wang, Q.; Fu, J.; Tong, Y.A. Effects of different fertilizations on fruit quality, yield and soil fertility in field-grown kiwifruit orchard. Int. J. Agric. Biol. Eng. 2017, 10, 162–171. [Google Scholar] [CrossRef]
  12. Raiesi, T.; Shiri, M.A.; Mousavi, S.M. The fruit quality and nutrient content of kiwifruit produced by organic versus chemical fertilizers. J. Sci. Food Agric. 2024, 104, 6821–6830. [Google Scholar] [CrossRef]
  13. Zhang, M.H.; Sun, D.Y.; Niu, Z.R.; Yan, J.X.; Zhou, X.L.; Kang, X. Effects of combined organic/inorganic fertilizer application on growth, photosynthetic characteristics, yield and fruit quality of Actinidia chinesis cv ‘Hongyang’. Glob. Ecol. Conserv. 2020, 22, e00997. [Google Scholar] [CrossRef]
  14. Bao, C.Y.; Zhao, J.; He, Z.X.; Fan, Y.F.; Jiang, C.L.; Deng, L.; Zhou, J.; Wang, L.C. Effects of different kinds of microbial fertilizer and amounts on kiwifruit quality. Soil Fertil. Sci. China 2021, 2, 262–269. [Google Scholar] [CrossRef]
  15. Patel, V.B.; Singh, S.K.; Asrey, R.; Nain, L.; Singh, A.K.; Singh, L. Microbial and inorganic fertilizers application influenced vegetative growth, yield, leaf nutrient status and soil microbial biomass in sweet orange cv. Mosambi. Indian J. Hort. 2009, 66, 163–168. [Google Scholar]
  16. Tomić, J.; Stajić, Z.K.; Pešaković, M.; Paunović, S.M.; Milinković, M.; Rilak, B.; Korićanac, A. Fruit quality of strawberry cultivars (Fragaria ananassa Duch.) affected by mineral and microbiological fertilizers. Voćarstvo 2018, 52, 67–76. [Google Scholar]
  17. Liu, Y.Y.; Xu, X.M.; Fu, H.Y.; Zhao, M.Y.; Chen, W. Effects of microbial fertilizer on apple fruit quality. IOP Conf. Ser. Earth Environ. Sci. 2020, 446, 032102. [Google Scholar] [CrossRef]
  18. NY/T 2009-2011; Agricultural Industry Standards: Determination of Fruit Firmness. Ministry of Agriculture: Beijing, China, 2009.
  19. Moran, R. Formulae for determination of chlorophyllous pigments extracted with n,n-dimethylformamide. Plant Physiol. 1982, 69, 1376–1381. [Google Scholar] [CrossRef]
  20. Ma, G.; Zhang, L.; Kitaya, Y.; Seoka, M.; Kudaka, R.; Yahata, M.; Yamawaki, K.; Shimada, T.; Fujii, H.; Endo, T.; et al. Blue LED light induces regreening in the flavedo of Valencia orange in vitro. Food Chem. 2021, 335, 127621. [Google Scholar] [CrossRef]
  21. Thacker, J.B.; Schug, K.A. Quantitative determination of fructose, glucose, and sucrose in hard ciders and apple juice by LC–MS/MS. Sep. Sci. Plus 2020, 3, 286–293. [Google Scholar] [CrossRef]
  22. Flores, P.; Hellin, P.; Fenoll, J. Determination of organic acids in fruits and vegetables by liquid chromatography with tandem-mass spectrometry. Food Chem. 2012, 132, 1049–1054. [Google Scholar] [CrossRef]
  23. GB 5009.86-2016; National Food Safety Standards: Determination of Ascorbic Acid in Food. National Health and Family Planning Commission: Beijing, China, 2016.
  24. Chen, W.D.; Xie, C.Y.; He, Q.Q.; Sun, J.X.; Bai, W.B. Improvement in color expression and antioxidant activity of strawberry juice fermented with lactic acid bacteria: A phenolic-based research. Food Chem. X 2023, 17, 100535. [Google Scholar] [CrossRef]
  25. Luo, T.; Chen, S.R.; Zhang, H.H.; Jia, S.J.; Wang, J.L. Phytochemical composition and potential biological activities assessment of raspberry leaf extracts from nine different raspberry species and raspberry leaf tea. J. Berry Res. 2020, 10, 295–309. [Google Scholar] [CrossRef]
  26. Tao, J.J.; Wu, M.T.; Jiao, X.D.; Chen, S.S.; Jia, D.F.; Xu, X.B.; Huang, C.H. Dynamic changes of fruit physiological quality and sugar components during fruit growth and development of Actinidia eriantha. Horticulturae 2022, 8, 529. [Google Scholar] [CrossRef]
  27. Lee, P.R.; Tan, R.M.; Yu, B.; Curran, P.; Liu, S.Q. Sugars, organic acids, and phenolic acids of exotic seasonable tropical fruits. Nutr. Food Sci. 2013, 43, 267–276. [Google Scholar] [CrossRef]
  28. Zheng, Q.M.; Tang, Z.; Xu, Q.; Deng, X.X. Isolation, phylogenetic relationship and expression profiling of sugar transporter genes in sweet orange (Citrus sinensis). Plant Cell Tissue Org. 2014, 119, 609–624. [Google Scholar] [CrossRef]
  29. Zhong, C.H.; Zhang, P.; Jiang, Z.W.; Wang, S.M.; Han, F.; Xu, L.Y.; Huang, H.W. Dynamic changes of carbohydrate and vitamin C in fruit of Actinidia chinensis and A. eriantha during growing season. Plant Sci. J. 2011, 29, 370–376. [Google Scholar] [CrossRef]
  30. Zhang, H.Q.; Xie, M.; Zhang, C.; Yang, L.Q.; Zhang, Z.; Xiao, J.P.; Zhou, L.Q. Difference in starch accumulation and characterization of sugar metabolism during fruit development of kiwi fruit. Sci. Agric. Sin. 2014, 47, 3453–3464. [Google Scholar] [CrossRef]
  31. Chen, F.X.; Liu, X.H.; Chen, L.S. Advances in research on organic acid metabolism in fruits. J. Fruit Sci. 2005, 22, 526–531. [Google Scholar]
  32. Silvia, T.; Elena, D.; Damiano, R.; Rossano, M.; Lucia, G. Antioxidant capacity, ascorbic acid, total phenols and carotenoids changes during harvest and after storage of hayward kiwifruit. Food Chem. 2008, 107, 282–288. [Google Scholar] [CrossRef]
  33. Kim, Y.E.; Cho, C.H.; Kang, H.; Heo, H.J.; Cho, Y.S.; Kim, D.O. Kiwifruit of Actinidia eriantha cv. Bidan has in vitro antioxidative, anti-inflammatory and immunomodulatory effects on macrophages and splenocytes isolated from male balb/c mice. Food Sci. Biotechnol. 2018, 27, 1503–1508. [Google Scholar] [CrossRef]
  34. Du, G.R.; Li, M.J.; Ma, F.W.; Liang, D. Antioxidant capacity and the relationship with polyphenol and Vitamin C in Actinidia fruits. Food Chem. 2009, 113, 557–562. [Google Scholar] [CrossRef]
  35. Nie, B.; Du, J.Q.; Liu, H.N.; Xu, G.L.; Wang, Z.; He, Y.; Li, B.T. Crowds’ classification using hierarchical cluster, rough sets, principal component analysis and its combination. In Proceedings of the 2009 International Forum on Computer Science-Technology and Applications, ChongQing, China, 25–27 December 2009; IEEE: New York, NY, USA, 2009; Volume 1, pp. 287–290. [Google Scholar]
  36. Himabindu, A.; Srihari, D.; Raiasekhar, M.; Sudhavani, V.; Subbarammamma, P.; Krishna, K.U.; Paratpara, R.M. Genetie diversity for fruit morphological and biochemical characters of indigenous mango (Mangifera indica L.) cultivars of coastal districts in Andhra Pradesh using principal component analysis. Electron. J. Plant Breed. 2017, 8, 772–778. [Google Scholar] [CrossRef]
  37. Sinha, A.; Singh, P.; Bhardwaj, A.; Verma, R.B. Principal component analysis approach for comprehensive screening of tomato germplasm for polyhouse condition. J. Exp. Agric. Int. 2021, 43, 67–72. [Google Scholar] [CrossRef]
Figure 1. The effects of different treatments on the node number (A), the length (B), and the coarseness (C) of mother-bearing shoots of ‘Zaoxu’. Each value in the graphs shows a mean with the standard deviation of three replicates. Different lowercase letters indicate significant differences according to Duncan’s multiple range tests (p < 0.05). T1, T2, and T3 are 500×, 1000×, and 1500× dilutions of organic water-soluble fertilizer. T4 and T5 are 500× and 1000× dilutions of microbial fertilizer. CK: control.
Agriculture 15 00982 g001
Figure 2. The effects of different treatments on the length (A) and coarseness (B) of the bearing branch group of ‘Zaoxu’. Each value in the graphs shows the mean of three replicates. T1, T2, and T3 are 500×, 1000×, and 1500× dilutions of organic water-soluble fertilizer. T4 and T5 are 500× and 1000× dilutions of microbial fertilizer. CK: control.
Agriculture 15 00982 g002
Figure 3. The effects of different treatments on the longitudinal diameter (A), transverse diameter (B), single-fruit weight (C), and firmness (D) of ‘Zaoxu’ fruit. Each value in the graphs shows the mean of fifteen replicates. T1, T2, and T3 are 500×, 1000×, and 1500× dilutions of organic water-soluble fertilizer. T4 and T5 are 500× and 1000× dilutions of microbial fertilizer. CK: control.
Agriculture 15 00982 g003
Figure 4. The effects of different treatments on the chlorophyll a (A), chlorophyll b (B), total chlorophyll (C), and carotenoid (D) contents of ‘Zaoxu’ fruit. Each value in the graphs shows the mean of three replicates. T1, T2, and T3 are 500×, 1000×, and 1500× dilutions of organic water-soluble fertilizer. T4 and T5 are 500× and 1000× dilutions of microbial fertilizer. CK: control.
Agriculture 15 00982 g004
Figure 5. The effects of different treatments on the soluble solid (A), sucrose (B), fructose (C), and glucose (D) contents of ‘Zaoxu’ fruit. Each value in the graphs shows the mean of three replicates. T1, T2, and T3 are 500×, 1000×, and 1500× dilutions of organic water-soluble fertilizer. T4 and T5 are 500× and 1000× dilutions of microbial fertilizer. CK: control.
Agriculture 15 00982 g005
Figure 6. The effects of different treatments on the quinic acid (A), malic acid (B), and citric acid (C) contents of ‘Zaoxu’ fruit. Each value in the graphs shows the mean of three replicates. T1, T2, and T3 are 500×, 1000×, and 1500× dilutions of organic water-soluble fertilizer. T4 and T5 are 500× and 1000× dilutions of microbial fertilizer. CK: control.
Agriculture 15 00982 g006
Figure 7. The effects of different treatments on the ascorbic acid (A), total phenol (B), and total flavonoid (C) contents of ‘Zaoxu’ fruit. Each value in the graphs shows the mean of three replicates. T1, T2, and T3 are 500×, 1000×, and 1500× dilutions of organic water-soluble fertilizer. T4 and T5 are 500× and 1000× dilutions of microbial fertilizer. CK: control.
Agriculture 15 00982 g007
Table 1. The fertilizer treatments for A. eriantha Benth.
TreatmentsFertilizer NameDilution Factor
T1Organic water-soluble fertilizer (OWS)500× dilution
T21000× dilution
T31500× dilution
T4Microbial fertilizer (MF)500× dilution
T51000× dilution
CKControlDistilled water
Table 2. Effects of different treatments on fruit growth of ‘Zaoxu’ during maturity period.
TreatmentsLongitudinal Diameter (cm)Transverse
Diameter (cm)
Fruit Shape IndexSingle-Fruit Weight (g)Firmness (kg/cm2)
T160.73 ± 3.02 a37.27 ± 0.97 ab1.65 ± 0.07 a48.31 ± 1.14 c5.18 ± 1.06 c
T260.73 ± 3.09 a37.61 ± 2.21 ab1.62 ± 0.03 a57.07 ± 1.05 a7.55 ± 0.68 b
T361.52 ± 3.14 a38.69 ± 3.37 a1.58 ± 0.04 a52.54 ± 1.98 b4.44 ± 0.20 c
T455.97 ± 2.21 ab34.37 ± 2.14 bc1.60 ± 0.09 a50.91 ± 0.53 b1.95 ± 0.63 d
T551.43 ± 2.67 b36.19 ± 0.23 abc1.62 ± 0.03 a43.40 ± 0.42 d2.82 ± 0.63 d
CK52.58 ± 3.31 b32.91 ± 0.78 c1.69 ± 0.06 a43.16 ± 0.30 d10.74 ± 1.93 a
The data are means ± SDs. The longitudinal diameter and transverse diameter were calculated based on 15 replicates. The single-fruit weight and firmness were calculated based on 10 replicates. Different lowercase letters in the same column indicate significant differences according to Duncan’s multiple range tests (p < 0.05). T1, T2, and T3 are 500×, 1000×, and 1500× dilutions of organic water-soluble fertilizer. T4 and T5 are 500× and 1000× dilutions of microbial fertilizer. CK: control.
Table 3. Effects of different treatments on fruit pigment of ‘Zaoxu’ during maturity period.
TreatmentsChlorophyll a Content
(mg/100 g)
Chlorophyll b Content
(mg/100 g)
Total Chlorophyll Content
(mg/100 g)
Carotenoid
Content
(mg/100 g)
T11.88 ± 0.06 a1.43 ± 0.13 a3.31 ± 0.19 ab0.80 ± 0.03 b
T21.78 ± 0.07 ab1.36 ± 0.05 a3.14 ± 0.09 ab0.78 ± 0.05 b
T31.64 ± 0.02 b1.33 ± 0.09 a2.97 ± 0.11 b0.88 ± 0.04 ab
T41.92 ± 0.04 a1.65 ± 0.02 a3.58 ± 0.04 a0.97 ± 0.05 a
T51.75 ± 0.22 ab1.44 ± 0.33 a3.19 ± 0.55 ab0.97 ± 0.06 a
CK1.95 ± 0.13 a1.40 ± 0.17 a3.34 ± 0.30 ab0.98 ± 0.07 a
The data are means ± SDs based on 3 replicates. Different lowercase letters in the same column indicate significant differences according to Duncan’s multiple range tests (p < 0.05). T1, T2, and T3 are 500×, 1000×, and 1500× dilutions of organic water-soluble fertilizer. T4 and T5 are 500× and 1000× dilutions of microbial fertilizer. CK: control.
Table 4. Effects of different treatments on fruit soluble sugars of ‘Zaoxu’ during maturity period.
TreatmentsSoluble Solid Content (%)Sucrose Content (mg/g)Fructose Content (mg/g)Glucose Content (mg/g)
T111.87 ± 0.35 c13.12 ± 0.87 bc9.75 ± 0.98 c41.20 ± 3.55 d
T215.13 ± 0.25 a20.93 ± 0.49 a13.11 ± 0.31 a57.21 ± 4.81 b
T313.97 ± 0.35 bc14.75 ± 0.05 b10.91 ± 0.66 b48.26 ± 1.58 c
T414.53 ± 0.21 b20.90 ± 0.38 a12.70 ± 0.27 a63.55 ± 1.36 a
T514.80 ± 0.20 ab20.52 ± 0.63 a12.34 ± 0.57 a60.16 ± 1.53 ab
CK10.10 ± 0.20 d10.85 ± 0.50 c7.93 ± 0.52 d38.98 ± 2.52 d
The data are means ± SDs based on 3 replicates. Different lowercase letters in the same column indicate significant differences according to Duncan’s multiple range tests (p < 0.05). T1, T2, and T3 are 500×, 1000×, and 1500× dilutions of organic water-soluble fertilizer. T4 and T5 are 500× and 1000× dilutions of microbial fertilizer. CK: control.
Table 5. Effects of different treatments on fruit organic acids of ‘Zaoxu’ during maturity period.
TreatmentsShikimic Acid Content (mg/100 g)Succinic Acid Content (mg/100 g)Quinic Acid Content (mg/g)Malic Acid Content (mg/g)Citric Acid Content (mg/g)
T12.91 ± 0.19 b1.05 ± 0.10 b2.05 ± 0.07 bc5.33 ± 0.50 d18.32 ± 1.89 ab
T23.35 ± 0.32 ab0.74 ± 0.08 c2.01 ± 0.05 bc5.90 ± 0.38 cd18.13 ± 0.91 b
T32.12 ± 0.20 c0.94 ± 0.03 b2.17 ± 0.10 ab7.14 ± 0.13 b21.23 ± 0.70 a
T42.45 ± 0.20 c1.08 ± 0.11 b2.38 ± 0.21 a10.48 ± 1.09 a20.27 ± 1.77 ab
T53.27 ± 0.29 ab1.43 ± 0.14 a1.86 ± 0.15 c6.59 ± 0.01 bc19.86 ± 1.93 ab
CK3.44 ± 0.22 a1.52 ± 0.14 a2.03 ± 0.11 bc5.50 ± 0.28 d20.62 ± 1.41 ab
The data are means ± SDs based on 3 replicates. Different lowercase letters in the same column indicate significant differences according to Duncan’s multiple range tests (p < 0.05). T1, T2, and T3 are 500×, 1000×, and 1500× dilutions of organic water-soluble fertilizer. T4 and T5 are 500× and 1000× dilutions of microbial fertilizer. CK: control.
Table 6. Effects of different treatments on fruit antioxidant activity of ‘Zaoxu’ during maturity period.
TreatmentsAscorbic Acid Content (mg/100 g)Total Phenol Content (mg/100 g)Total Flavonoid
Content (mg/100 g)
T1315.96 ± 1.87 d8.91 ± 0.76 b5.01 ± 0.54 c
T2453.41 ± 7.02 a11.32 ± 0.44 a5.78 ± 0.31 bc
T3360.10 ± 0.91 c8.27 ± 0.51 b6.67 ± 0.32 a
T4363.12 ± 2.71 c7.01 ± 0.43 c5.43 ± 0.47 bc
T5384.45 ± 5.74 b7.15 ± 0.65 c5.60 ± 0.26 bc
CK361.61 ± 0.69 c8.92 ± 0.85 b6.22 ± 0.58 ab
The data are means ± SDs based on 3 replicates. Different lowercase letters in the same column indicate significant differences according to Duncan’s multiple range tests (p < 0.05). T1, T2, and T3 are 500×, 1000×, and 1500× dilutions of organic water-soluble fertilizer. T4 and T5 are 500× and 1000× dilutions of microbial fertilizer. CK: control.
Table 7. Principal component analysis of fruit quality evaluation factors.
Principal Component12345
Eigenvalue5.9795.7162.9312.0521.323
Variance contribution rate (%)33.21631.75316.28211.3987.351
Cumulative variance contribution rate (%)33.21664.96981.25192.649100.00
Single-fruit weight0.4530.705−0.123−0.416−0.332
Longitudinal diameter0.6660.328−0.081−0.6650.021
Transverse diameter0.6700.5270.146−0.2230.450
Firmness−0.8190.4830.041−0.2000.234
Chlorophyll a0.4490.5260.6400.0480.330
Chlorophyll b0.922−0.0770.3240.198−0.001
Total chlorophyll0.7500.2450.5940.1040.119
Carotenoids0.8080.260−0.446−0.2690.093
Soluble solid content−0.0680.9820.0400.1130.126
Sucrose−0.3180.884−0.0980.312−0.098
Fructose−0.1470.970−0.1470.1140.046
Glucose−0.4700.856−0.0680.203−0.02
Quinic acid0.363−0.139−0.1200.8200.402
Malic acid0.691−0.573−0.330.2620.129
Citric acid−0.408−0.1890.876−0.094−0.145
Ascorbic acid0.2780.615−0.0890.539−0.495
Total phenols0.8140.060−0.3680.100−0.433
Total flavonoids0.283−0.0450.8650.079−0.404
Table 8. A comprehensive evaluation of the effects of different fertilizer treatments.
TreatmentsZ-ValueRank
T1−0.5034
T21.5011
T31.1782
T4−1.0895
T50.1873
CK−1.2746
Disclaimer/Publisher’s Note: The statements, opinions and data contained in all publications are solely those of the individual author(s) and contributor(s) and not of MDPI and/or the editor(s). MDPI and/or the editor(s) disclaim responsibility for any injury to people or property resulting from any ideas, methods, instructions or products referred to in the content.

