Article

Exploring Soil Hydro-Physical Improvements Under No-Tillage: A Sustainable Approach for Soil Health

by
Gabriel-Dumitru Mihu
1,
Tudor George Aostăcioaei
1,
Cosmin Ghelbere
2,
Anca-Elena Calistru
1,*,
Denis Constantin Țopa
1 and
Gerard Jităreanu
1
1
Department of Pedotechnics, Faculty of Agriculture, “Ion Ionescu de la Brad” Iasi University of Life Sciences, 3, Mihail Sadoveanu Alley, 700490 Iasi, Romania
2
Research Institute for Agriculture and Environment, “Ion Ionescu de la Brad” Iasi University of Life Sciences, 9, Mihail Sadoveanu Alley, 700490 Iasi, Romania
*
Author to whom correspondence should be addressed.
Agriculture 2025, 15(9), 981; https://doi.org/10.3390/agriculture15090981
Submission received: 18 March 2025 / Revised: 28 April 2025 / Accepted: 29 April 2025 / Published: 30 April 2025

Abstract

:
No-tillage (NT) is a key practice in conservation agriculture that minimizes soil disturbance, thereby enhancing soil structure, porosity, and overall quality. However, its long-term effects on soil pore networks and hydro-physical functions remain underexplored. This study evaluated the impacts of NT and conventional tillage (CT) on soil hydro-physical properties using undisturbed soil columns, X-ray computed tomography, and standard physical measurements. A field experiment was conducted under an eight-year continuous cropping system, with a four-year rotation [winter wheat (Triticum aestivum L.)—maize (Zea mays L.)—sunflower (Helianthus annuus L.)—peas (Pisum sativum L.)], comparing NT and CT treatments with three replications. Soil parameters including bulk density (BD), moisture content, total porosity (SP), water-stable aggregates (WSA), and saturated hydraulic conductivity (Ksat) were measured. Results showed that NT increased BD (1.45 g/cm3) compared to CT (1.19 g/cm3), likely due to reduced soil disturbance. Moisture content under NT was up to 78% higher than CT. Saturated hydraulic conductivity was also higher in NT, with 17% and 43% increases observed at harvest in 2022 and 2023, respectively, except in the 0–30 cm layer immediately after sowing. Micro-CT analysis revealed a 34–115% increase in macropores (>1025 μm) under NT at 10–40 cm depth. These findings demonstrate that long-term NT improves key soil hydro-physical properties, supporting its integration into sustainable farming systems to balance productivity and environmental stewardship.

1. Introduction

Conservation of agriculture is one of the greatest challenges of the 21st century, in light of the importance of agriculture as the demand for food and environmental protection increases [1,2]. Conservation agriculture (CA) is a complex of three crop management principles: minimal soil disturbance (including no-tillage), crop rotation, and permanent soil cover with crop residues [3]. The no-tillage system, the cornerstone of CA, is considered a leading approach for sustainable crop production and management of soil and environmental quality issues [4]. By 2019, conservation tillage covered about 205 million hectares, corresponding to 14.7% of global agricultural land [5].
The practice of NT leads to soil physical–chemical improvement and restoration, particularly in terms of bulk density, soil aggregation and pore size distribution. One of the most important advantages of the NT system is its potential to conserve soil moisture, which contributes to its implementation, mainly when the soil is covered with plant residue, reducing the amount of water lost through evaporation [6,7]. The well-developed structure of NT soils facilitates the development of a highly connected pore network, enhancing water infiltration and retention [8,9]. In contrast, performing tillage disturbs soil structure, leading to reduced pore connectivity and affecting gas exchange [10]. The biopores network vertically shaped in NT systems allows more efficient water movement, essential for high yields under drought conditions [11]. In general, no-tillage management improves the stability of soil aggregates, thereby reducing erosion rates, and increasing water retention, infiltration and movement [12,13] and nutrient storage [14,15,16]. NT also has the potential to promote a higher density of soil fungal hyphae, essential for nutrient cycling and soil health [17]. Ultimately, NT ensures sustainable food security (even as climate change increasingly affects agriculture), reduces energy consumption, conserves water and improves soil fertility [18,19,20,21].
In Romania, publicly available data on the areas under conservative practices were collected and distributed by Podu Iloaie Research Institute from 1980–1993. These systems began to be applied here to reduce soil erosion, protect the environment [22], maintain the high production potential of the soil [23] and fulfill the Common Agricultural Policy of the European Union requirements. Soil conservation practices are currently adopted on about 950,000 ha of arable land [24].
Research and scientific literature in Romania usually focus on a few soil properties and crop productivity, lacking an overview of the effects of no-tillage on physical and hydric-physical parameters. To implement methods that may render agriculture sustainable and maximize the environmental, economic, and social benefits, successful practice requires understanding, and adapting to the unique characteristics of each soil and climatic type. The need for the implementation of conservation tillage systems stems from increased soil degradation due to soil erosion and intensive cultivation, as well as reduced rainfall during critical periods for plants. Our hypothesis was that changes in water content and physical properties will be positive in the conservative tillage system, due to the absence of soil disturbance and the storage of organic matter over time on the soil surface. The objective of this study is to describe the impact of the tillage system (conventional and no-tillage) on some soil hydro-physical properties as an integral part of the overall development of conservative practices. The study was carried out from 2022 to 2023 on a field where NT with straw retention has been practiced for 8 years. The results contribute to the implementation of this system in northeastern Romanian farms by describing the benefits it has on the soil after a long-term application period.

2. Materials and Methods

2.1. Study Area

The experimental field is situated at the Ezareni Student Research and Practice Station of the “Ion Ionescu de la Brad” Iasi University of Life Sciences (IULS), in NE of Romania, Iasi county (Figure 1) (47°07′28.50″ N latitude, 27°30′06.00″ E longitude). Geographically, the Research Station is located in the SW part of the Jijia and Bahlui river plains, and it is also known as the Moldavian Plain, which is a part of the Moldavian Platform, and geomorphologically, it is located on the Iasi Transition Coast.
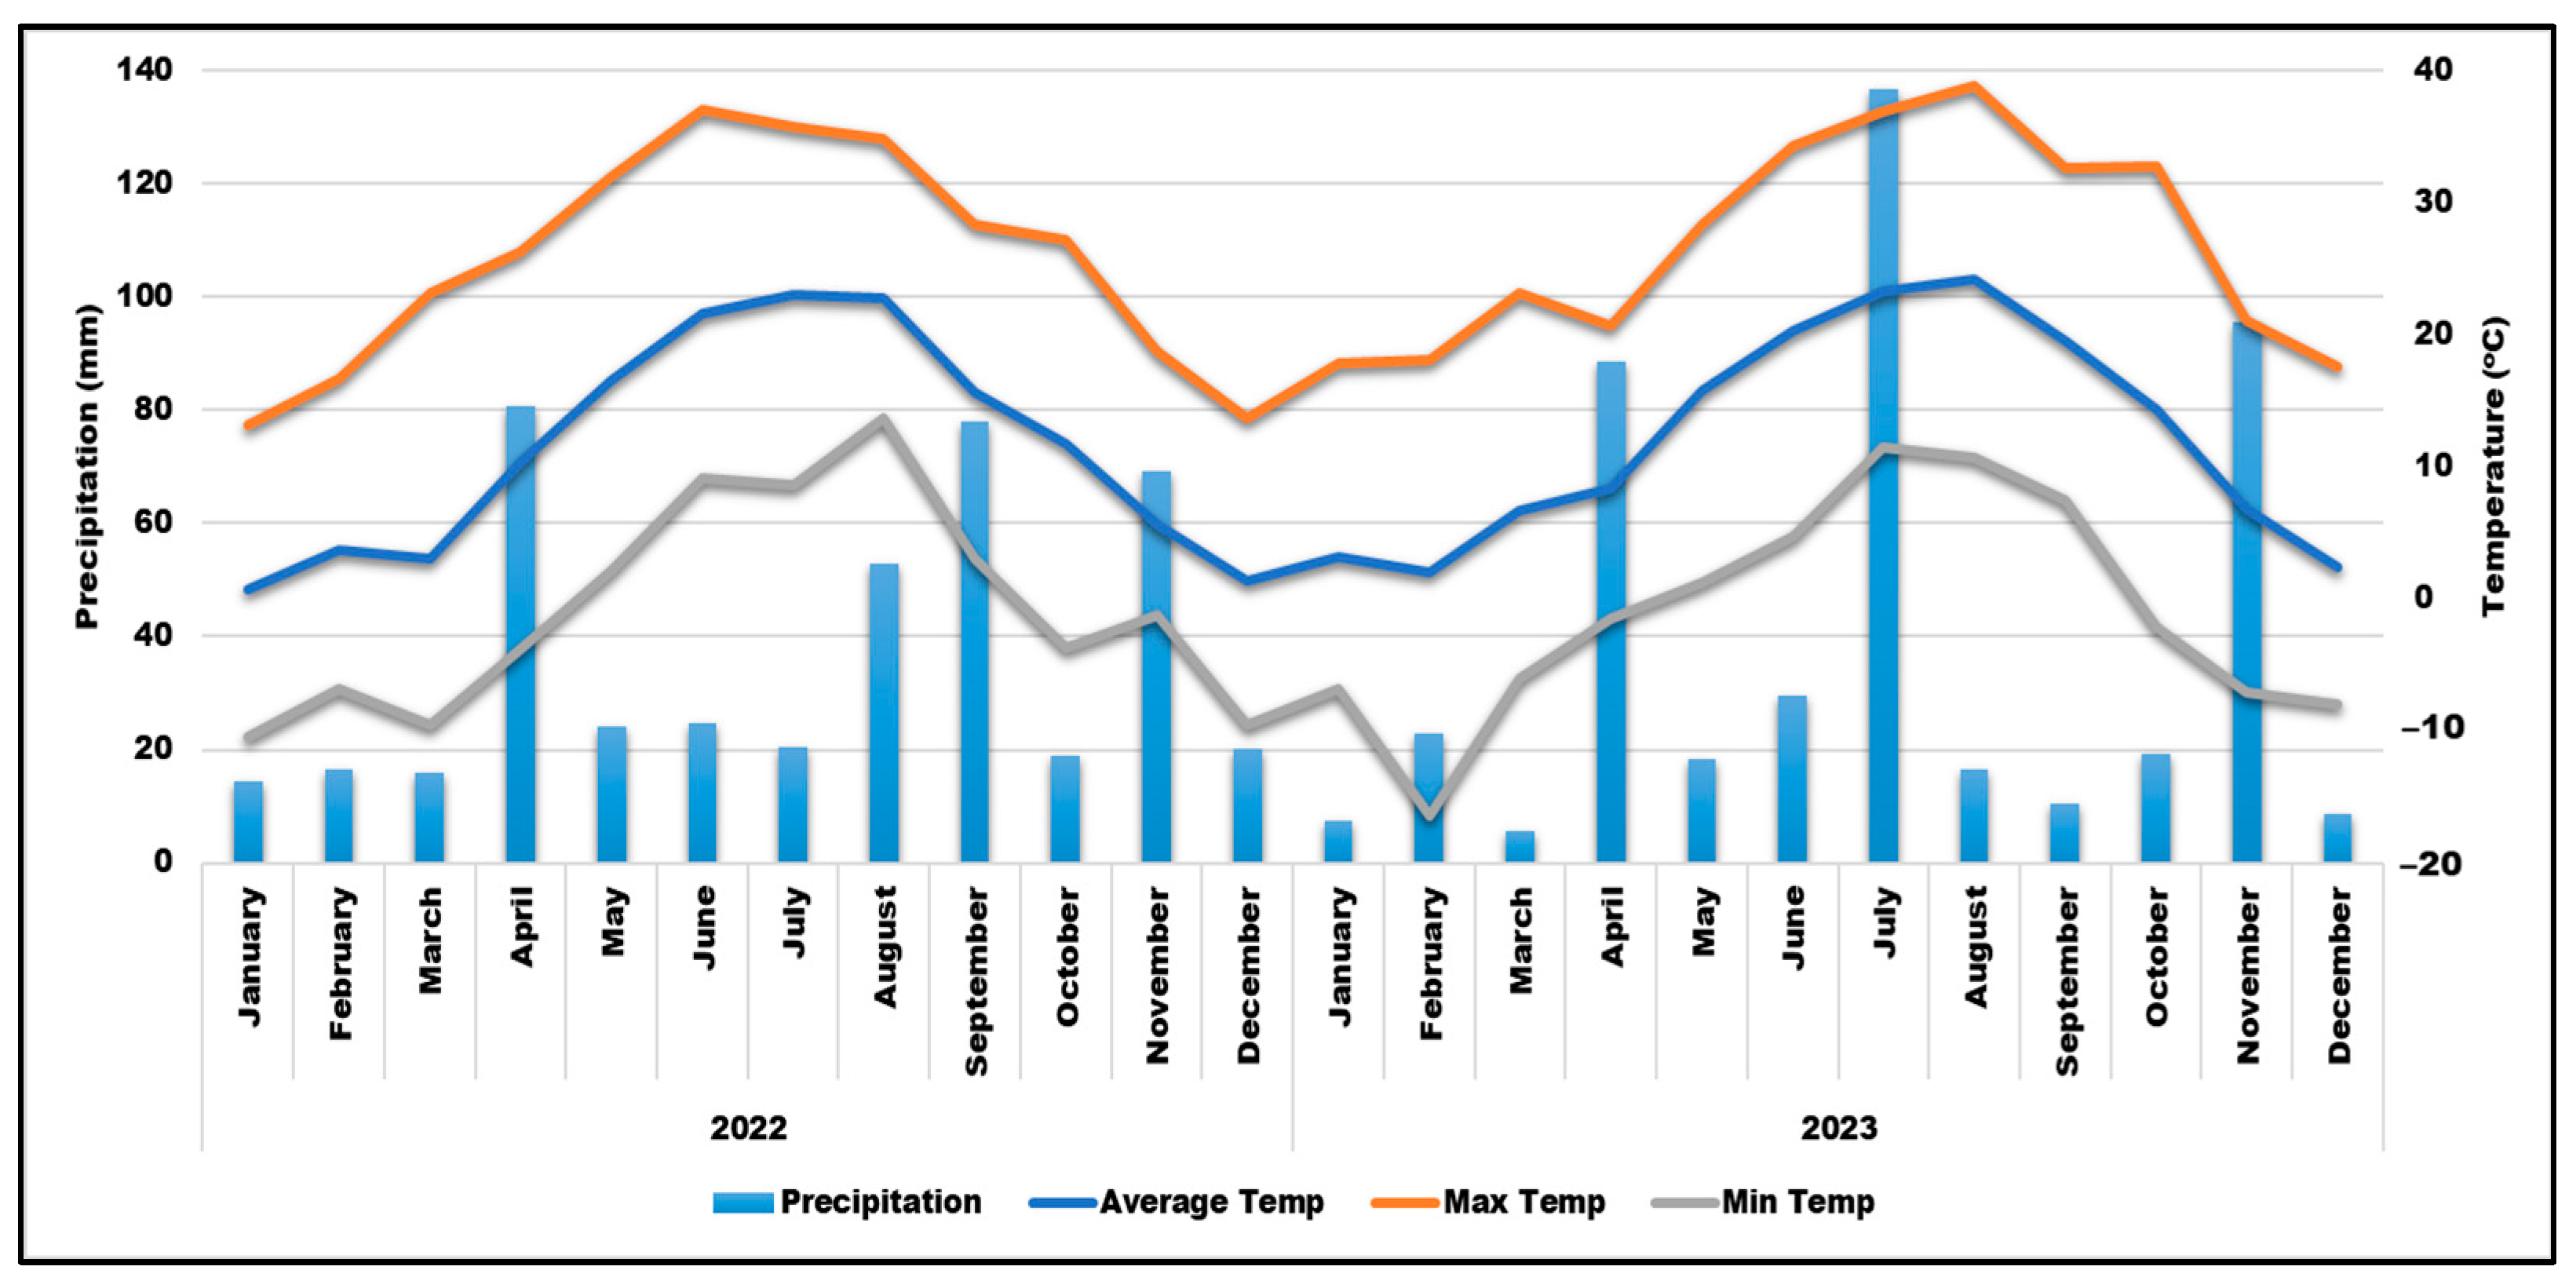
The experimental field has a 3% slope with NE exposition at an elevation of 136 m above sea level. It is located in the temperate humid subtropical climate zone (Cfa) according to the Köppen–Geiger climate classification with 10.9 °C mean annual temperature and 535.5 mm precipitation (Figure 2) data collected from the IULS weather station through the www.fieldclimate.com web (accessed on 3 February 2025) [25].
According to WRB Classification, the soil is a cambic chernozem with a clay-loam texture. In the experimental field, a study on the influence of tillage system on soil chemical properties was carried out in 2021 [26]. For an overview, these properties are presented in Table 1. The pH is slightly acidic (0–30 cm), with a variation depending on the tillage system, 6.4 units in NT and 6.8 units in CT. The humus content of the NT soil ranged from 3.64% in the 0–10 cm layer to 0.73% at the 30–40 cm layer and in the CT from 3.25% in the 0–10 cm layer to 1.65% at the 30–40 cm layer.

2.2. Experimental Design and Treatments

This study was conducted on a long-term experimental field, designed and established in 2014, previously cultivated under conventional management. To this purpose, two tillage systems, the conventional (CT) and the no-tillage (NT) with mulch, have begun to be put into practice on 16 hectares, each with an area of 8 hectares. The experiment is single-factor, using a randomized block design with three replications, where each replication is 0.66 ha. (Figure 1). A four-year rotation is applied as follows: winter wheat–maize–sunflowers–peas, each covering an area of 2 hectares in each tillage system. The present study was conducted on maize crops in 2022 and 2023, in Northeastern Romania in climatic conditions, without irrigation.
In 2022, maize was sown on April 20 in CT and April 27 in NT. The delayed sowing by 7 days was because of lower soil temperature in this system, being covered by mulch. Sowing was carried out with a classical seed drill in CT and FABIMAG FG-01 (Fabimag, Ucacha, Argentina) in NT. In CT, plowing was carried out at 30 cm depth, with 300 kg/ha NPK (10.24.0) fertilizer applied at seedbed preparation. In NT, fertilization was applied at sowing with the same dose. For weed management in NT, Glyfos Ultra total herbicide (3 L/ha) was used the day after sowing. During the growing season in both systems, two herbicides were applied with an agricultural drone (DJI T10), the first on 24 May using Arigo (Corteva) (330 g/ha) + Trend (Corteva) (250 mL/ha), and the second on 6 June using Principal Plus (Corteva) (440 g/ha) + Trend (250 mL/ha). Harvesting was carried out on 27 October, using the New Holland TC5050 combine (New Holland Agriculture, Zedelgem, Belgia). The crop residues chopped to 2–4 cm, in the NT system, were maintained on the soil surface, and in CT, they were incorporated during plowing.
In 2023, sowing was carried out on 5 May in both systems, using the same doses and the same fertilizer as in the previous year. During the growing season, only one herbicide was applied: Principal Plus (440 g/ha) + Vivolt (Corteva) (250 mL/ha). Harvesting was carried out on 2 October in CT and on 27 October in NT, where the growing season was longer because of the higher soil moisture.

2.3. Soil Sampling and Analysis

Soil samples were collected using stainless soil cores with a volume of 100 cm3 (5.1 cm in height and 5 cm in diameter) in two phases, after sowing and harvesting maize. Samples were taken from the inter-row area in the middle of 0–10 cm, 10–20 cm, 20–30 cm and 30–40 cm depths with 3 replicates at each depth. Undisturbed soil samples were used to determine bulk density (BD), porosity (SP) and saturated hydraulic conductivity (Ksat). For each property 72 soil samples were collected (2 systems × 3 replicates × 4 depths × 3 cylinders per depth).
To determine BD, the soil samples were oven-dried at 105 °C for 24 h, weighed and the BD was calculated using Equation (1) [27]:
BD (g/cm3) = (weight of oven-dried soil)/(soil volume = 100 cm3)
In the laboratory, the samples for saturated hydraulic conductivity were capillary saturated for 48 h and then Ksat was measured using the Hauben permeameter (Eijkelkamp, Giesbeek, The Netherlands) that is based on the falling-head method and calculated using Equation (2):
Ksat = a × l A × t × l n h 1 h 2
where Ksat—saturated hydraulic conductivity (cm/s), a—the cross-sectional area of the piezometric tube (cm2), l—the specimen height during the test (cm), A—the cross-sectional area of the specimen (cm2), t—the interval between measurements (s), h1—piezometric head at the start of the selected interval (cm), h2—the piezometric head at the end of the selected interval (cm).
The soil pore network was analyzed using a micro-computer tomograph (SkyScan 1273, Bruker, Leipzig, Germany) on natural settlement samples, as described by Calistru et al. [28].
The soil samples for aggregate water stability (WSA) were collected in modified settlements at the same time as the undisturbed samples. The WSA was assayed using the Eijkelkamp wet sieving equipment according to the method described by Kemper et. al. [29]. Samples were air dried, followed by preparation for analysis by weighing 4 g of soil from the 1–2 mm soil fraction. This soil was placed on the sieves with a mesh size of 0.25 mm, capillary saturated and then washed in distilled water for 3 min, while soil without water stability dissociates. Then the distilled water cores were replaced by other cores with 0.2% NaOH solution. Finally, the cores were oven dried at 105 °C and the WSA was calculated using Equation (3):
WSA   ( % ) = B A + B × 100
where B is the core with NaOH solution and soil with aggregate stability, and A is the core with distilled water and soil without aggregate stability.
The moisture content was determined gravimetrically and volumetrically. Gravimetric water content (GWC) was measured monthly during the growing season from five points per system at six depth intervals, 0–10, 10–20, 20–30, 30–50, 50–70 and 70–90 cm, in three replicates at each depth. The samples are weighed, then oven-dried at 105 °C for 24 h, and then weighed to calculate the gravimetric moisture content.
For volumetric water content (VWC), SM100 (Spectrum) and SM300 sensors were installed in the field after sowing, and connected to a WatchDog data reading and storage station. The sensors were placed at three different depths of 10, 20 and 30 cm in both tillage systems, on the plant row. In 2022, they were installed in the field from 23 June to 15 September, and in 2023, from 30 May to 10 October. Each was set to read moisture at 1-h intervals, and the data were downloaded from the memory stations using SpecWare 9 Pro software. The sensor specifications provided by Spectrum Technologies (Aurora, IL, USA) indicate that they have a resolution of 0.1%, and an accuracy of 3%, and operate at a temperature range of 0.5–80 °C [30].

2.4. Statistical Analysis

This research focused on the effect of tillage systems on soil physical and hydro-physical properties. Sampling and analysis were performed in several replicates (up to nine for BD, Ksat, GWC, SP) and results were reported as mean ± SD. SPSS for Windows (version 22.0; SPSS Inc., Chicago, IL, USA, 2007) and Origin Pro 8.1 (SR3 V8.1.34.90) were used for comparing means and graphs design. Differences between samples were evaluated by Tukey’s test at p ≤ 0.05 with a one-way analysis of variance (ANOVA).

3. Results and Discussion

3.1. Influence of the Tillage System on Bulk Density (BD)

Soil tillage systems had different effects on BD at each depth and in each year. BD showed sensitivity to tillage intensity, with differences not only among sampled layers but also among years of the study. After sowing, in 2022, the NT system has higher values of BD compared to the CT, due to tillage for seedbed preparation, with significant differences in the 0–20 cm depth (Figure 3). Our results are in agreement with the study conducted by Wang Y. et al. who reported that BD increases in the topsoil layer when long-term NT with mulch is applied [31]. Between 0–30 cm, in the CT plow layer, BD has lower values due to tillage [32,33]; at 30–40 cm depth, the two tillage systems have the same BD values. At the end of the growing season, BD decreases slightly in NT at the 0–30 cm depth, a result is similar to those reported by Afzalinia and Zabihi [34], and increases in CT in all studied depths, with statistically significant differences (p ≤ 0.05) between the systems. BD shows higher values in CT after harvest at 10–30 cm depth than NT. This is caused by soil compaction induced by passing agricultural machinery and the disintegration of soil particles due to a reduction in WSA, leading to reduced soil porosity and increased BD. This can also be a temporary variation, influenced by climatic conditions.
In 2023, NT had lower means compared to CT only in the 30–40 depth after sowing. In the other studied depths, values of BD were higher in the NT system at both determinations. Lower BD in CT treatment can be attributed to the presence of large pore size [31]. The BD ranged from 1.08 to 1.40 g/cm3 in the CT, with a maximum at the 30–40 cm depth. The lowest values in the NT were at the soil surface in the 0–10 cm soil layer, 1.24 at sowing and 1.29 g/cm3 at harvest, and a maximum at sowing of 1.45 g/cm3 in the 10–20 cm soil layer. In NT, the mean BD values on the studied depths were higher in 2022 by 13.8% (sowing) and 1.5% (harvesting) and in 2023 by 3.0% (sowing) and 6.2% (harvesting) compared to CT. The same studies reported inconsistencies in the results on the effect of the tillage system on BD; however, most reported studies indicated an increase in BD in NT compared to CT [32,35,36].

3.2. Influence of the Tillage System on Soil Pore Network

Quantifying the different categories of soil porosity is important to improve our understanding of water and airflow. Figure 4 shows an example of the 3D soil porosity distribution in a sample taken in an undisturbed state for this study. This measurement was carried out on samples collected in 2022 after harvesting the maize crop.
Table 2 shows the porosity results for the studied systems. The detected pore space (>25 μm) was classified into two categories: open porosity (air-connected pores) and closed porosity (isolated or unconnected pores). The closed porosity ranged from 0.42 to 1.10% with statistical differences between the tillage systems. At the soil surface, the CT system has a higher value of this porosity category, and at 10–40 cm, the percentage was higher in NT. The percent of open porosity increased in the NT system from 40.69% at the soil surface to 43.13% in the 20–30 cm layer. A similar observation is reported by Calistru et al. [28] who noted an increase in the percentage of open porosity in the NT system in the 20–30 cm layer compared to the surface soil layer. Additionally, Gao et al. showed that open macropores were observed more frequently in NT system soil after 16 years than in CT [37].
The total porosity in the CT system ranged from 10.57 to 21.25% in the 10–20 cm and 20–30 cm soil layers, respectively, and in the NT system from 12.19 to 43.81%, recorded in the same soil layers as in the CT system, with statistically significantly differences. The total porosity was higher in the NT system at all studied depths compared to the CT system, by 276% at 0–10 cm depth, 15% at 10–20 cm depth, 106% at 20–30 cm depth, and 31% at 30–40 cm depth. Under NT, the non-disturbance and accumulation of plant debris on the soil surface promoted the activity of microorganisms and biopore formation by plant roots. In addition, earthworms contribute to macropore formation, and the lack of tillage creates a network over time [38,39]. Also, Coper et al. found that soil porosity under long practice without tillage returns to its initial values [40]. Both tillage systems had a high variation of total porosity, caused most probably by the high level of soil sample heterogeneity [41].
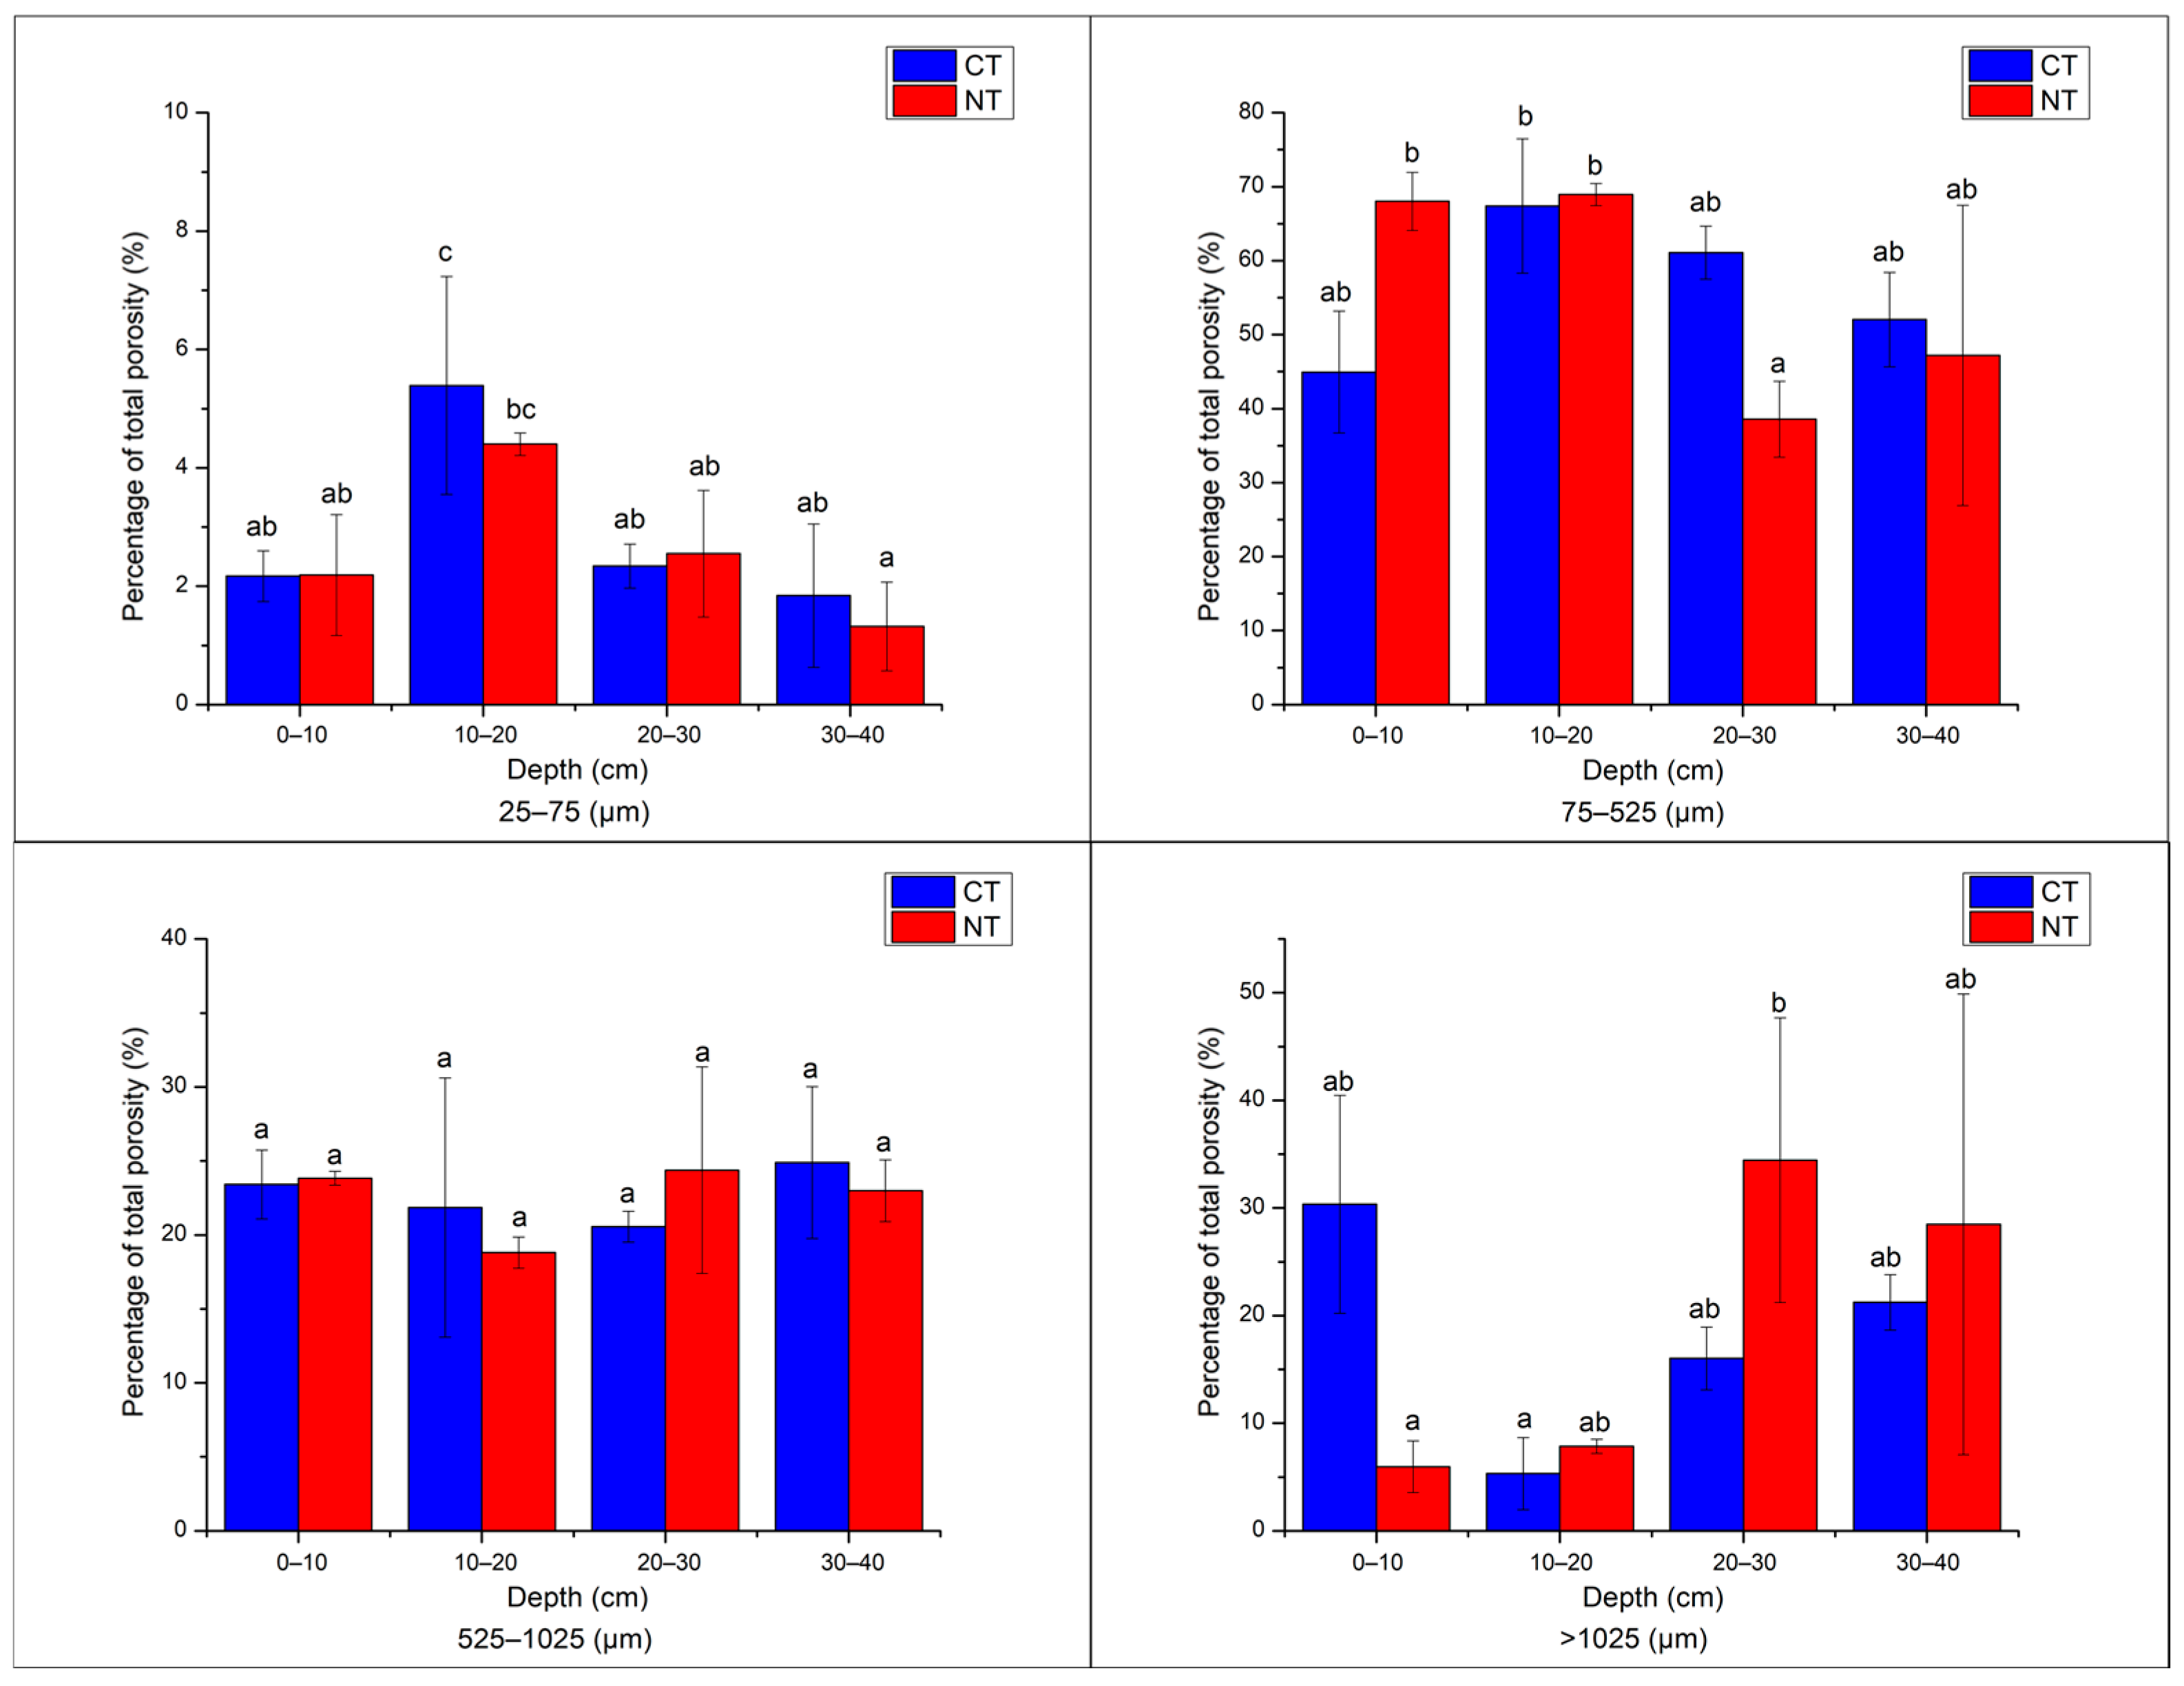
Figure 5 illustrates the pore size categories for each treatment and depth. The pores were divided into four categories according to their diameter (25–75 μm, 75–525 μm, 525–1025 μm and >1025 μm).
The CT variant shows a higher percentage of pores, with diameters ranging from 25–75 and 525–1025 µm at 10–20 cm depth. It also has higher values of pores of 75–525 µm at 20–40 cm depth and pores greater than 1025 µm at 0–10 cm depth. Increased soil porosity in the surface layers, especially macroporosity, as a result of tillage, has been frequently reported [42,43]. In the NT, at 20–30 cm depth, the percentage of pore between 25–75, 525–1025 and more than 1025 µm was higher compared to the CT system. The pores between 75–525 µm were higher in NT (68.01%) at the depth of 0–10 cm. As for pores larger than 1025 µm, they had a lower percentage in the NT system on the 0–20 cm depth compared to CT and significantly higher on the 20–40 cm depth. This is confirmed by De Moraes et al., who found that the CT system has a higher percentage of macropores in the surface layer (0–10 cm depth) compared to practicing the NT system in the long term [44]. In the NT system, without mechanical tillage, soil pores are generally formed as a result of biological processes, such as crop root development and soil fauna activity [45]; likely for this reason, macropores predominate in the NT system in the depth of 10–40 cm.

3.3. Influence of the Tillage System on Soil Hydraulic Conductivity (Ksat)

Saturated hydraulic conductivity (Ksat) is one of the most important hydraulic properties, influencing water flow in soils. Regarding the influence of the tillage system on Ksat, it was found that the CT system compared to NT had a higher infiltration rate after sowing at the 0–20 cm depth by 5.3 (10–20 cm) to 12.8% (0–10 cm) in 2022 and by 19.6 (0–10 cm) to 26.1% (10–20 cm) in 2023 due to the increase in soil porosity throughout soil disturbance (Table 3). This is confirmed by studies that indicate that CT generally creates a temporary increase in macroporosity and Ksat, but this is often offset by long-term compaction effects [37,46,47]. Under the arable layer, at a depth of 30–40 cm, Ksat values were more favorable for soil water infiltration after harvesting compared to sowing, caused by soil compaction in spring after the pass performed to prepare the seedbed, which decreases by autumn as a result of the plant’s root system penetration in depth. Ksat in the NT system had higher and distinctly significant values than in the CT system on both post-harvest samples and on 20–40 cm depth after sowing. Also, under the NT system, the Ksat values were better at the end of the growing season than at sowing time, with the exception of 30–40 cm (2022) and 20–30 cm (2023) soil layers on which Ksat values were higher at sowing.
At the end of the growing season, in post-harvest crop samples, Ksat values were higher in NT than CT [37], possibly related to increased biological activity in NT systems [42] and higher soil organic matter content can enhance soil structure and porosity, thereby improving hydraulic conductivity [46,47,48,49]. Our results are in agreement with those obtained by Bahmani who reported that Ksat values were significantly higher in NT than in CT, indicating that the absence of tillage allows better pore connectivity and less compaction [7]. This is confirmed by García-Tomillo et al. [50], who reported that the CT system generally tends to compact the soil, especially in the surface layer, with negative effects on water permeability.

3.4. Influence of the Tillage System on Water-Stable Aggregates (WSA) and Distribution of Soil Aggregates

Tillage treatments significantly (p ≤ 0.05) influenced the WSA at all studied depths; thus, the NT system had the highest values of this index at 0–30 cm depth and the CT system recorded higher values at 30–40 cm (Table 4). In 2022, the WSA in the CT system ranged from 50.36% (0–10 cm) to 76.54% (30–40 cm) and in the NT system from 70.35% (30–40 cm) to 83.02% (10–20 cm). In 2023, the WSA means ranged from 55.01% (10–20 cm) to 80.30% (30–40 cm) in the CT system and from 69.24% (20–30 cm) to 82.21% (10–20 cm) in the NT system. A higher aggregate stability under the NT system is attributed to the presence of plant residues on the soil surface, which increases the organic matter pool and facilitates soil aggregation by microbial activity [51,52,53,54]. This is confirmed in a study by Topa et al. who compared the NT system with CT. They concluded that the NT improved the soil aggregate stability by reducing disturbance and trapping crop residues at the soil surface [36]. The results are also confirmed by Wang et al. which report that NT treatment with a protective layer had higher macroaggregate stability in all depths compared to CT [31]. This phenomenon is attributed to stable macroaggregate formation in undisturbed soil [55].
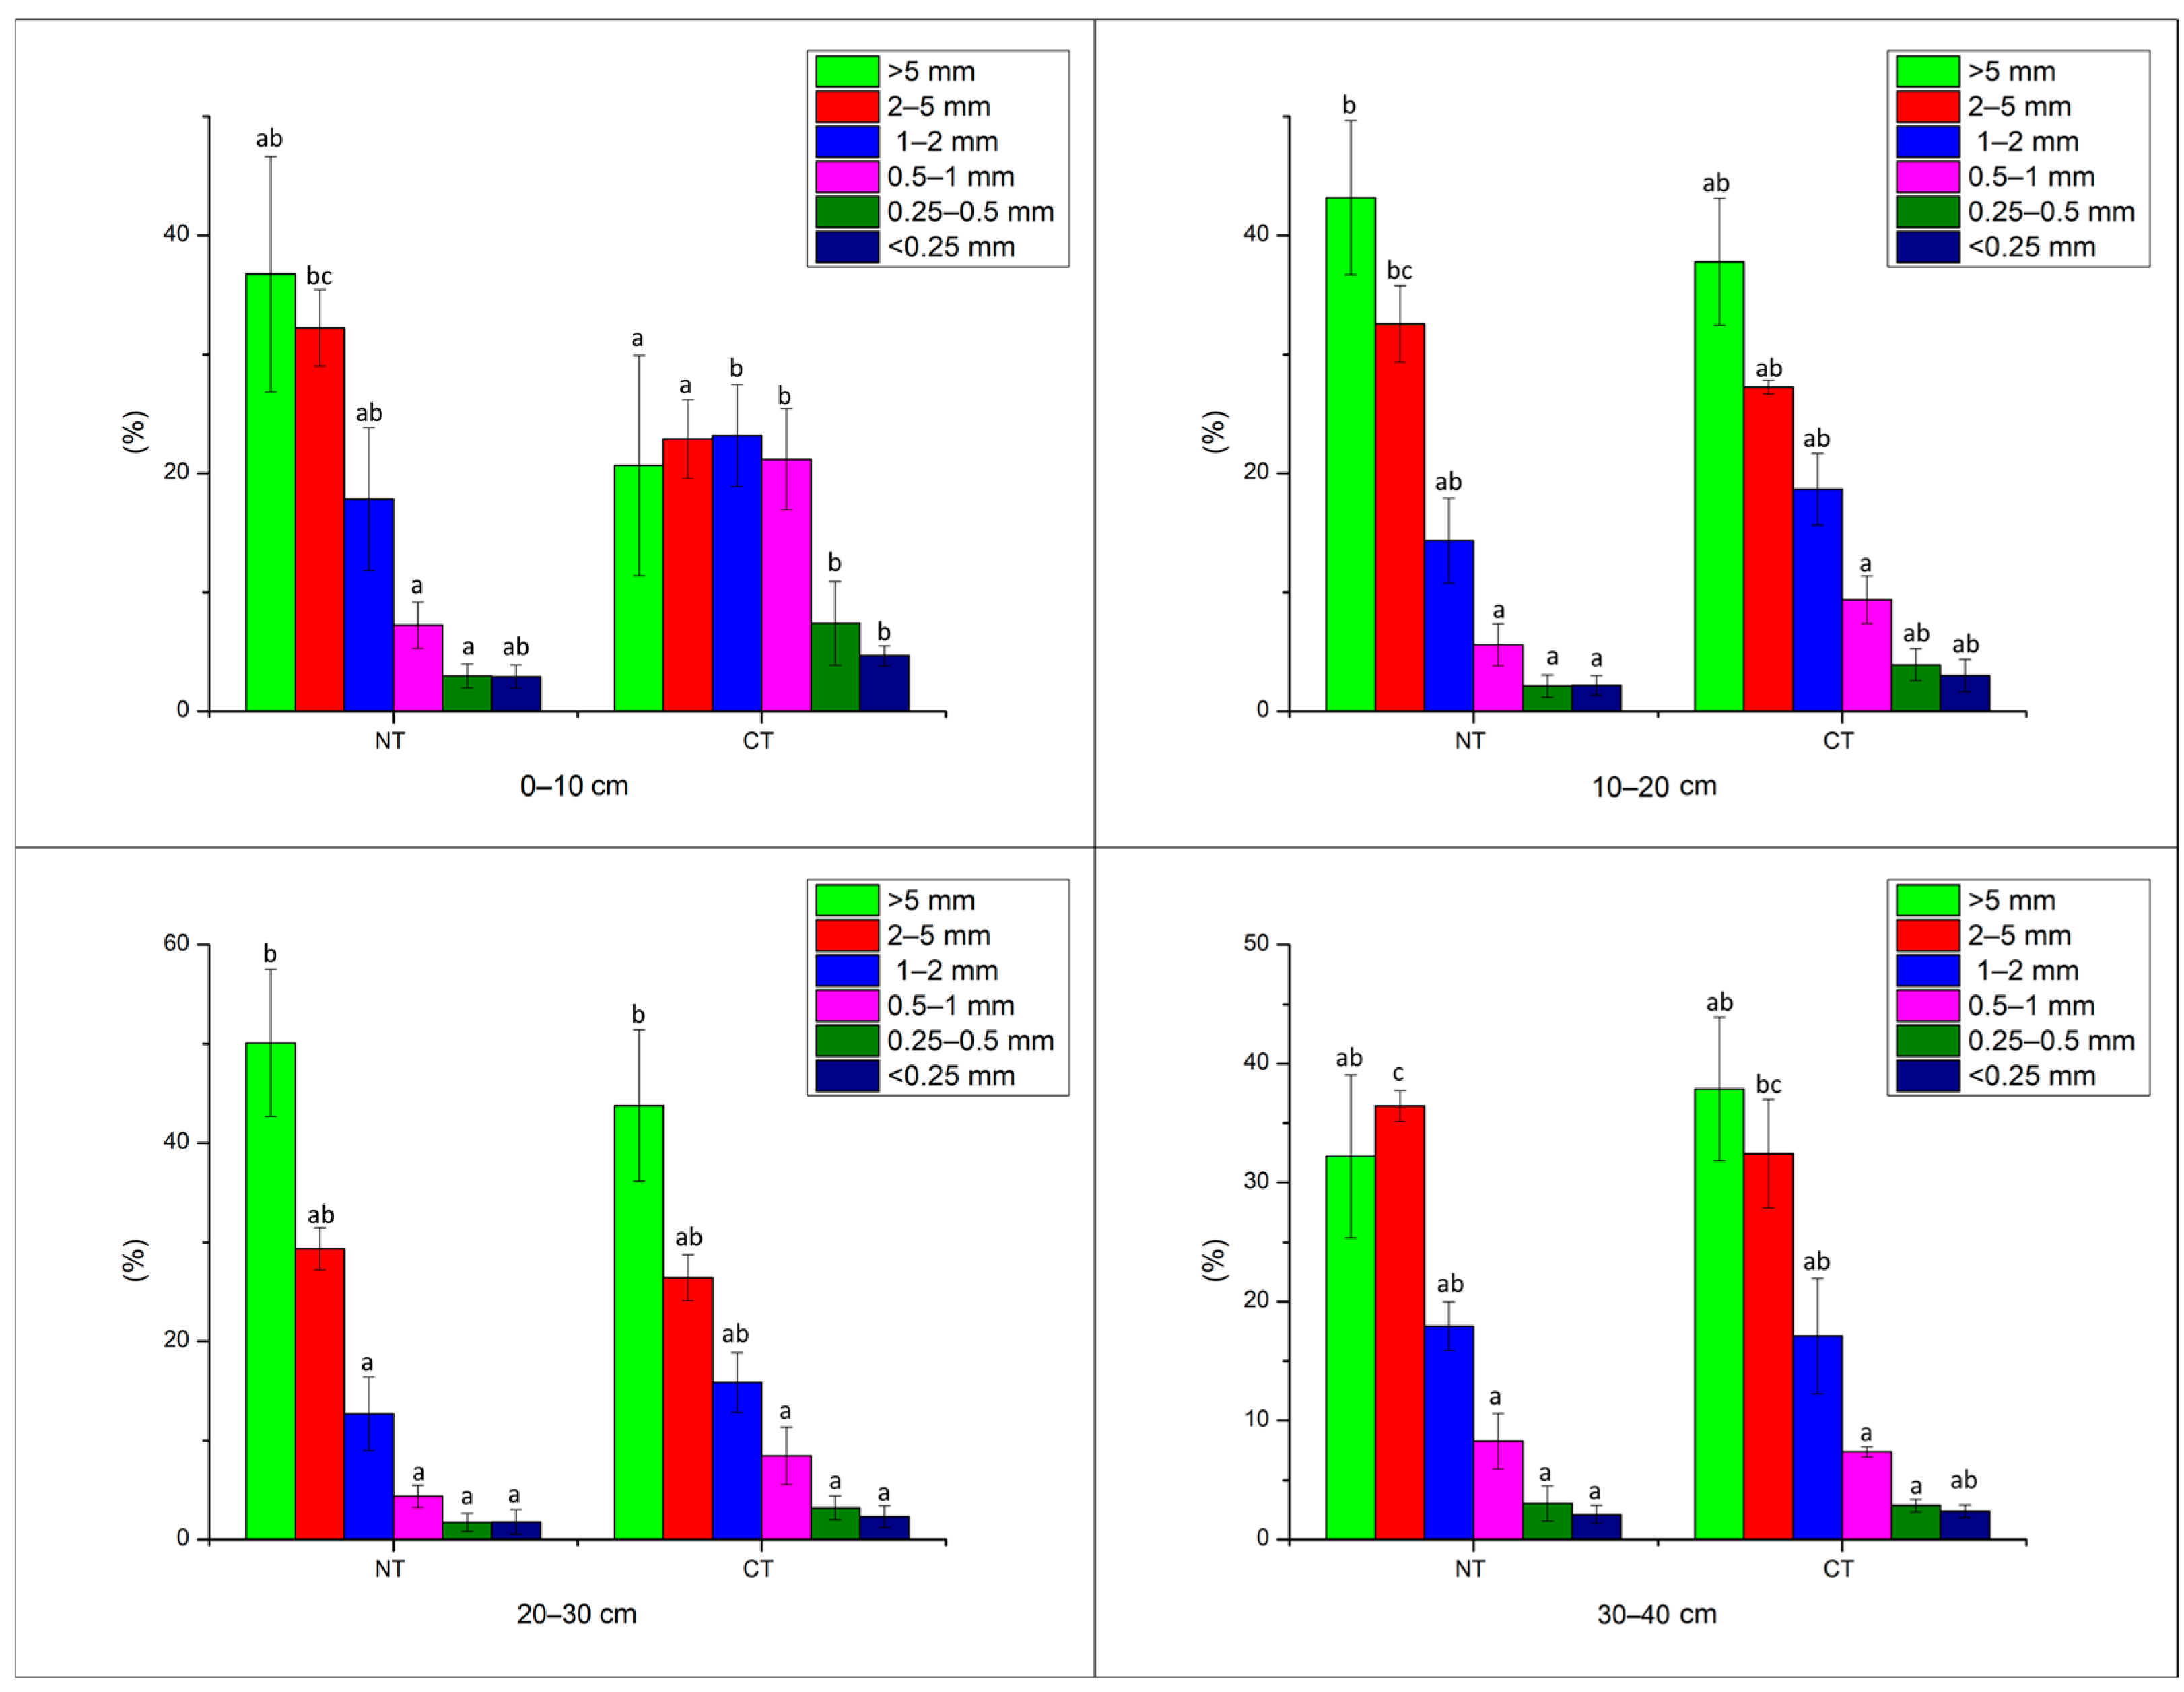
The studied tillage systems significantly (p ≤ 0.05) influenced aggregate distribution in all size fraction classes (Figure 6). The proportion of large (>5 mm) and medium (2–5 mm) macroaggregates was significantly higher in the NT treatment than in CT. In contrast, the proportion of small macroaggregates (1–2, 0.5–1, 0.25–0.5 mm) was higher in CT than in NT on the 0–30 cm depth, but lower under the tillage layer, (30–40 cm). As for the proportion of microaggregates (<0.25 mm), it was significantly higher in CT compared to NT at all studied depths. Long-term practice of the NT system has increased the proportion of macroaggregates larger than 2 mm, particularly at the 0–10 cm depth [56]. The implementation of the NT system promotes the formation and stabilization of large macroaggregates by less soil disturbance and retention of crop residues on the surface that reduce the impact of raindrops [57]. Enhancement of large macroaggregation within NT increases water infiltration and aeration in the root zone due to larger pore size [58]. Our study indicated that macro-aggregates, particularly very large ones, represented the predominant part of the studied soil, which was in agreement with Wegner et al. [59]; however, some authors reported that microaggregates represented most of the proportion in the soils they studied [60].

3.5. Influence of the Tillage System on Soil Gravimetric Water Content (GWC)

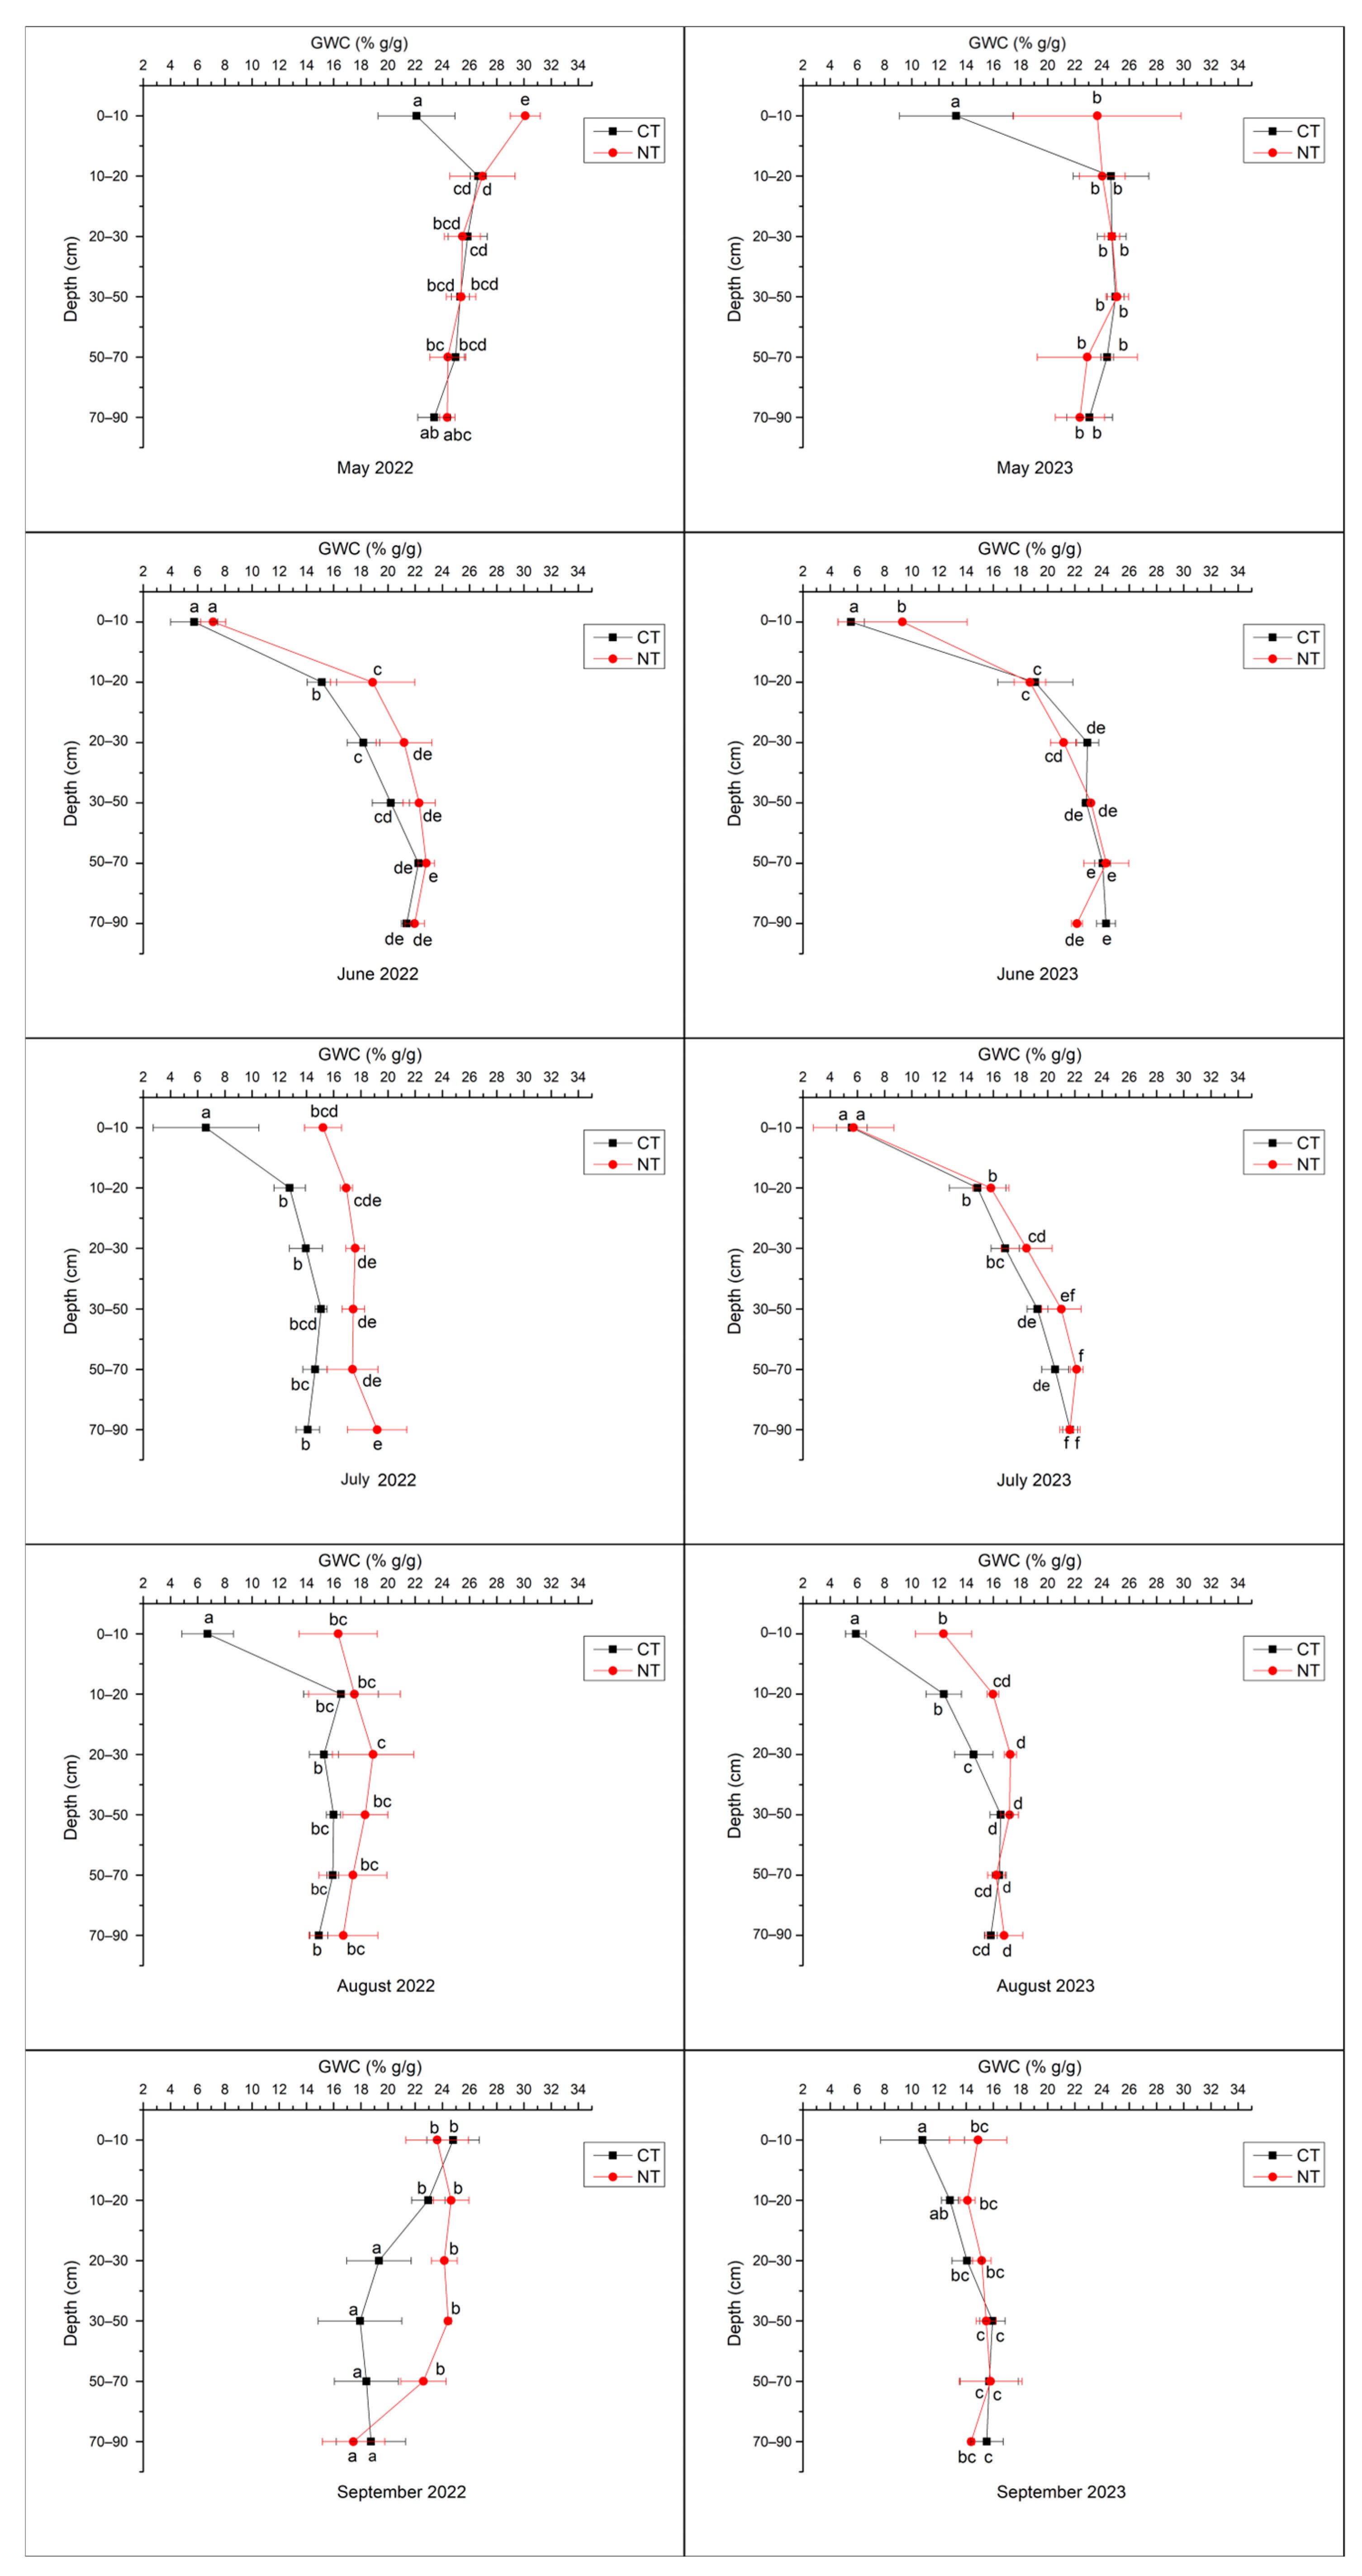
Figure 7 shows the moisture soil content variation between the two tillage systems for each month of the growing season over six depth intervals ranging from 0–90 cm in both years of the study. The higher moisture in the NT system, especially in the 0–10 cm layer, with statistically significant differences compared to CT in both years of the study, was due to the mulch covering the soil surface during the 8 years of this practice. In one of the driest months of the year, August, the NT system had a moisture content more than double in the 0–10 cm layer compared to CT. In 2022, the NT system had higher soil moisture content compared to the CT, except for the determinations made in May on the 10–70 cm depth and September on the 0–10 and 70–90 cm depths. In 2023 in June and July, a period with a significant amount of precipitation, the differences in soil moisture between the systems are minimal. In July, the moisture content is almost equal at 0–10 and 70–90 cm depth and higher in the NT system at 10–70 cm depth, and in June, the NT has higher moisture content only at the soil surface.
The CT system by tillage loosens the soil, disrupts pore connectivity and changes pore distribution and size, with direct effects on soil water holding capacity [61]. There were statistically significant differences (p ≤ 0.05) in moisture content between the two systems at each depth, in both years. Generally, the NT system conserves more water due to straw retention, which reduces surface water evaporation [62], especially in the current climatic conditions when drought sets in during the summer months in the studied area. Research conducted over the last few decades, since the impact of climate change on agriculture became an issue, has revealed that the tillage system practiced has a major role in soil moisture content variation [63]. Hence, the best results were obtained under the NT system, which conserves soil moisture better by increasing water infiltration and reducing evaporation [64].

3.6. Influence of the Tillage System on the Soil Volumetric Water Content (VWC)

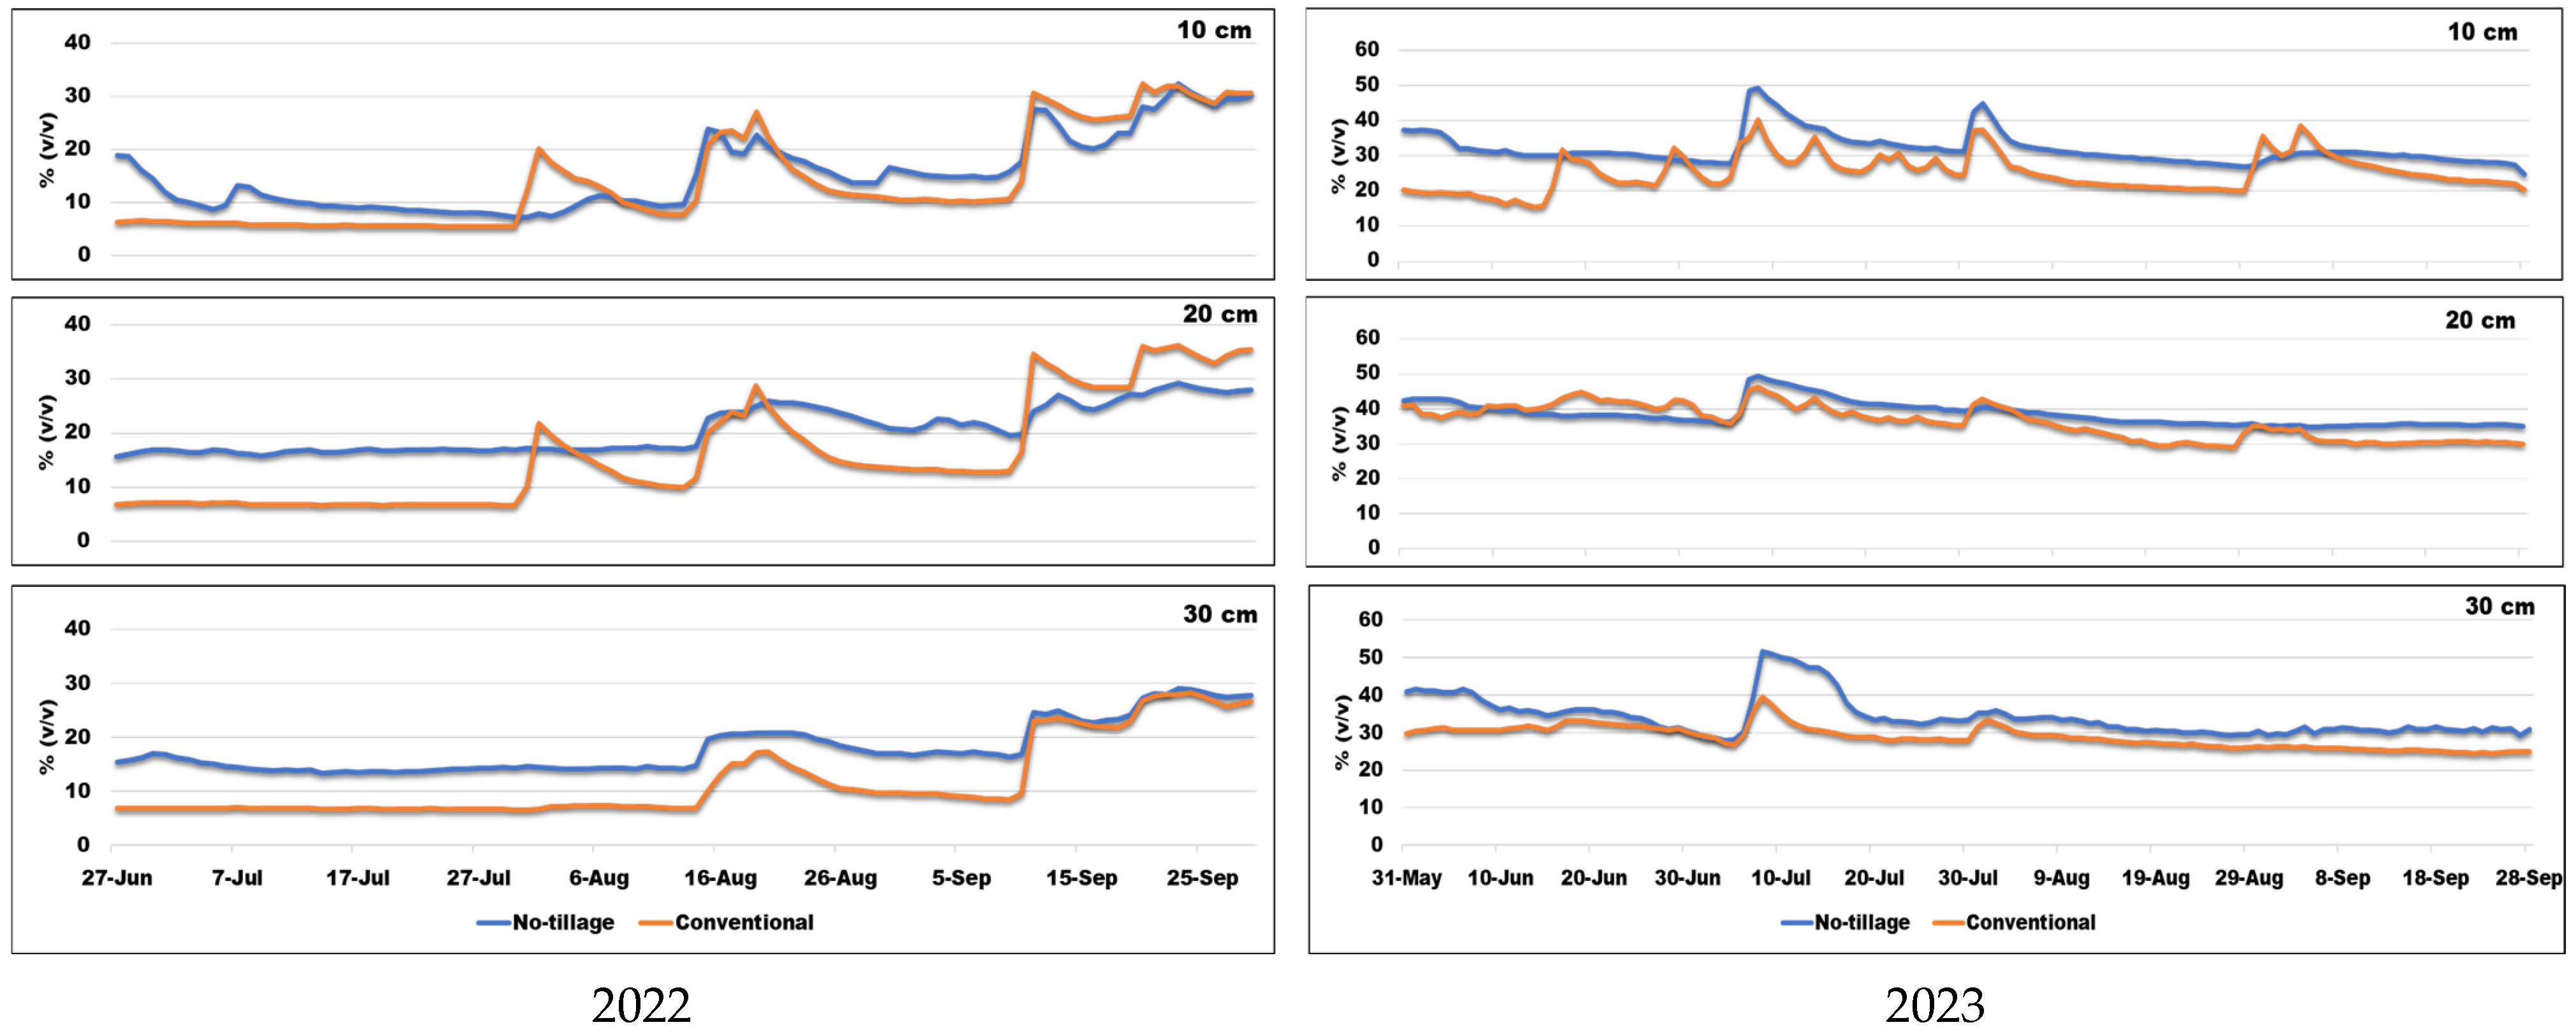
According to the results illustrated in Figure 8, regarding VWC in maize crops, for the 2022 and 2023 years, the NT volumetric water content was higher than the CT on all soil studied depths, with few exceptions. In 2022, at the 10 and 20 cm depths from September 10 to September 25, the CT had a higher moisture content, and in 2023, the 20 cm depth had a slightly higher water content in June. The VWC ranged per depth as follows: in 2022, the minimum VWC values were recorded in the CT; thus, at the 10 cm depth, it was 5.49% v/v (30 July), at the 20 cm depth, it was 6.57% v/v (30 July), and at the 30 cm depth, it was 6.49% v/v (31 July). The maximum values of moisture recorded in the CT for the 10 and 20 cm depths were 32.54% v/v (20 September) and 36.03% v/v (20 September), respectively, and at the 30 cm depth, the maximum value was recorded in the NT of 29.02% v/v (23 September). The minimum volumetric moisture content is recorded in the CT due to the high evaporation on the soil surface [65] and lower water infiltration capacity because of the compacted soil layers [66]. In 2022, from the beginning of the moisture monitoring until 31 July, when the minimum moisture was reached, 12.4 mm of precipitation was measured, and between the minimum and moisture maximum point, 131.4 mm was recorded.
In 2023, at the depth of 10 cm, the CT recorded a minimum value of 15.54% v/v on 14 June, while the maximum value of 49.18% v/v was recorded on 8 July in the NT. At a depth of 20 cm, the minimum value of 28.9% v/v (28 August) was also recorded in the CT, and the maximum value of 49.5% v/v (8 July) was recorded in the NT. On the last studied depth, the VWC varied between a minimum of 24.45% v/v (24 September) in the CT and a maximum of 51.65% v/v (8 July) in the NT. This was confirmed by another study, indicating that the volumetric water content was lower in the deep layers of the CT system compared to NT [67]. In 2023, the minimum values were recorded at different times across depth, based on plant water consuming depth at different phases, and the maximum value was recorded on 8 July due to 97.4 mm of precipitation in a single day. Studies confirm that soil cultivated with NT has a positive volumetric water difference of 7% compared to CT [68]. Other studies indicate that the volumetric soil water content was higher in NT than in CT, especially on the soil surface [69,70,71].

4. Conclusions

Soil properties are strongly influenced by management practices and local climatic conditions. Our research was conducted in a long-term experimental field, where the impact of tillage systems on soil quality is monitored. In the current climatic conditions, when drought is a serious problem for agriculture, there is a critical issue of conserving water in the soil. Our experiment highlights the importance of farming conservative tillage systems in the north-east of Romania to reduce soil moisture deficit during dry periods and its conservation.
During this study, we analyzed the main soil physical and hydro-physical properties. The long-term practice of the NT system with straw retention leads to increased BD values with significant differences and a constant Ksat over time with a slight improvement, also with significant differences compared to the CT system. Under NT, WSA values are higher at 0–30 cm soil layer than in the CT system. In terms of soil moisture, the results of this study show that the NT system leads to a higher infiltration rate and better moisture conservation during the growing season compared to the CT. Based on these results, it can be considered that the NT with straw retention in 8 years of continuous cultivation represents an adequate tillage practice able to maintain and improve soil health under the current climatic conditions in the north-east of Romania.
No-tillage is an effective soil management practice, but in our monitoring, yields do not significantly exceed conventional practice. This can be explained by the fact that nutrient distribution is not uniform and balanced in the soil profile, with nutrients concentrated in the surface layers. A limitation of the study would be the absence of research on the chemical properties with a particular focus on the organic matter content. It is also recommended that after a period of time (several years), the soil must be mechanically mobilized to incorporate the mulch accumulating on the soil surface and to balance the nutrient, aerobic and water regime, thereby promoting soil chemical and biochemical processes.
Our research will continue in the long term, and monitoring will cover several directions. Given that half of the plots occupied by the NT system were subjected to deep loosening in the autumn of 2023, the comparative effects of this intervention and the systems already implemented will be monitored in terms of the properties presented in this paper: chemical parameters, vegetation indices and, in particular, yields.

Author Contributions

Conceptualization, G.-D.M., T.G.A., A.-E.C. and C.G.; methodology, G.-D.M. and G.J.; software, G.-D.M. and D.C.Ț.; validation, G.J. and D.C.Ț.; formal analysis, G.-D.M.; investigation, G.-D.M. and C.G.; resources, G.J.; data curation, G.J.; writing—original draft preparation, G.-D.M., T.G.A.; writing—review and editing, G.J. and A.-E.C.; visualization, G.J.; supervision, G.J.; project administration, G.J.; funding acquisition, D.C.Ț. All authors have read and agreed to the published version of the manuscript.

Funding

This research is co-financed by the European Regional Development Fund through the Competitiveness Operational Program 2014–2020, grant number 4/AXA1/1.2.3. G/05.06.2018, project “Establishment and implementation of partnerships for the transfer of knowledge between the Iasi Research Institute for Agriculture and Environment and the Agricultural Business Environment”, acronym “AGRIECOTEC”, SMIS code 119611.

Institutional Review Board Statement

Not applicable.

Data Availability Statement

Data are contained within the article; further inquiries can be directed to the corresponding authors.

Conflicts of Interest

The authors declare no conflicts of interest.

References

  1. Walthall, C.L.; Hatfield, J.; Backlund, P.; Lengnick, L.; Marshall, E. Climate Change and Agriculture in the United States: Effects and Adaptation; USDA Technical Bulletin; United States Department of Agriculture: Washington, DC, USA, 2013. [Google Scholar]
  2. Loecke, T.D.; Burgin, A.J.; Riveros-Iregui, D.A.; Ward, A.S.; Thomas, S.A. Weather whiplash in agricultural regions drives deterioration of water quality. Biogeochemistry 2017, 133, 7–15. [Google Scholar]
  3. FAO. Save and Grow: A Policymaker’s Guide to the Sustainable Intensification of Smallholder Crop Production; Food and Agriculture Organization of the United Nations (FAO): Rome, Italy, 2011. [Google Scholar]
  4. Kassam, A.; Friedrich, T.; Derpsch, R.; Kienzle, J. Overview of the worldwide spread of conservation agriculture. Field Actions Sci. Rep. 2015, 8, 1–11. [Google Scholar]
  5. Kassam, A.; Friedrich, T.; Derpsch, R. Successful Experiences and Lessons from Conservation Agriculture Worldwide. Agronomy 2022, 12, 769. [Google Scholar] [CrossRef]
  6. Kainiemi, V.; Arvidsson, J.; Kätterer, T. Effects of autumn tillage and residue management on soil respiration in a long-term field experiment in sweden. J. Plant Nutr. Soil Sci. 2015, 178, 189–198. [Google Scholar]
  7. Bahmani, O. Evaluation of the short-term effect of tillage practices on soil hydro-physical properties. Pol. J. Soil Sci. 2019, 52, 43. [Google Scholar]
  8. Steponavičienė, V.; Bogužas, V.; Sinkevičienė, A.; Skinulienė, L.; Vaisvalavičius, R.; Sinkevičius, A. Soil water capacity, pore size distribution, and CO2 emission in different soil tillage systems and straw retention. Plants 2020, 11, 614. [Google Scholar]
  9. Farahani, E.; Emami, H.; Forouhar, M. Effects of tillage systems on soil organic carbon and some soil physical properties. Land Degrad. Dev. 2022, 33, 1307–1320. [Google Scholar]
  10. Chen, X.; Shi, X.; Liang, A.; Zhang, X.; Fan, R.; Wei, S. Least limiting water range and soil pore-size distribution related to soil organic carbon dynamics following zero and conventional tillage of a black soil in northeast China. J. Agric. Sci. 2014, 153, 270–281. [Google Scholar]
  11. Franchini, J.; Debiasi, H.; Balbinot, A.; Tonon, B.; Farias, J.; Oliveira, M.; Torres, E. Evolution of crop yields in different tillage and cropping systems over two decades in southern Brazil. Field Crops Res. 2012, 137, 178–185. [Google Scholar]
  12. Obalum, S.E.; Chibuike, G.U.; Peth, S.; Ouyang, Y. Soil organic matter as sole indicator of soil degradation. Environ. Monit. Assess. 2017, 189, 176. [Google Scholar]
  13. Kahlon, M.S.; Lal, R.; Ann-Varughese, M. Twenty-two years of tillage and mulching impacts on soil physical characteristics and carbon sequestration in Central Ohio. Soil Tillage Res. 2013, 126, 151–158. [Google Scholar]
  14. Rabot, E.; Wiesmeier, M.; Schlüter, S.; Vogel, H.J. Soil structure as an indicator of soil functions: A review. Geoderma 2018, 314, 122–137. [Google Scholar]
  15. Basche, A.; DeLonge, M. Comparing infiltration rates in soils managed with conventional and alternative farming methods: A meta-analysis. BioRxiv 2019, 14, e0215702. [Google Scholar]
  16. Flynn, K.; Bagnall, D.; Morgan, C. Evaluation of slakes, a smartphone application for quantifying aggregate stability, in high-clay soils. Soil Sci. Soc. Am. J. 2020, 84, 345–353. [Google Scholar]
  17. Thirkell, T.; Charters, M.; Elliott, A.; Sait, S.; Field, K. Are mycorrhizal fungi our sustainable saviours? considerations for achieving food security. J. Ecol. 2017, 105, 921–929. [Google Scholar]
  18. Lv, L.; Gao, Z.; Liao, K.; Zhu, Q.; Zhu, J. Impact of conservation tillage on the distribution of soil nutrients with depth. Soil Till. Res. 2023, 225, 105527. [Google Scholar]
  19. Holland, J.M. The environmental consequence of adopting conservation tillage in Europe: Reviewing the evidence. Agric. Ecosyst. Environ. 2004, 103, 1–25. [Google Scholar]
  20. Rahman, M.; Aravindakshan, S.; Hoque, M.A.; Rahman, M.A.; Gulandaz, A.; Rahman, J.; Islam, T. Conservation tillage (CT) for climate-smart sustainable intensification: Assessing the impact of CT on soil organic carbon accumulation, greenhouse gas emission and water footprint of wheat cultivation in Bangladesh. Environ. Sustain. Ind. 2021, 10, 100106. [Google Scholar]
  21. Rusu, M.; Filip, M.; Cara, I.G.; Țopa, D.; Jităreanu, G. Soil Nutrient Dynamics and Farming Sustainability Under Different Plum Orchard Management Practices in the Pedoclimatical Conditions of Moldavian Plateau. Agriculture 2025, 15, 509. [Google Scholar] [CrossRef]
  22. Moraru, P.I.; Rusu, T.; Gus, P.; Bogdan, I.; Pop, A.I. The role of minimum tillage in protecting environmental resources of the Transylvanian Plain, Romania. Rom. Agric. Res. 2015, 32, 127–135. [Google Scholar]
  23. Rusu, T. Energy efficiency and soil conservation in conventional, minimum tillage and no-tillage. Int. Soil Water Conserv. Res. 2014, 2, 42–49. [Google Scholar]
  24. Rusu, T.; Bogdan, I.; Moraru, P.I.; Pop, A.I.; Duda, B.M.; Coste, C. 2015. Research results on conservative tillage systems in the last 50 years at USAMV Cluj-Napoca. ProEnvironment 2015, 8, 105–111. [Google Scholar]
  25. FieldClimate. Available online: www.fieldclimate.com (accessed on 3 February 2025).
  26. Mihu, G.D.; Ursu, A.; Filip, M.; Țopa, D.; Jitǎreanu, G. The influence of tillage systems on nutrients supply in soil on corn crop at the Ezareni farm, Iasi County. Res. J. Agric. Sci. 2022, 54, 93–100. [Google Scholar]
  27. Canarache, A. Agricultural Soil Physics; Ceres Bucharest Publishing House: Bucharest, Romania, 1990; pp. 49–76. (In Romanian) [Google Scholar]
  28. Calistru, A.E.; Cara, I.G.; Topa, D.; Jitareanu, G. Analyzing soil porosity under different tillage systems using X-ray microtomography. Lucr. Stiințifice 2016, 59, 201–204. [Google Scholar]
  29. Kemper, W.D.; Rosenau, R.C. Aggregate Stability and Size Distribution. In Methods of Soil Analysis; Klute, A., Ed.; John Wiley & Sons, Ltd.: Hoboken, NJ, USA, 1986; pp. 425–442. ISBN 9780891188643. [Google Scholar]
  30. Spectrum Tehnologies WaterScout SM100. Available online: https://www.specmeters.com/WaterScout-SM100-Soil-Moisture-Sensor-20-Cable (accessed on 6 February 2025).
  31. Wang, Y.; Zou, L.; Lou, C.; Geng, X.; Zhang, S.; Chen, X.; Liang, A. No-tillage with straw retention influenced maize root growth morphology by changing soil physical properties and aggregate structure in Northeast China: A ten-year field experiment. Geoderma Reg. 2024, 38, e00840. [Google Scholar]
  32. Blanco-Canqui, H.; Ruis, S.J. No-tillage and soil physical environment. Geoderma 2018, 326, 164–200. [Google Scholar]
  33. Jabro, J.D.; Stevens, W.M.; Evans, R.G.; Mikha, M.M.; Allen, B.L. Physical and hydraulic properties of a sandy loam soil under zero, shallow and deep tillage practices. Soil Till. Res. 2016, 159, 67–72. [Google Scholar]
  34. Afzalinia, S.; Zabihi, J. Soil compaction variation during corn growing season under conservation tillage. Soil Till. Res. 2014, 137, 1–6. [Google Scholar]
  35. Lv, Q.; Zhou, B.; Wang, P. Effects of no-tillage on root traits and yield of maize and soil physical properties: A meta-analysis. Chin. J. Ecol. 2020, 39, 3492–3499. [Google Scholar]
  36. Topa, D.; Cara, I.G.; Jităreanu, G. Long term impact of different tillage systems on carbon pools and stocks, soil bulk density, aggregation and nutrients: A field meta-analysis. Catena 2021, 199, 105102. [Google Scholar]
  37. Gao, L.; Wang, B.; Li, S.; Wu, H.; Wu, X.; Liang, G.; Gong, D.; Zhang, X.; Cai, D.; Degr´e, A. Soil wet aggregate distribution and pore size distribution under different tillage systems after 16 years in the Loess Plateau of China. Catena 2019, 173, 38–47. [Google Scholar]
  38. Galdos, M.V.; Pires, L.F.; Cooper, H.V.; Calonego, J.C.; Rosolem, C.A.; Mooney, S.J. Assessing the long-term effects of zero-tillage on the macroporosity of Brazilian soils using X-ray Computed Tomography. Geoderma 2019, 337, 1126–1135. [Google Scholar] [PubMed]
  39. Wardak, D.L.R.; Padia, F.N.; de Heer, M.I.; Sturrock, C.J.; Mooney, S.J. Zero-tillage induces significant changes to the soil pore network and hydraulic function after 7 years. Geoderma 2024, 447, 116934. [Google Scholar]
  40. Cooper, H.V.; Sj¨ogersten, S.; Lark, R.M.; Girkin, N.T.; Vane, C.H.; Calonego, J.C.; Rosolem, C.; Mooney, S.J. Long-term zero-tillage enhances the protection of soil carbon in tropical agriculture. Eur. J. Soil Sci. 2021, 72, 2477–2492. [Google Scholar]
  41. Seguel, Ó.; Díaz-Domínguez, D.; Acevedo, E.; Silva, P.; Homer, I.; Seitz, S. Hydraulic conductivity in a soil cultivated with wheat-rapeseed rotation under two tillage systems. J. Soil Sci. Plant Nutr. 2020, 20, 2304–2315. [Google Scholar]
  42. Mangalassery, S.; Sjögersten, S.; Sparkes, D.L.; Sturrock, C.J.; Craigon, J.; Mooney, S.J. To what extent can zero tillage lead to a reduction in greenhouse gas emissions from temperate soils? Sci. Rep. 2014, 4, 4586. [Google Scholar]
  43. Pöhlitz, J.; Rücknagel, J.; Koblenz, B.; Schlüter, S.; Vogel, H.-J.; Christen, O. Computed tomography and soil physical measurements of compaction behaviour under strip tillage, mulch tillage and no tillage. Soil Tillage Res. 2018, 175, 205–216. [Google Scholar]
  44. De Moraes, M.T.; Debiasi, H.; Carlesso, R.; Franchini, J.C.; da Silva, V.R.; da Luz, F.B. Soil physical quality on tillage and cropping systems after two decades in the subtropical region of Brazil. Soil Tillage Res. 2016, 155, 351–362. [Google Scholar]
  45. Schlüter, S.; Großmann, C.; Diel, J.; Wu, G.-M.; Tischer, S.; Deubel, A.; Rücknagel, J. Long-term effects of conventional and reduced tillage on soil structure, soil ecological and soil hydraulic properties. Geoderma 2018, 332, 10–19. [Google Scholar]
  46. Blanchy, G.; Albrecht, L.; Bragato, G.; Garré, S.; Jarvis, N.; Koestel, J. Impacts of soil management and climate on saturated and near-saturated hydraulic conductivity: Analyses of the open tension-disk infiltrometer meta-database (OTIM). Hydrol. Earth Syst. Sci. 2023, 27, 2703–2724. [Google Scholar]
  47. Amami, R.; Ibrahimi, K.; Sher, F.; Milham, P.; Ghazouani, H.; Chehaibi, S.; Hussain, Z.; Iqbal, H.M.N. Impacts of different tillage practices on soil water infiltration for sustainable agriculture. Sustainability 2021, 13, 3155. [Google Scholar] [CrossRef]
  48. Sanaullah, M.; Usman, M.; Wakeel, A.; Cheema, S.A.; Ashraf, I.; Farooq, M. Terrestrial ecosystem functioning affected by agricultural management systems: A review. Soil Tillage Res. 2020, 196, 104464. [Google Scholar]
  49. Castellini, M.; Fornaro, F.; Garofalo, P.; Giglio, L.; Rinaldi, M.; Ventrella, D.; Vonella, A. Effects of no-tillage and conventional tillage on physical and hydraulic properties of fine textured soils under winter wheat. Water 2019, 11, 484. [Google Scholar] [CrossRef]
  50. García-Tomillo, A.; Figueiredo, T.; Almeida, A.; Rodrigues, J.; Dafonte, J.; González, A.; Hernández, Z. Comparing effects of tillage treatments performed with animal traction on soil physical properties and soil electrical resistivity: Preliminary experimental results. Open Agric. 2017, 2, 317–328. [Google Scholar]
  51. Steponavičienė, V.; Bogužas, V.; Sinkevičienė, A.; Skinulienė, L.; Sinkevičius, A.; Klimas, E. Soil physical state as influenced by long-term reduced tillage, no-tillage and straw management. Zemdirb.-Agric. 2020, 107, 195–202. [Google Scholar]
  52. Schmidt, E.S.; Villamil, M.B.; Amiotti, N.M. Soil quality under conservation practices on farm operations of the southern semiarid pampas region of Argentina. Soil Tillage Res. 2018, 176, 85–94. [Google Scholar]
  53. Tagar, A.A.; Gujjar, M.A.; Adamowski, J.; Leghari, N.; Soomro, A. Assessment of implement efficiency and soil structure under different conventional tillage implements and soil moisture contents in a silty loam soil. Catena 2017, 158, 413–420. [Google Scholar]
  54. Răus, L.; Jităreanu, G.; Ailincăi, C.; Pârvan, L.; Ţopa, D. Impact of different soil tillage systems and organo-mineral fertilization on physical properties of the soil and on crops yield in pedoclimatic conditions of Moldavian Plateau. Rom. Agric. Res. 2016, 33, 111–122. [Google Scholar]
  55. Zhang, Y.; Li, X.; Gregorich, E.G.; Mclaughlin, N.B.; Zhang, X.; Guo, Y.; Liang, A.; Fan, R.; Sun, B. No-tillage with continuous maize cropping enhances soil aggregation and organic carbon storage in Northeast China. Geoderma 2018, 330, 204–211. [Google Scholar]
  56. Hati, K.M.; Jha, P.; Dalal, R.C.; Jayaraman, S.; Dang, Y.P.; Kopittke, P.M.; Menzies, N.W. 50 years of continuous no-tillage, stubble retention and nitrogen fertilization enhanced macro-aggregate formation and stabilisation in a Vertisol. Soil Tillage Res. 2021, 214, 105163. [Google Scholar]
  57. Page, K.L.; Dang, Y.P.; Dalal, R.C.; Reeves, S.; Thomas, G.; Wang, W.; Thompson, J.P. Changes in soil water storage with no tillage and crop residue retention on a Vertisol: Impact on productivity and profitability over a 50 years period. Soil Till. Res. 2019, 194, 104319. [Google Scholar]
  58. Jat, H.S.; Datta, A.; Sharma, P.C.; Kumar, V.; Yadav, A.K.; Choudhary, M.; Choudhary, V.; Gathala, M.K.; Sharma, D.K.; Jat, M.L.; et al. Assessing soil properties and nutrient availability under conservation agriculture practices in a reclaimed sodic soil in cereal-based systems of North-West India. Arch. Agron. Soil Sci. 2018, 64, 531–545. [Google Scholar]
  59. Wegner, B.R.; Osborne, S.L.; Lehman, R.M.; Kumar, S. Seven-year impact of cover crops on soil health when corn residue. BioEnerg. Res. 2018, 11, 239–248. [Google Scholar]
  60. Obalum, S.E.; Nwite, J.C.; Oppong, J.; Igwe, C.A.; Wakatsuki, T. Comparative topsoil characterization of sawah rice fields in selected inland valleys around Bida, north-central Nigeria: Textural, structural and hydrophysical properties. Paddy Water Environ. 2011, 9, 291–299. [Google Scholar]
  61. Zúñiga, F.; Horn, R.; Rostek, J.; Peth, S.; Uteau, D.; Dörner, J. Anisotropy of intensity–capacity parameters on Aquands with contrasting swelling– shrinkage cycles. Soil Tillage Res. 2019, 193, 101–113. [Google Scholar]
  62. Ke, S.; Yang, J.; Yong, X.; Lv, W.; Zheng, X.; Pan, J. Influence of tillage practices and stubble incorporation on soil aggregates, organic carbon, and crop yields in a rice-wheat rotation system. Sci. Rep. 2016, 6, 36602. [Google Scholar]
  63. Yin, B.Z.; Zhen, W.C.; Ma, Y.H. Effects of subsoiling-seeding on soil water, temperature and microbial characteristics of summer maize field. Chin. J. Eco-Agric. 2015, 23, 285–293. [Google Scholar]
  64. Moreira, W.H.; Tormena, C.A.; Karlen, D.L.; da Silva, Á.P.; Kellere, T.; Betioli, E., Jr. Stageal changes in soil physical properties under long-term no-tillage. Soil Tillage Res. 2016, 160, 53–64. [Google Scholar]
  65. Burke, J.A.; Lewis, K.L.; Ritchie, G.L.; DeLaune, P.B.; Keeling, J.W.; Acosta-Martinez, V.; McLendon, T. Net positive soil water content following cover crops with no tillage in irrigated semi-arid cotton production. Soil Tillage Res. 2021, 208, 104869. [Google Scholar]
  66. Dai, L.; Fu, R.; Guo, X.; Du, Y.; Zhang, F.; Cao, G. Soil Moisture Variations in Response to Precipitation Across Different Vegetation Types on the Northeastern Qinghai-Tibet Plateau. Front. Plant Sci. 2022, 13, 854152. [Google Scholar]
  67. Rasheed, M.W.; Tang, J.; Sarwar, A.; Shah, S.; Saddique, N.; Khan, M.U.; Imran Khan, M.; Nawaz, S.; Shamshiri, R.R.; Aziz, M.; et al. Soil Moisture Measuring Techniques and Factors Affecting the Moisture Dynamics: A Comprehensive Review. Sustainability 2022, 14, 11538. [Google Scholar] [CrossRef]
  68. Müller, M.; Kurz, G.; Yaramanci, U. Influence of tillage methods on soil water content and geophysical properties. Near Surf. Geophys. 2009, 7, 27–36. [Google Scholar]
  69. Schwartz, R.C.; Baumhardt, R.L.; Evett, S.R. Tillage effects on soil water redistribution and bare soil evaporation throughout a season. Soil Tillage Res. 2010, 110, 221–229. [Google Scholar]
  70. Cullum, R.F. Influence of tillage on maize yield in soil with shallow fragipan. Soil Tillage Res. 2012, 119, 1–6. [Google Scholar]
  71. Liu, S.; Gao, Y.; Lang, H.; Liu, Y.; Zhang, H. Effects of conventional tillage and no-tillage systems on maize (Zea mays L.) growth and yield, soil structure, and water in loess plateau of China: Field experiment and modeling studies. Land 2022, 11, 1881. [Google Scholar] [CrossRef]
Figure 1. Map of the study area in NE Romania and the experimental field design.
Agriculture 15 00981 g001
Figure 2. Temperature and precipitation in the area of the experimental field during the research period (www.fieldclimate.com, accessed on 3 February 2025).
Agriculture 15 00981 g002
Figure 3. Bulk density (BD) under different tillage systems at depths between 0 and 40 cm in 2022 and 2023. Different letters indicate significant differences between tillage systems at each determination at the 0.05 level. Error bars represent the corresponding SD of mean values. CT: conventional tillage; NT: no-tillage.
Agriculture 15 00981 g003
Figure 4. Soil pore network analysis carried out using micro-computer tomography (SkyScan 1273, Bruker, Leipzig, Germany). CT: conventional tillage; NT: no-tillage.
Agriculture 15 00981 g004
Figure 5. Pore categories according to their diameter, as a percentage of total porosity. CT: conventional tillage; NT: no-tillage. Error bars represent the corresponding SD of mean values (n = 3). Different letters indicate significant differences between tillage systems at all depths for each pore category at the 0.05 level.
Agriculture 15 00981 g005
Figure 6. Distributions of soil aggregates at different soil depths under different treatments. Error bars represent the corresponding SD (n = 4). Different letters indicate significant differences between tillage systems at the same size of aggregate on all depths at the 0.05 level. CT: conventional tillage; NT: no-tillage.
Agriculture 15 00981 g006
Figure 7. Influence of tillage systems on the GWC. Error bars represent the corresponding SD (n = 9). Different letters indicate significant differences between tillage systems at each determination at the 0.05 level. CT: conventional tillage; NT: no-tillage.
Agriculture 15 00981 g007
Figure 8. Influence of tillage systems on the VWC.
Agriculture 15 00981 g008
Table 1. Soil chemical properties.
Tillage SystemsSampling Depth (cm)pHP (ppm)K (ppm)Humus (%)
CT0–106.8302003.25
10–206.8252103.13
20–306.8162132.47
30–407.231871.65
NT0–106.2282853.46
10–206.5141782.38
20–306.5111821.28
30–407.141140.73
CT: conventional tillage; NT: no-tillage.
Table 2. Impact of the tillage system on different pore categories (%).
Tillage SystemDepth
(cm)
Closed Porosity (%)Open Porosity (%)Total Porosity (%)
CT0–100.71 ± 0.28 ab10.27 ± 0.36 a10.91 ± 0.61 a
10–200.63 ± 0.17 ab10.00 ± 8.20 a10.57 ± 8.24 a
20–300.72 ± 0.01 ab20.69 ± 2.06 abc21.25 ± 2.05 abc
30–400.62 ± 0.13 ab18.91 ± 7.24 ab19.41 ± 7.14 ab
NT0–100.42 ± 0.16 a40.69 ± 8.52 bc41.01 ± 8.36 bc
10–201.06 ± 0.06 b11.20 ± 0.84 a12.19 ± 0.84 a
20–301.10 ± 0.40 b43.13 ± 16.29 c43.81 ± 15.88 c
30–400.72 ± 0.88 ab24.89 ± 10.49 abc25.43 ± 10.44 abc
CT: conventional tillage; NT: no-tillage. The date represents means ± SD (n = 3). Different letters indicate significant differences between tillage systems on each column at the 0.05 level.
Table 3. Effect of tillage on soil hydraulic conductivity (cm/s × 10−2).
Tillage SystemDepth (cm)20222023
SowingHarvestingSowingHarvesting
CT0–102.64 ± 0.38 d2.28 ± 0.17 cd2.38 ± 0.26 cd2.78 ± 0.72 d
10–202.16 ± 0.14 abc1.80 ± 0.18 ab2.08 ± 0.14 bc1.75 ± 0.80 bc
20–302.03 ± 0.08 a2.05 ± 0.22 bc1.81 ± 0.25 ab0.82 ± 0.10 a
30–402.31 ± 0.09 abc1.73 ± 0.05 a1.91 ± 0.15 ab1.29 ± 0.60 ab
NT0–102.34 ± 0.26 bc2.54 ± 0.35 d1.99 ± 0.18 b2.89 ± 0.07 d
10–202.05 ± 0.19 ab2.13 ± 0.22 c1.65 ± 0.02 a2.23 ± 0.06 cd
20–302.14 ± 0.13 abc2.24 ± 0.17 c2.51 ± 0.35 d2.01 ± 0.06 c
30–402.41 ± 0.09 cd2.32 ± 0.08 cd2.05 ± 0.12 b2.36 ± 0.37 cd
CT: conventional tillage; NT: no-tillage. The date represents means ± SD (n = 9). Different letters indicate significant differences between tillage systems on each column at the 0.05 level.
Table 4. Effect of tillage system on water-stable aggregates (%).
Tillage SystemDepth (cm)20222023
SowingHarvestingSowingHarvesting
CT0–1057.56 ± 0.65 a50.36 ± 0.91 a64.66 ± 0.65 b76.17 ± 1.45 ab
10–2068.24 ± 0.57 b55.36 ± 0.79 b55.01 ± 1.89 a73.63 ± 3.6 ab
20–3065.55 ± 0.76 a61.16 ± 0.74 c59.0 ± 0.80 ab57.82 ± 5.91 a
30–4075.97 ± 2.56 cd76.54 ± 1.10 e80.30 ± 0.42 d63.54 ± 3.0 ab
NT0–1074.36 ± 0.57 c80.13 ± 0.59 f70.29 ± 0.33 c76.66 ± 2.24 ab
10–2083.02 ± 0.29 c77.20 ± 0.31 ef77.27 ± 0.37 d82.21 ± 1.66 b
20–3080.91 ± 0.44 de79.23 ± 0.71 ef77.44 ± 2.06 d69.24 ± 7.34 ab
30–4074.53 ± 1.51 c70.35 ± 0.37 d76.42 ± 0.32 d79.21 ± 3.13 b
CT: conventional tillage; NT: no-tillage. The date represents means ± SD (n = 8). Different letters indicate significant differences between tillage systems on each column at the 0.05 level.
Disclaimer/Publisher’s Note: The statements, opinions and data contained in all publications are solely those of the individual author(s) and contributor(s) and not of MDPI and/or the editor(s). MDPI and/or the editor(s) disclaim responsibility for any injury to people or property resulting from any ideas, methods, instructions or products referred to in the content.