Abstract
Ensuring high-quality forage under Mediterranean conditions requires careful evaluation of genetic resources. Two perennial forage species, cocksfoot (Dactylis glomerata L.) and tall fescue (Festuca arundinacea Schreb.), were evaluated to determine the stability and broad-sense heritability of major forage quality traits across Greek environments. The objective was to identify stable, heritable traits contributing to consistent forage quality under climatic variability. Measured traits included crude protein (CP%), crude fiber (CF%), ash, acid detergent fiber (ADF), neutral detergent fiber (NDF), cellulose, hemicellulose, acid detergent lignin (ADL), digestible dry matter (DDM%), dry matter intake (DMI%), and relative feed value (RFV). Significant genotype × environment (G × E) interactions were observed for most traits, highlighting the importance of multi-environment testing, except for RFV in cocksfoot, which was non-significant. Principal Component Analysis (PCA) helped clarify how these traits covary across environments. The traits Crude Protein, Ash Content, and ADL (on PC1) are largely independent of the traits Cellulose and Hemicellulose (on PC2) in the case of cocksfoot. The pattern of loadings in the case of Tall fescue revealed that hemicellulose represents a completely separate dimension of variation, which is uncorrelated to the rest of the traits that form a unified, highly correlated group. In both cases, the first two PCs explained over 82% of the total variance, separating genotypes and environments. By integrating stability (SI) and heritability (H2) results, Cock2D and T2fes were identified as the most stable and high-performing genotypes across environments. These findings could support breeding strategies for developing resilient forage cultivars with consistent quality and adaptability to Mediterranean environments, thereby enhancing sustainable livestock production.
1. Introduction
The most important parameters for supporting local livestock in meadows are the species components and the characteristics (traits) that ensure high-quality grazing. Forages contribute to sustainable agriculture and well-assembled meadows and play a significant role in the rural economy, by supporting grazing and hay production globally [1]. Meadows contribute to the rural economy by supporting animal production [2]. Forage species also support ecosystems by preserving plant biodiversity and reducing soil degradation and enhancing soil fertility [3]. In Mediterranean environments, forage productivity is often limited by seasonal drought and high summer temperatures, making the evaluation of stable genotypes particularly important.
Cocksfoot (Dactylis glomerata L.) is one of the most important forage plants for temperate and cold climate regions in the world [4,5]. It has a high forage value and adapts well to continental climates [5,6]. High productivity and resistance to diseases in variable climatic conditions are the main characteristics of the species; therefore, it is widely used for grazing and hay production all over the world [7,8]. Recent studies have found substantial genetic diversity and clear phylogenetic structure among Dactylis glomerata subspecies and populations, which shows the potential for targeted breeding and conservation strategies [5,9]. Information on the genetic relationship between genotypes can be used at the beginning of the breeding program to improve populations as complementary to phenotypic information [10,11]. Genetic diversity is important for a successful breeding program [12,13,14]. Plant breeding is based on genetic diversity and the use of selection methods to increase plant production. It is always important to accelerate genetic progress in plant breeding [15,16]. Cocksfoot is a highly productive forage grass, widely used in managed pastures and hay meadows due to its persistence and adaptability under different soil and management conditions [17]. It is also an important source of genetic diversity.
Tall fescue (Festuca arundinacea Schreb.) is cultivated mainly as a forage and turfgrass species due to its high adaptability and productivity, and it is also increasingly used for biogas production owing to its favorable biomass composition [18,19]. It is one of the most important cool-season forage grasses. Tall fescue is a deep-rooted, long-lived bunchgrass with short rhizomes; therefore, cultivars must be chosen carefully to match local environments. Biomass production and quality may be improved through genetic selection, as tall fescue exhibits high intraspecific genetic variability that can be exploited to breed cultivars adapted to changing environmental conditions [20]. Location adaptability is an important consideration, as soil type and weather interact with genotype to determine total yield potential, a factor also observed in other species [21]. Tall fescue prefers and responds to a high level of nitrogen (N), and is found in moderate and even poor soils [22]. Thus, tall fescue may be particularly useful to prevent soil erosion in overgrazed mountain areas. To design an appropriate breeding program, phenotypic variation in heritable and stable traits must be analyzed [23] in order to ensure the efficiency of a selection [24].
In order to accurately evaluate the effect of genotype × environment (G × E) interactions, advanced statistical tools are required. Among them, the AMMI (Additive Main effects and Multiplicative Interaction) and the GGE (Genotype plus Genotype × Environment) biplot models are widely used in plant breeding and forage evaluation studies. AMMI combines analysis of variance with principal component analysis to partition and visualize G × E effects [25,26]. GGE biplot analysis, on the other hand, focuses on both genotype main effects and G × E interaction, providing a comprehensive graphical representation that helps to identify stable and high-performing genotypes across diverse environments [27,28]. These approaches have been successfully applied in forage species as well as in other crops, enabling the identification of genotypes with either broad or specific adaptation to diverse environments [26,29].
The purpose of this study was to analyze the stability of major forage quality traits in cocksfoot and tall fescue under Greek agro-environmental conditions. Specific objectives were: (i) to estimate the stability of traits such as crude protein, fiber fractions, digestibility, and relative feed value; (ii) to calculate heritability and trait correlations; and (iii) to apply AMMI and GGE biplot analyses to identify the most stable and high-performing genotypes. This integrated approach enables the identification of superior parental material for breeding programs targeting both forage quality and environmental resilience.
Hypothesis.
We hypothesize that certain cocksfoot and tall fescue genotypes will exhibit both high heritability and stability of key forage quality traits across diverse Greek environments, and that these stable genotypes can be effectively identified using AMMI and GGE biplot analyses.
2. Materials and Methods
2.1. Establishment of Crops and Experimental Techniques
A field trial with four cocksfoot (Dactylis glomerata L.) and five tall fescue (Festuca arundinacea Schreb.) materials was established in mid-November 2022 in Trikala, Greece (39°33′11.0″ N, 21°38′15.1″ E, altitude 120 m). An additional multi-environment trial was conducted in mid-December 2022 at the Institute of Industrial and Forage Crops farm in Larissa, Greece (39°36′39.08″ N, 22°25′28.12″ E, altitude 77 m) to assess environmental effects on forage traits. The environmental conditions of both sites were representative of Mediterranean forage production, with Trikala exhibiting higher rainfall and moderate temperatures, and Larissa experiencing lower precipitation and higher summer temperatures.
Soil characteristics were as follows: Trikala soils were loamy (40% sand, 32% silt, 28% clay), slightly alkaline (pH 8.0) with 9% CaCO3, moderate organic matter (1.7%), and low nitrate (5 mg kg−1) and phosphorus (16 mg kg−1) levels. Larissa soils were clayey (24% sand, 25% silt, 51% clay), slightly alkaline (pH 7.7) with 1.5% CaCO3, moderate organic matter (1.5%), and a K content of 624 mg kg−1. Electrical conductivity was low at both sites (~350 μS/cm), indicating nonsaline soils.
Meteorological data (Figure 1) showed that Trikala received approximately 15–20% more rainfall than Larissa, while Larissa recorded 2–3 °C higher mean temperatures during the growing season.
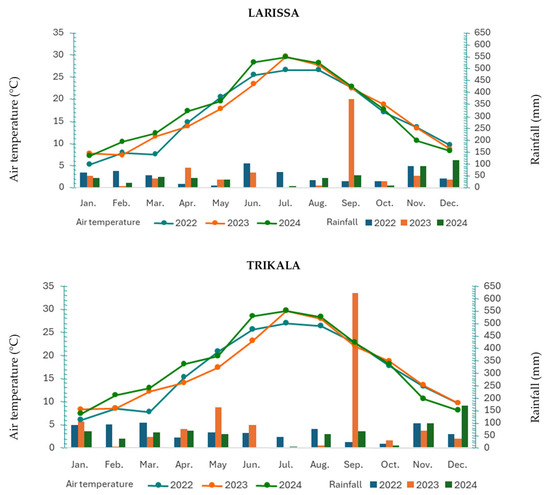
Figure 1.
Meteorological data mean air temperature (°C) and total monthly rainfall (mm).
2.2. Plant Material
The plant material consisted of two commercial cultivars of cocksfoot (Amba and Treposno) and two experimental breeding populations (Cock1D and Cock2D), as well as two commercial cultivars of tall fescue (Fawn and Finelawn) and three experimental populations (T1fes, T2fes, and T3fes) (Table 1). All experimental populations were developed through several cycles of modified mass selection, targeting improved forage quality, yield stability, and environmental adaptability.

Table 1.
Evaluated genotypes of cocksfoot and tall fescue, including their assigned codes and species.
2.3. Experimental Design and Management
The experimental design consisted of a complete randomized block design (RCBD) following Steel et al. [30], with three replications for tall fescue and six replications for cocksfoot. Each plot consisted of six rows, 0.25 m apart and 5 m in length, resulting in a total plot area of 7.5 m2. All agronomic practices followed local standard cultivation protocols.
Fertilization: A total of 150 kg N ha−1 and 80 kg P2O5 ha−1 were applied annually. In the first year, the full phosphorus dose and 50 kg N ha−1 were applied pre-planting, while the remaining 100 kg N ha−1 was split into four equal top-dressings of 25 kg N ha−1 each during the growing season, following irrigation or rainfall. The same fertilization protocol was maintained in the second year to ensure uniformity across seasons with all fertilizers applied on the soil surface without incorporation. Weed and pest management was applied uniformly across all plots according to local best practices to minimize environmental variability.
2.4. Experimental Measurements
All laboratory analyses were performed at the University of Thessaly’s Laboratory of Animal Technology. For the determination of green and dry forage yield, the entire plot area was cut to a height of 5 cm just before flowering, and the harvested material was immediately weighted to determine fresh yield. Subsamples (approximately 500 g) were collected from the center of each plot. The nutritional quality and potential forage value of cocksfoot and tall fescue samples were assessed.
The chemical composition of the dried samples was determined following official methods recommended by the Association of Official Analytical Chemists [31,32]. Before analysis, the collected samples were oven dried (IKA 125, IKA-Werke GmbH & Co. KG, Staufen im Breisgau, Germany) and ground to pass through a 1 mm sieve (Retsch ZM200, Retsch GmbH, Haan, Germany) to ensure representativeness. Each analysis was performed in triplicate to confirm the consistency of the results.
Crude Protein (CP) was calculated from nitrogen content (N) multiplied by the conversion factor 6.25. The nitrogen content was determined by the Kjeldahl method, according to AOAC Official Method 990.03, using Gerhardt Kjeldatherm digestion block KT20s and Gerhardt Vapodest 300 distillation unit (C. Gerhardt GmbH & Co. KG, Königswinter, Germany). Ash content was determined by incinerating dried samples at 600 °C for 2 h and expressed as a percentage of dry matter, according to AOAC Official Method 942.05. Crude Fiber (CF) was determined by sequential acid and alkaline digestion of the samples, according to AOAC Official Method 978.10. The results were expressed as a percentage of dry matter following correction for ash. The CF comprises the portion of cellulose and hemicelluloses resistant to the abovementioned digestion procedure, and does not include all fiber components present in the sample.
Acid Detergent Fiber (ADF), Neutral Detergent Fiber (NDF), and Acid Detergent Lignin (ADL) were analyzed according to Van Soest et al. [33] using a Velp FIWE Fiber Analyser (VELP Scientifica, Usmate, Italy). Structural carbohydrates were estimated from fiber fractions: cellulose as ADF minus ADL, and hemicellulose as NDF minus ADF [34].
The Relative Feed Value (RFV) was calculated following Linn and Martin [35] using fiber composition.
Digestible Dry Matter (DDM, %) was estimated from Acid Detergent Fiber (ADF, %) using the formula:
Then, the Dry Matter Intake (DMI, % of body weight) is estimated from Neutral Detergent Fiber (NDF, %) as:
Finally, RFV is calculated as:
This standardized approach allows comparison of forage feeding value based on fiber content and provides a comprehensive assessment of the nutritional quality of cocksfoot and tall fescue for forage production and bioenergy applications.
The Relative Feed Value (RFV) calculated as described above allows the classification of forage quality for practical feeding purposes. According to Linn and Martin [35], RFV values are interpreted as follows: Class I (RFV > 151) for the most productive dairy cows, Class II (RFV 125–151) for good-quality dairy cows and young heifers selected for breeding, Class III (RFV 103–124) for good-quality beef cattle, older heifers, and less productive dairy cows, Class IV (RFV 87–102) for beef cattle and non-lactating cows, and Class V (RFV 75–86) for dry cows intended for fattening, supplemented with high-energy feeds. This classification provides a practical guide to assess the suitability of cocksfoot and tall fescue forage for different livestock categories.
2.5. Statistical Analysis
A mixed-model of combined analysis of variance (ANOVA), over environments, was conducted to assess differences across environments for all evaluated variables, with genotype treated as a fixed effect, environment and genotype × environment interaction treated as random effects, and blocks considered random, following Steel et al. [30]. The three environments were defined as Trikala 2022–2023 (E1), Trikala 2023–2024 (E2), and Larissa 2022–2023 (E3). Statistical analyses were performed using IBM SPSS version 29 (IBM Corp., Armonk, NY, USA).
2.6. Stability Index Calculation
The Stability Index (SI) was calculated for each trait using the mean and standard deviation S, following the methods described by Fasoula [36], and has been widely used in local forage breeding studies to evaluate the performance stability of different genotypes, as reported in Greveniotis et al. [37].
Higher SI values indicate greater stability of the trait across different environments.
2.7. Estimation of Variance Components, Heritability, and Genetic Parameters
Variance components were computed using mean squares according to McIntosh [38], allowing calculation of broad-sense heritability (H2) as described by Johnson et al. [39] and Hanson et al. [40].
For each evaluated attribute, the phenotypic coefficient of variation (PCV) and genotypic coefficient of variation (GCV) were calculated in accordance with Singh and Chaudhary [41]:
where the genotypic variance, phenotypic variance, genotype × environment variance, residual variance (error), number of replications, number of environments, and overall mean for every examined attribute are, in turn, denoted by , , , , r, e, and , respectively.
2.8. The Multi-Environment Evaluation AMMI Tool and GGE Biplots
Two widely used biplot models, AMMI (Additive Main Effects and Multiplicative Interaction) and GGE (Genotype plus Genotype × Environment), were applied to analyze genotype × environment interactions and assess genotype stability and adaptability [42]. The AMMI model combines ANOVA of genotype and environment main effects with PCA of the GEI matrix [43] and generates biplots using SVD of a double-centered G × E table, allowing extraction of a two-way ANOVA for main effects while representing residual interactions via the multiplicative component [44]. Low PC1 values indicate higher genotype stability.
GGE biplots focus on genotype plus genotype × environment effects, showing the main portion of variance and identifying the ideal genotype and most desirable environments [27,45]. The concept of the biplot was first developed by Gabriel [46], as a scatter plot that graphically displays both the entries (e.g., cultivars) and the testers (e.g., environments) of two-way data (http://www.ggebiplot.com/concept.htm, accessed on 31 October 2025). The biplot visually displays genotypes and environments to facilitate interpretation of performance and stability. Statistical analyses and biplot construction were performed using PB Tools v.1.4 (International Rice Research Institute, IRRI, Laguna, Philippines).
2.9. Exploratory Data Analysis
Principal components analysis (PCA) was performed on scaled data to evaluate trait variability and contribution, using a two-stage approach to optimize interpretation. JMP 18 (Statistical Discovery LLC, Cary, NC, USA) was used to generate the respective graphs. Trait correlations were evaluated using Pearson’s correlation coefficient, following the method described by Steel et al. [30], and visualized using JMP 18 statistical software (Statistical Discovery LLC, Cary, NC, USA). Statistical analysis was conducted at a significance threshold of p < 0.05.
3. Results
3.1. ANOVA, Genetic Parameters, Stability, and Correlations
Table 2.
Mean squares (m.s.) from an ANOVA of forage nutritive quality traits in meadows expressed in dry matter (dm) for the evaluated attributes across environments and genotypes: Crude Protein, Ash Content, Crude Fiber, Acid Detergent Fiber (ADF), Neutral Detergent Fiber (NDF), Acid-Detergent Lignin (ADL), Hemicellulose, Cellulose, Predicted Dry Matter Digestibility (DDM), Dry Matter Intake (DMI) and Relative Feed Values (RFV) in cocksfoot.
Table 3.
Stability Index estimates for forage nutritive quality traits in meadows expressed in dry matter (dm) for the evaluated attributes across environments and genotypes: Crude Protein, Ash Content, Crude Fiber, Acid Detergent Fiber (ADF), Neutral Detergent Fiber (NDF), Acid-Detergent Lignin (ADL), Hemicellulose, Cellulose, Predicted Dry Matter Digestibility (DDM), Dry Matter Intake (DMI) and Relative Feed Values (RFV) in cocksfoot.
Table 4.
Genetic parameter estimates for Crude Protein, Ash Content, Crude Fiber, Acid Detergent Fiber (ADF), Neutral Detergent Fiber (NDF), Acid-Detergent Lignin (ADL), Hemicellulose, Cellulose, Predicted Dry Matter Digestibility (DDM), Dry Matter Intake (DMI) and Relative Feed Values (RFV), across environments in meadows.
3.1.1. ANOVA
The ANOVA results for cocksfoot (Table 2) indicated highly significant differences (p ≤ 0.01) among genotypes and environments for all measured traits. Genotype × Environment (G × E) interactions were also significant for all traits, even when the effect values were small (e.g., 0.0003). In tall fescue (Table 2), highly significant differences were observed among genotypes and environments as well, with significant G × E interactions for all measured traits. These results highlight that both genetic and environmental factors, as well as their interactions, play important roles in determining forage nutritive quality in both species.
3.1.2. Stability Index
In cocksfoot, stability estimations (Table 3) were generally high. Cultivar Cock2D showed the highest Stability Index values, reaching approximately 69,921 for NDF, 66,522 for DMI, and 62,072 for DDM. Cock1D displayed slightly lower but still substantial stability, with a maximum of 54,264 for DDM. In contrast, Amba and Treposno exhibited lower Stability Index values across the tested environments, indicating reduced stability. For tall fescue (Table 2), cultivar T2fes exhibited the highest stability for NDF (85,746) and DMI (75,662), followed by T3fes for DDM (57,483). The commercial cultivar Finelawn consistently recorded the lowest stability values across all traits. Overall, experimental populations demonstrated greater multi-environment stability than standard commercial cultivars for most measured traits.
3.1.3. Genetic Parameters
Cocksfoot genetic parameters (Table 4) showed high heritability (H2) for several key traits: ash content (99.21%), DMI (97.24%), NDF (96.98%), crude protein (94.26%), and RFV (92.77%). Cellulose exhibited the lowest heritability at approximately 68%. In tall fescue (Table 3), high heritability was also observed for ash content (94.80%), DMI (93.51%), NDF (96.60%), crude protein (91.10%), ADL (90.48%), and RFV (95.71%), while crude fiber and hemicellulose showed comparatively lower heritability values (<60%). These results indicate that selection for traits such as crude protein, ash content, DMI, NDF, and RFV is likely to be effective due to the high proportion of genetic variance.
3.1.4. Trait Correlations
In cocksfoot, correlation coefficients between traits (Figure 2) were highly significant, both positively and negatively. Strong positive correlations were found between crude protein and ash content (r = 0.90) and between crude protein and NDF (r = 0.83). Negative correlations were observed between crude protein and RFV (r = −0.79) and between cellulose and DDM (r = −0.99). NDF showed very strong negative correlations with DMI and RFV (r = −0.99 and −0.88, respectively), highlighting the inverse relationship between fiber content and forage intake and quality.
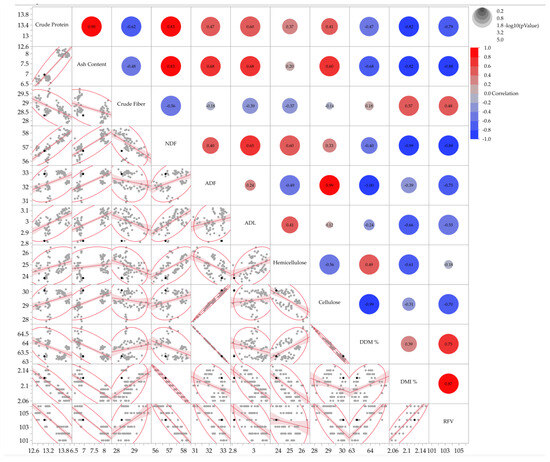
Figure 2.
Correlation matrix displaying pairwise scatterplots for the analyzed parameters of cocksfoot. The right section presents the correlation coefficients, while the left section contains scatterplots (grey dots) with fitted regression lines (red) and 95% shaded density ellipses that illustrate the clustering of data points. Black dots denote the bivariate means (centroids) of each variable pair.
For tall fescue (Figure 3), crude protein was positively correlated with NDF (r = 0.71) and negatively correlated with DMI and RFV (r ≈ −0.7). NDF exhibited extremely strong negative correlations with DMI (r = −1.00) and RFV (r = −0.94). ADF was almost perfectly correlated with cellulose (r ≈ 1.00) and negatively correlated with DDM (r = −1.000), indicating the strong influence of fiber composition on digestibility and intake.
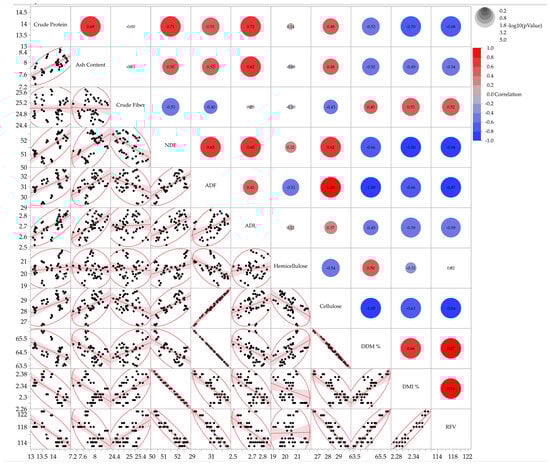
Figure 3.
Correlation matrix displaying pairwise scatterplots for the analyzed parameters of tall fescue. The right section presents the correlation coefficients, while the left section contains scatterplots with 95% density ellipses (black dots) with fitted regression lines (red) and 95% shaded density that illustrate the clustering of data points.
Overall, both species showed clear genetic and environmental influences on forage nutritive quality, with certain genotypes displaying higher stability and heritability, and strong trait interrelationships that can guide future selection for improved forage quality.
The principal component analysis (PCA) reveals relationships between genotypes of cocksfoot and tall fescue (Figure 4 and Figure 5, respectively) from different environments.

Figure 4.
Principal component analysis (PCA) for the traits of the four cocksfoot genotypes. Score plot: environment for each genotype is shown with a different marker (Env 1—circle, Env 2—triangle, Env 3—square) (a); Loading plot (b). Arrows in the loading plot indicate the direction and strength of each trait’s contribution to the principal components.
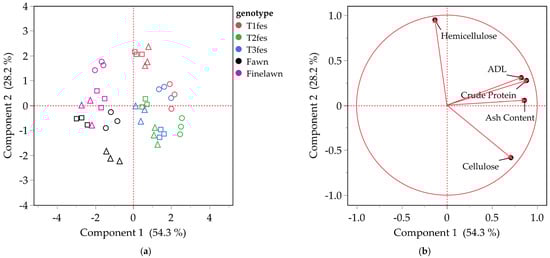
Figure 5.
Principal component analysis (PCA) for the traits of the five tall fescue genotypes. Score plot: environment for each genotype is shown with a different marker (Env 1—circle, Env 2—triangle, Env 3—square) (a); Loading plot (b). Arrows in the loading plot indicate the direction and strength of each trait’s contribution to the principal components.
In the case of cocksfoot (Figure 4a), the four genotypes (Cock2D, Cock1D, Amba, Treposno) distributed across the three environments (Env 1 = circle, Env 2 = triangle, Env 3 = square) were well defined by the first two Principal Components, explaining 88.6% of the total variance. The distribution revealed genotypes Cock2D with Cock1D (grouped in the negative part of PC1) and Amba with Treposno (grouped on the positive part of PC1), suggesting that each group shares more common traits through the environments studied. The corresponding loading plot (Figure 4b) illustrates trait contributions to the two components. Crude Protein, Ash Content and ADL load positively on PC1, suggesting that these three traits are highly positively correlated with each other. On the other hand, Cellulose loads strongly negatively, whereas Hemicellulose loads positively on PC2, revealing the presence of a strong negative relationship between these two traits.
The score plot of Tall fescue (Figure 5a) depicts the five genotypes (T1fes, T2fes, T3fes, Fawn, Finelawn) across the same three environments. Components 1 and 2 explain 82.5% of the total variance. Genotypes T1fes, T2fes, and T3fes are grouped on the positive part of Component 1, while the genotypes Fawn and Finelawn are located on the negative part. The loading plot (Figure 5b) shows that, except for Hemicellulose, which contributes strongly positively to PC2, all the other traits (Crude Protein, Ash Content, Cellulose and ADL) contribute positively to PC1. This suggests that all these variables are positively correlated with each other.
Complementary box plot analyses (Figures S11–S14) further supported the observed trends in forage quality and genotype stability. In cocksfoot, the breeding populations Cock1D and Cock2D exhibited consistently higher crude protein and ash content across all environments (Figure S11), indicating enhanced nutritive value and mineral composition compared with the commercial cultivars. In addition, both experimental populations maintained superior digestible dry matter (DDM) and comparable relative feed value (RFV) to cultivar Amba in environment E1 (Figure S12), confirming their higher digestibility potential without loss of feeding quality.
In tall fescue, the experimental populations likewise showed greater crude protein and ash levels across environments (Figure S13), reflecting their improved nutritional status. Most notably, three breeding populations recorded significantly higher DDM values in all environments, with correspondingly elevated RFV scores (Figure S14), especially in environments Trikala 2022–2023 (E1) and Larissa (E3), highlighting their strong adaptability and superior forage performance under varying Mediterranean conditions. These complementary analyses reinforce the advantage of the experimental populations over commercial cultivars in both stability and nutritional efficiency.
3.2. AMMI and GGE Biplot Analyses
The AMMI and GGE biplot analyses confirmed significant genotype × environment (G × E) interactions (p < 0.01) for all traits in both cocksfoot and tall fescue.
To evaluate the performance and stability of tall fescue genotypes across different environments, AMMI and GGE biplot analyses were conducted for key forage quality traits. The results for each trait are summarized below:
Crude Protein: AMMI PC1 explained 76.4%, and GGE PCs 88.6% and 11.1%. T3fes (G3) was identified as the top genotype, followed by Fawn (G4) and Finelawn (G5), with T3fes (G3) closest to the ideal genotype (Figure 6).
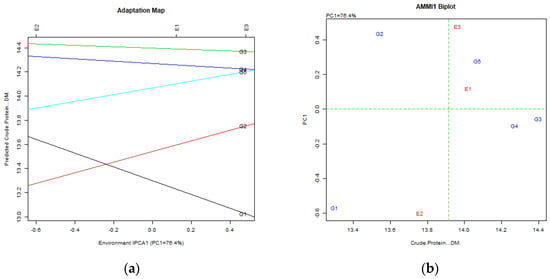
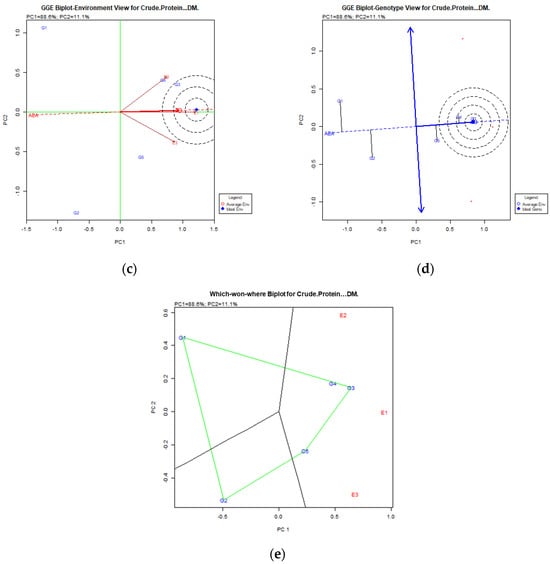
Figure 6.
Crude Protein content stability analysis for tall fescue genotypes, based on (a) AMMI adaptation map; (b) AMMI1 biplot; (c) Environmental stability GGE biplot. Red arrows represent environments; their length indicates discriminating ability, their direction shows association with principal components, and angles between arrows reflect correlations among environments. The red dashed line denotes the average environment axis, while concentric circles indicate proximity to the ideal environment; (d) Genotypic stability GGE biplot; (e) Which-won-where GGE biplot for specific adaptability of genotypes over environments. The genotypes closer to the ideal genotype are the most desirable.
Ash Content: AMMI 97.3%, GGE 93.1% and 6.8%; Finelawn (G5) was the most promising, followed by Fawn (G4) and T3fes (G3) (Figure S1).
Crude Fiber: AMMI 95.1%, GGE 82.3% and 17.4%; T2fes (G2) was the desirable genotype, while others were further from the ideal (Figure S2).
Neutral Detergent Fiber: AMMI 89.4%, GGE 94.5% and 5.2%; T3fes (G3), followed by Fawn (G4) and Finelawn (G5), was closest to the ideal (Figure S3).
Acid Detergent Fiber: AMMI 71.2%, GGE 84.8% and 11.8%; Fawn (G4) was the most promising genotype (Figure S4).
Acid Detergent Lignin: AMMI 91.1%, GGE 85.1% and 13.9%; T3fes (G3) and Fawn (G4) demonstrated stable performance, with T3fes (G3) closest to the ideal genotype (Figure S5).
The performance and stability of cocksfoot genotypes were evaluated across multiple environments using AMMI and GGE biplot analyses. The results for key forage quality traits are summarized below:
Crude Protein: AMMI analysis showed that the first PC explained 97.1% of the variance, while the GGE biplot PCs explained 90.1% and 9.9%, respectively. Both models indicated Cock1D (G2) as the most promising genotype, followed by Amba (G3), with Amba (G3) performing best in Trikala 2022–2023 (E1) and Trikala 2023–2024 (E2), and Cock1D (G2) in Larissa (E3) (Figure 7).
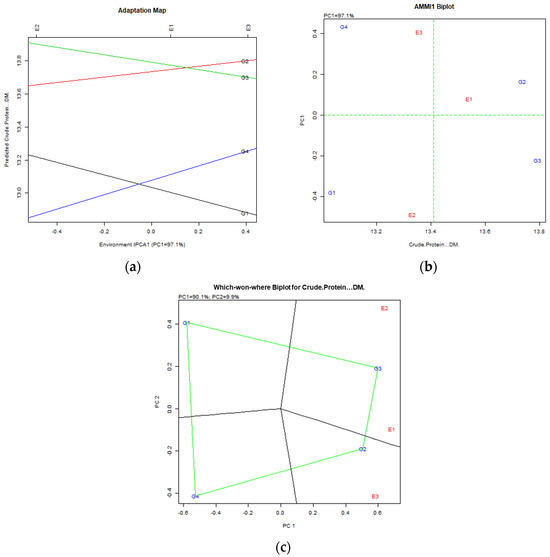
Figure 7.
Crude Protein content stability analysis for cocksfoot genotypes, based on (a) AMMI adaptation map; (b) AMMI1 biplot; (c) Which-won-where GGE biplot for specific adaptability of genotypes over environments. The genotypes closer to the ideal genotype are the most desirable.
Ash Content: AMMI explained 87.0% of variance (PC1), and GGE biplot explained 99.8% and 0.2% for PC1 and PC2, respectively. The most promising genotypes were Amba (G3) and Cock1D (G2), showing stable performance across Trikala 2022–2023 (E1), Trikala 2023–2024 (E2), and Larissa (E3) (Figure S6).
Crude Fiber: AMMI PC1 explained 88.0%, and GGE PCs 80.4% and 16.0%. Treposno (G4) was the desirable genotype with stable performance across all environments (Figure S7).
Neutral Detergent Fiber: AMMI 88.5%, GGE 96.2% and 3.2%; Amba (G3) and Cock1D (G2) were the most promising genotypes across all environments (Figure S8).
Acid Detergent Fiber: AMMI 99.9%, GGE 67.6% and 32.4%; Cock1D (G2) and Amba (G3) were identified as the most desirable genotypes, adapted to Trikala 2023–2024 (E2) and Larissa (E3) (Figure S9).
Acid Detergent Lignin: AMMI 98.9%, GGE 67.5% and 32.5%; Amba (G3) and Cock1D (G2) showed the most stable performance, with Amba (G3) adapted to Trikala 2022–2023 (E1) and Trikala 2023–2024 (E2) and Cock1D (G2) to Larissa (E3) (Figure S10).
4. Discussion
In this study, significant genotype × environment (G × E) interactions were observed for all forage quality traits in both cocksfoot and tall fescue, confirming that genotype performance is strongly influenced by environmental variability. These results are consistent with previous studies highlighting that G × E effects are key determinants of forage productivity and nutritive value under fluctuating Mediterranean conditions [47,48,49]. Robins et al. [50] also reported strong G × E interactions affecting trait expression across environments. Therefore, evaluating G × E interactions, stability indices, and the heritability of forage quality traits is crucial for improving breeding efficiency and ensuring consistent performance across environments. Importantly, the strong G × E interaction observed here can be directly attributed to the combined pedoclimatic differences among sites: Trikala (E1, E2) is cooler, wetter, and characterized by loamy soils (28% clay), whereas Larissa (E3) is warmer, drier, and dominated by clay soils (51% clay). This simultaneous climatic and soil differentiation maximizes environmental contrast and explains the magnitude of G × E detected.
The Stability Index proved to be a valuable tool for assessing genotype consistency across environments. High Stability Index values indicate reduced environmental sensitivity, while lower values reflect stronger G × E interaction effects. In our study, cocksfoot cultivar Cock2D exhibited the highest Stability Index values for DMI (66,522), DDM (62,072), and NDF (69,921), whereas Amba and Treposno showed the lowest stability across environments. Similarly, in tall fescue, T2fes demonstrated the highest stability for NDF (85,746) and DMI (75,662), while Finelawn consistently recorded the lowest values.
Although the AMMI and GGE biplot analyses identified Cock1D and Amba (cocksfoot) and T3fes and Fawn (tall fescue) as top-performing genotypes for specific traits in particular environments, the Stability Index provided a complementary perspective on overall multi-environment stability. By integrating these approaches, it is possible to identify genotypes that combine relatively high mean performance with stability across environments. Such high stability scores are consistent with earlier concepts of phenotypic stability and genotype–environment interaction analysis [51,52]. Graphical interpretation using GGE biplots further supports these findings, highlighting the genotypes that maintain more consistent performance under diverse environmental conditions [53]. Recent studies on forage and other crops also confirm the utility of these approaches: Caradus et al. [54] emphasized that selecting genotypes with high stability ensures predictable performance across agro-climatic zones, while Aleme et al. [49] and Dang et al. [55] demonstrated the effectiveness of AMMI and GGE models in identifying stable, high-performing genotypes.
In cocksfoot, highly significant genotype × environment (G × E) interactions were observed for all traits, confirming strong environmental sensitivity. High heritability values for ash (99.21%), NDF (96.98%), DMI (97.24%), and RFV (92.77%), together with the highest Stability Index values observed in Cock2D for NDF (69,921), DMI (66,522), and DDM (62,072), indicate that these traits are under strong genetic control and exhibit substantial phenotypic stability across environments. This confirms that genotypes less influenced by environmental fluctuations are more predictable across sites. Similar trends have been documented in perennial forage grasses [56,57]. Previous studies also support the general principle that traits with higher heritability exhibit lower sensitivity to environmental fluctuations [47,51,52], emphasizing the importance of considering heritability and multi-environment stability when selecting genotypes for consistent forage performance. Moreover, traits such as DMI and NDF are critical determinants of forage intake and fiber content, directly influencing animal performance and feed efficiency [33,58]. Therefore, the selection of cocksfoot genotypes combining high Stability Index values and heritability, such as Cock2D, not only ensures consistent forage quality under Mediterranean conditions but also provides reliable parental material for breeding programs aimed at improving digestibility and promoting sustainable livestock production [54].
In tall fescue, genotype × environment (G × E) effects were significant for all measured parameters. According to the Stability Index (SI), the T2fes genotype exhibited the highest stability for NDF (85,746) and DMI (75,662), while T3fes showed notable stability for DDM (57,483), confirming that these genotypes combine high mean performance with resilience across environments [55]. In contrast, Finelawn displayed lower stability across all traits (NDF = 21,023; DMI = 18,037; DDM = 23,429), reflecting higher environmental sensitivity. These SI results are fully consistent with AMMI and GGE biplot analyses, which also identified T2fes and T3fes as the most reliable genotypes across multiple environments. High heritability values for ash (94.80%), NDF (96.60%), DMI (93.51%), and ADL (90.48%) reinforce the strong genetic control of these traits, in agreement with Kebede et al. [59] and Neji [56]. Previous studies reported that tall fescue biomass generally contains significant amounts of crude protein, fiber fractions, and ash, consistent with findings from Flores et al. [60], Elizalde et al. [61], and Chang et al. [62]. These results demonstrate that integrating the Stability Index with AMMI and GGE biplots provides a robust and biologically meaningful assessment of genotype performance and stability under Mediterranean conditions.
Correlation analysis further supported the interpretation of trait relationships and their implications for selection. Strong positive correlations between CP and NDF were observed in both species, while negative correlations between NDF and DMI (r = −0.99 in cocksfoot; r = −0.93 in tall fescue) indicated that increasing fiber content limits intake potential—a key constraint in forage utilization. The unusually strong positive CP–NDF correlation suggests that the most vigorous, biomass-productive genotypes simultaneously accumulate more fiber and more nitrogen, leading to elevated CP despite increased structural material. However, the near-perfect negative NDF–DMI correlation demonstrates that higher fiber content critically reduces intake capacity. This trade-off suggests that the breeding should prioritize reducing NDF to improve DMI and RFV, even if this slightly compromises maximal CP values.
These results are consistent with previous reports [57,63] and highlight that indirect selection through stable, heritable traits (e.g., DMI and NDF) can enhance overall forage quality without compromising yield stability.
In both species, ADL exhibited positive loadings on both PC1 and PC2; however, its stronger influence on PC2—together with hemicellulose—indicates that this component primarily reflects structural complexity rather than differences in digestibility.
AMMI and GGE biplot analyses confirmed significant genotype × environment (G × E) interactions for all forage quality traits, highlighting that genotype performance varies across environments. In cocksfoot, Cock1D (G2) and Amba (G3) were identified as top-performing genotypes for specific traits in certain environments, while Treposno (G4) performed best in fiber content. In tall fescue, T3fes (G3) and Fawn (G4) were the most favorable in most traits. These results illustrate how AMMI and GGE can effectively discriminate among genotypes and identify those with superior adaptation to particular environmental conditions. Combined with Stability Index analysis, which measures overall multi-environment stability, these methods provide complementary insights for selecting genotypes with both high performance and stable traits.
The supplementary box plot analyses (Figures S11–S14) provided additional evidence supporting the superior performance of the breeding populations over commercial cultivars. The consistently higher crude protein and ash content observed in Cock1D, Cock2D, and the tall fescue experimental lines reflect an enhanced nitrogen uptake and mineral accumulation capacity, traits often associated with improved root vigor and nutrient-use efficiency under Mediterranean conditions. The significantly higher DDM and RFV values recorded across environments, particularly in environments E1 and E3, indicate that these populations combine high digestibility with balanced fiber composition, enhancing the potential intake and energy availability for livestock.
These findings suggest that the selection process effectively targeted physiological and biochemical traits contributing to improved forage quality stability. The performance gap between breeding lines and commercial cultivars further highlights the genetic gain achieved through recurrent selection. Similar results have been reported in other forage improvement studies, where increased CP and DDM were linked to superior adaptation and resilience under variable climatic regimes. Consequently, the present breeding materials demonstrate both quantitative and qualitative superiority, confirming their potential as elite parental sources for the development of resilient, high-quality Mediterranean forage cultivars.
Forage quality is determined by its nutritive value, digestibility, and intake potential, all of which are largely influenced by fiber composition (NDF, ADF) [33,58,64,65,66]. In this study, traits associated with fiber content (NDF, ADF) and digestibility (DDM, DMI) exhibited high heritability and stability, confirming strong genetic control and limited environmental interference. These findings are in line with earlier reports highlighting the importance of quality traits such as CP, NDF, ADF, and DMD in forage breeding, and the presence of genetic variation for these traits [47,48]. This supports the use of indirect selection through highly correlated, stable traits, as proposed by Greveniotis et al. [37,67,68,69,70,71,72,73], who suggested replacing important traits with more stable and highly heritable traits to improve selection programs. Comparing fescue to Trifolium species, Vîntu et al. [74] demonstrated that the lowest values of NDF and ADF were recorded in mixtures where Trifolium pratense L. species was present. They also showed that nutrient supply potential, digestibility, and nutrient levels depend on forage intake, which is influenced by NDF and ADF content.
The relationships among stability, heritability, and trait correlations reveal a robust genetic foundation for forage quality under Mediterranean conditions. Notably, the negative NDF–DMI correlation shows a trade-off between fiber content and intake. This supports the breeding objective of improving digestibility while keeping yield adequate [57,63]. High Stability Index values and strong heritability demonstrate that Cock2D (based on Stability Index) and T2fes (based on Stability Index and AMMI/GGE patterns) are elite and reliable for future breeding programs.
To further validate these findings, future studies should incorporate controlled stress environments that simulate the most challenging Mediterranean conditions—particularly severe drought and low nitrogen availability characteristic of the differentiating Larissa site (E3). Such stress-focused METs would help confirm whether the observed statistical stability corresponds to true physiological resilience.
In summary, the integration of Stability Index values, heritability estimates, trait correlations, and multivariate analyses (AMMI and GGE biplots) provided a coherent and biologically meaningful interpretation of genotype behavior. While AMMI and GGE analyses identified Cock1D and Amba (cocksfoot) as top-performing genotypes for specific traits in particular environments, Cock2D (cocksfoot) emerged as the genotype with the highest overall stability across environments, as indicated by the Stability Index. Similarly, T2fes (tall fescue) combined high mean performance with strong stability, as evidenced by both the Stability Index and AMMI/GGE analyses.
5. Conclusions
Both cocksfoot and tall fescue exhibited significant G × E interactions for all evaluated traits, yet elite breeding populations outperformed commercial cultivars in stability and adaptability. High heritability values (>90%) for key quality traits (ash, NDF, DMI, RFV) highlight their reliability as selection targets in breeding programs.
Cock2D (cocksfoot) demonstrated the highest overall stability across environments, as indicated by the Stability Index, while T2fes (tall fescue) combined high mean performance with strong stability, supported by both the Stability Index and AMMI/GGE analyses. These genotypes are therefore highly suitable for wider cultivation and as parental material for breeding.
The contrasting soil and climate conditions among environments—cooler, wetter loamy soils versus hotter, drier clay soils—validated the multi-environment trial design and explained the strong G×E effects. These findings emphasize that breeding for Mediterranean conditions requires simultaneous tolerance to climatic and edaphic variability.
These findings underline the importance of integrating stability and heritability analyses in forage breeding programs to ensure consistent forage quality across diverse Mediterranean environments. Future research should therefore implement controlled severe drought and low-nitrogen stress, directly addressing this limitation and reflecting the environmental patterns identified here. Such targeted experiments are essential to determine whether the strong performance and stability of Cock2D and T2fes result from true physiological resilience or simply favorable plasticity under specific field conditions. By closing this knowledge gap, future studies will accelerate the development of cultivars adapted to the increasing climatic unpredictability of Mediterranean agro-ecosystems.
In practical terms, the identified genotypes can serve as parental material for breeding and as foundation populations for national forage improvement programs, ensuring sustainable livestock feeding systems and reinforcing the resilience of Mediterranean agro-ecosystems.
Supplementary Materials
The following supporting information can be downloaded at: https://www.mdpi.com/article/10.3390/agriculture15242595/s1, Figure S1: Ash Content stability analysis for Tall Fescue genotypes, based on (a) AMMI adaptation map; (b) AMMI1 biplot; (c) Environmental stability GGE biplot; (d) Genotypic stability GGE biplot; (e) Which-won-where GGE biplot for specific adaptability of genotypes over environments. The genotypes closer to the ideal genotype are the most desirable; Figure S2: Crude Fiber Content stability analysis for Tall Fescue genotypes, based on (a) AMMI adaptation map; (b) AMMI1 biplot; (c) Environmental stability GGE biplot; (d) Genotypic stability GGE biplot; (e) Which-won-where GGE biplot for specific adaptability of genotypes over environments. The genotypes closer to the ideal genotype are the most desirable; Figure S3: Neutral Detergent Fiber stability analysis for Tall Fescue genotypes, based on (a) AMMI adaptation map; (b) AMMI1 biplot; (c) Environmental stability GGE biplot; (d) Genotypic stability GGE biplot; (e) Which-won-where GGE biplot for specific adaptability of genotypes over environments. The genotypes closer to the ideal genotype are the most desirable; Figure S4: Acid Detergent Fiber stability analysis for Tall Fescue genotypes, based on (a) AMMI adaptation map; (b) AMMI1 biplot; (c) Environmental stability GGE biplot; (d) Genotypic stability GGE biplot; (e) Which-won-where GGE biplot for specific adaptability of genotypes over environments. The genotypes closer to the ideal genotype are the most desirable; Figure S5: Acid-Detergent Lignin stability analysis for Tall Fescue genotypes, based on (a) AMMI adaptation map; (b) AMMI1 biplot; (c) Environmental stability GGE biplot; (d) Genotypic stability GGE biplot; (e) Which-won-where GGE biplot for specific adaptability of genotypes over environments. The genotypes closer to the ideal genotype are the most desirable; Figure S6: Ash Content stability analysis for Cocksfoot genotypes, based on (a) AMMI adaptation map; (b) AMMI1 biplot; (c) Which-won-where GGE biplot for specific adaptability of genotypes over environments. The genotypes closer to the ideal genotype are the most desirable; Figure S7: Crude Fiber Content stability analysis for Cocksfoot genotypes, based on (a) AMMI adaptation map; (b) AMMI1 biplot; (c) Which-won-where GGE biplot for specific adaptability of genotypes over environments. The genotypes closer to the ideal genotype are the most desirable; Figure S8: Neutral Detergent Fiber stability analysis for Cocksfoot genotypes, based on (a) AMMI adaptation map; (b) AMMI1 biplot; (c) Which-won-where GGE biplot for specific adaptability of genotypes over environments. The genotypes closer to the ideal genotype are the most desirable; Figure S9: Acid Detergent Fiber) stability analysis for Cocksfoot genotypes, based on (a) AMMI adaptation map; (b) AMMI1 biplot; (c) Which-won-where GGE biplot for specific adaptability of genotypes over environments. The genotypes closer to the ideal genotype are the most desirable; Figure S10: Acid-Detergent Lignin stability analysis for Cocksfoot genotypes, based on (a) AMMI adaptation map; (b) AMMI1 biplot; (c) Which-won-where GGE biplot for specific adaptability of genotypes over environments. The genotypes closer to the ideal genotype are the most desirable; Figure S11: Box plots of crude protein content (%) and ash content (%) for four cocksfoot (Dactylis glomerata L.) genotypes. Within the same parameter, boxplots sharing the same letter are not significantly different (p < 0.05) according to Tukey’s HSD test. Boxes represent the interquartile range (IQR), horizontal lines indicate medians, whiskers show minimum and maximum values, and dots represent outliers; Figure S12: Box plots of RFV, DMI (%), and DDM (%) for four cocksfoot (Dactylis glomerata L.) genotypes. Within the same parameter, boxplots sharing the same letter are not significantly different (p < 0.05) according to Tukey’s HSD test. Boxes represent the interquartile range (IQR), horizontal lines indicate medians, whiskers show minimum and maximum values, and dots represent outliers; Figure S13: Box plots of crude protein content (%) and ash content (%) for five tall fescue (Festuca arundinacea Schreb.) genotypes. Within the same parameter, boxplots sharing the same letter are not significantly different (p < 0.05) ac-cording to Tukey’s HSD test. Boxes represent the interquartile range (IQR), horizontal lines indicate medians, whiskers show minimum and maximum values, and dots represent outliers; Figure S14: Box plots of RFV, DMI (%), and DDM (%) for five tall fescue (Festuca arundinacea Schreb.) genotypes. Within the same parameter, boxplots sharing the same letter are not significantly different (p < 0.05) according to Tukey’s HSD test. Boxes represent the interquartile range (IQR), horizontal lines indicate medians, whiskers show minimum and maximum values, and dots represent outliers.
Author Contributions
Conceptualization, V.G. methodology, V.G.; investigation, V.G., C.G.I., D.K. and E.B.; statistical analysis, A.S., A.K. and V.G., writing—original draft preparation, V.G., E.B., A.K. and C.G.I.; writing—review and editing, A.S., V.G., D.K., C.G.I. and E.B.; visualization, A.S., A.K. and V.G.; supervision, V.G.; project administration, V.G. All authors have read and agreed to the published version of the manuscript.
Funding
This research received no external funding.
Institutional Review Board Statement
Not applicable.
Data Availability Statement
The datasets utilized in this study’s analysis are available upon reasonable request.
Conflicts of Interest
The authors declare no conflicts of interest.
References
- Taube, F.; Gierus, M.; Hermann, A.; Loges, R.; Schönbach, P. Grassland and globalization—Challenges for north-west Europe grass and forage research. Grass Forage Sci. 2014, 69, 2–16. [Google Scholar] [CrossRef]
- Satognon, F. Advancements in tall fescue (Festuca arundinacea) in the US: Origin, American introduction, development, and improvement. J. Crop Improv. 2024, 38, 665–687. [Google Scholar] [CrossRef]
- Sharma, P.; Singh, A.; Kahlon, C.S.; Brar, A.S.; Grover, K.K.; Dia, M.; Steiner, R.L. The Role of Cover Crops towards Sustainable Soil Health and Agriculture—A Review Paper. Am. J. Plant Sci. 2018, 9, 1935–1951. [Google Scholar] [CrossRef]
- Last, L.; Lüscher, G.; Widmer, F.; Boller, B.; Kölliker, R. Indicators for Genetic and Phenotypic Diversity of Dactylis glomerata in Swiss Permanent Grassland. Ecol. Indic. 2014, 38, 181–191. [Google Scholar] [CrossRef]
- Yan, D.; Zhao, X.; Cheng, Y.; Ma, X.; Huang, L.; Zhang, X. Phylogenetic and Diversity Analysis of Dactylis glomerata Subspecies Using SSR and IT-ISJ Markers. Molecules 2016, 21, 1459. [Google Scholar] [CrossRef] [PubMed]
- Madesis, P.; Abraham, E.M.; Kalivas, A.; Ganopoulos, I.; Tsaftaris, A. Genetic diversity and structure of natural Dactylis glomerata L. populations revealed by morphological and microsatellite–based (SSR/ISSR) markers. Genet. Mol. Res. 2014, 13, 4226–4240. [Google Scholar] [CrossRef] [PubMed]
- Jiang, L.F.; Zhang, X.Q.; Ma, X.; Huang, L.K.; Xie, W.G.; Ma, Y.M.; Zhao, Y.F. Identification of orchard grass (Dactylis glomerata L.) cultivars by using simple sequence repeat markers. Genet. Mol. Res. 2013, 12, 5111–5123. [Google Scholar] [CrossRef] [PubMed]
- Bakhtiari, M.A.; Saeidnia, F.; Majidi, M.M.; Mirlohi, A. Growth traits associated with drought survival, recovery and persistence of cocksfoot (Dactylis glomerata) under prolonged drought treatments. Crop Pasture Sci. 2019, 70, 85–94. [Google Scholar] [CrossRef]
- Hodkinson, T.R.; Perdereau, A.; Klaas, M.; Cormican, P.; Barth, S. Genotyping by Sequencing and Plastome Analysis Finds High Genetic Variability and Geographical Structure in Dactylis glomerata L. in Northwest Europe Despite Lack of Ploidy Variation. Agronomy 2019, 9, 342. [Google Scholar] [CrossRef]
- Abtahi, M.; Majidi, M.M.; Hoseini, B.; Mirlohi, A.; Araghi, B.; Hughes, N. Genetic variation in an orchardgrass population promises successful direct or indirect selection of superior drought tolerant genotypes. Plant Breed. 2018, 137, 928–935. [Google Scholar] [CrossRef]
- Bougrine, H.; Mebarkia, A.; Bechkri, S. Genetic diversity associated with ecogeographical parameters, morphological characteristics and soil analyzes of common vetch (Vicia sativa L.) in Algeria. Agric. Sci. Dig. 2022, 42, 317–321. [Google Scholar]
- Azar, S.S.; Nouraein, M.; Reza, M. Evaluation of variation in Dactylis glomerata L. populations in terms of yield and related traits under climatic conditions of Tabriz. Iran. J. Rangel. For. Plant Breed. Genet. Res. 2021, 29, 297–316. [Google Scholar]
- Haliloğlu, K.; Türkoğlu, A.; Öztürk, A.; Niedbała, G.; Niazian, M.; Wojciechowski, T.; Piekutowska, M. Genetic Diversity and Population Structure in Bread Wheat Germplasm from Türkiye Using iPBS-Retrotransposons-Based Markers. Agronomy 2023, 13, 255. [Google Scholar] [CrossRef]
- Altaf, M.T.; Cavagnaro, P.F.; Kökten, K.; Ali, A.; Morales, A.; Tatar, M.; Baloch, F.S. Genotyping-by-sequencing derived SNP markers reveal genetic diversity and population structure of Dactylis glomerata germplasm. Front. Plant Sci. 2025, 16, 1530585. [Google Scholar] [CrossRef]
- Gudi, S.; Kumar, P.; Singh, S.; Tanin, M.J.; Sharma, A. Strategies for accelerating genetic gains in crop plants: Special focus on speed breeding. Physiol. Mol. Biol. Plants 2022, 28, 1921–1938. [Google Scholar] [CrossRef]
- Anilkumar, C.; Sunitha, N.C.; Harikrishna; Devate, N.B.; Ramesh, S. Advances in Integrated Genomic Selection for Rapid Genetic Gain in Crop Improvement: A Review. Planta 2022, 256, 87. [Google Scholar] [CrossRef]
- Kakihara, H.; Ogura, S. Effect of soil acidification on regrowth of orchardgrass (Dactylis glomerata) under application of grazing cattle dung, cattle manure compost, and chemical fertilizer. Grassl. Sci. 2022, 68, 255–262. [Google Scholar] [CrossRef]
- Kanapeckas, J.; Lemežienė, N.; Butkutė, B.; Stukonis, V. Evaluation of tall fescue (Festuca arundinacea Schreb.) varieties and wild ecotypes as feedstock for biogas production. Zemdirb. Agric. 2011, 98, 149–156. [Google Scholar]
- Sato, H. Development and Future Application of Transgenic Tall Fescue (Festuca arundinacea Schreb.) with Improved Important Forage and Turf Traits. Jpn. Agric. Res. Q. 2022, 56, 1–6. [Google Scholar] [CrossRef]
- Ahmed, L.Q.; Escobar-Gutiérrez, A.J. Tall Fescue (Festuca arundinacea Schreb.) Shows Intraspecific Variability in Response to Temperature during Germination. Agronomy 2022, 12, 1245. [Google Scholar] [CrossRef]
- Fike, J.H.; Parrish, D.J.; Wolf, D.D.; Balasko, J.A.; Green, J.T., Jr.; Rasnake, M.; Reynolds, J.H. Switchgrass production for the upper southeastern USA: Influence of cultivar and cutting frequency on biomass yields. Biomass Bioenergy 2006, 30, 207–213. [Google Scholar] [CrossRef]
- Easton, H.S.; Lee, C.K.; Fitzgerald, R.D. Tall fescue in Australia and New Zealand. N. Z. J. Agric. Res. 1994, 37, 405–417. [Google Scholar] [CrossRef]
- Kearsey, M.J.; Pooni, H.S. The Genetical Analysis of Quantitative Traits; Stanley Thornes Publishers Ltd.: Kingston upon Thames, UK, 1998. [Google Scholar]
- Falconer, D.; Mackay, T. Introduction to Quantitative Genetics, 4th ed.; Prentice Hall: Harlow, UK, 1996. [Google Scholar]
- Zobel, R.W.; Wright, M.J.; Gauch, H.G., Jr. Statistical Analysis of a Yield Trial. Agron. J. 1988, 80, 388–393. [Google Scholar] [CrossRef]
- Gauch, H.G.; Piepho, H.P.; Annicchiarico, P. Statistical analysis of yield trials by AMMI and GGE: Further considerations. Crop Sci. 2008, 48, 866–889. [Google Scholar] [CrossRef]
- Yan, W.; Hunt, L.A.; Sheng, Q.; Szlavnics, Z. Cultivar Evaluation and Mega-Environment Investigation Based on the GGE Biplot. Crop Sci. 2000, 40, 597–605. [Google Scholar] [CrossRef]
- Yan, W.; Rajcan, I. Biplot Analysis of Test Sites and Trait Relations of Soybean in Ontario. Crop Sci. 2002, 42, 11–20. [Google Scholar] [CrossRef]
- Ebdon, J.; Gauch, H., Jr. Additive main effect and multiplicative interaction analysis of national turfgrass performance trials: I. Interpretation of genotype× environment interaction. Crop Sci. 2002, 42, 489–496. [Google Scholar] [CrossRef]
- Steel, R.G.D.; Torrie, H.; Dickey, D.A. Principles and Procedures of Statistics. A Biometrical Approach, 3rd ed.; McGraw-Hill: New York, NY, USA, 1997; p. 666. [Google Scholar]
- Association of Official Analytical Chemists (AOAC). Official Methods of Analysis of the Association of Official Analytical Chemists, 21st ed.; Oxford University Press: Washington, DC, USA, 2019. [Google Scholar]
- Association of Official Analytical Chemists (AOAC). Official Methods of Analysis, 18th ed.; Association of Official Analytical Chemists (AOAC): Gaithersburg, MD, USA, 2005. [Google Scholar]
- Van Soest, P.J.; Robertson, J.B.; Lewis, B.A. Methods for Dietary Fiber, Neutral Detergent Fiber, and Nonstarch Polysaccharides in Relation to Animal Nutrition. J. Dairy Sci. 1991, 7, 3583–3597. [Google Scholar] [CrossRef]
- Hindrichsen, I.K.; Kreuzer, M.; Madsen, J.; Bach Knudsen, K.E. Fiber and lignin analysis in concentrate, forage, and feces: Detergent versus enzymatic-chemical method. J. Dairy Sci. 2006, 89, 2168–2176. [Google Scholar] [CrossRef] [PubMed]
- Linn, J.G.; Martin, N.P. Forage Quality Tests and Interpretation; MN AG-FO-02637; University of Minnesota Extension Service: St. Paul, MN, USA, 1989. [Google Scholar]
- Fasoula, V.A. Prognostic breeding: A new paradigm for crop improvement. Plant Breed. Rev. 2013, 37, 297–347. [Google Scholar]
- Greveniotis, V.; Bouloumpasi, E.; Skendi, A.; Korkovelos, A.; Kantas, D.; Ipsilandis, C.G. Evaluation and Stability of Red and White Trifolium Species for Nutritional Quality in a Mediterranean Environment. Agriculture 2025, 15, 391. [Google Scholar] [CrossRef]
- McIntosh, M.S. Analysis of Combined Experiments. Agron. J. 1983, 75, 153–155. [Google Scholar] [CrossRef]
- Johnson, H.W.; Robinson, H.E.; Comstock, R.E. Estimate of genetic and environmental variability in soybean. Agron. J. 1955, 47, 314–318. [Google Scholar] [CrossRef]
- Hanson, G.; Robinson, H.F.; Comstock, R.E. Biometrical studies on yield in segregating population of Korean Lespedeza. Agron. J. 1956, 48, 268–274. [Google Scholar] [CrossRef]
- Singh, R.K.; Chaudhary, B.D. Biometrical Methods in Quantitative Genetic Analysis; Kalyani Publishers: New Delhi, India, 1977; p. 304. [Google Scholar]
- Khan, M.M.H.; Rafii, M.Y.; Ramlee, S.I.; Jusoh, M.; Al Mamun, M. AMMI and GGE biplot analysis for yield performance and stability assessment of selected Bambara groundnut (Vigna subterranea L. Verdc.) genotypes under the multi-environmental trials (METs). Sci. Rep. 2021, 11, 22791. [Google Scholar] [CrossRef] [PubMed]
- Gauch, H., Jr. Statistical Analysis of Regional Yield Trials: AMMI Analysis of Factorial Designs; Elsevier Science Publishers: Amsterdam, The Netherlands, 1992. [Google Scholar]
- Koundinya, A.V.V.; Ajeesh, B.R.; Hegde, V.; Sheela, M.N.; Mohan, C.; Asha, K.I. Genetic parameters, stability and selection of cassava genotypes between rainy and water stress conditions using AMMI, WAAS, BLUP and MTSI. Sci. Hortic. 2021, 281, 109949. [Google Scholar] [CrossRef]
- Haile, G.A.; Kebede, G.Y. Identification of Stable Faba Bean (Vicia faba L.) Genotypes for Seed Yield in Ethiopia Using GGE Model. J. Plant Sci. 2021, 9, 163–169. [Google Scholar]
- Gabriel, K.R. The biplot graphic display of matrices with application to principal component analysis. Biometrika 1971, 58, 453–467. [Google Scholar] [CrossRef]
- Annicchiarico, P.; Romani, M. Genetic Variation, Heritability and Genetic Correlations for Forage Quality and Yield Traits of Mediterranean Tall Fescue Germplasm. Plant Breed. 2008, 124, 99–101. [Google Scholar] [CrossRef]
- Wilkins, P.W.; Humphreys, M.O. Progress in breeding perennial forage grasses for temperate agriculture. J. Agric. Sci. 2003, 140, 129–150. [Google Scholar] [CrossRef]
- Aleme, M.; Tamiru, M.; Alkhtib, A.; Assefa, G.; Kehaliew, A.; Tolemariam, T.; Mengistu, G.; Burton, E.; Janssens, G.P.J. Effects of genotype and environment on forage yield, nutritive value and morphology of lablab (Lablab purpureus (L.) Sweet). Heliyon 2023, 9, e19671. [Google Scholar] [CrossRef]
- Robins, J.G.; Bushman, B.S.; Jensen, K.B.; Escribano, S.; Blaser, B. Genetic variation for dry matter yield, forage quality, and seed traits among the half-sib progeny of nine orchardgrass germplasm populations. Crop Sci. 2015, 55, 275–283. [Google Scholar] [CrossRef]
- Becker, H.; Leon, J. Stability analysis in plant breeding. Plant Breed. 1988, 101, 1–23. [Google Scholar] [CrossRef]
- Lin, C.S.; Binns, M.R. A superiority measure of cultivar performance for cultivar × location data. Can. J. Plant Sci. 1988, 68, 193–198. [Google Scholar] [CrossRef]
- Yan, W.; Kang, M.S. Gge Biplot Analysis: A Graphical Tool for Breeders, Geneticists, and Agronomists; CRC Press: Boca Raton, FL, USA, 2003. [Google Scholar]
- Caradus, J.R.; Chapman, D.F. Evaluating Pasture Forage Plant Breeding Achievements: A Review. N. Z. J. Agric. Res. 2025, 68, 1146–1220. [Google Scholar] [CrossRef]
- Dang, X.; Hu, X.; Ma, Y.; Li, Y.; Kan, W.; Dong, X. AMMI and GGE biplot analysis for genotype × environment interactions affecting the yield and quality characteristics of sugar beet. PeerJ 2024, 12, e16882. [Google Scholar] [CrossRef]
- Neji, M.; Tlahig, S.; Hessini, K.; Taamalli, W.; Abdelly, C.; Kouas, S. Variation of forage quality traits in Tunisian populations of Brachypodium hybridum in response to phosphorus deficiency. Crop Sci. 2021, 61, 4038–4054. [Google Scholar] [CrossRef]
- Silva Neto, A.B.; Ribeiro, A.P.; Volpato, A.; Machado, J.; Nazato, L.M.; Santos, D.P.; Nussio, L.G. Propionic acid-based additive with surfactant action on the feeding value of rehydrated corn grain silage for dairy cows performance. Livest. Sci. 2023, 275, 105292. [Google Scholar] [CrossRef]
- Ball, D.; Collins, M.; Lacefield, G.; Martin, N.; Mertens, D.; Olson, K.; Putnam, D.; Undersander, D.; Wolf, M. Understanding Forage Quality; Publication 1-01; American Farm Bureau Federation: Park Ridge, IL, USA, 2001; Available online: https://fyi.extension.wisc.edu/forage/files/2017/04/FQ.pdf (accessed on 31 October 2025).
- Kebede, G.; Worku, W.; Feyissa, F.; Jifar, H. Genotype by Environment Interaction for Agro-Morphological Traits and Herbage Nutritive Values and Fodder Yield Stability in Oat (Avena sativa L.) Using AMMI Analysis in Ethiopia. J. Agric. Food Res. 2023, 14, 100862. [Google Scholar] [CrossRef]
- Flores, R.; Coblentz, W.K.; Ogden, R.K.; Coffey, K.P.; Looper, M.L.; West, C.P.; Rosenkrans, C.F., Jr. Effects of fescue type and sampling date on the ruminal disappearance kinetics of autumn-stockpiled tall fescue. J. Dairy Sci. 2007, 90, 2883–2896. [Google Scholar] [CrossRef]
- Elizalde, J.C.; Merchen, N.R.; Faulkner, D.B. Fractionation of Fiber and Crude Protein in Fresh Forages during the Spring Growth. J. Anim. Sci. 1999, 77, 476–484. [Google Scholar] [CrossRef]
- Chang, S.; Xie, K.; Du, W.; Jia, Q.; Yan, T.; Yang, H.; Hou, F. Effects of Mowing Times on Nutrient Composition and In Vitro Digestibility of Forage in Three Sown Pastures of China Loess Plateau. Animals 2022, 12, 2807. [Google Scholar] [CrossRef]
- Reiné, R.; Ascaso, J.; Barrantes, O. Nutritional quality of plant species in pyrenean hay Meadows of high diversity. Agronomy 2020, 10, 883. [Google Scholar] [CrossRef]
- Cherney, H.G.; Smith, S.R.; Sheaffer, C.C.; Cherney, J.R.D. Nutritive value and yield of reduced-lignin alfalfa cultivars in monoculture and in binary mixtures with perennial grass. Agron. J. 2020, 112, 352–367. [Google Scholar] [CrossRef]
- Sanderson, M.A.; Soder, K.J.; Brzezinski, N.; Taube, F.; Klement, K.; Muller, L.D.; Wachendorf, M. Sward structure of simple and complex mixtures of temperate forages. Agron. J. 2006, 98, 238244. [Google Scholar] [CrossRef]
- Komainda, M.; Isselstein, J. Effects of functional traits of perennial ryegrass cultivars on forage quality in mixtures and pure stands. J. Agric. Sci. 2020, 158, 173–184. [Google Scholar] [CrossRef]
- Greveniotis, V.; Sioki, E.; Ipsilandis, C.G. Estimations of fiber trait stability and type of inheritance in cotton. Czech J. Genet. Plant Breed. 2018, 54, 190–192. [Google Scholar] [CrossRef]
- Greveniotis, V.; Bouloumpasi, E.; Zotis, S.; Korkovelos, A.; Ipsilandis, C.G. Estimations on Trait Stability of Maize Genotypes. Agriculture 2021, 11, 952. [Google Scholar] [CrossRef]
- Greveniotis, V.; Bouloumpasi, E.; Zotis, S.; Korkovelos, A.; Ipsilandis, C.G. Stability, the Last Frontier: Forage Yield Dynamics of Peas under Two Cultivation Systems. Plants 2022, 11, 892. [Google Scholar] [CrossRef]
- Greveniotis, V.; Bouloumpasi, E.; Zotis, S.; Korkovelos, A.; Kantas, D.; Ipsilandis, C.G. A Comparative Study on Stability of Seed Characteristics in Vetch and Pea Cultivations. Agriculture 2023, 13, 1092. [Google Scholar] [CrossRef]
- Greveniotis, V.; Bouloumpasi, E.; Zotis, S.; Korkovelos, A.; Kantas, D.; Ipsilandis, C.G. Stability Dynamics of Main Qualitative Traits in Maize Cultivations across Diverse Environments regarding Soil Characteristics and Climate. Agriculture 2023, 13, 1033. [Google Scholar] [CrossRef]
- Greveniotis, V.; Bouloumpasi, E.; Skendi, A.; Korkovelos, A.; Kantas, D.; Zotis, S.; Ipsilandis, C.G. Modeling Stability of Alfalfa Yield and Main Quality Traits. Agriculture 2024, 14, 542. [Google Scholar] [CrossRef]
- Greveniotis, V.; Bouloumpasi, E.; Skendi, A.; Ipsilandis, C.G. Fiber Quality and Stability of Partially Interspecific Cotton Lines Under Irrigation and Nitrogen Environments. Appl. Sci. 2025, 15, 9684. [Google Scholar] [CrossRef]
- Vîntu, V.; Zaiț Grapan, T.; Samuil, C.; Nazare, A.-I. The Influence of Competition Between Festuca arundinacea Schreb. and Trifolium pratense L., Grown in Simple Mixtures, on the Quality of the Fodder. Agronomy 2024, 14, 2934. [Google Scholar] [CrossRef]
Disclaimer/Publisher’s Note: The statements, opinions and data contained in all publications are solely those of the individual author(s) and contributor(s) and not of MDPI and/or the editor(s). MDPI and/or the editor(s) disclaim responsibility for any injury to people or property resulting from any ideas, methods, instructions or products referred to in the content. |
© 2025 by the authors. Licensee MDPI, Basel, Switzerland. This article is an open access article distributed under the terms and conditions of the Creative Commons Attribution (CC BY) license (https://creativecommons.org/licenses/by/4.0/).