Abstract
This study aimed to investigate the temporal dynamics of physiological and gut microbial responses in Mule ducks (M-D) during force-feeding (F-F), with the goal of identifying potential regulatory targets to reduce feeding stress. Male M-Ds were subjected to either F-F or ad libitum feeding. We conducted longitudinal analysis at 72, 78, and 84 days of age to assess growth performance, serum biochemical profiles, and intestinal inflammatory markers, while assessing gut microbiota composition through 16S rDNA sequencing. The F-F group exhibited superior growth performance. Initial physiological responses at day 72 included significantly reduced serum corticotropin-releasing hormone (CRH) and jejunal tumor necrosis factor-alpha (TNF−α). Conversely, F-F induced a persistent and profound alteration in the gut microbiome by day 84, characterized by reduced alpha diversity and a significant enrichment of the genus Limosilactobacillus. Correlation analysis identified Limosilactobacillus as a keystone taxon, strongly associated with intestinal metabolites. Our findings demonstrate that M-Ds undergo time-dependent metabolic and immunological adaptations in response to F-F stress, which correlates with distinct alterations in gut microbiota composition, particularly the enrichment of Limosilactobacillus. These findings provide a theoretical basis for developing microbiota-targeted strategies to alleviate F-F stress in foie gras production.
1. Introduction
Foie gras production involves the controversial practice of force-feeding (F-F) ducks and geese to promote liver enlargement [,,], with Mule ducks (M-D) being the predominant breed in the industry owing to their superior hepatic hypertrophy capacity. However, this F-F stress raises substantial animal welfare concerns as it often leads to adverse health consequences in the animals [,,,]. Current efforts to improve animal welfare through dietary modifications face challenges, primarily due to the limited understanding of M-Ds’ physiological tolerance thresholds under F-F conditions. This knowledge gap substantially impedes the development of evidence-based welfare optimization strategies in foie gras production.
F-F induces metabolic and physiological stress in waterfowl. Studies on Pekin ducks and Landes geese demonstrate that this practice leads to hepatic lipid accumulation accompanied by oxidative damage, inflammation, and elevated serum levels of alanine aminotransferase (ALT) and aspartate aminotransferase (AST) [,,]. Furthermore, as the gut serves as a vital immune organ, it exhibits immediate responses to stress []. Research on these waterfowl species has revealed that F-F stress induces jejunal pathology characterized by villus atrophy, crypt hyperplasia, and dysregulation of digestive enzymes []. These intestinal lesions collectively impair nutrient absorption and are accompanied by concurrent gut microbiota dysbiosis [,,,], while systemic manifestations include corticosterone imbalance and abnormal levels of high-density lipoprotein (HDL) and low-density lipoprotein (LDL) [,,,]. Notably, overfeeding studies in M-Ds demonstrate that high-starch diets increase the abundance of Lactobacillus and its phylogenetically related genus Limosilactobacillus in ileal/cecal microbiota. This microbial shift is associated with enhanced mucosal barrier integrity and reduced pro-inflammatory markers [,,]. However, it remains unclear whether M-Ds experience excessive physiological stress during F-F, and how this process may influence serum and intestinal biomarkers, and their potential interplay with gut microbiota dynamics [].
Given the limited understanding of M-Ds’ physiological tolerance thresholds under F-F conditions and the knowledge gap that impedes evidence-based welfare optimization strategies, this study aimed to investigate the temporal dynamics of physiological responses, intestinal health parameters, and gut microbiota alterations in M-Ds during F-F, with particular focus on identifying potential adaptive mechanisms that may inform welfare improvement strategies. Therefore, we hypothesize that F-F stress affects serum hormones, intestinal morphology, and stress-related biomarkers in M-Ds, but their tolerance threshold to F-F stress is relatively high, which may be associated with adaptive changes in the gut microbiota. In this study, 65-day-old M-Ds were selected for F-F to assess the impact of feeding stress on serum markers of oxidation, inflammation, and liver damage, as well as the integrity of intestinal morphology and barrier function and the composition of gut microbiota and their metabolic products. These findings provide a theoretical foundation for nutritional modulation targets to alleviate the adverse effects of F-F in foie gras production.
2. Materials and Methods
2.1. Experiment Design and Sample Collection
A total of 36 healthy male M-Ds, aged 65 ± 2 days (mean ± SD), were selected. The study employed a two-factor design to evaluate the physiological changes in M-Ds during the F-F period, comparing two dietary treatment groups at three different time points. The specific details are as follows: ad libitum feeding (CON) versus progressive F-F. Blood and intestinal tissue samples were collected at three developmental stages (72, 78, and 84 days of age) to assess physiological parameters and evaluate both temporal dynamics and dietary effects.
Ducks in the ad libitum feeding group had unrestricted access to feed throughout the experimental period. The F-F protocol began at 500 g/day on Day 1 and was increased by 20 g per session each day until reaching 1 kg/day. A pneumatic F-F machine was used for the F-F group. All ducks were housed in individual cages measuring 20 cm × 45 cm; six replicates were used per treatment, each containing one M-D. The room was kept well ventilated and maintained at 22 ± 2 °C (mean ± SD). Manure on the floor was cleaned and rinsed away daily to ensure proper environmental hygiene. The incremental feeding schedule for the F-F group is shown in Supplementary Table S1. The dietary nutrient concentrations were designed to comply with or surpass the nutritional guidelines established by the National Research Council (1994) (Table 1).

Table 1.
Composition and nutrient levels of basal diets for M-Ds 1.
On days 72, 78, and 84 of age, the M-Ds were individually weighed following a 12 h fast at the end of the feeding cycle. To minimize the potential influence of circadian rhythms on the results, blood samples (10 mL) were collected at 09:00 h. Following the procedure described in reference [], blood was collected from the right brachial (wing) vein; serum was separated and stored at −20 °C.
According to the procedure described previously in [], the M-Ds were euthanized by severing the neck vessels after blood collection and subsequently dissected. Fresh intestinal tissue samples were collected, including approximately 1 cm segments of jejunum and cecum that were fixed in 20 mL of 4% paraformaldehyde. Concurrently, both luminal contents and tissue samples from jejunum and cecum were separately collected, immediately flash-frozen in liquid nitrogen, and stored at −80 °C for subsequent analysis.
2.2. Histopathological Analyses
Intestinal morphology was examined through histological analysis using Hematoxylin and Eosin (H&E) staining, following the protocol described in our previous work []. In brief, tissue samples from the jejunum and cecum were preserved in 4% neutral buffered paraformaldehyde for 24 h. These samples were subsequently processed by dehydration, embedded in paraffin wax, and sliced into sections of 4 μm thickness. The sections were stained with H&E (Servicebio, Wuhan, China) according to standard histological techniques. Additionally, measurements of villus height and crypt depth in the jejunum were obtained using Image-Pro Plus 6.0 software (Media Cybernetics, Bethesda, MD, USA).
2.3. Serum Hormone and Biomarker Quantification
Serum hormones and intestinal stress markers in M-Ds were quantified using a one-step double-antibody sandwich ELISA according to the manufacturer’s protocol (Shanghai Enzyme-linked Biotechnology Co., Ltd., Shanghai, China): Corticosterone (cat. no. ml037352), corticotropin-releasing hormone (CRH, cat. no. ml037489), adrenocorticotropic hormone (ACTH, cat. no. ml064226), trypsin (cat. no. ml064310), amylase (AMS, cat. no. ml064308), lipase (cat. no. ml064323), superoxide dismutase (SOD, cat. no. ml063948), malondialdehyde (MDA, cat. no. ml064218), glutathione peroxidase (GSH−Px, cat. no. ml037685), catalase (CAT, cat. no. ml064325), alanine aminotransferase (ALT, cat. no. ml061167), aspartate aminotransferase (AST, cat. no. ml036895), glucose (GLU, cat. no. ml037598), alkaline phosphatase (ALP, cat. no. ml064320), interleukin−1β (IL−1β, cat. no. ml061217), tumor necrosis factor−alpha (TNF−α, cat. no. ml036890), interleukin−22 (IL−22, cat. no. ml064352), interleukin−17 (IL−17, cat. no. ml064350), interleukin−6 (IL−6, cat. no. ml061135), interleukin−4 (IL−4, cat. no. ml061194), and transforming growth factor−beta 1 (TGF−β1, cat. no. ml061273).
The detection ranges were corticosterone (1–25 ng/mL), CRH and ACTH (2.5–80 pg/mL), trypsin (1–400 U/mL), AMS (1–400 IU/L), lipase (1–800 U/L), SOD (1–320 U/mL), MDA (0.1–8 nmol/mL), GSH−Px (1–480 U/mL), CAT (1–80 U/mL), ALT (1–64 U/L), AST (1–320 U/L), GLU (1–48 mg/L), ALP (0.1–8 IU/L), IL−1β (1–160 pg/mL), TNF−α (1–80 pg/mL), IL−22 and IL−6 (0.1–32 pg/mL), IL−17 (1–48 pg/mL), IL−1β, IL−4, and TGF−β1 (1–160 pg/mL). The minimum detectable concentrations for these kits ranged from <10 pg/mL to 10 μIU/mL. The intra-assay coefficient of variation was less than 10%, and the inter-assay coefficient of variation was less than 15%.
2.4. Short-Chain Fatty Acid Detection
Concentrations of the main short-chain fatty acids (SCFAs) in the digesta samples were analyzed using gas chromatography (7890A, Agilent, Santa Clara, CA, USA), in accordance with the methodology outlined in our previous study []. Briefly, thaw 0.7 g of digesta and suspend it in 1.5 mL of ultrapure water. Vortex the mixture and let it sit on ice for 30 min. Centrifuge each sample at 10,000× g and 4 °C for 15 min. Transfer 1 mL of the supernatant into a 1.5 mL centrifuge tube and mix it with 0.2 mL of crotonic acid-metaphosphate acid. Let it sit at 4 °C for 30 min, followed by centrifugation at 10,000× g and 4 °C for 10 min. Collect 0.3 mL of the supernatant and add it to 0.9 mL of methanol. Vortex the mixture and centrifuge it at 8000× g and 4 °C for 5 min. Finally, analyze the supernatant using gas chromatography with a flame ionization detector. The oven temperature should be set to increase from 100 °C to 190 °C, with nitrogen “N2” used as the carrier gas at a flow rate of 1 mL/min.
2.5. Bacterial 16S rDNA Gene Sequencing
The procedure of 16S rDNA sequencing was described in detail according to a previous study []. The simplified workflow is presented here. For each group, six biological replicates were collected, and every two samples were pooled as one composite sample, resulting in three pooled replicates per group. The simplified workflow is presented here. The bacterial DNA in digesta were extracted by using the Stool DNA Kit (D4015-01, Omega Bio-tek, Norcross, GA, USA), then amplified with the primers of V3-V4 region in bacterial 16S rDNA. The amplicons were purified and subsequently sequenced using the Illumina MiSeq system (Illumina, San Diego, CA, USA) with the MiSeq Reagent Kit v3 followed by quality control and assembly.
2.6. Statistical Analyses
All statistical analyses were performed in IBM SPSS Statistics, version 27.0 (IBM Corp., Armonk, NY, USA) and the Majorbio Cloud Platform (https://cloud.majorbio.com; accessed on 19 July 2025). Data were tested for normality and homogeneity of variance before analysis, confirming that they met the assumptions required for parametric tests.
The normality of the data distribution for serum parameters, intestinal morphology and mucosal factors, digestive enzyme activity, and SCFA of intestinal chyme was assessed using Q–Q plots. Homogeneity of variances was evaluated using Levene’s test. When the assumptions of normality and homogeneity were satisfied, the data were analyzed by two-way analysis of variance (ANOVA) using the General Linear Model (GLM) procedure in IBM SPSS Statistics, version 27.0 (IBM Corp., Armonk, NY, USA) to evaluate the effects of different treatment groups (CON and F-F) and feeding periods (72 d, 78 d, and 84 d). For variables that did not meet the assumptions of normality, appropriate transformations were applied prior to analysis. Duncan’s multiple range test was used for post hoc analysis when significant main or interaction effects, or a trend toward interaction, were observed. The results are presented as means ± SEM. Statistical significance was defined as p ≤ 0.05, and tendencies were considered when 0.05 < p < 0.10.
For microbiome analyses, 16S rDNA data were processed on the Majorbio Cloud Platform. Alpha diversity (Chao1 and Shannon) was compared between feeding regimens at each time point using the two-sample Wilcoxon rank-sum test. Beta diversity was summarized by principal coordinate analysis (PCoA) based on Bray–Curtis dissimilarities, and group separation was assessed with both ANOSIM and PERMANOVA (Adonis), each with 999 permutations. Wilcoxon rank-sum test was used to compare variation in jejunal and cecal digesta samples on taxonomic composition. Correlations between microbial taxa (after arcsine–square-root transformation) and host markers (TNF−α, lipase, CRH, propionic acid, buryric acid, IL1 and IL17) are computed within each intestinal segment and within each age using Pearson’s r, with two-sided tests and BH-FDR control over the correlation matrix. Heatmaps annotate * (PFDR < 0.05), and the legend indicates which associations remain noteworthy after FDR control.
3. Results
3.1. The Growth Performance and Intestinal Morphology of M-Ds
Analysis of M-D growth performance revealed interactions between feeding regimen and age on average body weight (p < 0.01). Compared to the CON group, the body weight in the F-F group increased on d 72, d 78, and d 84 of age (p < 0.01; Supplementary Figure S1). Additionally, no significant cellular damage was observed in jejunal and cecal tissue sections under different rearing conditions. The overall intestinal tissue structure was well-maintained, with no evident signs of damage (Figure 1A–D). There was no feeding regimen × age interaction for villus length, crypt depth, or villus-to-crypt ratio (V/C) in the jejunum of M-Ds (p > 0.05; Figure 1E–G).
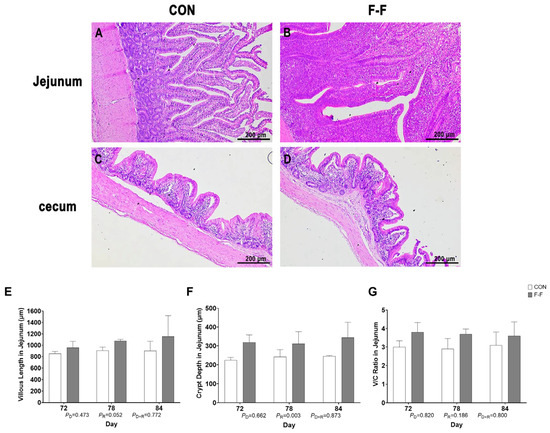
Figure 1.
Effects of feeding regimen on jejunal morphology of M-D. Representative hematoxylin–eosin (H&E) stained micrographs of M-D jejunum (A,B) and cecum (C,D) tissue sections on 84 days of age for M-D. Representative micrographs are shown (n = 6). Scale bars = 200 μm. (E) Villus length (μm), (F) crypt depth (μm), (G) villus height-to-crypt depth ratio (V/C). (A,C) represent control group (CON); (B,D) represent F-F group; (E–G) bar heights represent mean values with error bars showing SEM (n = 6). CON, control group, where ducks were provided with sufficient feed, allowing free access to feed; F-F, conventional force-feeding group; 72 d, 78 d, and 84 d, M-D age (days); R, feeding regimen; D, age of M-Ds; R × D, interaction between feeding regimen and age.
A feeding regimen × age interaction showed a tendency for jejunal lipase activity (p = 0.079, Figure 2). Compared to day 72, trypsin activity increased by day 78 in all groups (p < 0.05). However, by day 84, activity declined from the peak observed on day 78 (p < 0.05, Figure 2). Throughout the trial period, no significant differences were detected between the CON and F-F groups at any time point (p > 0.05). There was no feeding regimen × age interaction for jejunal trypsin and AMS activity (p > 0.05).

Figure 2.
Effects of feeding regimen and age on jejunal digestive enzyme activity in M-Ds. (A) Trypsin activity, (B) amylase activity, (C) lipase activity. Bar heights represent mean values with error bars showing SEM (n = 6). Different uppercase letters denote significant differences (p < 0.05). CON, control group, where ducks were provided with sufficient feed, allowing free access to feed; F-F, conventional force-feeding group; 72 d, 78 d, and 84 d, M-D age (days); R, feeding regimen; D, age of M-Ds; R × D, interaction between feeding regimen and age.
3.2. Hormone, Inflammatory, and Oxidative Indicators, Along with Liver Function Parameters in Serum and Intestinal Tissue
To assess the impact of F-F on stress responses in M-Ds, serum levels of CORT, CRH, and ACTH were measured (Figure 3). There was a feeding regimen × age interaction found for serum CRH (p < 0.05). Compared to the CON group, serum CRH levels were significantly lower in the F-F group on day 72 (p < 0.05). However, subsequent measurements at days 78 and 84 showed no intergroup differences (p > 0.05). There was no feeding regimen × age interaction found for serum CORT and ACTH levels (p > 0.05).
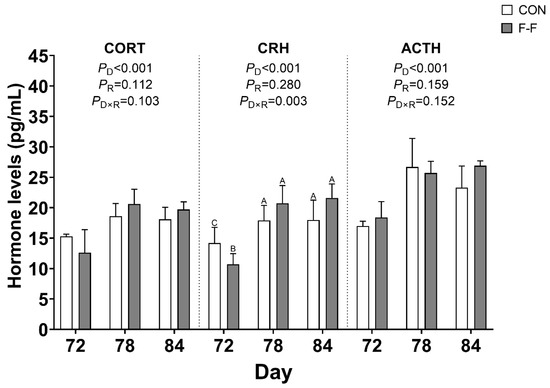
Figure 3.
Effects of feeding regimen and age on serum stress hormones in M-Ds. CORT, CRH, and ACTH levels in serum. Different uppercase letters denote significant differences (p < 0.05). Bar heights represent mean values with error bars showing SEM (n = 6). CON, control group, where ducks were provided with sufficient feed, allowing free access to feed; F-F, conventional force-feeding group; 72 d, 78 d, and 84 d, M-D age (days); R, feeding regimen; D, age of M-Ds; R × D, interaction between feeding regimen and age.
Further statistical analysis identified that there was a feeding regimen × age interaction found for cecal IL−1β levels (p < 0.05), while jejunal TNF−α (p = 0.051) and cecal IL−17 levels (p = 0.087) demonstrated a tendency for interaction. The F-F group demonstrated reduced jejunal TNF−α concentrations and elevated cecal IL−1β content compared to CON controls at d 72 (p < 0.05), but not at d 78 and d 84 (Figure 4).
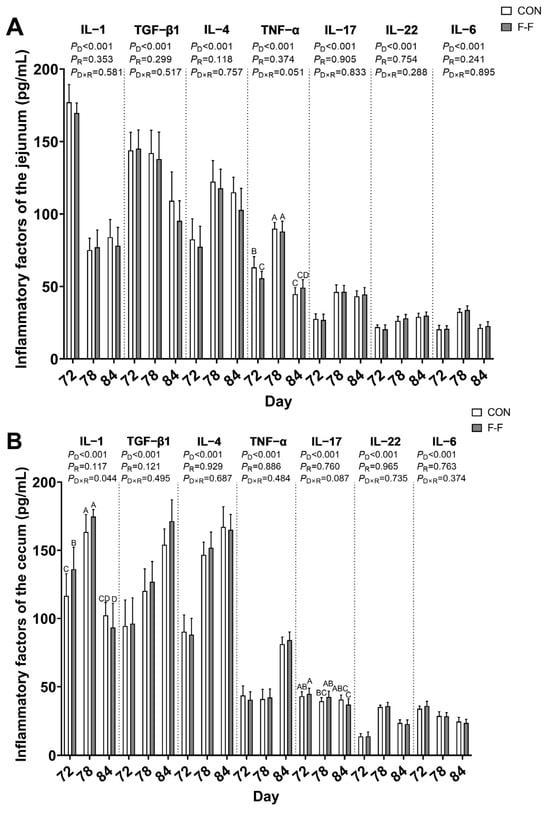
Figure 4.
Effects of F-F regimens and age on immunologic parameters in jejunal and cecal mucosa of M-Ds. (A) Levels of IL−1β, TNF−α, IL−22, IL−17, IL−6, IL−4, and TGF−β in jejunal tissue; (B) levels of IL−1β, TNF−α, IL−22, IL−17, IL−6, IL−4, and TGF−β in cecal tissue. Different uppercase letters denote significant differences (p < 0.05). Bar heights represent mean values with error bars showing SEM (n = 6). CON, control group, where ducks were provided with sufficient feed, allowing free access to feed; F-F, conventional force-feeding group; 72 d, 78 d, and 84 d, M-D age (days); R, feeding regimen; D, age of M-Ds; R × D, interaction between feeding regimen and age.
Notably, no feeding regimen × age interactions were found for the measured parameters, including inflammatory cytokines such as IL−22, IL−6, IL−4, and TGF−β1 in both jejunum and cecum, along with IL−1β and IL−17 specifically in the jejunum and TNF−α in the cecum (Figure 4), as well as oxidative indicators comprising SOD, MDA, GSH−Px, and CAT in both intestinal sites, and metabolic biomarkers including ALT, AST, GLU, and ALP similarly in both locations (p > 0.05; Figure 5).
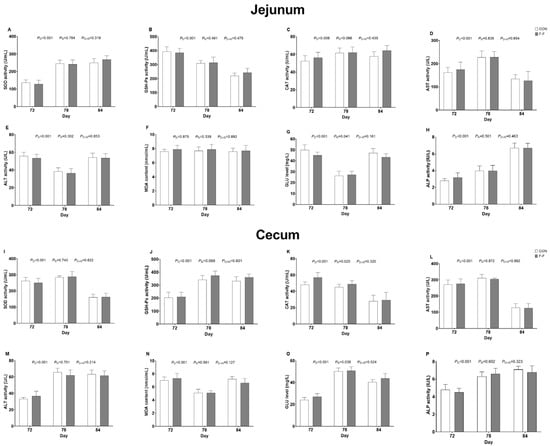
Figure 5.
Effects of different F-F regimens on antioxidant and liver injury indices in jejunum and cecum of M-Ds. (A–C) SOD, GSH−PX, and CAT activity in jejunum, (D,E) AST and ALT activity in jejunum, (F) MDA content in jejunum, (G) GLU level in jejunum, (H) ALP activity in jejunum, (I–K) SOD, GSH−PX, and CAT activity in cecum, (L,M) AST and ALT activity in cecum, (N) MDA content in cecum, (O) GLU level in cecum, (P) ALP activity in cecum. Bar heights represent mean values with error bars showing SEM (n = 6). CON, control group, where ducks were provided with sufficient feed, allowing free access to feed; F-F, conventional force-feeding group; 72 d, 78 d, and 84 d, M-D age (days); R, feeding regimen; D, age of M-Ds; R × D, interaction between feeding regimen and age.
3.3. Effects of F-F on Gut Microbiota Composition in M-Ds
Alpha diversity results (Figure 6) showed that in the jejunum, the F-F group had a lower Shannon index compared to the CON group at d 84 (p < 0.01).
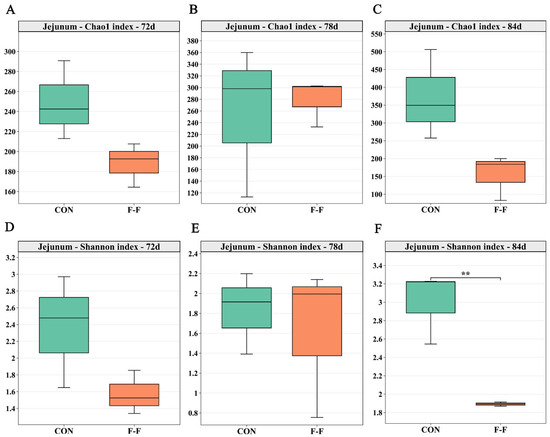
Figure 6.
Effects of feeding regimens and age on microbial diversity in jejunum of M-Ds. (A–C) show Chao1 index, reflecting species richness; (D–F) show Shannon index, reflecting community diversity. ** Means at that time point differed between groups (** p < 0.01). In each box plot, box represents 25th-75th percentile range, middle line indicates median, and whiskers represent maximum and minimum values, n = 3. CON, control group, where ducks were provided with sufficient feed, allowing free access to feed; F-F, conventional force-feeding group; 72 d, 78 d, and 84 d, M-D age (days); R, feeding regimen; D, age of M-Ds; R × D, interaction between feeding regimen and age.
In the cecum, the Chao1 and Shannon indices of the F-F group were lower than those of the CON group on d 84 (p < 0.01, Figure 7). However, no significant differences in alpha diversity were observed between the groups in either intestinal segment at earlier time points (p > 0.05).
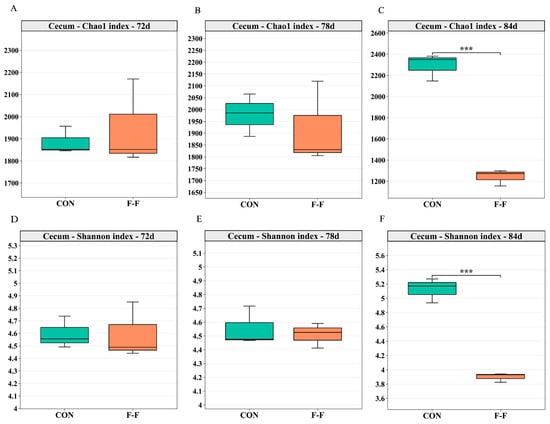
Figure 7.
Effects of feeding regimens and age on microbial diversity in cecum of M-Ds. (A–C) show Chao1 index, reflecting species richness; (D–F) show Shannon index, reflecting community diversity. *** Means at that time point differed between groups (*** p < 0.001). In each box plot, box represents 25th-75th percentile range, middle line indicates median, and whiskers represent maximum and minimum values, n = 3. CON, control group, where ducks were provided with sufficient feed, allowing free access to feed; F-F, conventional force-feeding group; 72 d, 78 d, and 84 d, M-D age (days); R, feeding regimen; D, age of M-Ds; R × D, interaction between feeding regimen and age.
Beta diversity results (Figure 8) were assessed using principal coordinate analysis (PCoA) based on Bray–Curtis dissimilarities, with statistical significance evaluated by both PERMANOVA and ANOSIM (999 permutations). No significant separation (p > 0.050) of microbial communities was observed in the jejunum or cecum at d 72 or d 78. However, by d 84, statistically significant separation emerged in both the cecum (PERMANOVA: R2 = 0.770, p = 0.041; ANOSIM: R = 1.000, p = 0.041) and jejunum (PERMANOVA: R2 = 0.637, p = 0.050; ANOSIM: R = 1.000, p = 0.050), indicating substantial diet-driven divergence in community composition at this later time point.
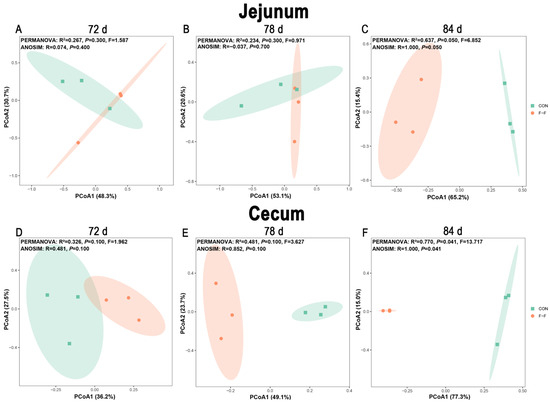
Figure 8.
Effects of feeding regimen and age on β-diversity of gut microbiota in M-Ds. (A–C) Jejunal PCoA analysis; (D–F) cecal PCoA analysis. β-diversity was assessed using 16S rRNA gene sequencing to characterize similarity of microbial compositions among treatment groups (n = 3 per group). CON, control group, where ducks were provided with sufficient feed, allowing free access to feed; F-F, conventional force-feeding group; 72 d, 78 d, and 84 d, M-D age (days); R, feeding regimen; D, age of M-Ds; R × D, interaction between feeding regimen and age.
To further elucidate the taxonomic composition changes underlying these diversity shifts, microbial community structure was analyzed at both the class and genus levels on d 72, d 78, and d 84 (Figure 9). In the jejunum (Table 2), a significant feeding regimen × age interaction was observed for the relative abundances of Bacteroidia and Campylobacteria at the class level and for Helicobacter, Lactobacillus, Lactococcus, Limosilactobacillus, and Enterococcus at the genus level (p < 0.05). Compared to the CON group, the F-F group had lower Campylobacteria and Helicobacter but higher Enterococcus on day 72 (p < 0.05). By day 84, Bacteroidia decreased while Lactobacillus increased (p < 0.05). Additionally, Enterococcus levels declined on both days 72 and 84 (p < 0.05).
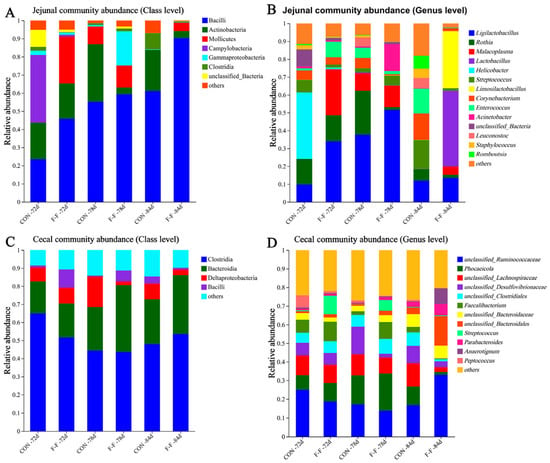
Figure 9.
Effects of feeding regimen and age on abundance of class and genus taxa of gut microorganisms in M-Ds. Bar charts show relative abundance of taxa at class level (A,C) and genus level (B,D) in jejunal and cecal microbiota, respectively (n = 3 per group). CON, control group, where ducks were provided with sufficient feed, allowing free access to feed; F-F, conventional force-feeding group; 72 d, 78 d, and 84 d, M-D age (days); R, feeding regimen; D, age of M-Ds; R × D, interaction between feeding regimen and age.

Table 2.
Effects of feeding regimen and age on bacterial abundance in jejunal microbiome at class and genus levels 1.
In the cecum (Table 3), a significant feeding regimen × age interaction was observed in the relative abundances of Actinobacteria and Deltaproteobacteria at the class level, as well as unclassified Ruminococcaceae, unclassified Bacteroidales, Anaerotignum, unclassified Firmicutes, Bifidobacterium, Limosilactobacillus, and unclassified Lachnospiraceae at the genus level (p < 0.05). Compared to CON, the F-F group showed distinct temporal microbial changes: increased Actinobacteria and decreased Deltaproteobacteria (class level) on day 78, with persistently reduced unclassified Firmicutes through day 84 (p < 0.05). By day 84, unclassified Ruminococcaceae, Bacteroidales, Anaerotignum, Bifidobacterium, and Limosilactobacillus increased, while unclassified Lachnospiraceae decreased (p < 0.05).

Table 3.
Effects of feeding regimen and age on bacterial abundance in cecal microbiome at class and genus levels 1.
Analysis of short-chain fatty acid (SCFA) concentrations in intestinal chyme revealed a feeding regimen × age interaction showing a tendency for cecal propionic acid (p = 0.071) and butyric acid (p = 0.059; Figure 10). Compared to the CON group, the F-F group showed significantly higher concentrations of propionic acid and butyric acid in cecal contents at both d 78 and d 84 (p < 0.05). No significant feeding regimen × age interactions were detected for other SCFAs in either jejunal or cecal contents (p > 0.05).
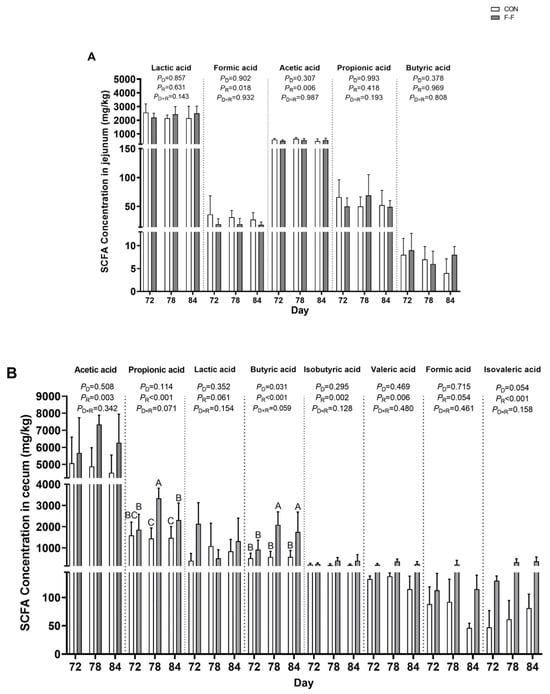
Figure 10.
Effects of feeding regimen and age on short-chain fatty acids (SCFAs) in jejunum and cecum of M-Ds. (A) Levels of lactic acid, formic acid, acetic acid, propionic acid, and butyric acid in jejunal chyme; (B) levels of acetic acid, propionic acid, lactic acid, butyric acid, isobutyric acid, valeric acid, formic acid, and isovaleric acid in cecal tissue. Different uppercase letters denote significant differences (p < 0.05). Bar heights represent mean values with error bars showing SEM (n = 6). CON, control group, where ducks were provided with sufficient feed, allowing free access to feed; F-F, conventional force-feeding group; 72 d, 78 d, and 84 d, M-D age (days); R, feeding regimen; D, age of M-Ds; R × D, interaction between feeding regimen and age.
3.4. Correlation Analysis Between Gut Microbiota Composition and Serum/Intestinal Markers in M-Ds
Pearson correlation analysis with Benjamini–Hochberg FDR correction revealed that at 72 d and 78 d, no significant correlations were observed between cecal microbiota and the measured physiological and biochemical parameters (PFDR > 0.05, Figure 11). By 84 d, significant associations emerged between cecal microbial taxa and metabolic products (Figure 11): Limosilactobacillus exhibited significant positive correlations with both propionic acid and butyric acid levels (PFDR < 0.05), Anaerotignum showed a significant positive correlation with butyric acid (PFDR = 0.0443), and Bifidobacterium demonstrated a significant positive correlation with propionic acid (PFDR = 0.0433). In contrast, jejunal microbiota showed no significant correlations at any time point (PFDR > 0.05; Figure 11).
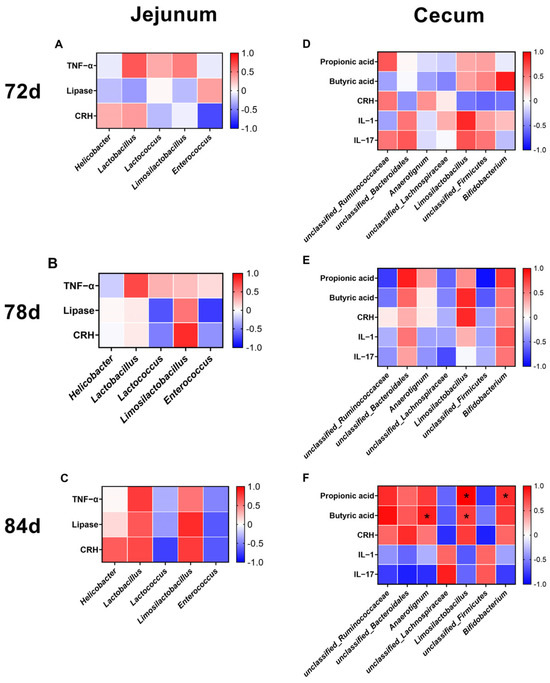
Figure 11.
Correlation heatmap of intestinal microbiota composition and serum/intestinal markers in M-Ds. (A–C) Correlation between jejunal microbiota and serum/intestinal markers; (D–F) correlation between cecal microbiota and serum/intestinal markers; n = 3; * indicates statistically significant correlation (PFDR < 0.05). Negative correlation was painted in blue and positive correlation was painted in red. The darker the color, the stronger the correlation intensity was. CON, control group, where ducks were provided with sufficient feed, allowing free access to feed; F-F, conventional force-feeding group; 72 d, 78 d, and 84 d, M-D age (days); R, feeding regimen; D, age of M-Ds; R × D, interaction between feeding regimen and age.
4. Discussion
F-F is a critical technique for producing foie gras [], where it promotes high energy intake, markedly increasing hepatic fat deposition and metabolic efficiency. The M-D, renowned for its exceptional capacity for liver hypertrophy, has become the predominant species used in foie gras production. However, the intensive metabolic load imposed by F-F also triggers complex physiological and intestinal adaptations, the characterization of which is vital for balancing production performance with animal welfare. The use of 65-day-old M-Ds was driven by both previous research and practical evidence [,,], which collectively recommend initiating F-F at a body weight of 3.5 kg.
Overfeeding with high-energy diets markedly promotes weight gain in pigs, chickens, cattle, and humans [,,,]. In this study, the average daily gain (ADG) in the force-fed group was significantly higher than that of the CON group, which aligns with previous findings []. The observed growth enhancement stems from F-F-induced high energy intake, mediated by maintained intestinal barrier integrity and upregulated digestive enzymes, ultimately boosting fat deposition and energy utilization efficiency [,].
The integrity of intestinal function is characterized by the morphological integrity of the gut, with villus height, crypt depth, and the villus height-to-crypt depth ratio serving as representative in calves, pigs, chickens, and Pekin ducks [,,,]. Intestinal villi absorb nutrients in the small intestine. Increased villus height enhances absorption surface area, promoting growth []. Crypt depth indicates epithelial cell production rate—shallower crypts suggest reduced cell renewal []. The villus height-to-crypt depth ratio (V/C) effectively assesses intestinal function. Digestive enzyme activity reflects the ability of M-Ds to digest nutrients [,]. Previous research on geese has demonstrated that trypsin activity increases with F-F []. In this study, the findings of histopathological examination in M-D tissues preliminarily suggest that the intestinal barrier of the experimental M-Ds remained intact and functioned normally. Furthermore, the observed increase in trypsin activity appears to be mediated by F-F-induced hyperphagia, which enhances digestive enzyme secretion.
Corticosterone (CORT) is recognized as a practical physiological indicator of stress response in ducks and is highly sensitive to stress in these animals []. When ducks experience stress, the hypothalamus releases corticotropin-releasing hormone (CRH), which stimulates the pituitary gland to secrete adrenocorticotropic hormone (ACTH). ACTH then acts on the adrenal glands, prompting the release of corticosterone into the bloodstream. This process is highly conserved across avian species [,]. It should be recognized, however, that CORT functions as a multifaceted hormone involved not only in stress signaling but also in various metabolic processes including energy mobilization, glucose homeostasis, and nutrient partitioning []. Prolonged exposure to stressors can lead to persistently elevated CORT levels and chronic stress responses in poultry []. During chronic stress responses, cells produce reactive oxygen species (ROS) that disturb redox homeostasis by interfering with key antioxidant enzymes, including superoxide dismutase (SOD), glutathione peroxidase (GSH−Px), and catalase (CAT), while simultaneously promoting the upregulation of pro-inflammatory cytokines [,]. This study suggests that despite hormonal activation, systemic oxidative disturbances were not evident during the study period. Notably, pro-inflammatory IL−17 levels in the cecum were reduced by the end of the experimental period, potentially indicating the activation of compensatory anti-inflammatory regulatory mechanisms. While these oxidative and inflammatory findings should be interpreted with appropriate caution given the sample size and potential for delayed or tissue-specific effects, they suggest that acute systemic stress impact was limited in the current experimental context. Interestingly, these results contrast with findings in Pekin ducks by Liu et al. [], where F-F caused intestinal epithelial damage. This discrepancy highlights notable interspecies differences in physiological responses to F-F, suggesting that M-Ds may possess distinct adaptive mechanisms that warrant further investigation combining both physiological and behavioral assessment approaches.
Gut microbiota and their short-chain fatty acid (SCFA) metabolites mediate adaptive responses to exogenous stressors through dynamic adjustments in community composition. Studies in M-Ds, pigs, and geese demonstrate that intestinal microbiota sense environmental stressors and restructure their communities, enhancing SCFA synthesis. These metabolites, particularly butyrate, are transported into intestinal epithelial cells via Na+/H+-coupled monocarboxylate transporters, subsequently modulating host energy metabolism, gene expression, and immune signaling pathways [,]. This process promotes Muc2 gene expression and goblet cell proliferation, strengthening intestinal barrier integrity and ultimately improving the organism’s adaptation to external stressors [,,,].
Studies have shown that the gut microbiota can rapidly change in response to dietary alterations []. Such microbial shifts can influence the host via two principal mechanisms: interactions mediated by microbial metabolites [] and the direct disruption of the intestinal barrier by pathogenic bacteria through toxins or other virulence factors []. Because F-F entails the rapid intake of large amounts of feed, it markedly reshapes the gut microbiome [] and, in certain duck breeds, can compromise intestinal barrier integrity [,]. In this study, F-F induced gut microbiota restructuring in M-Ds, and the reduction in microbial diversity aligns with previous findings in stress-exposed animals, where physiological challenges often lead to less diverse but more specialized microbial communities [,]. The genus of Limosilactobacillus encompasses several species previously classified within Lactobacillus, demonstrating enhanced stress tolerance and metabolic versatility compared to traditional lactobacilli []. Members of this genus possess enhanced carbohydrate utilization pathways and stress response genes and superior epithelial adhesion via specialized surface proteins and produce antimicrobial bacteriocins, exopolysaccharides, and immunomodulatory peptides that suppress pro-inflammatory cytokines (TNF−α, IL−1β, IL−6), enhance IL−10 and TGF−β production, and modulate NF−κB signaling [,,,,]. Moreover, previous studies indicate that M-Ds tolerate F-F relatively well, with the intestinal barrier often remaining intact after the procedure [,]. Enrichment of Limosilactobacillus helps preserve the intestinal barrier in M-Ds; additionally, M-Ds’ strong tolerance to F-F may explain why barrier integrity was maintained despite microbiota alterations. In the present study, the enrichment of Limosilactobacillus in force-fed groups, together with the correlation analysis results, suggests that the proliferation of this beneficial bacterium may represent an adaptive response that helps M-Ds withstand the physiological stress associated with F-F. Because two individual samples were pooled into one biological replicate, the effective sample size was limited to n = 3 per group and time point. Therefore, the current findings should be considered exploratory, and future studies with a larger number of individual samples are required to validate and expand these observations.
5. Conclusions
The combined data on serum factors, intestinal morphology, and microbial dynamics point to a model wherein M-Ds exhibit time-dependent metabolic and immunological adaptations in response to F-F stress. Central to this process is a characteristic shift in the gut microbiota, particularly a significant enrichment of Limosilactobacillus. These findings uncover a key mechanism and provide a theoretical foundation for developing microbiota-targeted therapies to combat F-F stress in foie gras production.
Supplementary Materials
The following supporting information can be downloaded at: https://www.mdpi.com/article/10.3390/agriculture15232415/s1. Figure S1: Dynamic changes in body weight of M-Ds under different rearing conditions; Table S1: Feeding increment.
Author Contributions
Conceptualization, C.H.; methodology, C.H. and A.L.; formal analysis, C.H., Z.Z., Z.D., X.Y., H.J. and Y.C.; investigation, Z.Z., Z.D., X.Y., H.J. and Y.C.; resources, A.L., C.H. and X.C.; data curation, Z.Z., H.J. and Y.C.; writing—original draft preparation, Z.D. and Z.Z.; writing—review and editing, C.H., Z.Z., Z.D. and X.Y.; supervision, C.H., A.L. and X.C.; project administration, C.H. and A.L.; funding acquisition, C.H. and A.L. All authors have read and agreed to the published version of the manuscript.
Funding
This research was funded by the innovation Fund of Fujian Agriculture and Forestry University, grant number KFB24012A; the National Natural Science Foundation of China, grant number 32202681; and the Earmarked Fund for Modern Agro-industry Technology Research System of China, grant number CaRS-43.
Institutional Review Board Statement
The animal study protocol was approved by the Animal Care and Use Ethics Committee of Fujian Agriculture and Forestry University, China (protocol code PZCASFAFU24003, approved on 2 August 2022). All experimental and management procedures involving ducks were conducted in strict accordance with the animal welfare and ethical guidelines established by this committee. Every effort was made to minimize stress and discomfort to the experimental animals throughout the research process.
Data Availability Statement
All raw sequencing data were deposited in the NCBI Sequence Read Archive under the BioProject (PRJNA1279350).
Conflicts of Interest
The authors declare no conflicts of interest.
Abbreviations
The following abbreviations are used in this manuscript:
| M-D | Mule Duck |
| F-F | force-feeding |
| ADG | average daily gain |
| H&E | Hematoxylin and Eosin |
| V/C | villus-to-crypt ratio |
| AMS | amylase |
| IL−1β | interleukin−1 beta |
| IL−4 | interleukin−4 |
| IL−6 | interleukin−6 |
| IL−17 | interleukin−17 |
| IL−22 | interleukin−22 |
| TGF−β1 | transforming growth factor−beta 1 |
| TNF−α | tumor necrosis factor − alpha |
| CRH | corticotropin-releasing hormone |
| CORT | corticosterone |
| ACTH | adrenocorticotropic hormone |
| SCFAs | short-chain fatty acids |
| SOD | superoxide dismutase |
| MDA | malondialdehyde |
| GSH-Px | glutathione peroxidase |
| CAT | catalase |
| ALT | alanine aminotransferase |
| AST | aspartate aminotransferase |
| GLU | glucose |
| ALP | alkaline phosphatase |
| HDL | high-density lipoprotein |
| LDL | low-density lipoprotein |
References
- Bonnefont, C.M.D.; Molette, C.; Lavigne, F.; Manse, H.; Bravo, C.; Lo, B.; Rémignon, H.; Arroyo, J.; Bouillier-Oudot, M. Evolution of Liver Fattening and Foie Gras Technological Yield during the Overfeeding Period in Mule Duck. Poult. Sci. 2019, 98, 5724–5733. [Google Scholar] [CrossRef]
- Guémené, D.; Guy, G. The Past, Present and Future of Force-Feeding and “Foie Gras” Production. Worlds Poult. Sci. J. 2004, 60, 210–222. [Google Scholar] [CrossRef]
- Heath, D.; Meneley, A. The Naturecultures of Foie Gras: Techniques of the Body and a Contested Ethics of Care. Food Cult. Soc. 2010, 13, 421–452. [Google Scholar] [CrossRef]
- Guémené, D.; Guy, G.; Noirault, J.; Destombes, N.; Faure, J.-M. Rearing Conditions during the Force-Feeding Period in Male Mule Ducks and Their Impact upon Stress and Welfare. Anim. Res. 2006, 55, 443–458. [Google Scholar] [CrossRef]
- Litt, J.; Leterrier, C.; Savietto, D.; Fortun-Lamothe, L. Influence of Dietary Strategy on Progression of Health and Behaviour in Mule Ducks Reared for Fatty Liver Production. Animal 2020, 14, 1258–1269. [Google Scholar] [CrossRef]
- Liu, Y.H.; Zhu, X.Y.; Huang, L.Q.; Jia, Y.X.; Xia, Z.F. Effects of Force-Feeding on Immunology, Digestive Function and Oxidative Stress in the Duodenal and Jejunal Mucosa of Pekin Ducks. Animal 2019, 13, 2199–2206. [Google Scholar] [CrossRef]
- Servière, J.; Carriere, M.; Duvaux-Ponter, C.; Guy, G.; Roussel, S. Neurogenic Inflammation in the Upper Digestive Tract of the Mule Duck: Effect of a Chemical Algogen and Force-Feeding. Br. Poult. Sci. 2011, 52, 792–799. [Google Scholar] [CrossRef]
- Atallah, E.; Trehiou, S.; Alquier-Bacquie, V.; Lasserre, F.; Arroyo, J.; Molette, C.; Remignon, H. Development of Hepatic Steatosis in Male and Female Mule Ducks after Respective Force-Feeding Programs. Front. Physiol. 2024, 15, 1392968. [Google Scholar] [CrossRef]
- Zhu, L.H.; Meng, H.; Duan, X.J.; Xu, G.Q.; Zhang, J.; Gong, D.Q. Gene Expression Profile in the Liver Tissue of Geese after Overfeeding. Poult. Sci. 2011, 90, 107–117. [Google Scholar] [CrossRef] [PubMed]
- Lv, X.; Obianwuna, U.E.; Yang, W.; Zhang, Z.; An, K.; Shi, B.; Dong, Y.; Wu, S.; Xia, Z. Astaxanthin Supplementation Mitigated Intestinal Damage and Immunity in Overfed Pekin Ducks by Regulating Gut Morphology, Intestinal Inflammation, and Antioxidant Balance. Anim. Nutr. 2025, 21, 426–438. [Google Scholar] [CrossRef] [PubMed]
- Vasaï, F.; Brugirard Ricaud, K.; Bernadet, M.D.; Cauquil, L.; Bouchez, O.; Combes, S.; Davail, S. Overfeeding and Genetics Affect the Composition of Intestinal Microbiota in Anas Platyrhynchos (Pekin) and Cairina Moschata (Muscovy) Ducks. FEMS Microbiol. Ecol. 2014, 87, 204–216. [Google Scholar] [CrossRef]
- Vasaï, F.; Ricaud, K.B.; Cauquil, L.; Daniel, P.; Peillod, C.; Gontier, K.; Tizaoui, A.; Bouchez, O.; Combes, S.; Davail, S. Lactobacillus Sakei Modulates Mule Duck Microbiota in Ileum and Ceca during Overfeeding. Poult. Sci. 2014, 93, 916–925. [Google Scholar] [CrossRef]
- Wen, K.; Liu, L.; Zhao, M.; Geng, T.; Gong, D. The Changes in Microbiotic Composition of Different Intestinal Tracts and the Effects of Supplemented Lactobacillus During the Formation of Goose Fatty Liver. Front. Microbiol. 2022, 13, 906895. [Google Scholar] [CrossRef]
- Fournier, E.; Peresson, R.; Guy, G.; Hermier, D. Relationships between Storage and Secretion of Hepatic Lipids in Two Breeds of Geese with Different Susceptibility to Liver Steatosis. Poult. Sci. 1997, 76, 599–607. [Google Scholar] [CrossRef] [PubMed]
- Hermier, D.; Saadoun, A.; Salichon, M.R.; Sellier, N.; Rousselot-Paillet, D.; Chapman, M.J. Plasma Lipoproteins and Liver Lipids in Two Breeds of Geese with Different Susceptibility to Hepatic Steatosis: Changes Induced by Development and Force-Feeding. Lipids 1991, 26, 331–339. [Google Scholar] [CrossRef] [PubMed]
- Mittal, M.; Siddiqui, M.R.; Tran, K.; Reddy, S.P.; Malik, A.B. Reactive Oxygen Species in Inflammation and Tissue Injury. Antioxid. Redox Signal. 2014, 20, 1126–1167. [Google Scholar] [CrossRef]
- Even, M.; Davail, S.; Rey, M.; Tavernier, A.; Houssier, M.; Bernadet, M.D.; Gontier, K.; Pascal, G.; Ricaud, K. Probiotics Strains Modulate Gut Microbiota and Lipid Metabolism in Mule Ducks. Open Microbiol. J. 2018, 12, 71–93. [Google Scholar] [CrossRef]
- Shen, Y.; Li, Y.; Xiao, J.; Li, J.; Wu, Y.; Wu, Y.; Tang, H.; Fang, X.; Wang, L.; Gong, Y.; et al. Comparative Microbiomic Analysis of Fecal Microbiota Associated with Abdominal Fat in Ducks. Poult. Sci. 2025, 104, 105282. [Google Scholar] [CrossRef]
- Leser, T.D.; Mølbak, L. Better Living through Microbial Action: The Benefits of the Mammalian Gastrointestinal Microbiota on the Host. Environ. Microbiol. 2009, 11, 2194–2206. [Google Scholar] [CrossRef] [PubMed]
- Yu, Y.; Zhou, Y.F.; Sun, J.; Shi, W.; Liao, X.P.; Liu, Y.H. Pharmacokinetic and Pharmacodynamic Modeling of Sarafloxacin against Avian Pathogenic Escherichia Coli in Muscovy Ducks. BMC Vet. Res. 2017, 13, 47. [Google Scholar] [CrossRef]
- Bao, H.; Xue, Y.; Zhang, Y.; Tu, F.; Wang, R.; Cao, Y.; Lin, Y. Encapsulated Essential Oils Improve the Growth Performance of Meat Ducks by Enhancing Intestinal Morphology, Barrier Function, Antioxidant Capacity and the Cecal Microbiota. Antioxidants 2023, 12, 253. [Google Scholar] [CrossRef] [PubMed]
- Huang, C.; Shi, C.; Li, Z.; Wang, W.; Ming, D.; Gao, Y.; Liu, H.; Ma, X.; Wang, F. Pyrroloquinoline Quinone Regulates Glycolipid Metabolism in the Jejunum via Inhibiting AMPK Phosphorylation of Weaned Pigs. Food Funct. 2022, 13, 9610–9621. [Google Scholar] [CrossRef]
- Huang, C.; Ming, D.; Wang, W.; Wang, Z.; Hu, Y.; Ma, X.; Wang, F. Pyrroloquinoline Quinone Alleviates Jejunal Mucosal Barrier Function Damage and Regulates Colonic Microbiota in Piglets Challenged with Enterotoxigenic Escherichia Coli. Front. Microbiol. 2020, 11, 1754. [Google Scholar] [CrossRef]
- Liu, L.; Xiao, Q.; Gilbert, E.R.; Cui, Z.; Zhao, X.; Wang, Y.; Yin, H.; Li, D.; Zhang, H.; Zhu, Q. Whole-Transcriptome Analysis of Atrophic Ovaries in Broody Chickens Reveals Regulatory Pathways Associated with Proliferation and Apoptosis. Sci. Rep. 2018, 8, 7231. [Google Scholar] [CrossRef]
- Luo, R.; Chen, C.; Shi, Y.; Tao, Q.; Bai, D.; Li, A. Effects of Overfeeding on Liver Lipid Metabolism in Mule Ducks Based on Transcriptomics and Metabolomics. Br. Poult. Sci. 2023, 64, 143–156. [Google Scholar] [CrossRef]
- Chartrin, P.; Bernadet, M.D.; Guy, G.; Mourot, J.; Hocquette, J.-F.; Rideau, N.; Duclos, M.-J.; Baéza, E. Do Age and Feeding Levels Have Comparable Effects on Fat Deposition in Breast Muscle of Mule Ducks? Animal 2007, 1, 113–123. [Google Scholar] [CrossRef] [PubMed]
- Arroyo, J.; Molette, C.; Lavigne, F.; Margetyal, C.; Amador, O.; Dubois, J.-P.; Fortun-Lamothe, L. Effects of Dietary Protein Level during Rearing Period and Age at Overfeeding on Magret and Foie Gras Quality in Male Mule Ducks. Anim. Sci. J. 2018, 89, 570–578. [Google Scholar] [CrossRef] [PubMed]
- Bray, G.A.; Bouchard, C. The Biology of Human Overfeeding: A Systematic Review. Obes. Rev. 2020, 21, e13040. [Google Scholar] [CrossRef]
- Delezie, E.; Bruggeman, V.; Swennen, Q.; Decuypere, E.; Huyghebaert, G. The Impact of Nutrient Density in Terms of Energy and/or Protein on Live Performance, Metabolism and Carcass Composition of Female and Male Broiler Chickens of Two Commercial Broiler Strains. J. Anim. Physiol. Anim. Nutr. 2010, 94, 509–518. [Google Scholar] [CrossRef]
- Patience, J.F.; Rossoni-Serão, M.C.; Gutiérrez, N.A. A Review of Feed Efficiency in Swine: Biology and Application. J. Anim. Sci. Biotechnol. 2015, 6, 33. [Google Scholar] [CrossRef]
- Vandehaar, M.J.; Yousif, G.; Sharma, B.K.; Herdt, T.H.; Emery, R.S.; Allen, M.S.; Liesman, J.S. Effect of Energy and Protein Density of Prepartum Diets on Fat and Protein Metabolism of Dairy Cattle in the Periparturient Period. J. Dairy Sci. 1999, 82, 1282–1295. [Google Scholar] [CrossRef]
- Wen, Z.G.; Jiang, Y.; Tang, J.; Xie, M.; Yang, P.L.; Hou, S.S. Effect of Feed Consumption Levels on Growth Performance and Carcass Composition during the Force-Feeding Period in Foie Gras Production of Male Mule Ducks. Animal 2016, 10, 1417–1422. [Google Scholar] [CrossRef] [PubMed]
- Remignon, H.; Burgues, P. Evolution of Oxidative Stress Markers in Livers of Ducks during Force-Feeding. Sci. Rep. 2023, 13, 1046. [Google Scholar] [CrossRef]
- Skippon, W. The Animal Health and Welfare Consequences of Foie Gras Production. Can. Vet. J. 2013, 54, 403–404. [Google Scholar] [PubMed]
- Biagi, G.; Piva, A.; Moschini, M.; Vezzali, E.; Roth, F.X. Performance, Intestinal Microflora, and Wall Morphology of Weanling Pigs Fed Sodium Butyrate. J. Anim. Sci. 2007, 85, 1184–1191. [Google Scholar] [CrossRef]
- Li, Y.; Li, X.; Nie, C.; Wu, Y.; Luo, R.; Chen, C.; Niu, J.; Zhang, W. Effects of Two Strains of Lactobacillus Isolated from the Feces of Calves after Fecal Microbiota Transplantation on Growth Performance, Immune Capacity, and Intestinal Barrier Function of Weaned Calves. Front. Microbiol. 2023, 14, 1249628. [Google Scholar] [CrossRef] [PubMed]
- Wilson, F.D.; Cummings, T.S.; Barbosa, T.M.; Williams, C.J.; Gerard, P.D.; Peebles, E.D. Comparison of Two Methods for Determination of Intestinal Villus to Crypt Ratios and Documentation of Early Age-Associated Ratio Changes in Broiler Chickens. Poult. Sci. 2018, 97, 1757–1761. [Google Scholar] [CrossRef]
- Xing, X.; Jiang, R.; Wang, L.; Lei, S.; Zhi, Y.; Wu, Y.; Zhu, M.; Huang, L.; Xia, G.; Chen, Z. Shenfu Injection Alleviates Intestine Epithelial Damage in Septic Rats. Am. J. Emerg. Med. 2015, 33, 1665–1670. [Google Scholar] [CrossRef]
- Park, J.; Carey, J. Dietary Enzyme Supplementation in Duck Nutrition: A Review. J. Appl. Poult. Res. 2019, 28, 587–597. [Google Scholar] [CrossRef]
- Wang, H.; Zhang, X.F.; Zhai, S.S.; Yuan, J.J.; Wang, W.C.; Zhu, Y.W.; Yang, L. Research Note: The Comparative Study of Energy Utilization in Feedstuffs for Muscovy Ducks between in Vivo and in Vitro. Poult. Sci. 2020, 100, 1004–1007. [Google Scholar] [CrossRef]
- Nitsan, Z.; Nir, I.; Dror, Y.; Bruckental, I. The Effect of Forced Feeding and of Dietary Protein Level on Enzymes Associated with Digestion, Protein and Carbohydrate Metabolism in Geese. Poult. Sci. 1973, 52, 474–481. [Google Scholar] [CrossRef] [PubMed]
- Harvey, S.; Merry, B.J.; Phillips, J.G. Influence of Stress on the Secretion of Corticosterone in the Duck (Anas Platyrhynchos). J. Endocrinol. 1980, 87, 161–171. [Google Scholar] [CrossRef]
- Arnaud, I.; Mignon-Grasteau, S.; Larzul, C.; Guy, G.; Faure, J.-M.; Guémené, D. Behavioural and Physiological Fear Responses in Ducks: Genetic Cross Effects. Animal 2008, 2, 1518–1525. [Google Scholar] [CrossRef]
- Bu, G.; Fan, J.; Yang, M.; Lv, C.; Lin, Y.; Li, J.; Meng, F.; Du, X.; Zeng, X.; Zhang, J.; et al. Identification of a Novel Functional Corticotropin-Releasing Hormone (CRH2) in Chickens and Its Roles in Stimulating Pituitary TSHβ Expression and ACTH Secretion. Front. Endocrinol. 2019, 10, 595. [Google Scholar] [CrossRef]
- Romero, L.M. Physiological Stress in Ecology: Lessons from Biomedical Research. Trends Ecol. Evol. 2004, 19, 249–255. [Google Scholar] [CrossRef] [PubMed]
- De Rosa, M.J.; Veuthey, T.; Florman, J.; Grant, J.; Blanco, M.G.; Andersen, N.; Donnelly, J.; Rayes, D.; Alkema, M.J. The Flight Response Impairs Cytoprotective Mechanisms by Activating the Insulin Pathway. Nature 2019, 573, 135–138. [Google Scholar] [CrossRef]
- Cui, Z.; Yin, J.; Wang, L.; He, L.; Yin, Y.; Li, T. Effects of Pro-Inflammatory Cytokines and Antioxidants Expression in the Jejunum of Mice Induced by Hydrogen Peroxide. Int. Immunopharmacol. 2016, 31, 9–14. [Google Scholar] [CrossRef] [PubMed]
- Hao, Y.; Ji, Z.; Shen, Z.; Xue, Y.; Zhang, B.; Yu, D.; Liu, T.; Luo, D.; Xing, G.; Tang, J.; et al. Increase Dietary Fiber Intake Ameliorates Cecal Morphology and Drives Cecal Species-Specific of Short-Chain Fatty Acids in White Pekin Ducks. Front. Microbiol. 2022, 13, 853797. [Google Scholar] [CrossRef]
- Koh, A.; De Vadder, F.; Kovatcheva-Datchary, P.; Bäckhed, F. From Dietary Fiber to Host Physiology: Short-Chain Fatty Acids as Key Bacterial Metabolites. Cell 2016, 165, 1332–1345. [Google Scholar] [CrossRef]
- Ali, Q.; Ma, S.; Farooq, U.; Liu, B.; Wang, Z.; Sun, H.; Cui, Y.; Li, D.; Shi, Y. Chronological Dynamics of the Gut Microbiome in Response to the Pasture Grazing System in Geese. Microbiol. Spectr. 2024, 12, e0418823. [Google Scholar] [CrossRef]
- Wellington, M.O.; Thiessen, R.B.; Van Kessel, A.G.; Columbus, D.A. Intestinal Health and Threonine Requirement of Growing Pigs Fed Diets Containing High Dietary Fibre and Fermentable Protein. Animals 2020, 10, 2055. [Google Scholar] [CrossRef]
- David, L.A.; Maurice, C.F.; Carmody, R.N.; Gootenberg, D.B.; Button, J.E.; Wolfe, B.E.; Ling, A.V.; Devlin, A.S.; Varma, Y.; Fischbach, M.A.; et al. Diet Rapidly and Reproducibly Alters the Human Gut Microbiome. Nature 2014, 505, 559–563. [Google Scholar] [CrossRef]
- Mann, E.R.; Lam, Y.K.; Uhlig, H.H. Short-Chain Fatty Acids: Linking Diet, the Microbiome and Immunity. Nat. Rev. Immunol. 2024, 24, 577–595. [Google Scholar] [CrossRef]
- Paradis, T.; Bègue, H.; Basmaciyan, L.; Dalle, F.; Bon, F. Tight Junctions as a Key for Pathogens Invasion in Intestinal Epithelial Cells. Int. J. Mol. Sci. 2021, 22, 2506. [Google Scholar] [CrossRef]
- Fang, Y.-L.; Chen, B.; Zhou, L.; Jin, Z.-J.; Sun, S.; He, Y.-W. The Anti-Activator QslA Negatively Regulates Phenazine-1-Carboxylic Acid Biosynthesis by Interacting with the Quorum Sensing Regulator MvfR in the Rhizobacterium Pseudomonas Aeruginosa Strain PA1201. Front. Microbiol. 2018, 9, 1584. [Google Scholar] [CrossRef]
- Ksiezarek, M.; Grosso, F.; Ribeiro, T.G.; Peixe, L. Genomic Diversity of Genus Limosilactobacillus. Microb. Genom. 2022, 8, 000847. [Google Scholar] [CrossRef] [PubMed]
- Lee, J.; Kim, S.; Kang, C.-H. Immunostimulatory Activity of Lactic Acid Bacteria Cell-Free Supernatants through the Activation of NF-κB and MAPK Signaling Pathways in RAW 264.7 Cells. Microorganisms 2022, 10, 2247. [Google Scholar] [CrossRef] [PubMed]
- Rodríguez-Sojo, M.J.; Ruiz-Malagón, A.J.; Rodríguez-Cabezas, M.E.; Gálvez, J.; Rodríguez-Nogales, A. Limosilactobacillus Fermentum CECT5716: Mechanisms and Therapeutic Insights. Nutrients 2021, 13, 1016. [Google Scholar] [CrossRef]
- Srimahaeak, T.; Bianchi, F.; Chlumsky, O.; Larsen, N.; Jespersen, L. In-Vitro Study of Limosilactobacillus Fermentum PCC Adhesion to and Integrity of the Caco-2 Cell Monolayers as Affected by Pectins. J. Funct. Foods 2021, 79, 104395. [Google Scholar] [CrossRef]
- Zhang, J.; Xiao, Y.; Wang, H.; Zhang, H.; Chen, W.; Lu, W. Lactic Acid Bacteria-Derived Exopolysaccharide: Formation, Immunomodulatory Ability, Health Effects, and Structure-Function Relationship. Microbiol. Res. 2023, 274, 127432. [Google Scholar] [CrossRef]
Disclaimer/Publisher’s Note: The statements, opinions and data contained in all publications are solely those of the individual author(s) and contributor(s) and not of MDPI and/or the editor(s). MDPI and/or the editor(s) disclaim responsibility for any injury to people or property resulting from any ideas, methods, instructions or products referred to in the content. |
© 2025 by the authors. Licensee MDPI, Basel, Switzerland. This article is an open access article distributed under the terms and conditions of the Creative Commons Attribution (CC BY) license (https://creativecommons.org/licenses/by/4.0/).