You are currently viewing a new version of our website. To view the old version click .
Agriculture
  • Article
  • Open Access

24 November 2025

Integrated Transcriptomic and Metabolomic Analyses Implicate Key Genes and Metabolic Pathways in Maize Lodging Resistance

,
,
,
,
,
,
,
,
and
1
School of Life Sciences, Anhui Agricultural University, Hefei 230000, China
2
SDIC Fengle Seed Co., Ltd., Hefei 230000, China
3
Inner Mongolia Academy of Agricultural and Animal Husbandry Sciences, Hohhot 010000, China
*
Authors to whom correspondence should be addressed.
This article belongs to the Special Issue Crop Yield Improvement in Genetic and Biology Breeding

Abstract

Maize stalk lodging causes substantial yield losses worldwide. Although stalk strength is a genetically determined trait, its molecular mechanisms—particularly the dynamic changes during key developmental stages—remain inadequately characterized due to limitations of single-omics approaches. This study employed an integrated transcriptomic and metabolomic analysis strategy to compare stalk tissues from three maize genotypes with contrasting lodging resistance: the highly resistant inbred line PHB1M, the susceptible inbred line Chang 7-2, and their recombinant inbred line 23NWZ561 (abbreviated as P, C, and Z, respectively). Dynamic sampling of all three genotypes was conducted at both grain-filling and maturity stages, with simultaneous measurement of physiological traits related to stalk strength. Phenotypic analysis revealed that the resistant genotype PHB1M exhibited superior rind penetration strength, cell wall composition (cellulose, hemicellulose, and lignin) content, and vascular bundle development. Multi-omics analysis indicated that the molecular basis of lodging resistance is primarily established during the maturity stage. The transcriptomic and metabolomic profiles of the recombinant inbred line Z shifted from clustering with the susceptible parent C at the grain-filling stage to grouping with the resistant parent P at maturity. Key pathways including phenylpropanoid biosynthesis were significantly enriched specifically at maturity, accompanied by upregulation of related genes (PAL, HCT, CCR) and accumulation of metabolites such as lignin precursors in PHB1M. Integrated analysis identified a core co-expression network within the phenylpropanoid pathway comprising three genes and three metabolites. This study systematically demonstrates that lodging resistance in maize is regulated by transcriptional and metabolic reprogramming during late stalk developmental stages, particularly at maturity, where enhanced activation of the phenylpropanoid biosynthesis pathway plays a central role. These findings provide valuable candidate genes and metabolic markers for breeding lodging-resistant maize varieties.

1. Introduction

Maize (Zea mays L.) is one of the world’s most crucial crops for grain production, animal feed, and bioenergy raw materials [], playing an irreplaceable role in ensuring global food security and promoting sustainable agricultural development [,]. However, in modern intensive agricultural systems, the widespread adoption of high-density planting and high nitrogen fertilizer application [] to pursue high yields has significantly increased the risk of stalk lodging [] while enhancing yield potential. Lodging has become one of the major bottlenecks limiting maize yield and quality improvement. Yield losses typically range from 5% to 20% [], and can even exceed 30% under extreme weather events or improper field management practices. These losses result not only from directly impaired grain filling and reduced kernel number per ear, but also from the difficulty in mechanical harvesting of lodged plants, leading to substantial losses from ear drop and grain shedding []. Furthermore, lodging severely compromises grain quality traits (such as reduced test weight and increased mold incidence) and nutritional value as silage feed [], creating a dual negative impact on the economic returns of agricultural production. Stalk lodging fundamentally stems from insufficient mechanical strength, involving complex interactions among multiple factors including anatomical structure, cell wall chemical composition, and stress resistance physiological functions [,,].
Studies have shown that stalk morphological structure (such as internode length-to-diameter ratio and ear height) and mechanical properties are closely related to the number, distribution of vascular bundles, and the development degree of sclerenchyma tissue [,,]. Specifically, higher levels of lignin, cellulose, and hemicellulose significantly enhance stalk mechanical strength by reinforcing the structural integrity of the cell wall and vascular tissues []. The morphology and number of vascular bundles are also key influencing factors [,,]. For instance, a reduced number of or malformed vascular bundles in maize brittle stalk mutants bk2 and bk4, and insufficient sclerenchyma thickness in mutants like bc1 and bc5, all lead to increased stalk brittleness [,,]. Changes in cell wall composition are also closely associated with stalk brittleness []. The content and proportion of cellulose, hemicellulose, and lignin show significant variations in brittle stalk mutants of different crops. For example, only cellulose content is reduced in the rice cwa1 [] and barley fs2 mutants; whereas the rice bc5 and maize bk4 mutants exhibit significant decreases in cellulose, hemicellulose, and lignin []. Furthermore, in some mutants (such as rice bc1, sorghum sbbc1, and maize bk2) [,], lignin content increases while cellulose and hemicellulose contents decrease [,], and in the rice bc6 mutant, the contents of cellulose and hemicellulose are inversely correlated []. These studies systematically reveal the critical role of cell wall composition in the formation of stalk lodging resistance.
At the molecular mechanism level, the development of high-throughput sequencing and metabolomics technologies provides powerful tools for systematically analyzing lodging resistance [,,]. Transcriptomics enables genome-wide identification of differentially expressed genes related to stalk development and stress resistance [,], while metabolomics allows for the qualitative and quantitative analysis of small molecule metabolites in organisms. Numerous studies have shown that the phenylpropanoid biosynthesis pathway plays a central role in lignin synthesis and stalk strength formation, with the expression of key enzyme genes such as PAL, 4CL [], and CAD [] being closely related to lignin monomer synthesis [,,]. However, despite numerous studies based on single-omics approaches, the vast majority have failed to integrate multi-level data to systematically analyze the “gene–metabolite–phenotype” regulatory network, thus making it difficult to fully reveal the molecular landscape and key drivers of maize lodging resistance.
With the continuous advancement of next-generation sequencing and mass spectrometry technologies, RNA-Seq and non-targeted metabolomics have become key methods for integrated multi-omics analysis [,,,,]. RNA-Seq offers high sensitivity and high throughput, enabling precise capture of differentially expressed genes in stalk tissues at different developmental stages []; non-targeted metabolomics can systematically detect hundreds to thousands of metabolites, including phenylpropanoids and flavonoids, laying the data foundation for constructing gene–metabolite interaction networks.
Maize stalk lodging resistance develops progressively from the grain-filling to maturity stages, accompanied by transcriptional reprogramming and specific accumulation of key metabolites []. To systematically elucidate the molecular basis of stalk lodging resistance in maize, this genetic population exhibiting continuous natural variation in lodging resistance was employed. The population provides an optimal system for identifying key transcriptional and metabolic regulators of stalk strength. By integrating multi-omics data with key physiological traits, we aim to systematically unravel their intrinsic relationships, identify differentially expressed genes and differentially accumulated metabolites closely associated with lodging resistance, and ultimately construct a gene–metabolite co-regulatory network. The anticipated findings are expected to provide profound insights into the mechanistic roles of phenylpropanoid pathway and cell wall composition in lodging resistance, thereby establishing a theoretical foundation and supplying valuable candidate genes and metabolic markers for breeding lodging-resistant maize varieties.

2. Materials and Methods

2.1. Plant Materials and Treatments

This study utilized three maize inbred lines with distinct genetic backgrounds and different lodging resistance: Chang 7-2 (C), a foundational parent in Chinese maize breeding that is highly susceptible to lodging; PHB1M (P), representing the widely used Pioneer germplasm and exhibiting strong lodging resistance; and 23NWZ561 (Z), a recombinant inbred line derived from a biparental cross between Chang 7-2 and PHB1M followed by successive selfing. Throughout the text and figures, these genotypes are consistently referred to as C, P, and Z, respectively (Table 1). The field experiment was conducted during the 2023 growing season at the experimental station of the Inner Mongolia Academy of Agricultural & Animal Husbandry Sciences, Hohhot, China (40°51′ N, 110°46′ E). A randomized complete block design (RCBD) was implemented with three replications. To eliminate the environmental effects on stalk lodging, all genotypes were subjected to identical agronomic management. This included a uniform fertilizer application totaling 150 kg N/ha, 75 kg P2O5/ha, and 75 kg K2O/ha, and scheduled irrigation that maintained soil moisture above 65% of field capacity throughout the growing season. The planting density was uniformly set at 67,500 plants per hectare (equivalent to 4500 plants per Chinese mu).
Table 1. Sample information and nomenclature used in this study.
Sampling for Multi-Omics and Physiological Analysis: At both the grain-filling (R3) and physiological maturity (R6) stages, five representative plants per genotype per replicate were selected. The tenth internode, identified as a key segment determining stalk strength, was excised. Each internode was divided into three parts: one segment was immediately frozen in liquid nitrogen and stored at −80 °C for subsequent transcriptomic and metabolomic analyses; the adjacent segment was used for the immediate measurement of rind penetration strength (RPS); and the third segment was oven-dried and ground for the determination of cell wall composition (cellulose, hemicellulose, and lignin).

2.2. Measurement of Phenotypic and Physiological Parameters

At both the grain-filling and physiological maturity stages, five representative plants were randomly selected from each replicate plot of the three maize genotypes. The tenth internode, a key segment determining stalk strength, was excised for subsequent physiological and anatomical analyses. The rind penetration strength (RPS) of the tenth internode was measured at both grain-filling and maturity stages using a YYD-1 stalk strength tester (Zhejiang TOP Instruments Co., Ltd., Hangzhou, China). Measurements were taken at the midpoint of the internode using a 1 mm diameter plunger at a constant penetration speed of 5 mm min−1. The contents of cellulose, hemicellulose, and lignin in the dried and ground stalk tissues were determined following the standard Van Soest method [], using an ANKOM2000 fiber analyzer (ANKOM Technology, Macedon, NY, USA) or equivalent system. For scanning electron microscopy (SEM), fresh segments (approximately 5 mm in thickness) from the tenth internode were collected within 1–3 min after excision and immediately rinsed with 0.1 M phosphate buffer (PBS, pH 7.4) to remove surface debris. The samples were primarily fixed in 2.5% glutaraldehyde in 0.1 M PBS at 4 °C for 24 h, followed by post-fixation with 1% osmium tetroxide in the same buffer for 2 h at room temperature. After fixation, the samples were dehydrated through a graded ethanol series (30%, 50%, 70%, 80%, 90%, 95%, and 100%), transferred to isoamyl acetate, and critically point-dried using a Leica EM CPD300 dryer (Leica Microsystems, Wetzlar, Hesse, Germany). The dried samples were mounted on aluminum stubs, sputter-coated with a thin layer of gold, and observed under a scanning electron microscope (Hitachi SU8100, Tokyo, Japan). Approximately 20 representative micrographs were captured per sample for morphological analysis.

2.3. Total RNA Extraction, Gene Expression Analysis and Gene Functional Annotation

Freshly harvested stem tissues from the tenth internode were immediately frozen in liquid nitrogen and stored at −80 °C until RNA extraction. Total RNA was extracted from each biological replicate (n = 3–5 per genotype and stage) using the TIANGEN Polysaccharide & Polyphenol Plant RNA Kit (TIANGEN, Beijing, China). RNA integrity and purity were rigorously assessed by 1.5% agarose gel electrophoresis, a NanoDrop 2000 spectrophotometer (Thermo Scientific, Waltham, MA, USA) to confirm A260/A280 ratios between 1.8 and 2.2, and an Agilent 2100 Bioanalyzer (Agilent Technologies, Santa Clara, CA, USA) to ensure all samples had an RNA Integrity Number (RIN) greater than 7.0. Sequencing libraries were prepared following the manufacturer’s protocol (Illumina, San Diego, CA, USA), which included mRNA enrichment using oligo(dT) beads, fragmentation, double-stranded cDNA synthesis, end repair, adenylation, adapter ligation, and PCR amplification. The qualified libraries were pair-end sequenced (150 bp) on an Illumina NovaSeq X Plus platform at GeneDenovo Biotechnology Co., Ltd. (Guangzhou, China). Raw sequencing reads were processed with fastp (v0.23.4) (https://github.com/OpenGene/fastp, accessed on 15 September 2024) to remove adapters and low-quality bases (parameters: -q 20 -u 30 -n 10 --length_required 100). Ribosomal RNA reads were filtered by aligning to a maize rRNA database using bowtie2 (v2.5.1) (http://bowtie-bio.sourceforge.net/bowtie2/index.shtml, accessed on 15 September 2024) []. The high-quality clean reads were then aligned to the maize reference genome (B73 RefGen_v4) using HISAT2 (v2.2.1) [] with default parameters. Transcriptome assembly and the identification of novel transcripts were performed using StringTie (v2.2.1) [] with the ‘-e’ and ‘-B’ options for guided assembly and output for ballgown. Gene expression levels were quantified as expected counts using RSEM (v1.3.3) []. These expected counts, representing the raw expression data for each gene, were used as the input for differential expression analysis with DESeq2. Additionally, Transcripts Per Million (TPM) values were calculated for the purpose of cross-sample comparisons of gene expression levels.

2.4. Differential Gene Expression and Enrichment Analysis

Differential gene expression analysis between pairwise comparison groups was performed using the DESeq2 R package (v1.40.2; Love et al., 2014) []. The expected counts generated by RSEM were used as the direct input for DESeq2. The DESeq2 analysis procedure included data normalization based on the median of ratios method, dispersion estimation, and negative binomial generalized linear model fitting. Significance was tested using the Wald test, and p-values were adjusted for multiple testing using the Benjamini–Hochberg procedure to control the false discovery rate (FDR). Genes with an adjusted p-value (FDR) < 0.05 and an absolute log2 fold change |log2FC| > 1 were defined as significantly differentially expressed genes (DEGs). To visualize the results, volcano plots were generated using the ggplot2 R package (v3.4.4) to display the overall distribution of DEGs. Furthermore, hierarchical clustering of the normalized expression values (variance-stabilizing transformed counts) for the DEGs was performed and visualized as heatmaps using the pheatmap R package (v1.0.12). Z-score normalization was applied across each row (gene) to better compare expression patterns across samples.
To interpret the biological functions of the identified DEGs, Gene Ontology (GO) and Kyoto Encyclopedia of Genes and Genomes (KEGG) pathway enrichment analyses were conducted using the clusterProfiler R package (v4.8.2) []. Significantly over-represented GO terms (across Biological Process, Molecular Function, and Cellular Component categories) and KEGG pathways were identified using a hypergeometric test, with the set of all genes expressed in the stalks serving as the background. The resulting p-values were adjusted for multiple testing using the Benjamini–Hochberg method, and terms with an adjusted p-value < 0.05 were considered significantly enriched.

2.5. Quantitative Reverse Transcription Polymerase Chain Reaction

Total RNA was extracted from approximately 100 mg of fresh stem tissue (tenth internode) from three maize varieties using the RNA-Easy Isolation Kit (Vazyme Biotech Co., Ltd., Nanjing, China). RNA concentration and purity (A260/A280 ratio between 1.8 and 2.2) were measured with a NanoDrop 2000, and integrity was verified by agarose gel electrophoresis. Subsequently, 1 μg of total RNA was reverse-transcribed into cDNA using the Evo M-MLV Reverse Transcription Premix (Accurate Biology, Changsha, China). Quantitative real-time PCR (qRT-PCR) was performed on a LightCycler 96 system (Roche Diagnostics Corporation, Indianapolis, IN, USA) using the SYBR Green SupTaq HS Premixed qPCR Kit (Accurate Biology). Each 20 μL reaction mixture contained 1X SYBR Green Premix, 10 μM of each primer (Table S1), and 2 μL of diluted cDNA template. The amplification protocol consisted of an initial denaturation at 95 °C for 5 min, followed by 40 cycles of 95 °C for 10 s and 60 °C for 30 s, and a melt curve analysis from 65 °C to 95 °C. Three biological replicates, each with three technical replicates, were included for all analyses. The primer sequences for the ten target genes are listed in Table S1, and the amplification efficiency for each primer pair ranged from 95% to 105%. Gene expression levels were calculated using the comparative 2^(–ΔΔCt) method [], with the maize ACTIN gene serving as the internal reference.

2.6. Metabolite Extraction and Analysis

For metabolomic analysis, approximately 100 mg of frozen powdered tissue was homogenized in 500 μL of 80% aqueous methanol, vortexed, and incubated on ice for 5 min. After centrifugation (15,000× g, 4 °C, 20 min), the supernatant was diluted with MS-grade water to 53% methanol and centrifuged again. The final supernatant was analyzed by LC-MS. Mass spectrometry was performed in both positive and negative ionization modes with the following settings: Curtain Gas: 35 psi, Collision Gas: medium, Temperature: 550 °C, Ion Source Gas 1 and 2: 60, IonSpray Voltages: 5500 V (positive) and −4500 V (negative). Compounds were detected using multiple reaction monitoring (MRM) based on a local metabolite database. Quantification utilized the Q3 (product ion) signal, while identification was based on Q1 (precursor ion), Q3, retention time, declustering potential, and collision energy. Chromatographic peaks were integrated and calibrated in SCIEX OS v1.4 with a minimum peak height of 500, signal-to-noise ratio ≥ 5, and 1 smoothing point. Metabolite relative abundance was calculated based on peak area. Significantly differential metabolites were identified by combining variable importance in projection (VIP) scores from OPLS-DA models with p-values from Student’s t-tests, using thresholds of VIP ≥ 1 and p < 0.05.

2.7. Transcriptome and Metabolome Analysis

To investigate the interrelationships between transcriptional and metabolic changes, an integrated analysis of transcriptomic and metabolomic data was performed. The analysis focused on the differentially expressed genes (DEGs) and differentially accumulated metabolites (DAMs) identified from comparisons across genotypes and developmental stages (as described in Section 2.4 and Section 2.6, respectively). First, a joint KEGG pathway enrichment analysis was conducted. The DEGs and DAMs were collectively mapped to the KEGG database. Pathways significantly co-enriched by both DEGs and DAMs were identified using a hypergeometric test, with all annotated maize genes and metabolites as the background. Pathways with an adjusted p-value < 0.05 were deemed to be key regulatory pathways potentially central to lodging resistance.
Subsequently, to construct a gene–metabolite regulatory network, we focused specifically on components within the phenylpropanoid biosynthesis pathway (map00940), which was highlighted by the joint enrichment analysis. Pearson correlation analysis was performed between the expression levels of all pathway-associated DEGs and the abundance of all pathway-associated DAMs across all samples. Significant gene–metabolite pairs with |Pearson correlation coefficient (r)| > 0.8 and a p-value < 0.05 were selected for network construction. The resulting correlation network was visualized using Cytoscape (v3.9.1) to illustrate the core regulatory modules within the pathway.

2.8. Statistical Analysi

In this study, all statistical analyses were performed using SPSS v.22.0 (SPSS Inc., Chicago, IL, USA), with data presented as mean ± SEM from repeated measurements. Differences among multiple groups (among the three genotypes within a stage) were assessed by one-way ANOVA followed by LSD tests. ImageJ software (version 1.53t) (National Institutes of Health, Bethesda, MD, USA) was employed for image analysis. All figures were generated using OriginPro 2021.

3. Results

3.1. Phenotypic and Physiological Parameters of the Three Maize Varieties

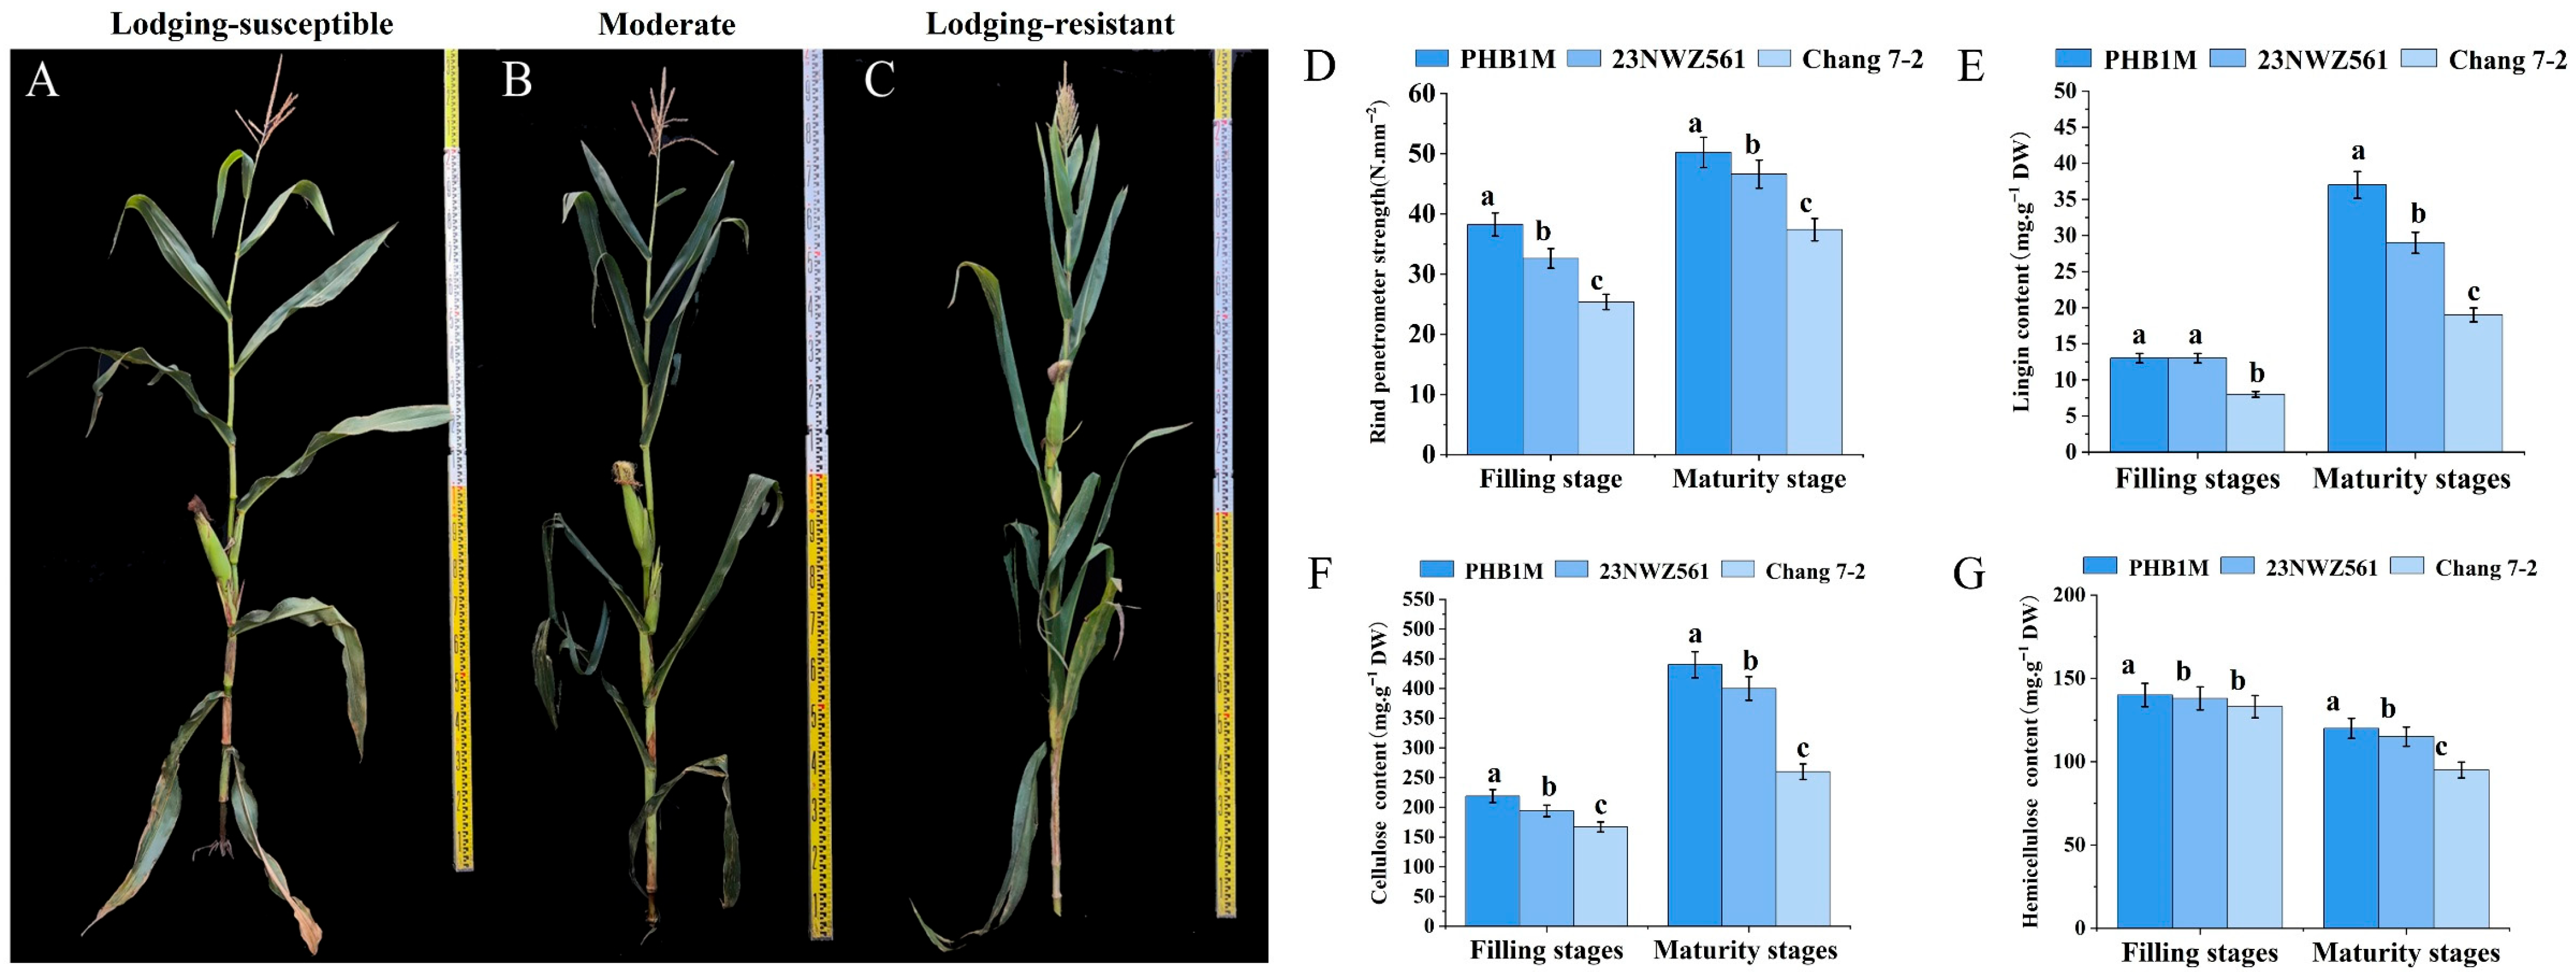
To examine phenotypic variations associated with lodging resistance, we analyzed physiological and anatomical traits in three maize inbred lines: lodging-resistant (P), susceptible (C), and their moderately resistant recombinant progeny (Z). The rind penetration strength (RPS) of stalks was measured in the three genotypes C (Figure 1A), Z (Figure 1B), and P (Figure 1C) at both the grain-filling and maturity stages. At the grain-filling stage, the mean RPS values were 25.38 N·mm−2, 32.62 N·mm−2, and 38.23 N·mm−2 (Figure 1D), respectively, which increased to 37.38 N·mm−2, 46.61 N·mm−2, and 50.23 N·mm−2 at maturity (Figure 1D). Compared to P and Z, the lodging-susceptible variety C had significantly lower RPS at both the grain-filling and maturity stages (p < 0.05, one-way ANOVA with LSD post hoc test).
Figure 1. Phenotypic and physiological parameters of the three maize varieties with different lodging resistance. (AC): (A) Representative whole-plant phenotypes of Chang 7-2, (B) 23NWZ561, (C) PHB1M. (DG): (D) Comparisons of rind penetration strength (RPS), (E) lignin content, (F) cellulose content, (G) hemicellulose content at the grain-filling and maturity stages. Data are presented as mean ± SEM (n ≥ 3). Different lowercase letters above bars indicate significant differences among varieties within the same stage (p < 0.05, one-way ANOVA with LSD post hoc test).
As major structural components of the cell wall, the accumulation of lignin (Figure 1E), cellulose (Figure 1F), and hemicellulose (Figure 1G) is closely associated with stalk mechanical strength. Measurements across both developmental stages revealed a consistent trend among varieties: P had the highest contents of all three components, while C had the lowest, with significant differences observed between varieties (p < 0.05, one-way ANOVA with LSD post hoc test). Notably, hemicellulose content decreased at maturity, whereas cellulose and lignin contents increased significantly.
Anatomical analysis further indicated significant differences in vascular bundle number and cross-sectional area among the three varieties (Figure 2). PHB1M possessed the highest number of vascular bundles (Figure 2M) and the largest cross-sectional area (Figure 2N), followed by 23NWZ561, while Chang 7-2 showed the lowest values for both traits. In summary, multiple lines of evidence including mechanical properties, cell wall composition, and vascular bundle characteristics collectively demonstrate significant differences in stalk lodging resistance among the three maize varieties, with PHB1M exhibiting the strongest resistance and Chang 7-2 the weakest.
Figure 2. Microscopic structure and morphometric analysis of stalk vascular bundles in three maize varieties with different lodging resistance. (AC) Overall distribution of vascular bundles in stalk cross-sections at the grain-filling stage (scale bar = 1.0 mm). (DF) High-magnification images of individual vascular bundles at the grain-filling stage (scale bar = 500 μm). (GI) Overall distribution of vascular bundles at the maturity stage (scale bar = 1.0 mm). (JL) High-magnification images of individual vascular bundles at the maturity stage (scale bar = 500 μm). Images for each stage correspond to Chang 7-2 (A,D,G,J), 23NWZ561 (B,E,H,K), and PHB1M (C,F,I,L), respectively. (M) Number of vascular bundles per unit area. (N) Cross-sectional area of individual vascular bundles. Data are presented as mean ± SEM (n ≥ 5). Different lowercase letters above bars indicate significant differences among varieties within the same stage (p < 0.05, one-way ANOVA with LSD post hoc test).

3.2. Transcriptomic Analysis of Stalk Internodes in Three Maize Varieties at Filling and Maturity Stages

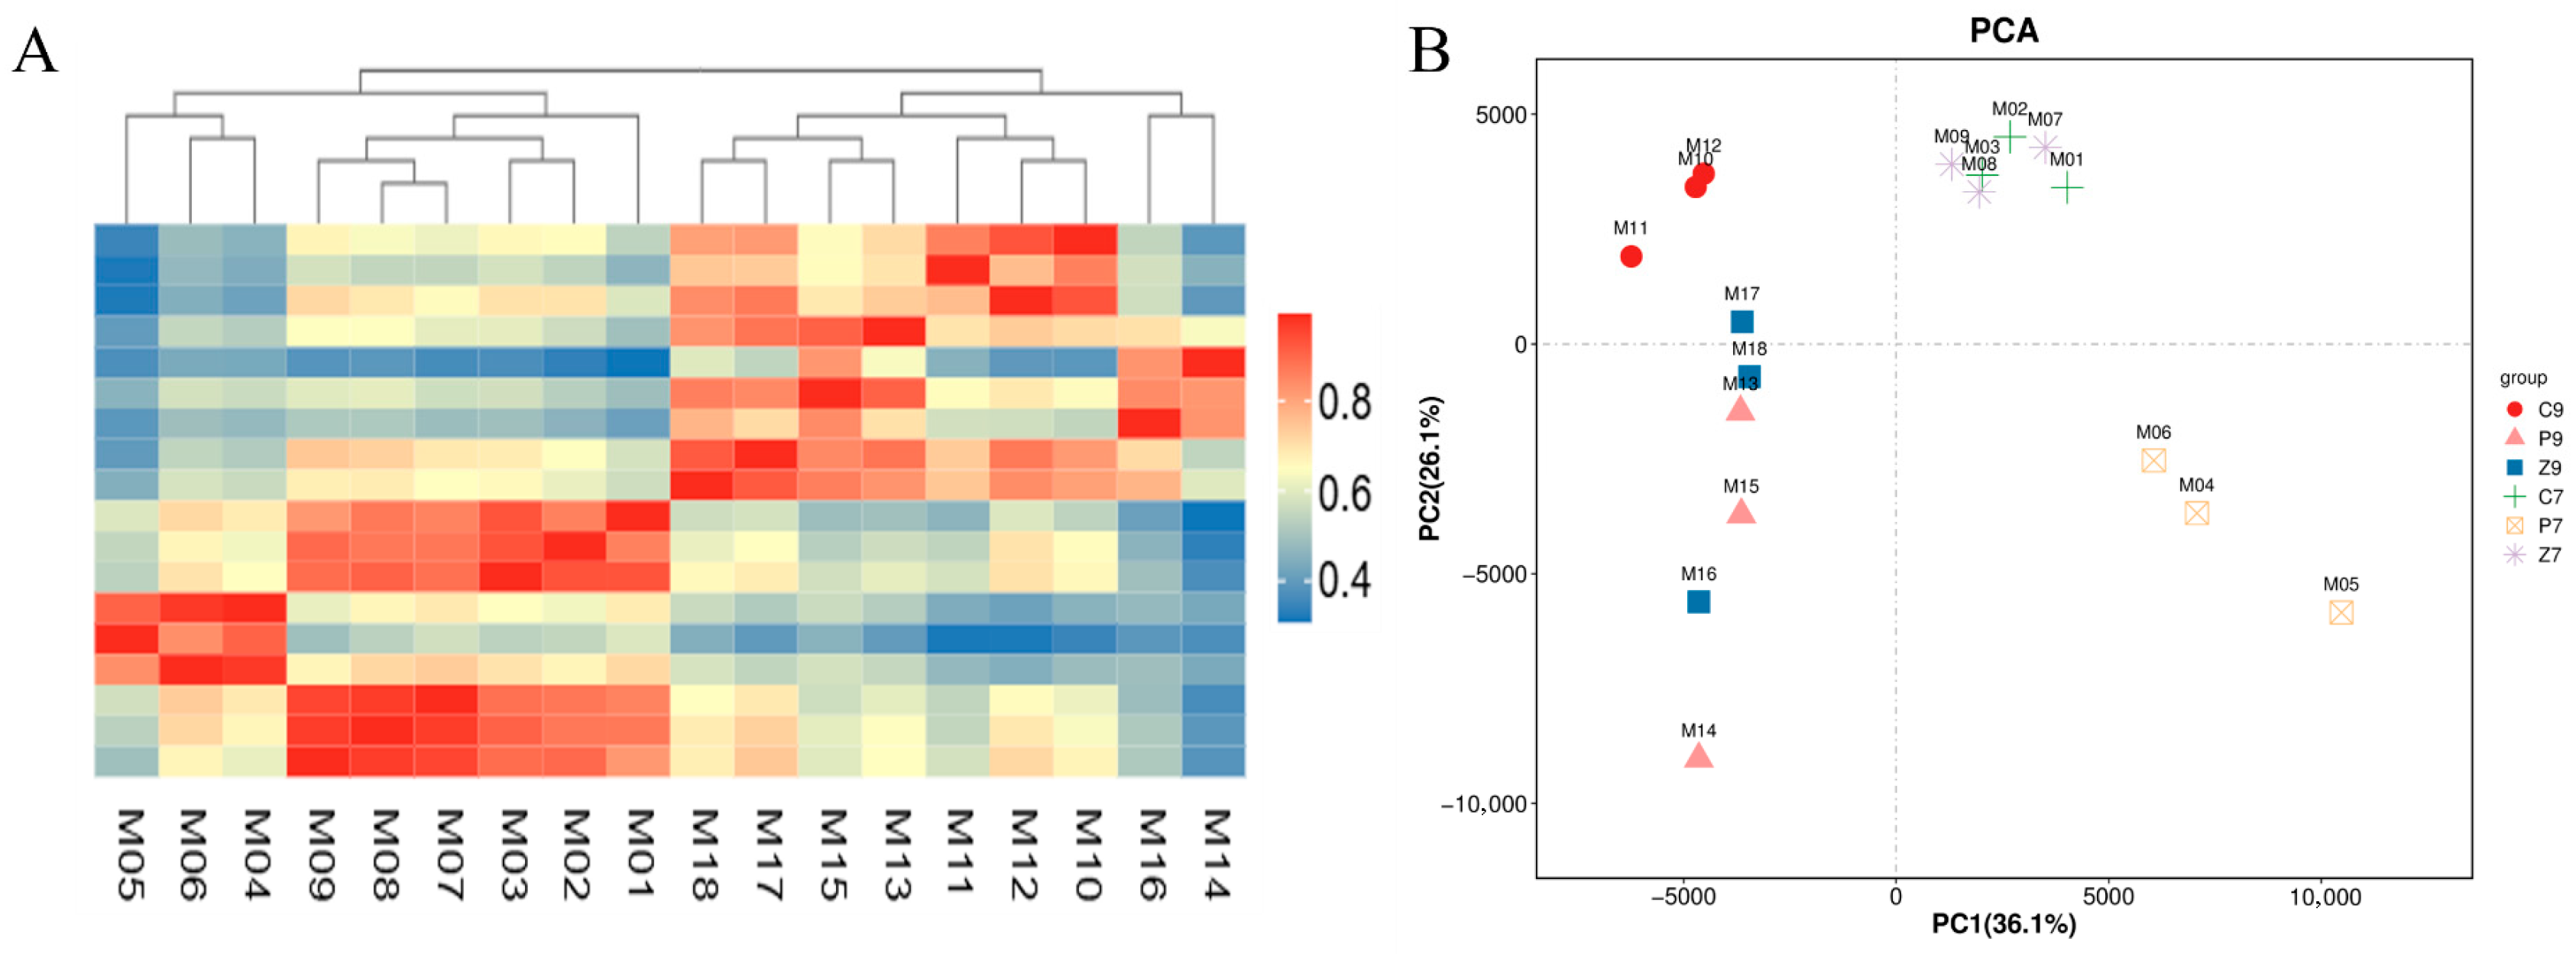
To elucidate the molecular mechanisms regulating stalk lodging resistance in maize, this study selected three varieties with varying degrees of lodging resistance: the highly resistant P, the moderately resistant recombinant inbred line Z (Z, derived from P × C), and the susceptible C. Comparative transcriptome analysis of stalk tissues collected at both filling and maturity stages identified a total of 21,087 differentially expressed genes (DEGs) from 10 pairwise comparisons. Both heatmap (Figure 3A) and principal component analysis (PCA) (Figure 3B) demonstrated that developmental stage served as the primary factor driving gene expression patterns, with PC1 clearly separating samples by developmental stage. Notably, the moderately resistant variety Z exhibited distinct developmental stage-specific transcriptional dynamics. During the filling stage, its transcriptomic profile clustered with the susceptible C, while at maturity it shifted to cluster with the highly resistant P. This dynamic shift indicates that the molecular basis of stalk lodging resistance is progressively established through transcriptional reprogramming during later developmental stages.
Figure 3. Transcriptomic profiling of stalk internodes across developmental stages in three maize varieties with different lodging resistance. (A) Heatmap showing hierarchical clustering of differentially expressed genes (DEGs). Sample labels M01-M18 represent biological replicates of: Chang 7-2 (C, lodging-susceptible), PHB1M (P, lodging-resistant), and 23NWZ561 (Z, moderately resistant) at grain-filling (M01-M08) and maturity (M10-M18) stages. (B) Principal component analysis (PCA) of transcriptome profiles. Samples are distinguished by both genotype and developmental stage: Chang 7-2 at grain-filling (C7, green plus signs) and maturity (C9, red circles); PHB1M at grain-filling (P7, orange envelopes) and maturity (P9, orange triangles); 23NWZ561 at grain-filling (Z7, purple asterisks) and maturity (Z9, blue squares). The clear separation along PC1 (36.1% of variance) primarily reflects developmental stage progression, while PC2 (26.1% of variance) captures genotype-specific variation.

3.3. DEGs Enrichment Analysis

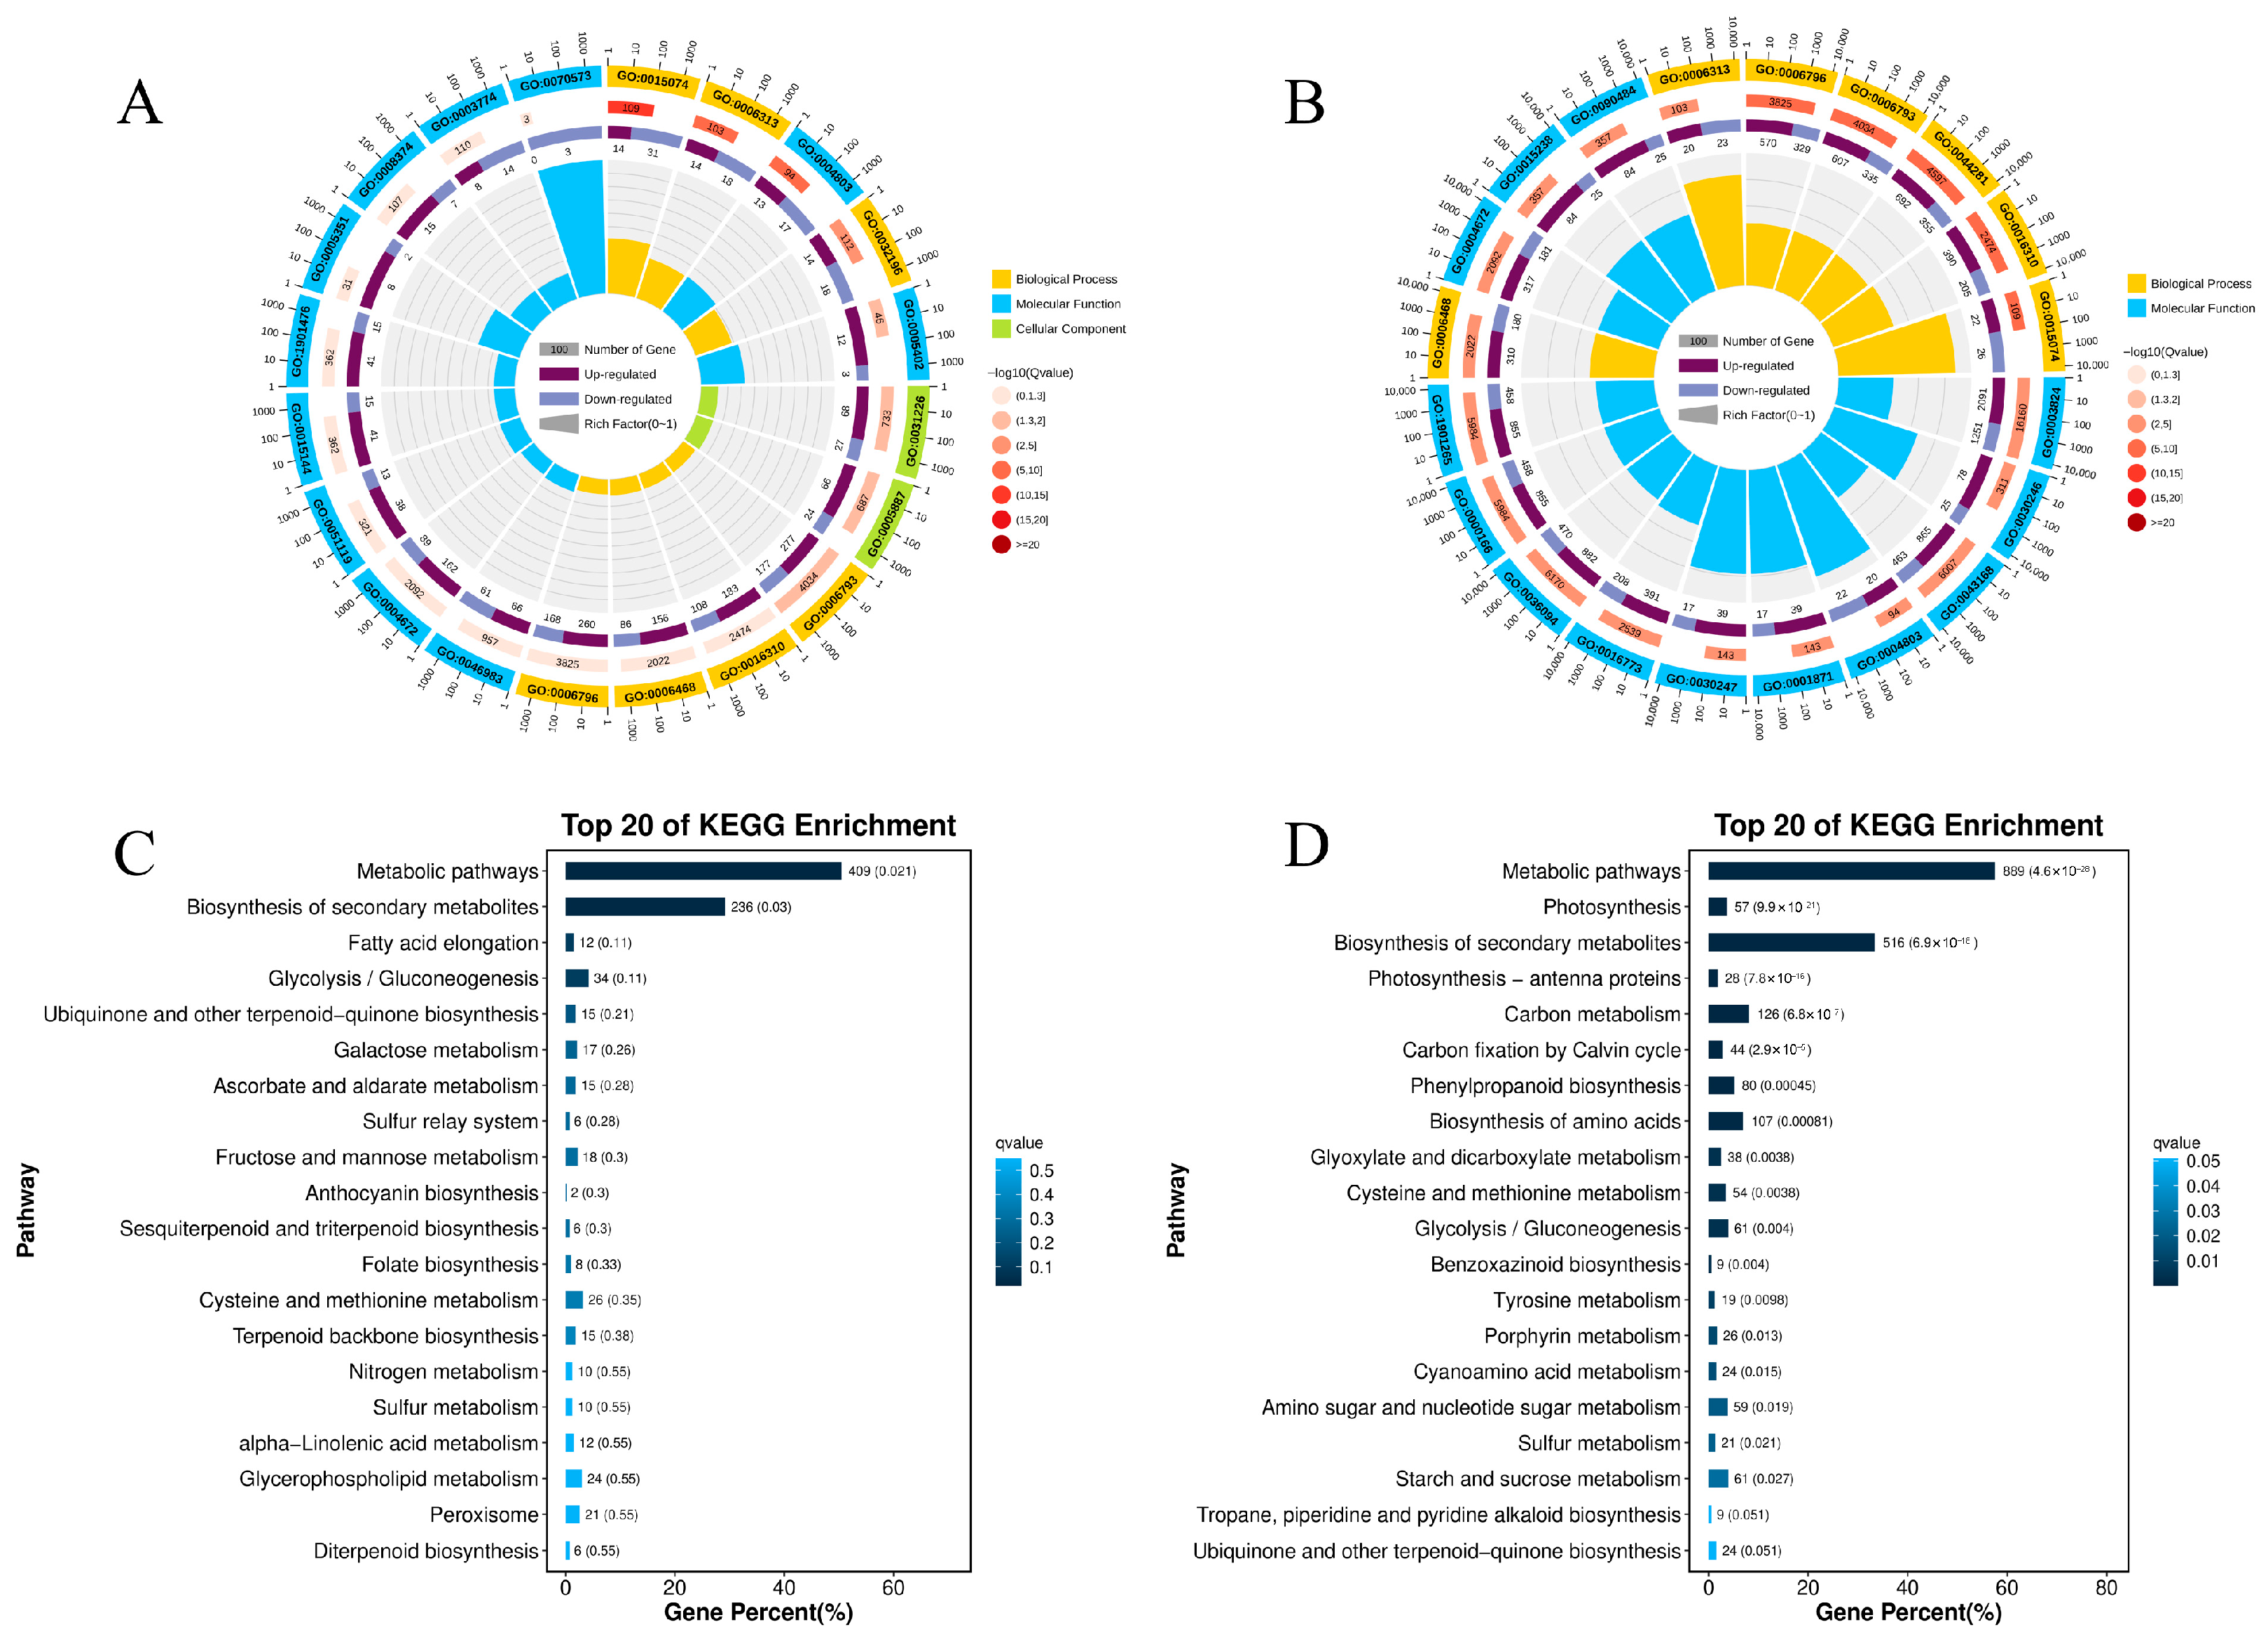
To elucidate the developmental dynamics underlying stalk lodging resistance in maize, we performed GO functional and KEGG pathway enrichment analyses on differentially expressed genes (DEGs) from the filling-stage comparison (C7 vs. Z7) and the maturity-stage comparison (Z9 vs. P9). The results revealed that at the filling stage, no KEGG pathways directly associated with stalk mechanical strength were significantly enriched between the two materials (Figure 4C). GO analysis (Figure 4A) indicated that the DEGs were primarily involved in basic metabolic processes such as carbohydrate transmembrane transport (GO:0034219; GO:0008643), ion transport (GO:0006820), and transmembrane transport (GO:0055085). Although terms related to cell wall macromolecule metabolic process (GO:0044036) were present, they were accompanied by catabolic activity (GO:0016998), suggesting that this stage is predominantly characterized by assimilate translocation to grains and cell wall remodeling, with no initiation of a systematic lodging resistance reinforcement mechanism. By contrast, at maturity, KEGG analysis identified significant enrichment in the phenylpropanoid biosynthesis pathway (Figure 4D). Key genes in this pathway (PAL, C4H, 4CL, CCR) were up-regulated in the highly resistant genotype PHB1M, promoting the accumulation of lignin and other compounds that enhance cell wall strength. Concurrently, GO analysis (Figure 4B) showed significant enrichment of DEGs in functions such as “polysaccharide binding” (GO:0030247), “carbohydrate binding” (GO:0030246), and “protein kinase activity” (GO:0004672; GO:0016301), indicating the activation of a kinase signaling-mediated network regulating cell wall synthesis and assembly during maturity. These findings collectively demonstrate that stalk lodging resistance in maize is not determined at the early filling stage but is progressively established during later development through the stage-specific activation of phenylpropanoid metabolism and cell wall reinforcement programs.
Figure 4. (A) GO enrichment circle plot for Chang 7-2 (C7) vs. 23NWZ561 (Z7) at the filling stage. (B) GO enrichment circle plot for 23NWZ561 (Z9) vs. PHB1M (P9) at the maturity stage. (C) KEGG enrichment bar plot for Chang 7-2 (C7) vs. 23NWZ561 (Z7) at the filling stage. (D) KEGG enrichment bar plot for 23NWZ561 (Z9) vs. PHB1M (P9) at the maturity stage.

3.4. Metabolomic Analysis and Metabolite Identification

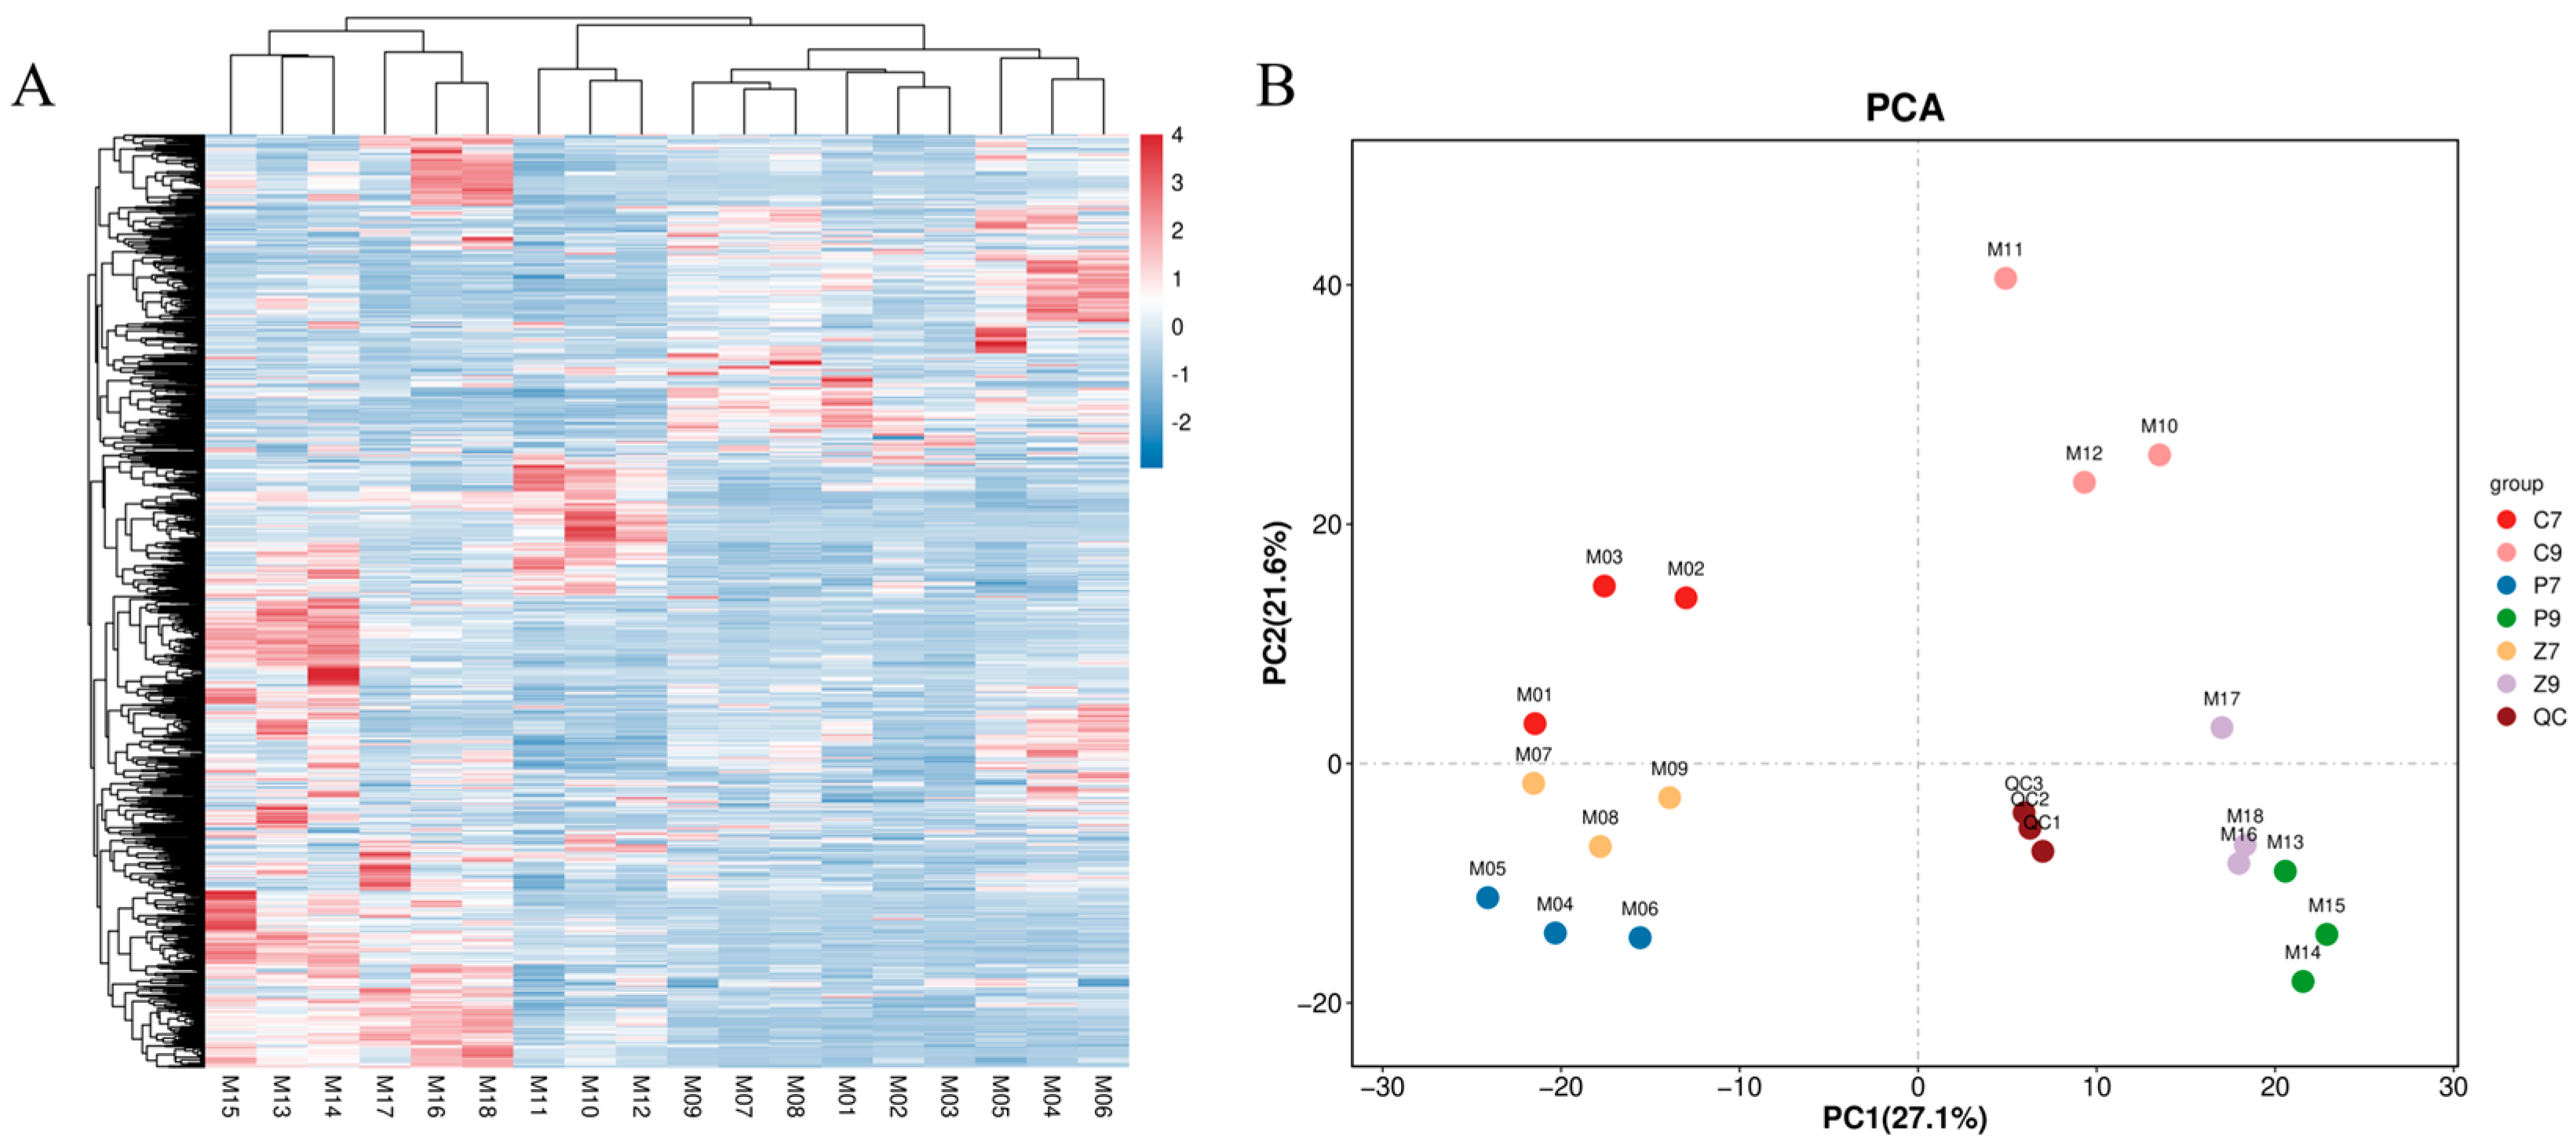
To investigate the metabolic basis of stalk lodging resistance, we conducted a non-targeted metabolomic analysis on stalk tissues from the three maize varieties at both filling and maturity stages. A total of 665 differentially accumulated metabolites (DAMs) were identified across all comparisons. These DAMs were primarily categorized into several key classes, including flavonoids, nucleotides and derivatives, organic acids and derivatives, lipids, phenolic acids, alcohols and polyols, phenylpropanoids and polyketides, and amino acids and derivatives, indicating a comprehensive rewiring of metabolism associated with lodging resistance. Notably, the overall metabolic profiles exhibited a striking consistency with the transcriptomic patterns. Both hierarchical clustering analysis (heatmap) and principal component analysis (PCA) demonstrated that, at the filling stage, the metabolic profile of the moderately resistant line 23NWZ561 (Z7) clustered closely with that of the susceptible line Chang 7-2 (C7). In contrast, by the maturity stage, the metabolism of 23NWZ561 (Z9) shifted to cluster with the highly resistant line PHB1M (P9). This dynamic trajectory of the metabolome strongly suggests that the metabolic reprogramming underlying lodging resistance is a developmentally regulated process. The convergence of the metabolic profile of 23NWZ561 towards that of PHB1M at maturity provides compelling evidence that the key metabolites contributing to stalk strength are predominantly synthesized and accumulated during the later stages of development (Figure 5).
Figure 5. Metabolomic profiling of stalk tissues across developmental stages in three maize varieties with different lodging resistance. (A) Heatmap of differentially accumulated metabolites (DAMs), based on hierarchical clustering analysis (Sample labels M01-M18 represent biological replicates of: Chang 7-2 (C, lodging-susceptible), PHB1M (P, lodging-resistant), and 23NWZ561 (Z, moderately resistant) at grain-filling (M01-M08) and maturity (M10-M18) stages). (B) Principal component analysis (PCA) of metabolome profiles. Samples are distinguished by genotype and developmental stage: Chang 7-2 at grain-filling (C7, red circles) and maturity (C9, pink circles); PHB1M at grain-filling (P7, blue circles) and maturity (P9, green circles); 23NWZ561 at grain-filling (Z7, orange circles) and maturity (Z9, purple circles). Brown circles represent quality control (QC) samples. Principal components 1 and 2 explain 36.1% and 26.1% of the total variance, respectively.

3.5. Integrated Transcriptomic and Metabolomic Analysis Reveals a Core Regulatory Module in the Phenylpropanoid Pathway

Through integrated transcriptomic and metabolomic analysis, this study provides an in-depth exploration of the genetic and metabolic regulatory basis underlying stalk lodging resistance in maize. Joint KEGG pathway enrichment analysis (Figure S1) revealed that the phenylpropanoid biosynthesis pathway was significantly enriched at both the differentially expressed gene (DEG) and differentially accumulated metabolite (DAM) levels (Figure 6A), indicating its central role in regulating stalk mechanical strength. To further elucidate the regulatory relationships within this pathway, a Pearson correlation network between genes and metabolites annotated to this pathway was constructed (Figure 6B). Overall, the analysis identified a core co-expression network comprising 3 genes and 3 metabolites with significant correlations (|r| > 0.8, p < 0.05). Figure 6B highlights the most robust correlations within this network, involving 3 key structural genes and 3 core metabolites. Specifically, coniferyl alcohol (Com_763_neg), a precursor for lignin monomer synthesis, showed significant positive correlations with CCR (cinnamoyl-CoA reductase, Zm00001d032152 and Zm00001d045101), PAL (phenylalanine ammonia-lyase, Zm00001d017274), and HCT (shikimate/quinate hydroxycinnamoyl transferase, Zm00001d020528). In contrast, the pathway precursor L-phenylalanine (Com_287_pos) was negatively correlated with the expression of PAL and HCT, and the intermediate hydroxycinnamic acid (Com_411_pos) was also negatively correlated with HCT expression. These negative correlations potentially reflect complex balancing mechanisms such as metabolic feedback regulation or substrate competition within the pathway, indicating a fine-tuned regulatory mechanism to balance metabolic flux. Notably, the expression of these key genes (PAL, HCT, CCR) was significantly up-regulated in the stalks of the lodging-resistant variety PHB1M at the maturity stage, a pattern independently validated by qRT-PCR (Figure S2). Concurrently, the corresponding metabolites showed a synchronized accumulation trend in P. This highly coordinated up-regulation of gene expression and metabolite accumulation, both temporally and in magnitude, reveals a core regulatory module of the phenylpropanoid pathway that is specifically activated during the mature stage of stalk development. The discovery of this gene–metabolite network not only elucidates the molecular mechanism underlying enhanced lignin biosynthesis in lodging-resistant materials at a systems level but also provides new insights into the metabolic basis of cell wall reinforcement and stalk strength formation. This study demonstrates that the superior lodging resistance of P is closely associated with the efficient activation of the phenylpropanoid biosynthesis module during critical developmental stages.
Figure 6. Diagram of the phenylpropanoid pathway in maize. (A) Phenylpropanoid pathway. (B) The connection network between differentially expressed genes (DEGs) (blue circles) and differentially accumulated metabolites (DAMs) (Orange circles). Orange solid lines represent a positive correlation between genes and metabolites, and blue dashed lines represent a negative correlation.

4. Discussion

4.1. Lodging Resistance Is a Developmentally Regulated Trait

This study, through the integration of physiological measurements and multi-omics analyses, provides compelling evidence that stalk lodging resistance in maize is not determined at the early filling stage but is progressively established during later development (maturity stage) via complex transcriptional and metabolic reprogramming. The dynamic shift in the transcriptomic and metabolomic profiles of the recombinant inbred line Z—from clustering with the susceptible parent C at the filling stage to clustering with the highly resistant parent P at maturity—serves as direct evidence for this process. This finding aligns with and extends previous research suggesting that stalk strength undergoes significant changes during the late growth stages [,]. Our multi-timepoint analysis shifts the focus of lodging resistance research from static genotypic comparisons to dynamic developmental biology regulation, underscoring the necessity of sampling at multiple timepoints for a comprehensive dissection of the molecular mechanisms underlying complex agronomic traits, a dimension often lacking in single-timepoint studies [,].

4.2. The Central Role of Phenylpropanoid Biosynthesis in Establishing Lodging Resistance at Maturity

The significant enrichment of the phenylpropanoid biosynthesis pathway in our integrated analysis offers key insights into the biochemical foundation of lodging resistance, corroborating its well-established role in lignin biosynthesis and cell wall fortification [,,]. This pathway is central to the synthesis of secondary metabolites such as lignin and flavonoids, which are critical components for cell wall reinforcement and lignification []. The observed up-regulation of key pathway genes (PAL, CCR, HCT) and the accumulation of associated metabolites (lignin precursors) in the highly resistant genotype PHB1M at maturity are consistent with previous studies, which have also reported the association of these genes with enhanced stalk strength [,]. The novelty of our study lies in the multi-omics integration and temporal correlation network analysis, which not only confirms the importance of this pathway but further constructs a coordinated regulatory module comprising 3 genes and 3 metabolites that is specifically activated at maturity. Particularly, the strong positive correlation between CCR gene expression and coniferyl alcohol accumulation directly links gene expression to the accumulation of a critical lignin precursor, providing mechanistic insight into the enhanced lignin biosynthesis in lodging-resistant genotypes. This refined molecular explanatory model for lodging resistance directly links gene expression and metabolite flux to the accumulation of end-products that ultimately influence the phenotype, building upon the foundational work of others [,].

4.3. Synergistic Functions of Kinase Signaling and Cell Wall Metabolism in Stalk Reinforcement

Gene Ontology terms specifically enriched at maturity, such as “protein kinase activity” and “polysaccharide binding,” reveal another critical layer in the formation of lodging resistance, as inferred from our transcriptomic data. Protein kinases likely amplify reinforcement signals by regulating the activity of various substrates, including key enzymes in the phenylpropanoid pathway and transcription factors related to cell wall synthesis, through phosphorylation cascades, a regulatory layer hinted at in other plant systems []. The enhancement of “polysaccharide binding” function suggests the activation of processes such as the assembly, cross-linking, and modification of cell wall polysaccharides (cellulose, hemicellulose) during maturity. This indicates that the highly resistant genotype concurrently activates two major programs at maturity: “signal transduction” (kinases) and “structural construction” (synthesis and assembly of cell wall components), which likely act synergistically to maximize stalk mechanical strength. These potential mechanisms, while supported by our transcriptional data and consistent with the known complexity of cell wall regulation [,], provide promising directions for future functional studies.

4.4. The Value of Multi-Omics Integration and Implications for Breeding

Compared to single-omics approaches, our integrated analysis more effectively identifies key regulatory modules controlling phenotypic variation while reducing false positives [,,]. The gene–metabolite network we constructed, particularly within the phenylpropanoid pathway, provides both mechanistic insights into lodging resistance and practical breeding applications. Key genes like PAL, HCT, and CCR represent ideal candidates for functional marker development. By comparing resistant (P) and susceptible (C) parents, functional SNPs can be identified in these genes and converted to efficient PCR-based markers like KASP. These pathway-specific markers offer greater predictive value than anonymous markers.
Additionally, metabolites such as coniferyl alcohol can serve directly as metabolic markers. Using HPLC or LC-MS, these metabolites can be quantified in seedlings, enabling early selection for mature plant traits. This “early-prediction” approach significantly shortens breeding cycles. The parallel development of both gene-based and metabolite-based markers creates a complementary dual system. Integrating these markers into a selection index establishes a verification system that minimizes environmental effects, supporting precise improvement of stalk strength [,,].
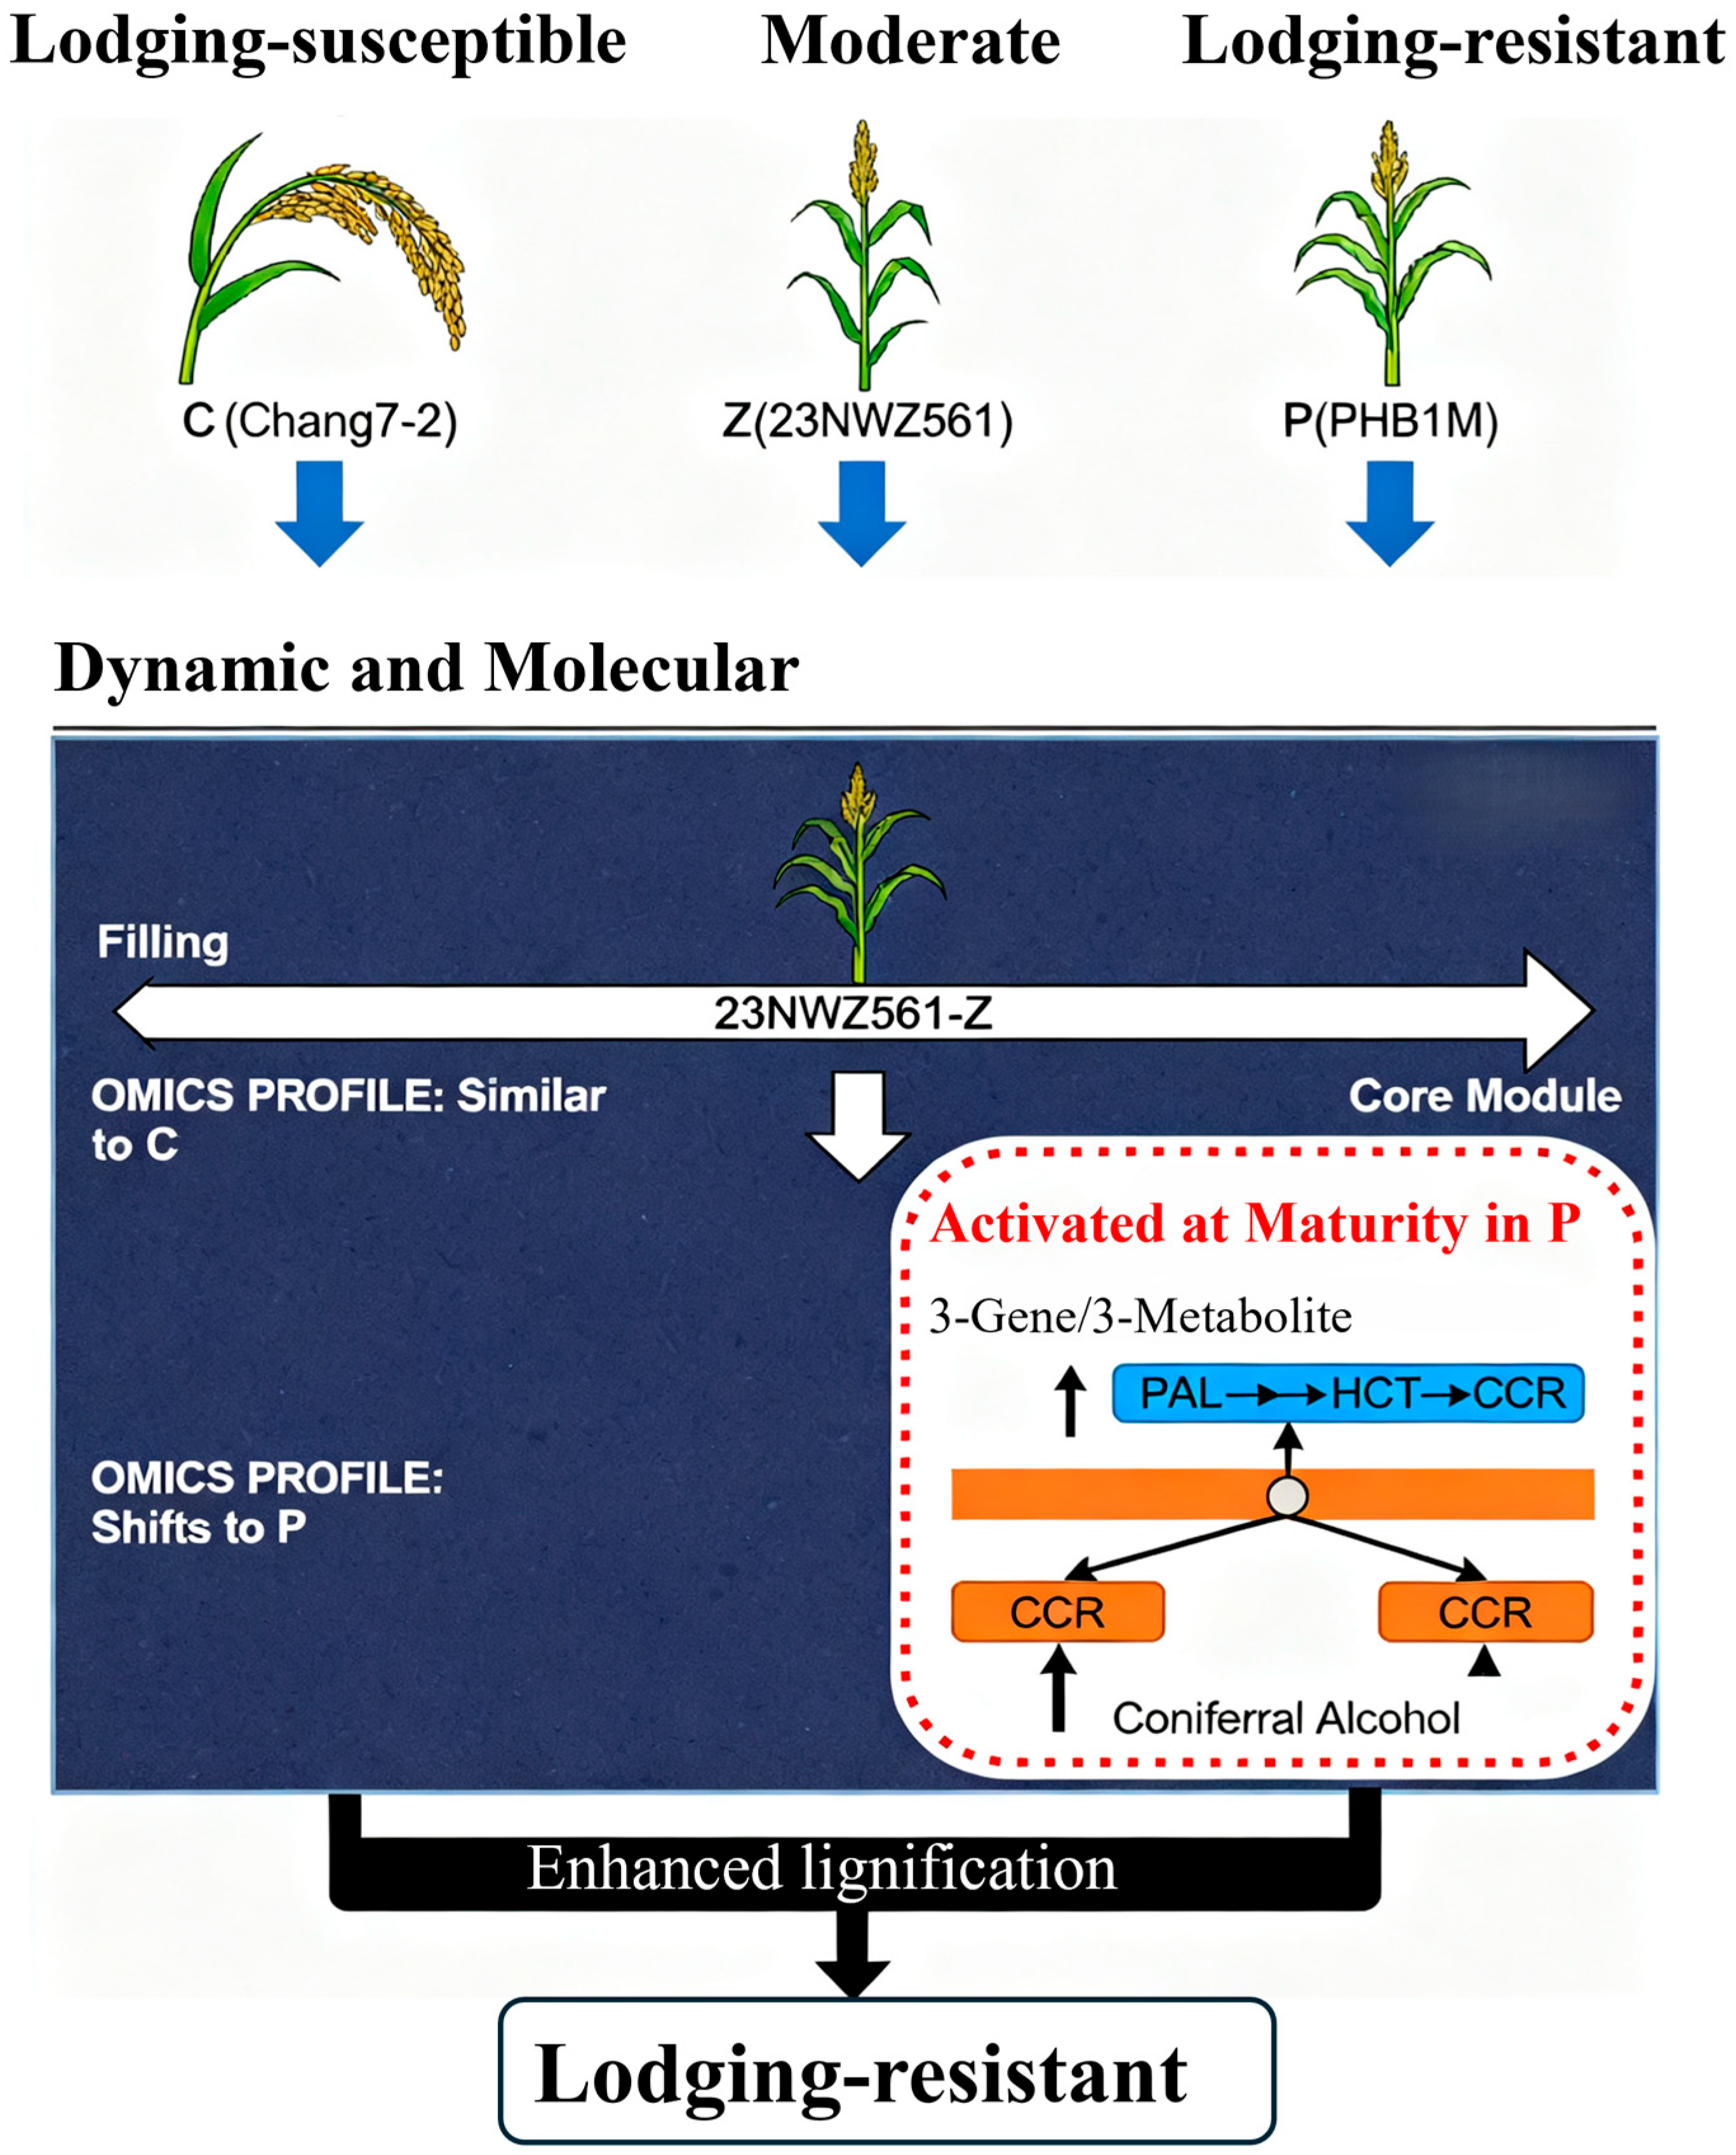
In summary, we propose a working model (Figure 7) that integrates the phenotypic, transcriptomic, and metabolomic dynamics underlying the developmental regulation of lodging resistance. This model provides the foundation and a clear roadmap for a new breeding strategy that synergistically uses molecular and metabolic markers to accelerate the development of high-yielding, lodging-resistant maize varieties.
Figure 7. A conceptual model for the developmental regulation of lodging resistance in maize. The model integrates key findings demonstrating that stalk lodging resistance is established at maturity through dynamic transcriptional and metabolic reprogramming, highlighted by the stage-specific activation of the phenylpropanoid biosynthesis pathway in resistant genotypes.

5. Conclusions

This study demonstrates that lodging resistance in maize is a developmentally regulated trait established during the later stages of stalk development through transcriptional and metabolic reprogramming. The phenylpropanoid biosynthesis pathway plays a central role in this process, with a core regulatory module comprising 3 genes and 3 metabolites identified through integrated multi-omics analysis. The highly resistant genotype PHB1M activates this module specifically at maturity, leading to enhanced lignin biosynthesis and cell wall reinforcement. The coordinated up-regulation of key genes (PAL, HCT, CCR) and accumulation of associated metabolites (coniferyl alcohol) underpin the superior stalk strength. Our findings provide valuable candidate genes and metabolic markers for breeding lodging-resistant maize varieties, highlighting the power of multi-omics integration in dissecting complex agronomic traits.

Supplementary Materials

The following supporting information can be downloaded at: https://www.mdpi.com/article/10.3390/agriculture15232416/s1. Figure S1. Mapping of differentially expressed genes (DEGs) and differentially accumulated metabolites. Mapping of differentially expressed genes (DEGs) and differentially accumulated metabolites (DAMs) to KEGG pathways. The Y-axis represents the number of transcriptomics (DEGs) and metabonomics (DAMs), and the X-axis represents the pathway. Blue is Transcriptome; orange is Metabolome. (A) C9 vs. C7, (B) C7 vs. P7, (C) Z9 vs. C7, (D) C7 vs. Z7, (E) C9 vs. P9, (F) C9vs. Z9, (G) P7 vs. P9, (H) Z9 vs. P9, (I). Z7 vs. Z9, and (J) P7 vs. Z7. Figure S2. The relative expression of ten genes was assessed by qRT-PCR in three maize genotypes during two developmental stages: grain-filling (C7, Z7, P7) and maturity (C9, Z9, P9). Table S1. The total primers of qRT-PCR used for validation of the expression trend in maize (Zea mays L.). Table S2. Metabolite abundance data.

Author Contributions

Conceptualization, C.X., H.W., X.Z. and F.S.; software, S.Z., Z.Y., Q.D., Y.L. and H.Z.; investigation, C.X. and H.W.; methodology, C.X., H.W. and X.Z.; writing—original draft preparation, C.X. and H.W.; writing—review and editing, Q.M. and L.W. All authors have read and agreed to the published version of the manuscript.

Funding

This research received no external funding.

Data Availability Statement

The original contributions presented in this study are included in the article/supplementary material. Further inquiries can be directed to the corresponding authors.

Conflicts of Interest

The authors Chunlei Xue and Liming Wang were employed by the company SDIC Fengle Seed Co., Ltd. The remaining authors declare that the research was conducted in the absence of any commercial or financial relationships that could be construed as a potential conflict of interest.

References

  1. Wu, L.; Zheng, Y.; Jiao, F.; Wang, M.; Zhang, J.; Zhang, Z.; Huang, Y.; Jia, X.; Zhu, L.; Zhao, Y.; et al. Identification of quantitative trait loci for related traits of stalk lodging resistance using genome-wide association studies in maize (Zea mays L.). BMC Genom. Data 2022, 23, 76. [Google Scholar] [CrossRef]
  2. Liu, J.; Sun, C.; Guo, S.; Yin, X.; Yuan, Y.; Fan, B.; Lv, Q.; Cai, X.; Zhong, Y.; Xia, Y.; et al. Genomic and Transcriptomic Analyses Reveal Pathways and Genes Associated With Brittle Stalk Phenotype in Maize. Front. Plant Sci. 2022, 13, 849421. [Google Scholar] [CrossRef]
  3. Li, T.; Zhang, X.; Liu, Q.; Yan, P.; Liu, J.; Chen, Y.; Sui, P. Yield and yield stability of single cropping maize under different sowing dates and the corresponding changing trends of climatic variables. Field Crops Res. 2022, 285, 108589. [Google Scholar] [CrossRef]
  4. Zhai, J.; Zhang, Y.; Zhang, G.; Tian, M.; Xie, R.; Ming, B.; Hou, P.; Wang, K.; Xue, J.; Li, S. Effects of Nitrogen Fertilizer Management on Stalk Lodging Resistance Traits in Summer Maize. Agriculture 2022, 12, 162. [Google Scholar] [CrossRef]
  5. Tilman, D.; Balzer, C.; Hill, J.; Berort, B.L. Global food demand and the sustainable intensification of agriculture. Proc. Natl. Acad. Sci. USA 2011, 108, 20260–20264. [Google Scholar] [CrossRef]
  6. Bodirsky, B.L.; Dietrich, J.P.; Martinelli, E.; Stenstad, A.; Pradhan, P.; Gabrysch, S.; Mishra, A.; Weindl, I.; Le Mouël, C.; Rolinski, S.; et al. The ongoing nutrition transition thwarts long-term targets for food security, public health and environmental protection. Sci. Rep. 2020, 10, 19778. [Google Scholar] [CrossRef] [PubMed]
  7. Jiang, T.; Zhang, C.; Zhang, Z.; Wen, M.; Qiu, H. QTL mapping of maize (Zea mays L.) kernel traits under low-phosphorus stress. Physiol. Mol. Biol. Plants 2023, 29, 435–445. [Google Scholar] [CrossRef]
  8. Yang, J.; Li, M.; Yin, Y.; Liu, Y.; Gan, X.; Mu, X.; Li, H.; Li, J.; Li, H.; Zheng, J.; et al. Spatial accumulation of lignin monomers and cellulose underlying stalk strength in maize. Plant Physiol. Biochem. 2024, 214, 108918. [Google Scholar] [CrossRef] [PubMed]
  9. Xue, J.; Xie, R.-Z.; Zhang, W.-F.; Wang, K.-R.; Hou, P.; Ming, B.; Gou, L.; Li, S. Research progress on reduced lodging of high-yield and -density maize. J. Integr. Agric. 2017, 16, 2717–2725. [Google Scholar] [CrossRef]
  10. Liu, L.; Liu, S.; Lu, H.; Tian, Z.; Zhao, H.; Wei, D.; Wang, S.; Huang, Z. Integration of transcriptome and metabolome analyses reveals key lodging-resistance-related genes and metabolic pathways in maize. Front. Genet. 2022, 13, 1001195. [Google Scholar] [CrossRef]
  11. Shah, A.N.; Tanveer, M.; Rehman, A.U.; Anjum, S.A.; Iqbal, J.; Ahmad, R. Lodging stress in cereal-effects and management: An overview. Environ. Sci. Pollut. Res. Int. 2017, 24, 5222–5237. [Google Scholar] [CrossRef] [PubMed]
  12. Du, J.; Zhang, Y.; Guo, X.; Ma, L.; Shao, M.; Pan, X.; Zhao, C. Micron-scale phenotyping quantification and three-dimensional microstructure reconstruction of vascular bundles within maize stalks based on micro-CT scanning. Funct. Plant Biol. 2016, 44, 10–22. [Google Scholar] [CrossRef]
  13. Kotake, T.; Aohara, T.; Hirano, K.; Sato, A.; Kaneko, Y.; Tsumuraya, Y.; Tsumuraya, Y.; Takatsuji, H.; Kawasaki, S. Rice Brittle culm 6 encodes a dominant-negative form of CesA protein that perturbs cellulose synthesis in secondary cell walls. J. Exp. Bot. 2011, 62, 2053–2062. [Google Scholar] [CrossRef]
  14. Wang, X.; Zhang, R.; Shi, Z.; Zhang, Y.; Sun, X.; Ji, Y.; Zhao, Y.; Wang, J.; Zhang, Y.; Xing, J.; et al. Multi-omics analysis of the development and fracture resistance for maize internode. Sci. Rep. 2019, 9, 8183. [Google Scholar] [CrossRef]
  15. Guo, Y.; Hu, Y.; Chen, H.; Yan, P.; Du, Q.; Wang, Y.; Wang, H.; Wang, Z.; Kang, D.; Li, W.-X. Identification of traits and genes associated with lodging resistance in maize. Crop J. 2021, 9, 1408–1417. [Google Scholar] [CrossRef]
  16. Jiao, S.; Hazebroek, J.P.; Chamberlin, M.A.; Perkins, M.; Sandhu, A.S.; Gupta, R.; Simcox, K.D.; Yinghong, L.; Prall, A.; Heetland, L.; et al. Chitinase-like1 Plays a Role in Stalk Tensile Strength in Maize. Plant Physiol. 2019, 181, 1127–1147. [Google Scholar] [CrossRef]
  17. Sindhu, A.; Langewisch, T.; Olek, A.; Multani, D.S.; McCann, M.C.; Vermerris, W.; Carpita, N.C.; Johal, G. Maize Brittle stalk2 encodes a COBRA-like protein expressed in early organ development but required for tissue flexibility at maturity. Plant Physiol. 2007, 145, 1444–1459. [Google Scholar] [CrossRef] [PubMed]
  18. Li, Y.; Qian, Q.; Zhou, Y.; Yan, M.; Sun, L.; Zhang, M.; Fu, Z.; Wang, Y.; Han, B.; Pang, X.; et al. BRITTLE CULM1, which encodes a COBRA-like protein, affects the mechanical properties of rice plants. Plant Cell 2003, 15, 2020–2031. [Google Scholar] [CrossRef]
  19. Manga-robles, A.; Santiago, R.; Malvar, R.A.; Moreno-González, V.; Fornalé, S.; López, I.; Centeno, M.L.; Acebes, J.L.; Álvarez, J.M.; Caparros-Ruiz, D.; et al. Elucidating compositional factors of maize cell walls contributing to stalk strength and lodging resistance. Plant Sci. 2021, 307, 110882. [Google Scholar] [CrossRef]
  20. Sato, K.; Ito, S.; Fujii, T.; Suzuki, R.; Takenouchi, S.; Nakaba, S.; Funada, R.; Sano, Y.; Kajita, S.; Hidemi, K.; et al. The carbohydrate-binding module (CBM)-like sequence is crucial for rice CWA1/BC1 function in proper assembly of secondary cell wall materials. Plant Signal Behav. 2010, 5, 1433–1436. [Google Scholar] [CrossRef]
  21. Li, P.; Liu, Y.; Tan, W.; Chen, J.; Zhu, M.; Lv, Y.; Liu, Y.; Yu, S.; Zhang, W.; Cai, H. Brittle Culm 1 Encodes a COBRA-Like Protein Involved in Secondary Cell Wall Cellulose Biosynthesis in Sorghum. Plant Cell Physiol. 2019, 60, 788–801. [Google Scholar] [CrossRef] [PubMed]
  22. Flint-garcia, S.A.; Mcmullen, M.D.; Darrah, L.L. Genetic Relationship of Stalk Strength and Ear Height in Maize. Crop Sci. 2003, 43, 23–31. [Google Scholar] [CrossRef]
  23. Aohara, T.; Kotake, T.; Kaneko, Y.; Takatsuji, H.; Tsumuraya, Y.; Kawasaki, S. Rice BRITTLE CULM 5 (BRITTLE NODE) is involved in secondary cell wall formation in the sclerenchyma tissue of nodes. Plant Cell Physiol. 2009, 50, 1886–1897. [Google Scholar] [CrossRef]
  24. Ren, Z.; Wang, X.; Tao, Q.; Guo, Q.; Zhou, Y.; Yi, F.; Huang, G.; Li, Y.; Zhang, M.; Li, Z.; et al. Transcriptome dynamic landscape underlying the improvement of maize lodging resistance under coronatine treatment. BMC Plant Biol. 2021, 21, 202. [Google Scholar] [CrossRef]
  25. Xie, L.; Wen, D.; Wu, C.; Zhang, C. Transcriptome analysis reveals the mechanism of internode development affecting maize stalk strength. BMC Plant Biol. 2022, 22, 49. [Google Scholar] [CrossRef] [PubMed]
  26. Xu, W.; Zhao, Y.; Liu, Q.; Diao, Y.; Wang, Q.; Yu, J.; Jiang, E.; Zhang, Y.; Liu, B. Identification of ZmBK2 Gene Variation Involved in Regulating Maize Brittleness. Genes 2023, 14, 1126. [Google Scholar] [CrossRef]
  27. Le, L.; Guo, W.; Du, D.; Zhang, X.; Wang, W.; Yu, J.; Wang, H.; Qiao, H.; Zhang, C.; Pu, L. A spatiotemporal transcriptomic network dynamically modulates stalk development in maize. Plant Biotechnol. J. 2022, 20, 2313–2331. [Google Scholar] [CrossRef]
  28. He, Y.; Deng, Z.; He, S.; Qi, Z.; Chang, H.; Liu, P.; Chen, Z.; Zou, C.; Shen, Y.; Ma, L. Transcriptome and co-expression network analysis reveal the genetic basis of cell wall components in maize stalks. BMC Genom. 2025, 26, 620. [Google Scholar] [CrossRef]
  29. Xiong, W.; Wu, Z.; Liu, Y.; Li, Y.; Su, K.; Bai, Z.; Guo, S.; Hu, Z.; Zhang, Z.; Bao, Y.; et al. Mutation of 4-coumarate: Coenzyme A ligase 1 gene affects lignin biosynthesis and increases the cell wall digestibility in maize brown midrib5 mutants. Biotechnol. Biofuels 2019, 12, 82. [Google Scholar] [CrossRef]
  30. Wang, S.; Wang, X.; Yue, L.; Li, H.; Zhu, L.; Dong, Z.; Long, Y. Genome-Wide Identification and Characterization of Lignin Synthesis Genes in Maize. Int. J. Mol. Sci. 2024, 25, 6710. [Google Scholar] [CrossRef]
  31. Gomez-cano, L.; Gomez-cano, F.; Dillon, F.M.; Alers-Velazquez, R.; Doseff, A.I.; Grotewold, E.; Gray, J. Discovery of modules involved in the biosynthesis and regulation of maize phenolic compounds. Plant Sci. 2020, 291, 110364. [Google Scholar] [CrossRef]
  32. Andersen, J.R.; Zein, I.; Wenzel, G.; Darnhofer, B.; Eder, J.; Ouzunova, M.; Lübberstedt, T. Characterization of phenylpropanoid pathway genes within European maize (Zea mays L.) inbreds. BMC Plant Biol. 2008, 8, 2. [Google Scholar] [CrossRef]
  33. Wang, X.; Shi, Z.; Zhang, R.; Sun, X.; Wang, J.; Wang, S.; Zhang, Y.; Zhao, Y.; Su, A.; Li, C.; et al. Stalk architecture, cell wall composition, and QTL underlying high stalk flexibility for improved lodging resistance in maize. BMC Plant Biol. 2020, 20, 515. [Google Scholar] [CrossRef]
  34. Ishfaq, S.; Ding, Y.; Liang, X.; Guo, W. Advancing lodging resistance in maize: Integrating genetic, hormonal, and agronomic insights for sustainable crop productivity. Plant Stress 2025, 15, 100777. [Google Scholar] [CrossRef]
  35. Van Soest, P.J.; Robertson, J.B.; Lewis, B.A. Methods for dietary fiber, neutral detergent fiber, and nonstarch polysaccharides in relation to animal nutrition. J. Dairy Sci. 1991, 74, 3583–3597. [Google Scholar] [CrossRef]
  36. Langmead, B.; Wilks, C.; Antonescu, V.; Charles, R. Scaling read aligners to hundreds of threads on general-purpose processors. Bioinformatics 2018, 35, 421–432. [Google Scholar] [CrossRef]
  37. Kim, D.; Paggi, J.M.; Park, C.; Bennett, C.; Salzberg, S.L. Graph-based genome alignment and genotyping with HISAT2 and HISAT-genotype. Nat. Biotechnol. 2019, 37, 907–915. [Google Scholar] [CrossRef]
  38. Pertea, M.; Pertea, G.M.; Antonescu, C.M.; Chang, T.C.; Mendell, J.T.; Salzberg, S.L. StringTie enables improved reconstruction of a transcriptome from RNA-seq reads. Nat. Biotechnol. 2015, 33, 290–295. [Google Scholar] [CrossRef]
  39. Li, B.; Dewey, C.N. RSEM: Accurate transcript quantification from RNA-Seq data with or without a reference genome. BMC Bioinform. 2011, 12, 323. [Google Scholar] [CrossRef]
  40. Love, M.I.; Huber, W.; Anders, S. Moderated estimation of fold change and dispersion for RNA-seq data with DESeq2. Genome Biol. 2014, 15, 550. [Google Scholar] [CrossRef]
  41. Wu, T.; Hu, E.; Xu, S.; Chen, M.; Guo, P.; Dai, Z. clusterProfiler 4.0: A universal enrichment tool for interpreting omics data. Innov. 2021, 2, 100141. [Google Scholar] [CrossRef] [PubMed]
  42. Livak, K.J.; Schmittgen, T.D. Analysis of relative gene expression data using real-time quantitative PCR and the 2(-Delta Delta C(T)) Method. Methods 2001, 25, 402–408. [Google Scholar] [CrossRef] [PubMed]
  43. Li, Q.; Fu, C.; Liang, C.; Ni, X.; Zhao, X.; Chen, M.; Ou, L. Crop Lodging and The Roles of Lignin, Cellulose, and Hemicellulose in Lodging Resistance. Agronomy 2022, 12, 1795. [Google Scholar] [CrossRef]
Disclaimer/Publisher’s Note: The statements, opinions and data contained in all publications are solely those of the individual author(s) and contributor(s) and not of MDPI and/or the editor(s). MDPI and/or the editor(s) disclaim responsibility for any injury to people or property resulting from any ideas, methods, instructions or products referred to in the content.

Article Metrics

Citations

Article Access Statistics

Multiple requests from the same IP address are counted as one view.