1. Introduction
Price dynamics for fruits and vegetables are notoriously volatile and noisy, making operational planning and decision-making across the supply chain—covering growers, wholesalers, and retailers—more challenging. Improving noise-robust predictive performance is therefore not just a methodological goal but a practical necessity. Recent research has moved beyond traditional univariate models to hybrid pipelines that combine signal decomposition with adaptive predictors, aiming to filter out high-frequency noise and extract meaningful structure such as trends and cycles before forecasting. For instance, Variational Mode Decomposition (VMD) has consistently improved vegetable-price prediction workflows by isolating more stable subseries that are easier to model [
1]. Similarly, mixture-of-experts and ensemble strategies have proven effective for combining specialists working under different regimes or scales of variation, thereby enhancing generalization to non-stationary, noisy signals [
2,
3]. Furthermore, probabilistic regression methods, such as Gaussian Process Regression, have been explored for agricultural commodities (e.g., corn), providing calibrated uncertainty estimates that support risk-aware decision-making [
4]. Beyond forecasting, several studies connect predictive signals to downstream replenishment and pricing strategies in perishables, underscoring the need for forecasts that are both stable and actionable [
5].
Meanwhile, the broader noise-resistant time-series literature introduces architectures specifically designed to handle perturbations and distribution shifts (e.g., long-horizon hierarchical structures and attention mechanisms), providing cross-domain evidence that breaking down and focusing on essential components is an effective way to reduce noise [
6]. In the agri-food field, representation learning with autoencoders—including masked versions—has shown potential to create compact embeddings that remove redundancy and highlight latent factors relevant to prediction, even when signals are noisy or low-resolution. These insights naturally apply to price series: learning nonlinear, noise-invariant features that an ensemble can combine can enhance short- and medium-term robustness against shocks and spikes.
Within short-term pricing, decomposition combined with deep attention mechanisms has proven effective. Zhang et al. [
7] applied VMD with exogenous/lag selection and an LSTM + Attention ensemble to 2016–2023 vegetable prices (VMD modes, climate, calendar), reporting MAPE and RMSE reductions of ≥10–15% compared to SARIMA/Prophet/vanilla LSTM. They argue that attention reduces spikes, improving robustness under noise. Extending this concept, Wang et al. [
1] combined VMD with intelligent metaheuristic hyperparameter selection on top of LSTM/XGBoost ensembles (2016–2023; modes, calendar, weather), again outperforming ARIMA/Prophet/LSTM and positioning VMD + metaheuristic as a repeatable approach that decomposes high-frequency noise. Instead of decomposing by frequency, Zhao et al. [
2] segmented by regimes using a VPF-MoE (mixture of experts with attention) on 2015–2023 data (seasonality, shocks), achieving MAPE/SMAPE improvements of ≥8–12% over ARIMA/LSTM/generic Transformers; they attributed this resilience to attention-gated expert specialization across regimes.
A growing trend links forecasting to downstream operational decisions for perishables. Liu et al. [
5] integrated forecasting with replenishment and pricing decisions using freshness and age features, combined with stochastic programming and ARIMA and LSTM models, on supermarket data (2020–2023; price, demand, shrinkage). They reported margin increases of 3–7% compared to heuristic policies, highlighting the value of decision-coupled forecasts. In similar decision-making contexts, Ping et al. [
8] optimized replenishment and pricing jointly via MIP driven by ARIMA/XGBoost predictions and features related to demand, shrinkage, and age (2019–2023; costs and stockouts), reducing stockouts by 12% and shrinkage by 8% compared to traditional rules. Beyond sales, Opara et al. [
9] forecast postharvest waste for fruits and vegetables using Random Forest and XGBoost with handling and cold-chain features (2018–2022) (temperature, time, and price), which decreased the MAE and MAPE relative to ARIMA and ETS, linking prediction to loss mitigation strategies. Although these studies focused on resolving issues with high-accuracy methods, they had some limitations. For instance, decomposition-plus-attention occasionally displays smooth volatility, which negatively affects service levels, even though it has a lower error metric. Metaheuristic methods are costly, prone to overfitting, and difficult to reproduce or scale. The Regime/MoE process has issues, including unstable regime assignments and expert collapse under data sparsity. This research aimed to apply the Interquartile Range (IQR) Filter, Z-Score Standardization, and Hampel Filter for data preprocessing and noise reduction. Models such as Additive Time-Series Decomposition, spectral features via the Fast Fourier Transform (FFT), and temporal features were employed for temporal-spectral feature extraction. For dimensionality reduction, Principal Component Analysis (PCA) was utilized. For clustering, Gaussian Mixture Models (GMMs) were used. To detect regime shifts and anomalies, methods such as Cumulative Sum (CUSUM), Bayesian online change-point detection (BOCPD), and spectral density inspection were used. Finally, a sensitivity analysis was performed to validate robustness. These hybrid models offer several advantages, including enhanced data preprocessing and noise reduction, which decrease false alarms in anomaly detection and enable an unbiased estimation of variance, skewness, and higher moments. The decomposition and feature extraction methods can effectively separate regular cycles and capture both low- and high-frequency components. PCA and GMMs simplify the visualization of regional proximities while also improving computational efficiency and homogeneity. Change-point and spectral inspection methods are used to identify abrupt shocks and structural risks caused by random fluctuations.
The data sparsity and stability of the regime are demonstrated by applying assignment for soft probabilistic models and low dimensions. Building on these ideas, this research proposes a noise-resistant forecasting pipeline for fruit and vegetable prices that combines: (i) decomposition-based denoising (e.g., VMD/EMD) to reduce high-frequency noise and isolate interpretable components; (ii) autoencoder-based feature learning to capture hidden, nonlinear structures that are resistant to disruptions; and (iii) a stacking ensemble that merges horizon- and component-specific learners to lower variance and improve generalization under noise. Our approach is based on prior research on decomposition and ensemble methods for agricultural prices, integrates recent progress in noise-resistant forecasting, and utilizes representation learning proven effective in agricultural contexts. Finally, it relates forecasting accuracy to operational value by measuring its impact on replenishment and pricing decisions [
3] thereby aligning methodological advances with the real-world needs of perishable supply chains. The main contributions of this paper are:
Novel Hybrid pipeline: This model demonstrates the ability to detect anomalies and cluster regions in Chile based on fruit and vegetable prices by applying IQR filtering, Z-score standardization, Hampel filtering, and extracting features while reducing dimensionality using PCA. To cluster these regions, Gaussian Mixture Models (GMMs), a probabilistic clustering method, were employed. Our framework addressed this using real data from 2015 to 2023 across 16 regions of Chile and measured the sensitivity and robustness of the results in line with the methods mentioned. This demonstrated that our model is robust and reliable.
Our paper bridges the gap between advanced methodologies and real-world value by showing how forecasting and clustering-based anomaly detection can enhance replenishment and pricing decisions in perishable supply chains. Our model’s agility under resource constraints enables decision-makers in agribusiness markets to utilize this approach effectively.
2. Literature Review
Recent research on fruit and vegetable price forecasting mainly uses two approaches: direct modeling of noisy data without explicit decomposition and hybrid methods that first decompose or denoise data before modeling. On the direct-modeling side, Kumari et al. [
10] analyzed retail vegetable price signals for commercial planning using RNN/LSTM ensembles with lag- and seasonality-based features on 2018–2022 transaction data (price, volume, calendar indicators). They reported reductions in RMSE and MAPE compared to ARIMA/SARIMA, providing a reproducible retail-agriculture workflow and showing noise resilience through the networks’ ability to manage nonlinearity and volatility without explicit denoising. In a related area focused on production and alerting in horticulture, Mao et al. [
11] combined automatic lag and exogenous variable selection with XGBoost and LightGBM ensembles using a 2016–2021 panel (including wholesale prices, weather, and seasonality), achieving lower MAE and MAPE than ARIMA/ETS/Prophet. They emphasize decision support with explainability, noting better performance on less volatile series.
Liu and Liu [
12] examined operational guidance for noisy retail time series, offering a practical playbook for perishable retailers. They employed SARIMA, ETS, and Prophet with calendar features and rolling windows on 2019–2022 sales data (including price, demand, and promotions), reporting stable SMAPE and improvements of 5–12% over naive models and ETS, advocating for category-specific configurations. Complementing point forecasts, Zhu et al. [
13] focused on uncertainty communication in agricultural commodities using probabilistic evaluation (CRPS and prediction-interval coverage) with ETS, ARIMA, and GPR on 2005–2020 price indices. They achieved near-nominal coverage and lower CRPS than Prophet, proposing an intervals framework suitable for risk management, with noise robustness derived from simulation and robust model selection.
Hybrid decomposition becomes essential when volatility is high. Focusing on Korea’s highly volatile horticultural prices, Qiao and Ahn [
14] combined CEEMDAN with lag/volatility selection and a GARCH–LSTM hybrid on the 2014–2022 series (including IMFs, trend, shocks). They demonstrated lower MAPE and RMSE than ARIMA and Prophet and introduced a CEEMDAN + GARCH/LSTM pipeline that isolated irregular components while addressing heteroskedasticity with GARCH. The analysis of volatility itself was the focus of Agbo [
15], who examined Sahel agricultural prices (2010–2020) using GARCH and EGARCH—extracting seasonality and volatility, identifying clusters, and enhancing AIC and BIC rather than ARIMA—to support public policy risk assessments.
Finally, pricing under uncertainty was studied using kernel and Bayesian methods. Liu et al. [
12] modeled commodity prices using inventory and elasticity data, incorporating cost and stock features into SVR and GPR (2012–2020; price, demand, and marginal cost). This approach achieved lower RMSE than ARIMA and SVR alone, resulting in a pricing framework that explicitly incorporated uncertainty via GPR. Similarly, Giri & Giri [
16] provided evidence from an emerging market—cauliflower prices in Nepal, 2015–2022—where a setup without decomposition (lags and seasonality) showed LSTM outperforming SARIMA and Prophet on SMAPE and RMSE, highlighting the adaptability of deep models to daily, festival-influenced series. Methodologically, Li et al. [
3] demonstrated that the weighted aggregation of neural networks (without decomposition, including lag and calendar features) over the 2010–2019 period improved the MAPE compared to single models and ARIMA, offering a practical ensemble approach for vegetable price prediction.
Taken together, these studies show that strong baseline models without decomposition can perform well—especially when combined with rich lag, seasonal, and exogenous features and modern learners—while decomposition-based hybrids (e.g., CEEMDAN/VMD) and regime-aware mixtures can improve model robustness against volatility and noise. Equally important, research linking forecasting to optimization (such as inventory, pricing, and waste reduction) clearly demonstrates operational benefits, including improved margins, fewer stockouts, and reduced shrinkage. Additionally, work on probabilistic evaluation provides the tools for uncertainty needed for risk-aware decision-making. This convergence indicates a mature approach to “noise-resilient” forecasting in perishable supply chains, utilizing informed feature design and when appropriate, decomposition or regime-specific methods, conveying uncertainty effectively, and integrating predictions into decision models to maximize value at execution.
Table 1 shows previous studies.
3. Methodology
3.1. Conceptual Framework
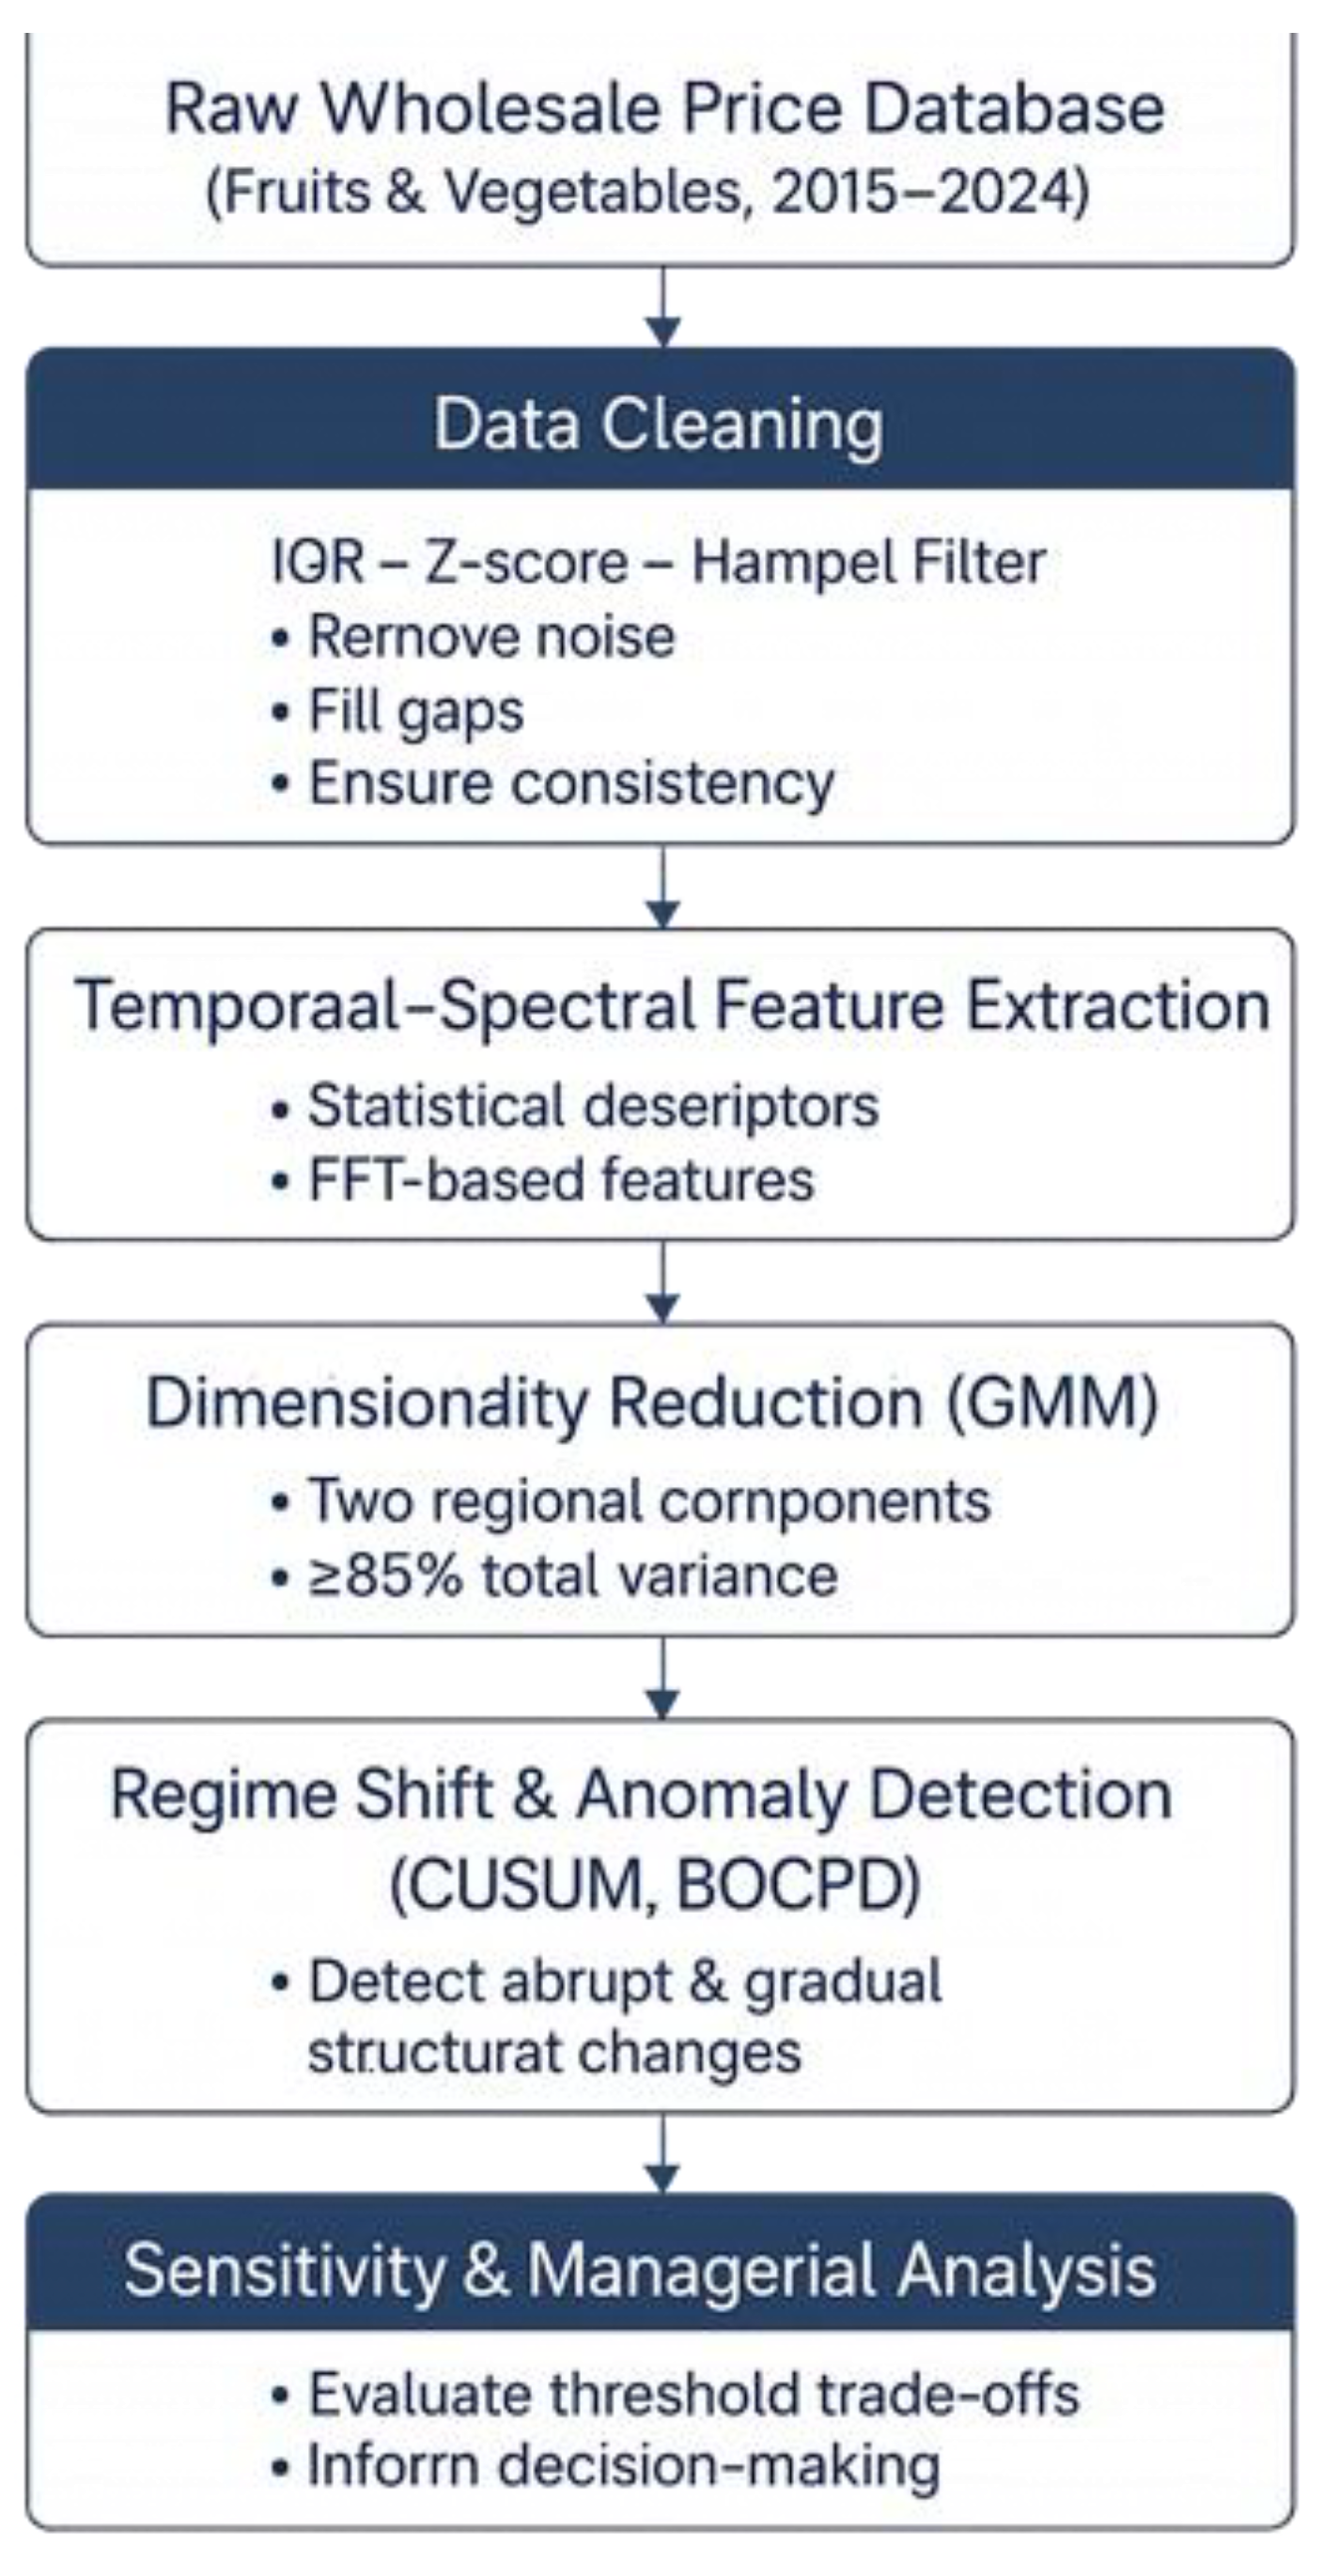
This paper begins with data cleaning using a statistical filtering method. Next, a reduction method is applied to decrease the dimensions. Then, the regions of Chile are clustered based on an unsupervised approach. These hybrid methods help ensure robust results, which are verified through a sensitivity analysis.
3.2. Data Preprocessing and Noise Attenuation
First, a three-layer noise-reduction process was applied to the raw dataset to handle missing data.
3.3. Temporal–Spectral Feature Extraction
The time series, which mentioned the region of Chile
(region
r, period
t), was decomposed into trend, seasonal, and irregular components via additive decomposition:
: Trend (long-term level, e.g., inflation-driven rise).
: Seasonal (periodic, e.g., summer fruit peaks).
: Irregular/residual (noise/anomalies).
From these components, a comprehensive set of descriptors was derived:
- -
Using statistics for features such as mean, variance, skewness, kurtosis, and coefficient of variation.
- -
Spectral features such as the dominant frequency, the amplitude ratio, and spectral entropy were obtained through Fast Fourier Transform (FFT).
- -
Temporal stability indicators demonstrated autocorrelation coefficients and partial autocorrelation at lags 1–12.
These indicators display both low-frequency (long-term seasonal) and high-frequency (short-term irregular) behaviors, enabling fine-grained discrimination among regional patterns.
3.4. Dimensionality Reduction with PCA
To reduce the number of correlated indicators and enhance computational efficiency, the Principal Component Analysis (PCA) method was used [
19]. This mathematical model standardizes the feature matrix and is decomposed as:
X: Standardized matrix (n = 16 regions, p = features; standardized to zero mean/unit variance).
U: left singular vectors (scores/loadings for regions).
∑: diagonal matrix of singular values (variance explained).
V: right singular vectors (PC loadings).
The columns display the principal components. The first two components, which accounted for over 85% of the total variance, were retained. PCA offers two main advantages: (1) Noise reduction—reduces high-dimensional volatility into a few latent variables that summarize key market dynamics, and (2) Clarity—enables visualization of regional proximities in principal-component space, revealing structural similarities among Chilean markets.
3.5. Probabilistic Clustering via Gaussian Mixture Models (GMM)
Algorithms such as traditional partitioning (e.g., k-means) produce spherical clusters and deterministic assignments, which are not ideal for heterogeneous economic data. Therefore, Gaussian Mixture Models were selected to represent each region as a probabilistic mixture of latent-variable distributions [
20].
: Feature vector for region r (e.g., 2D PC scores).
K: Number of mixtures (selected via BIC; paper used 5).
: Mixing proportions .
N: Multivariate normal with mean , covariance .
Compute responsibilities
where the mixing coefficients denote the multivariate normal density. Parametric models were estimated using the Expectation–Maximization (EM) algorithm, and the optimal number of clusters was selected based on the Bayesian Information Criterion (BIC). The GMM method provides soft memberships, meaning that a region can display features of multiple clusters simultaneously—an essential trait when analyzing transitional economic zones.
3.6. Regime Shift and Anomaly Detection
Beyond randomness, time-series behavior detects structural changes. Two methods were employed: (1) the Cumulative Sum (CUSUM) and Bayesian Online Change-Point (BOCPD) algorithms for change-point detection, and (2) shifts in dominant frequency bands indicating disrupted seasonal cycles through spectral density analysis. These techniques identify abrupt shifts (e.g., policy shocks, supply disruptions) and gradual structural drifts caused by macroeconomic forces. The detected regimes were cross-validated with climatic and policy data to ensure external consistency [
21].
3.7. Sensitivity and Robustness Analysis
Sensitivity analysis assesses how parameter changes influence anomaly detection rates and cluster stability:
- -
IQR multiplier (1.5–3.0) tests its effect on outlier retention.
- -
Z-score threshold (2–3.5σ) examines the trade-offs between false positives and missed anomalies.
- -
Hampel window size (3–15 days) evaluates the impact of local smoothing on temporal persistence.
- -
MAD multiplier (1.5–2.5) explores the robustness of local filtering.
Results show that loosening thresholds reduces false alarms but increases the risk of overlooking subtle disruptions, while tighter settings boost sensitivity but raise operational monitoring costs. These trade-offs are quantified using detection precision, recall, and F1-scores.
3.8. Method Selection Rationale
In
Table 2, the reasons for using ML methods are demonstrated.
The following techniques were combined for complementary purposes:
In the IQR/Z-score/Hampel method, robust data cleaning effectively handles heavy tails and local spikes. In time-series decomposition, it separates regular cycles from anomalies. The PCA method reduces the variance of the key variables while improving interpretability. Soft-probabilistic clustering for complex heterogeneous regions is performed using the GMM method. Change-point analysis detects regimes beyond random fluctuations. Finally, sensitivity analysis is used to validate robustness and support calibration of managerial decision-making.
Figure 1 illustrates the research methodology.
3.9. Data Set Information
The information on data related to 2015–2023 was extracted from “Oficina de Estudiar y Politicas Agrarias (ODEPA)”, which is related to the Ministry of Agriculture of Chile. These data consist of all regions of Chile. These data were gathered weekly and included Price, Volume, other products, fruits, vegetables, and total observations.
4. Data Analysis
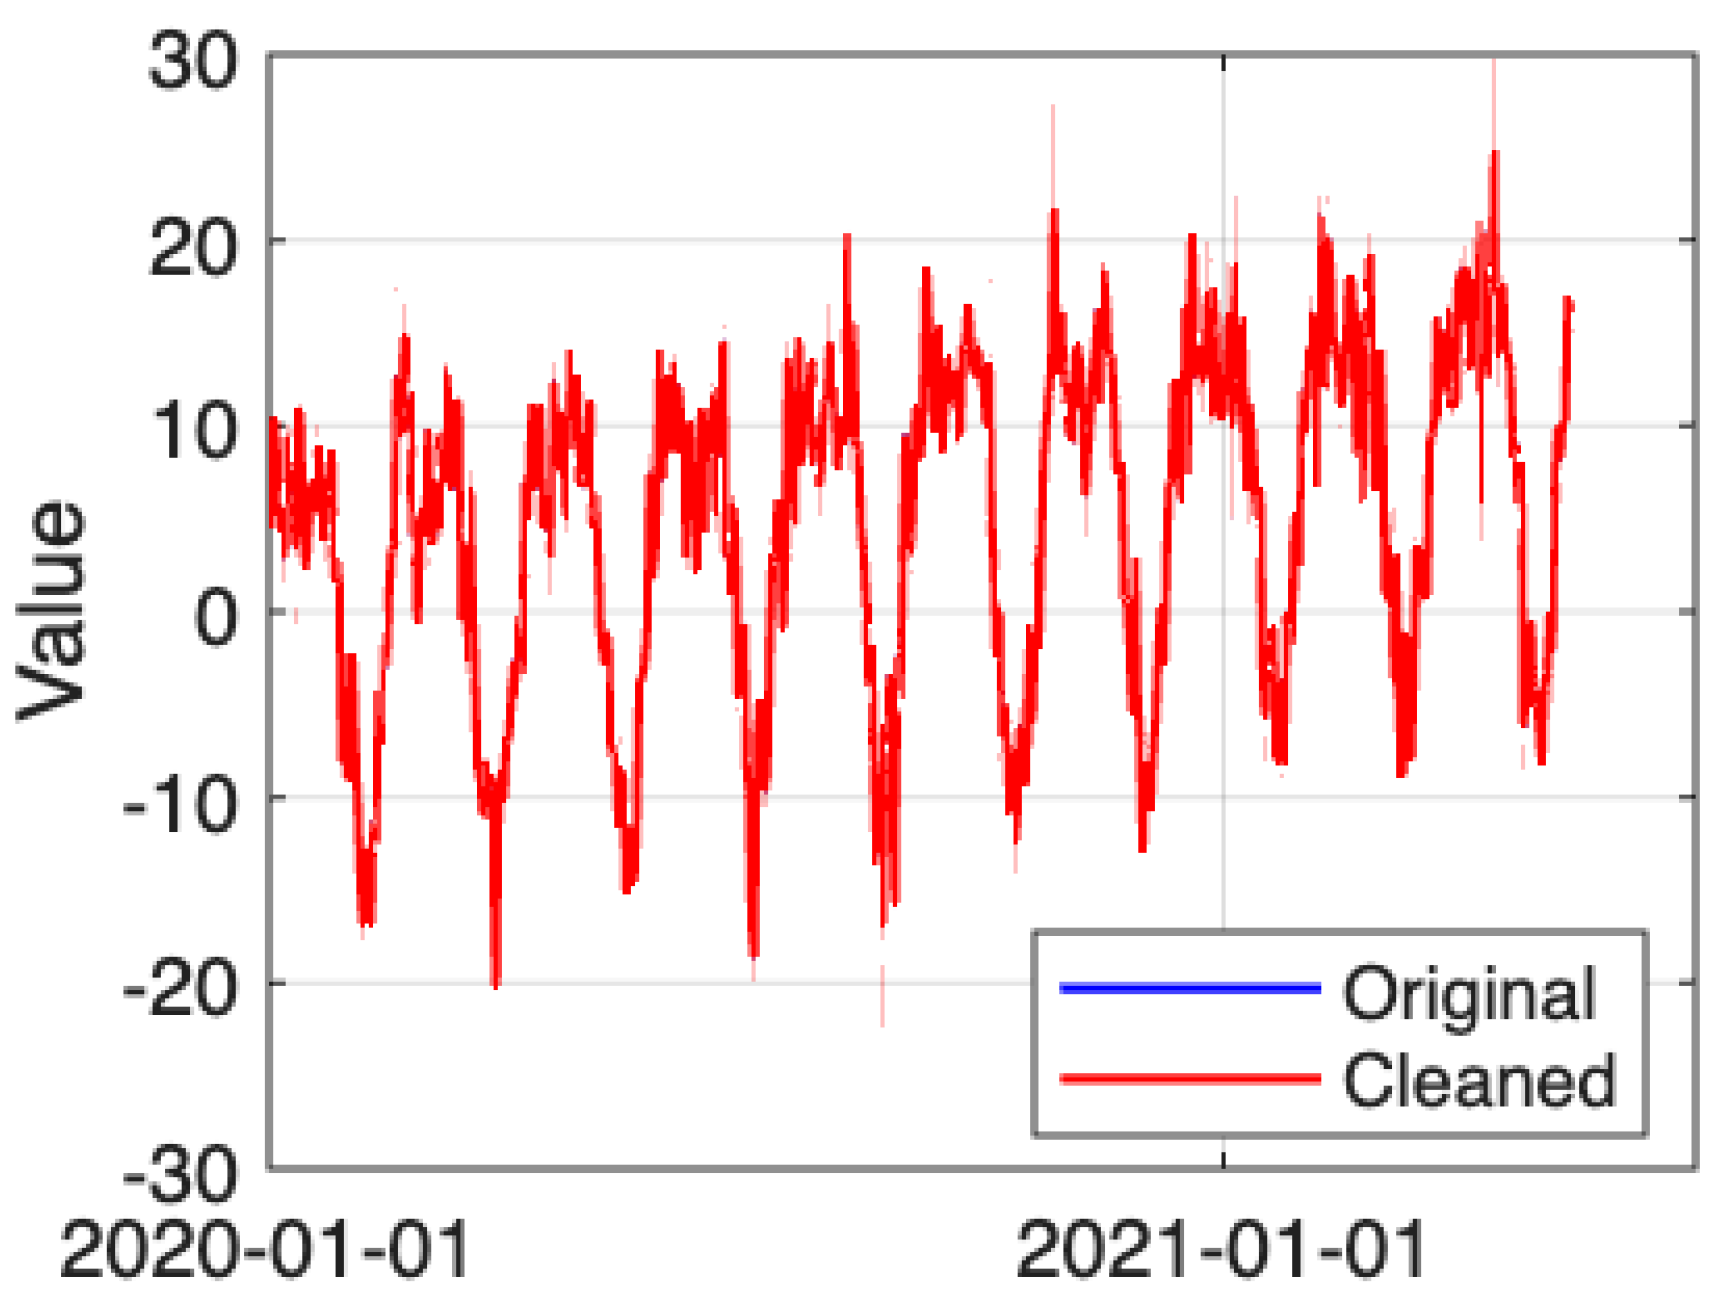
Figure 2 shows the original and cleaned data, highlighting the removal of noise. This step helps ensure the results are unbiased.
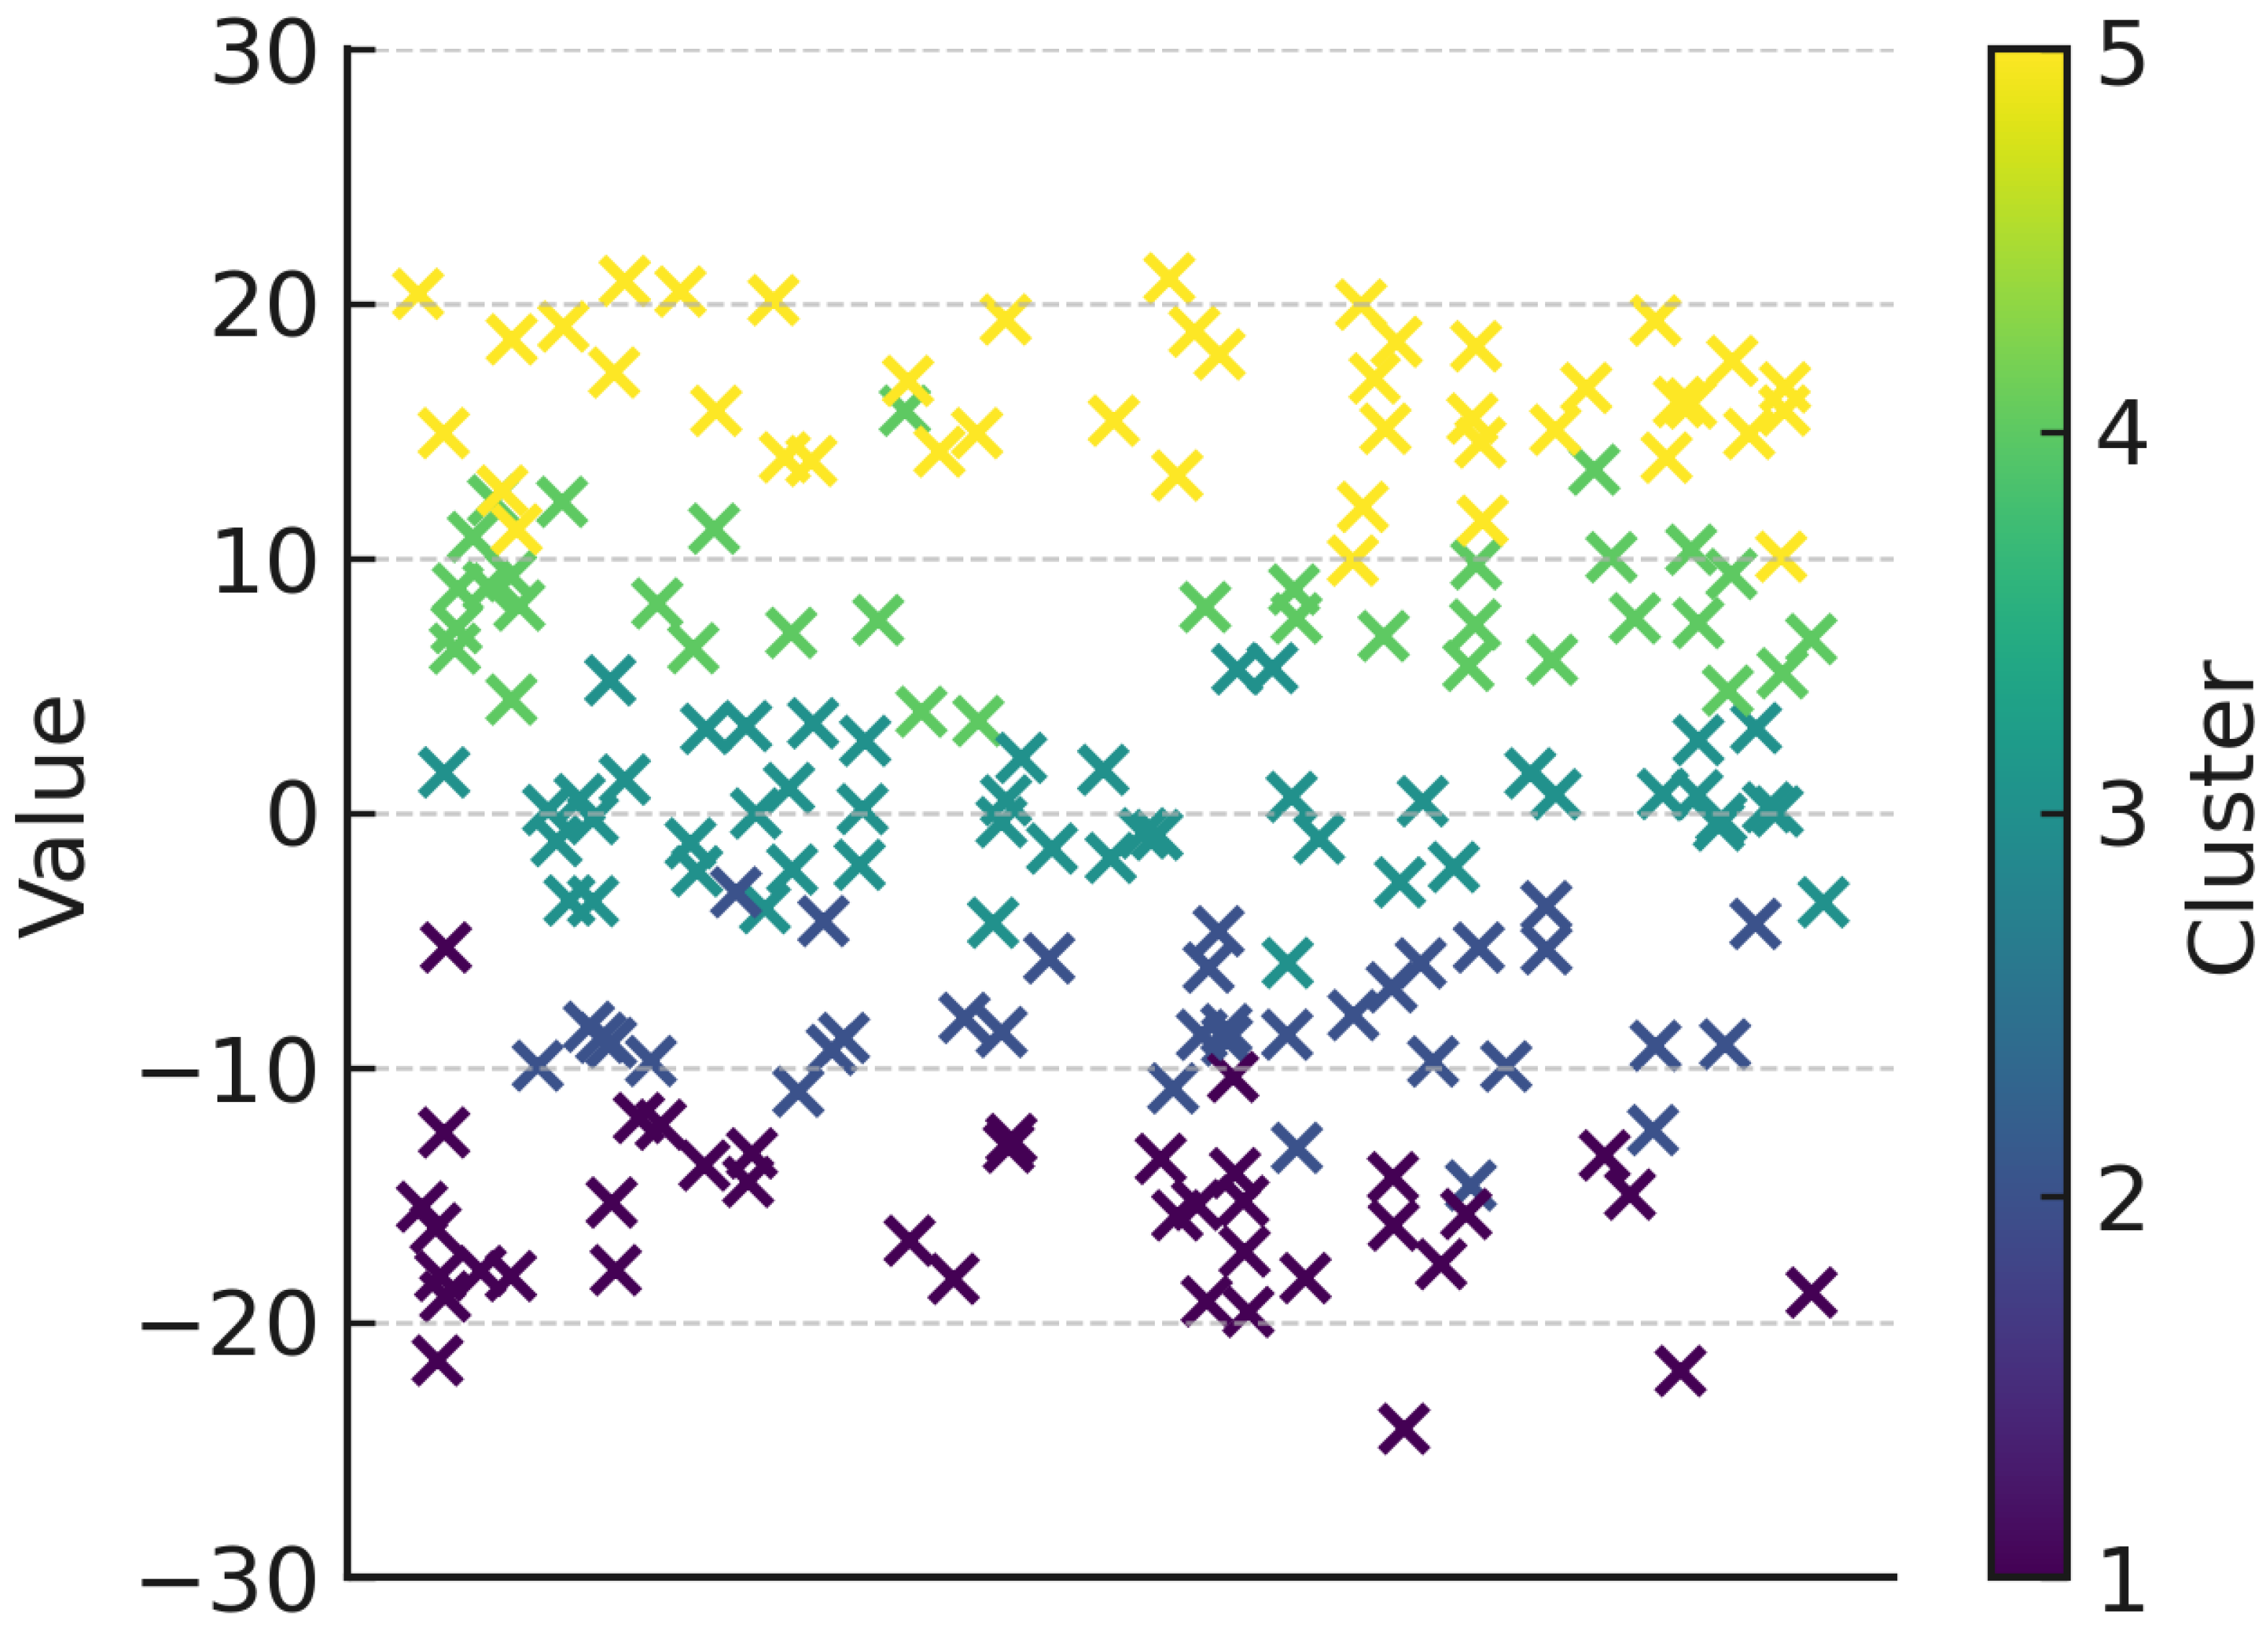
Figure 3 shows that Chile is divided into five clusters, including low-intensity areas such as Arica y Parinacota, Aysén, and Magallanes, which contributed relatively little to the overall variability. Cluster two, which includes Tarapacá, Atacama, and Ñuble, showed moderate to low levels and central regimes. Coquimbo, Maule, Los Ríos, and La Araucanía were in cluster 3, which displayed average behavior. Cluster 4, comprising Biobío, Los Lagos, and O’Higgins, had mid- to high values. Major cities such as Santiago, Valparaíso, and Antofagasta exhibited the most substantial economic and social activity. The model tried 1–12 clusters, each accounting for 90% of the PCA variance. Additionally, the BIC and K-means methods yielded three scores—Silhouette, Calinski–Harabasz, and Davies—for both methods.
In five clusters of Chilean economics, the price of Chilean economics had the most impact. In cluster four, export-driven stability was the most critical factor. Clusters 1, 2, and 3, with independent volatility, had a strong effect; however, a high baseline price has a crucial impact on transport costs.
Table 3 displays the result of the research.
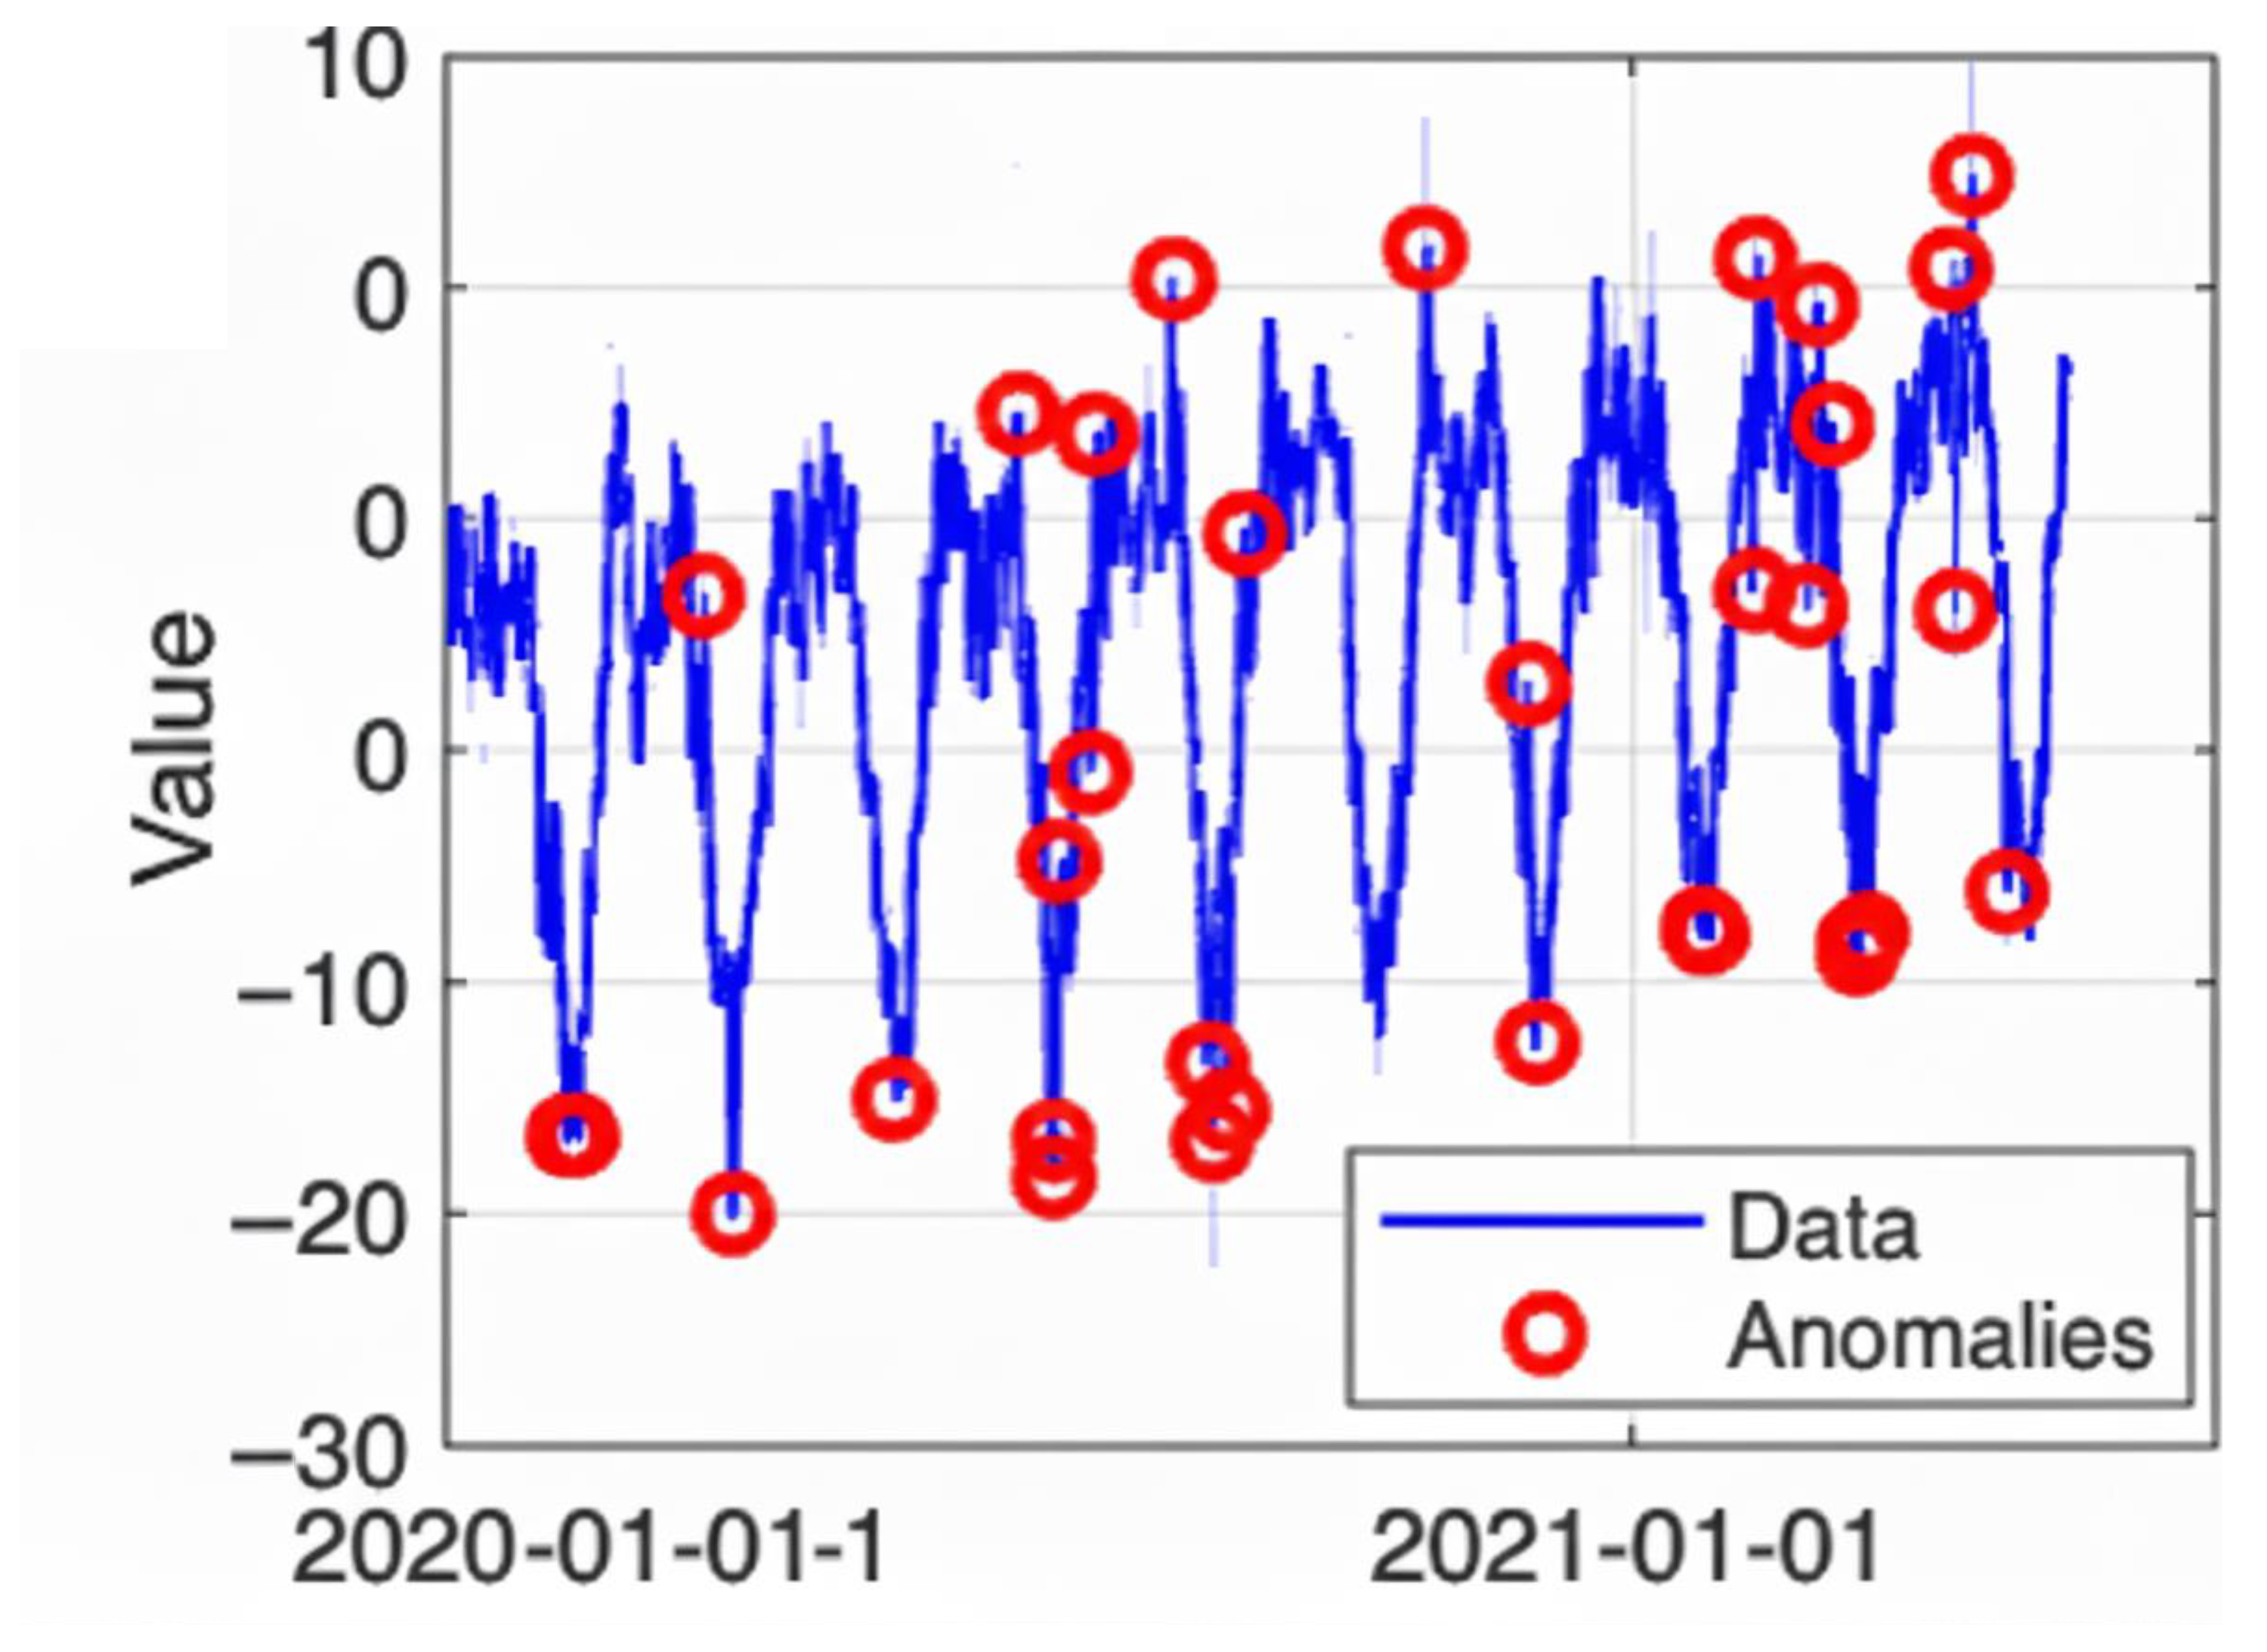
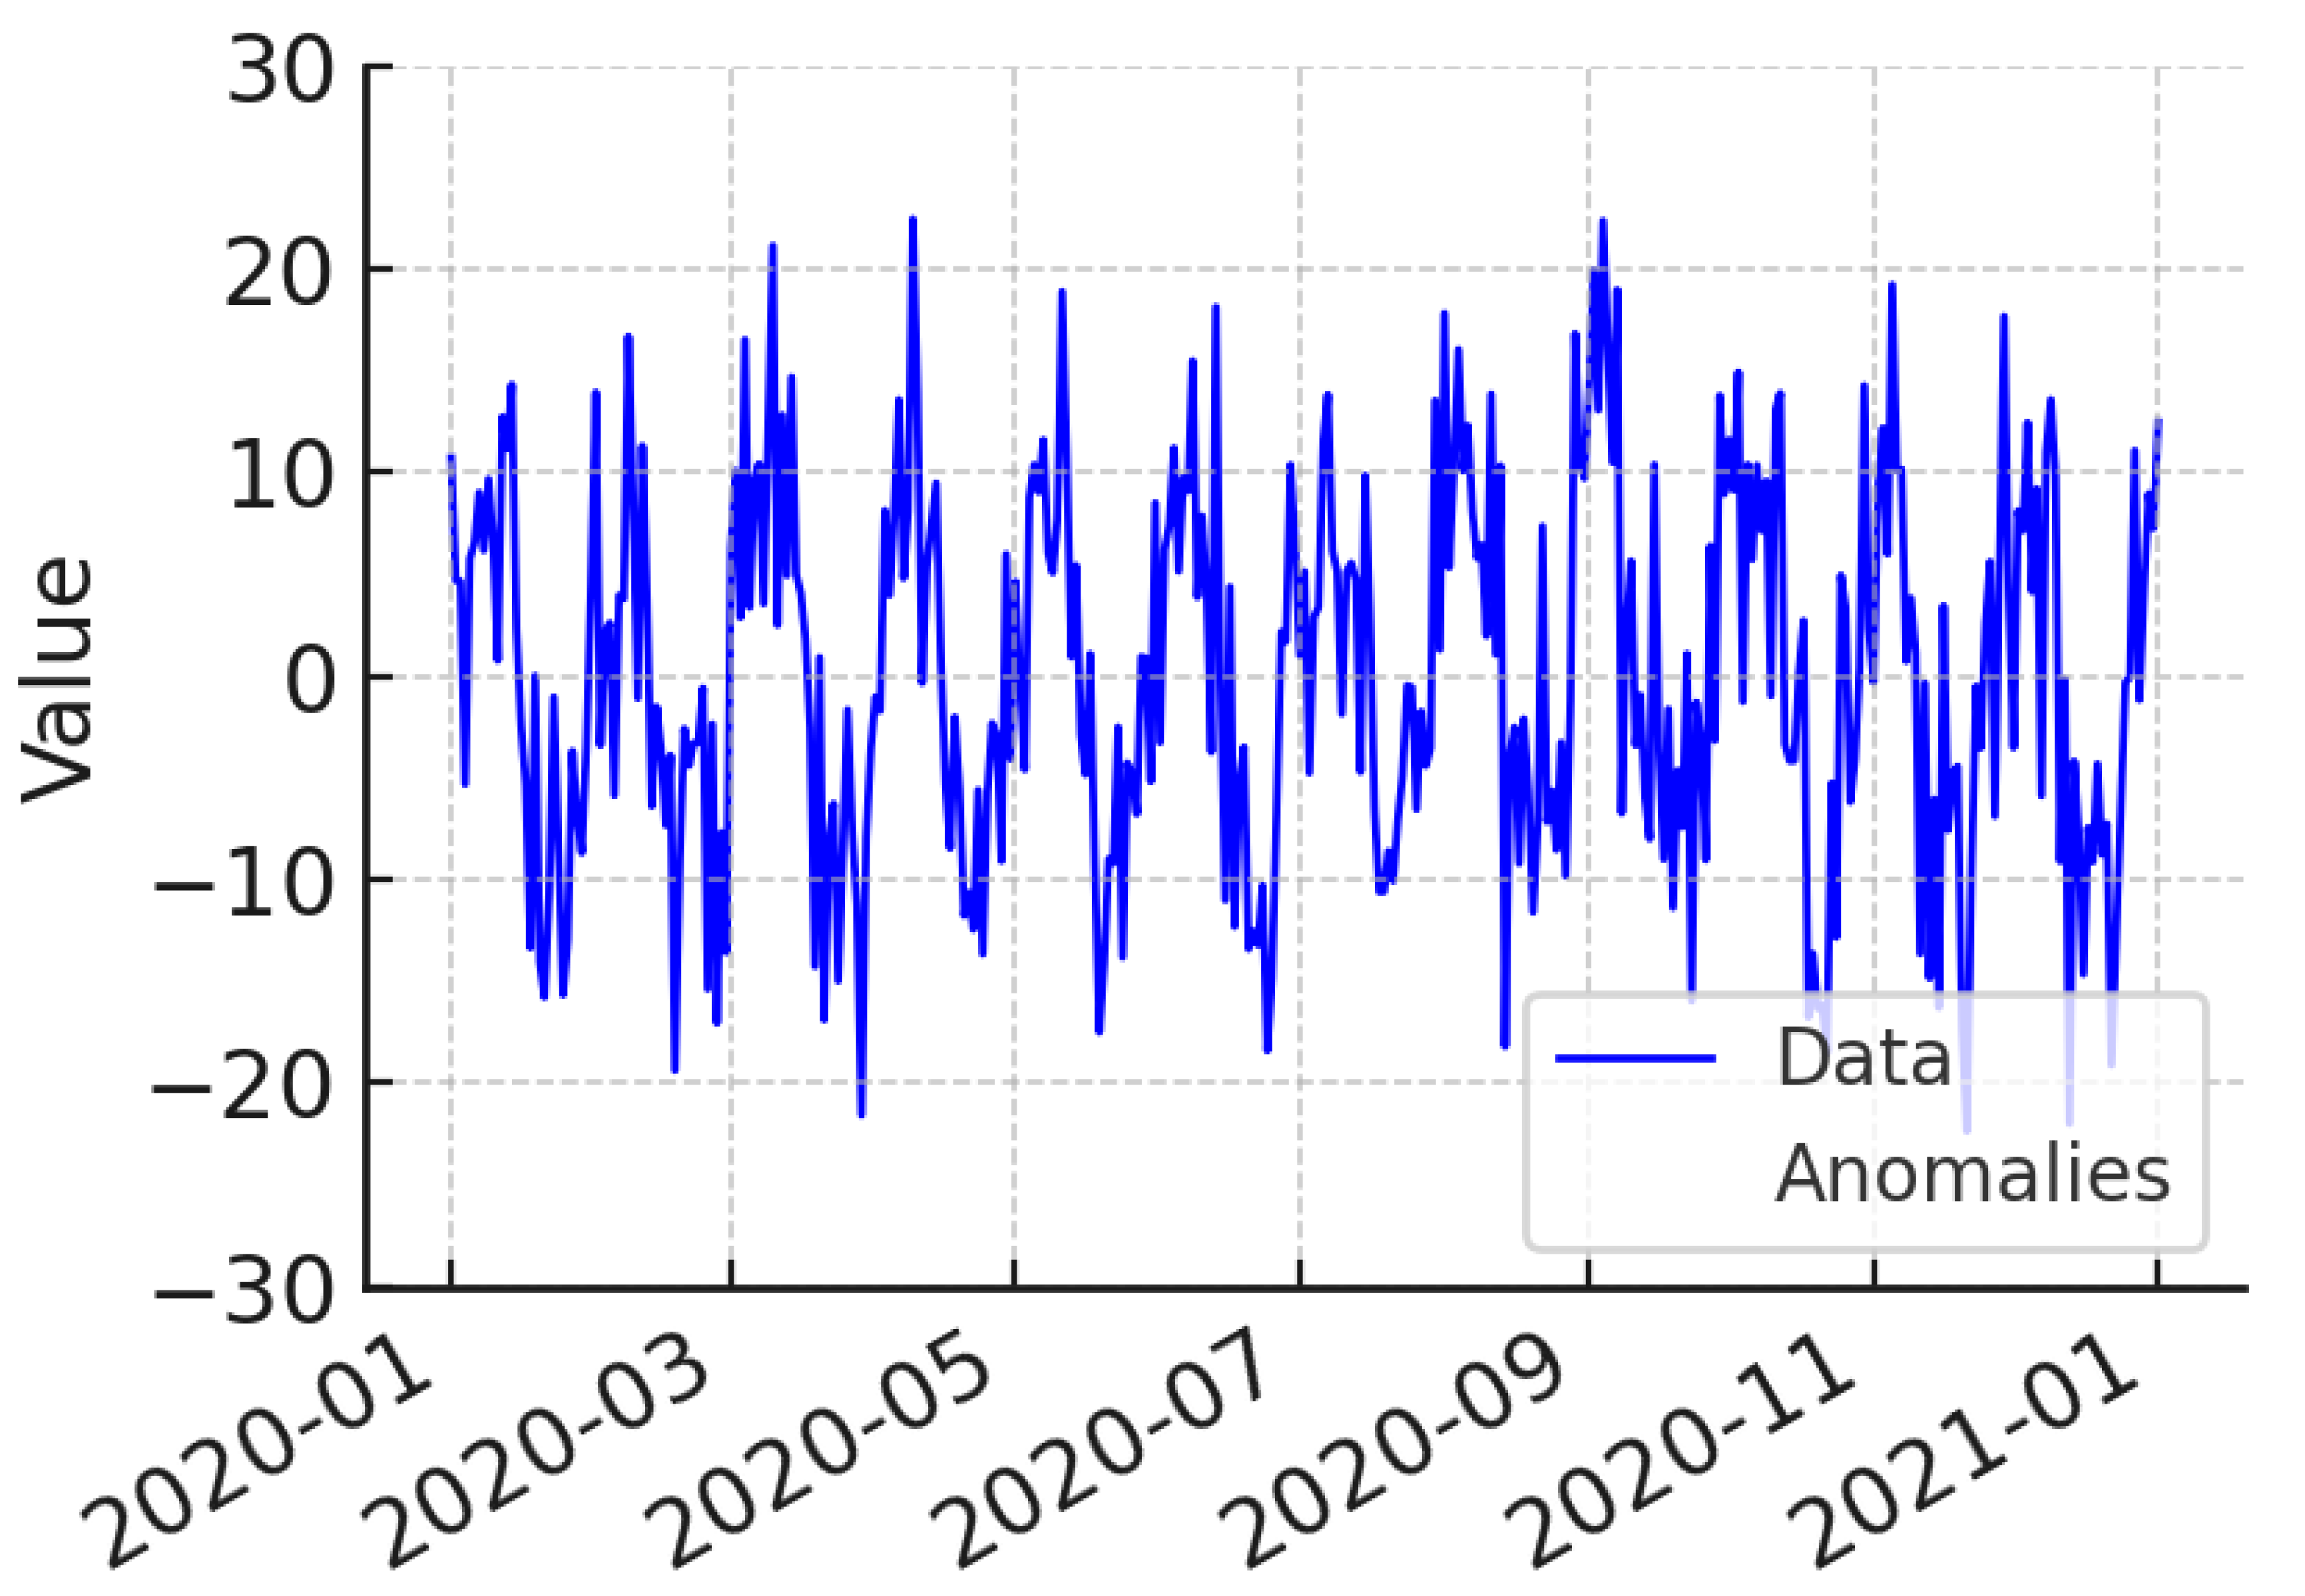
Figure 4 highlights several irregularities during the observation period. In the second half of the series, it shows a sudden deviation from the usual seasonal cycle. During this time, external shocks impacted the system.
At the change point, the time series shifts. During these points, potential regime changes indicate alterations in the underlying process without affecting normal seasonal patterns.
Figure 5 shows the change point detection.
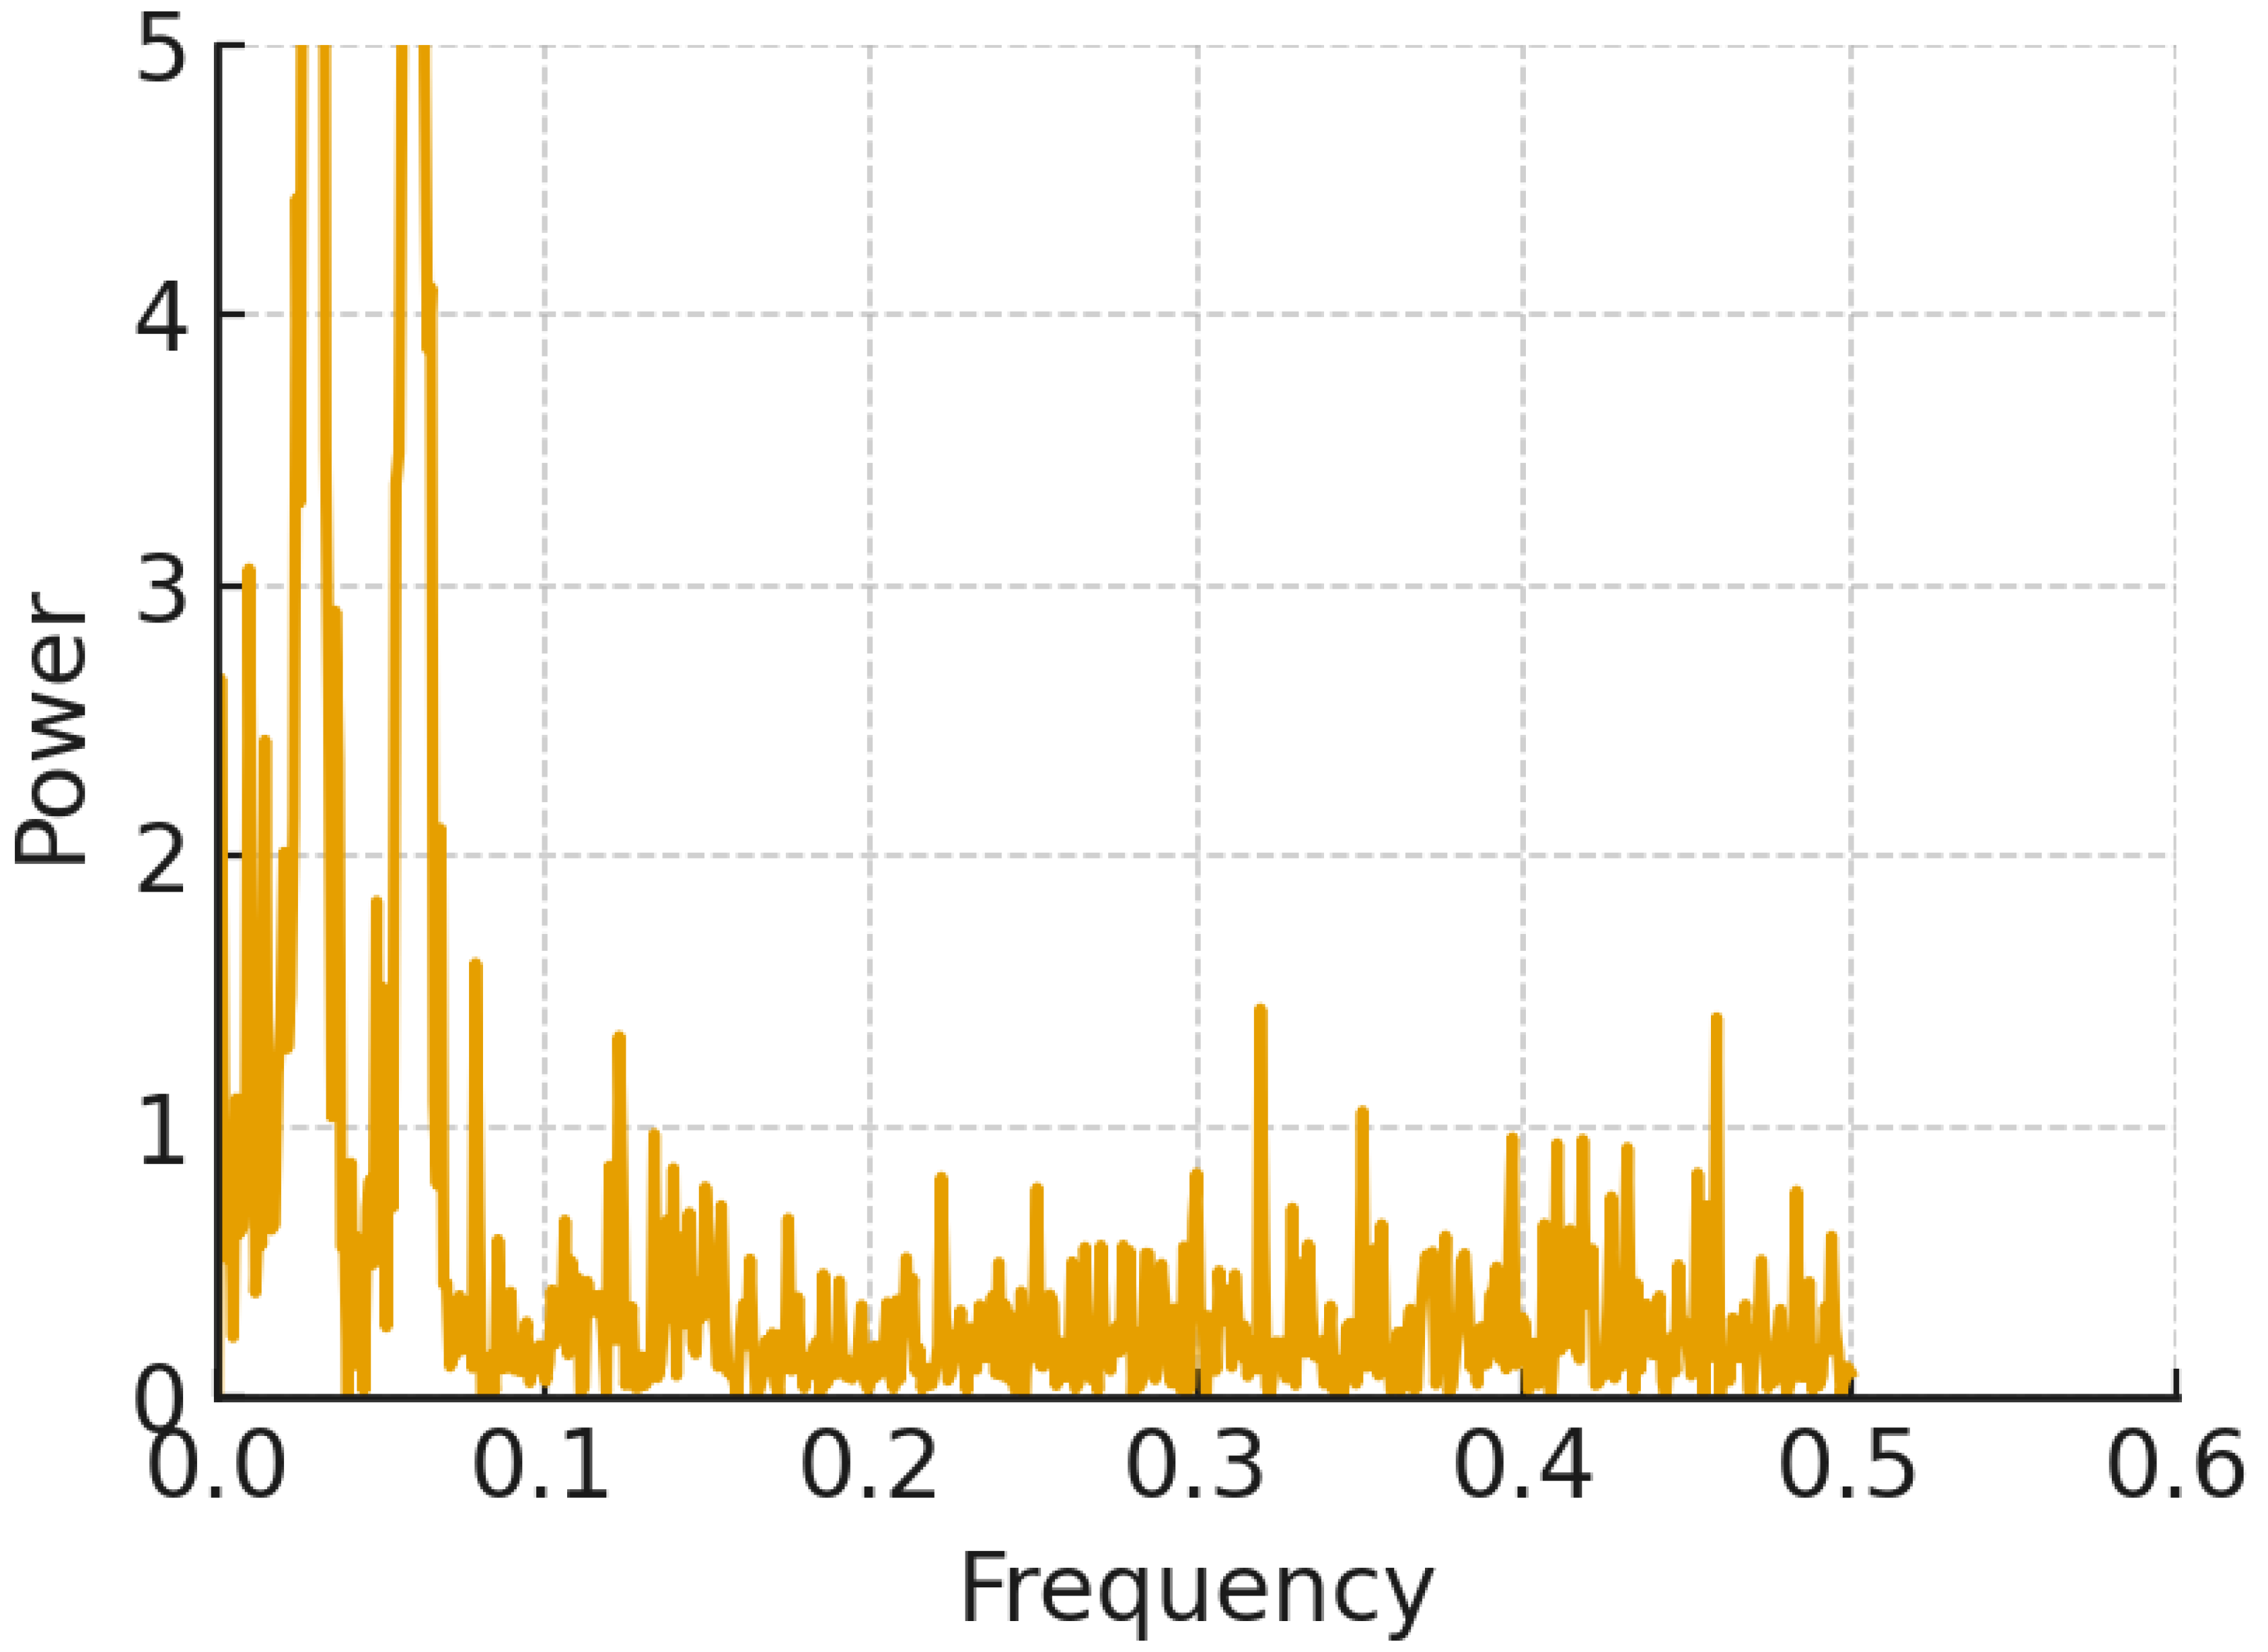
Figure 6 highlights the low-frequency components, revealing strong seasonal cycles in the time series. When the sharp peaks are near zero frequency, the behavior is periodic. The absence of significant signals at higher frequencies suggests limitations in capturing short-term irregularities.
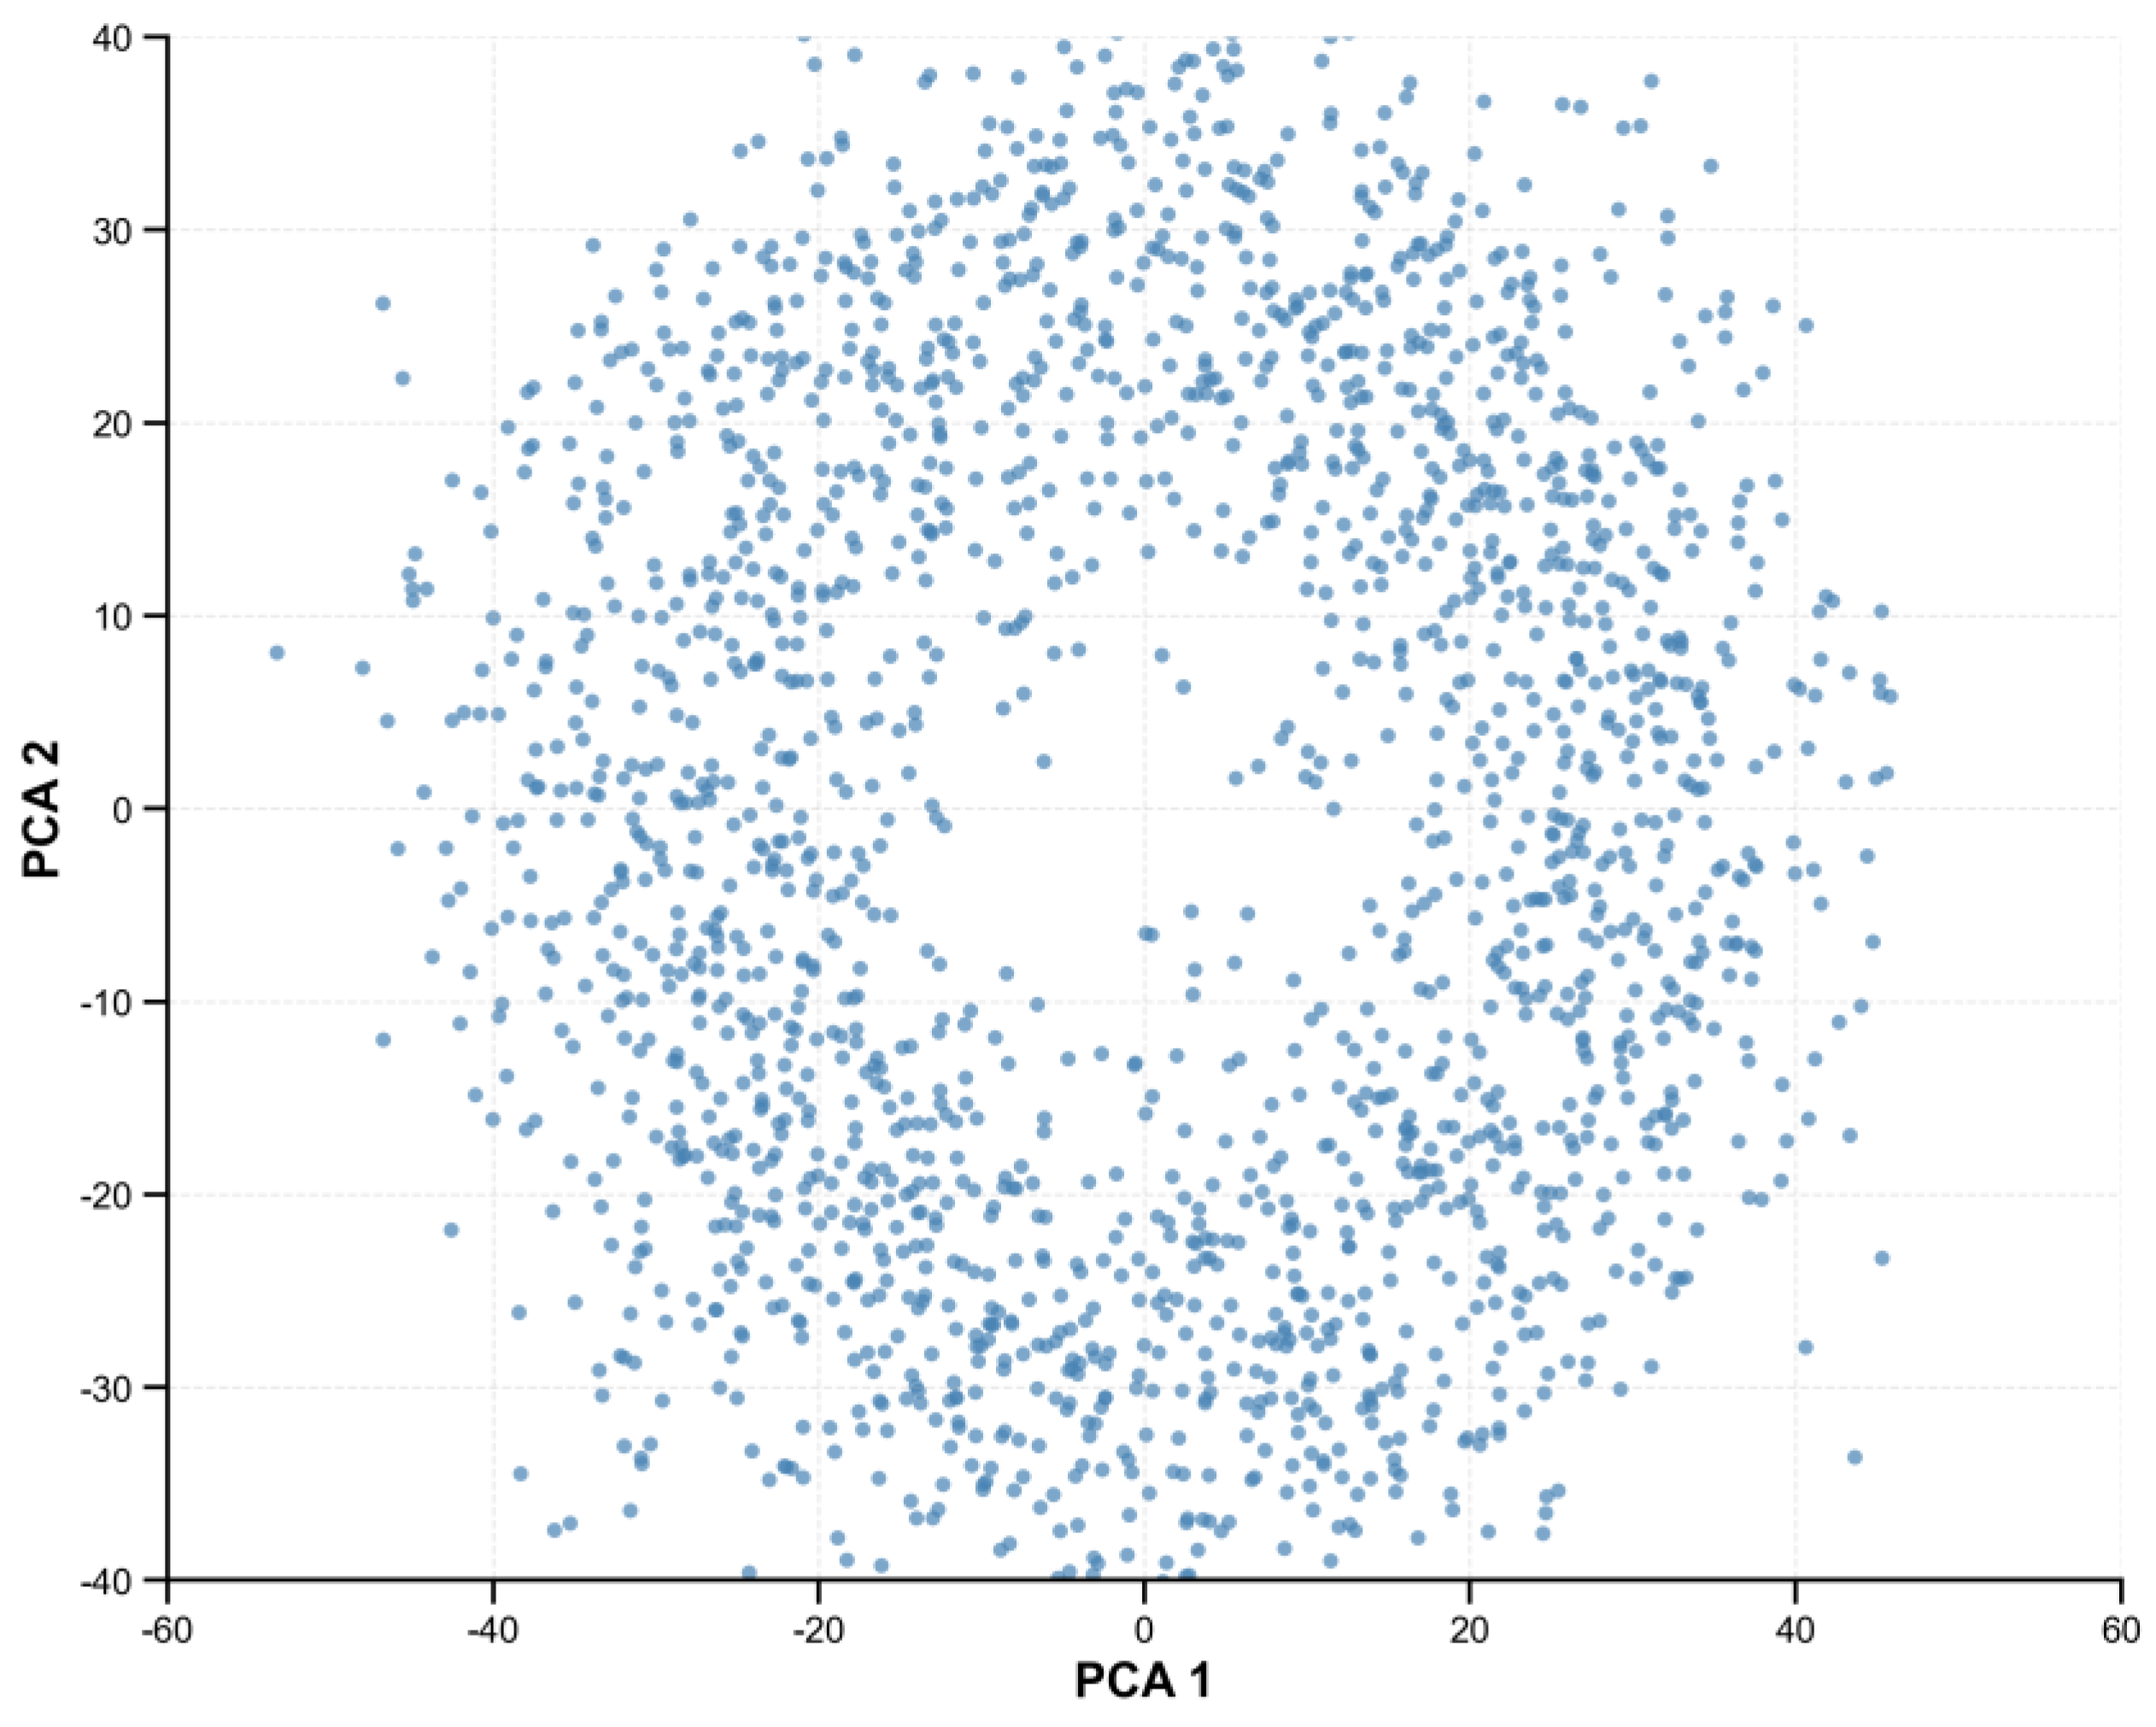
The PCA method reduces the data of a time series to two principal components. This figure shows different patterns that are not dominated by a linear structure.
Figure 7 illustrates the PCA method. Principal Component Analysis (PCA) was conducted on a 444 × 7 matrix, where each row represents a unique region–product pair and each column corresponds to the monthly average price from January to July 2025. Prior to applying PCA, each column of monthly prices was standardized to zero mean and unit variance to ensure comparability across months and mitigate scale effects.
The PCA was implemented using a standard Singular Value Decomposition (SVD) routine (e.g., the scikit-learn PCA function in Python)(3.13.0) with default settings. The first principal component explained 79.1% of the total variance, while the second component accounted for 13.7%, resulting in a combined cumulative variance of 92.8%. This indicates that the first two components captured the vast majority of systematic variability present in the standardized data.
To obtain a parsimonious and interpretable low-dimensional representation, we retained these first two principal components for subsequent clustering and visualization analyses. Including a third component would only marginally increase the cumulative explained variance to 96.3%, without materially altering the cluster configuration or interpretation.
The filtering process followed a transparent and reproducible protocol. Only region–product pairs with at least four months of valid data were retained, ensuring sufficient temporal coverage and reducing noise from sparsely represented items. Missing monthly observations—accounting for approximately 18% of all matrix entries—were imputed using the average price of the corresponding product across regions for that specific month. This conservative imputation method preserves inter-regional comparability while minimizing distortion in temporal price patterns.
Overall, this procedure ensured that the PCA and subsequent clustering were based on a coherent, standardized, and well-documented dataset, enhancing both the robustness and replicability of the empirical results.
This figure demonstrates that the ellipses of each cluster will be bigger when the value of membership uncertainty is bigger.
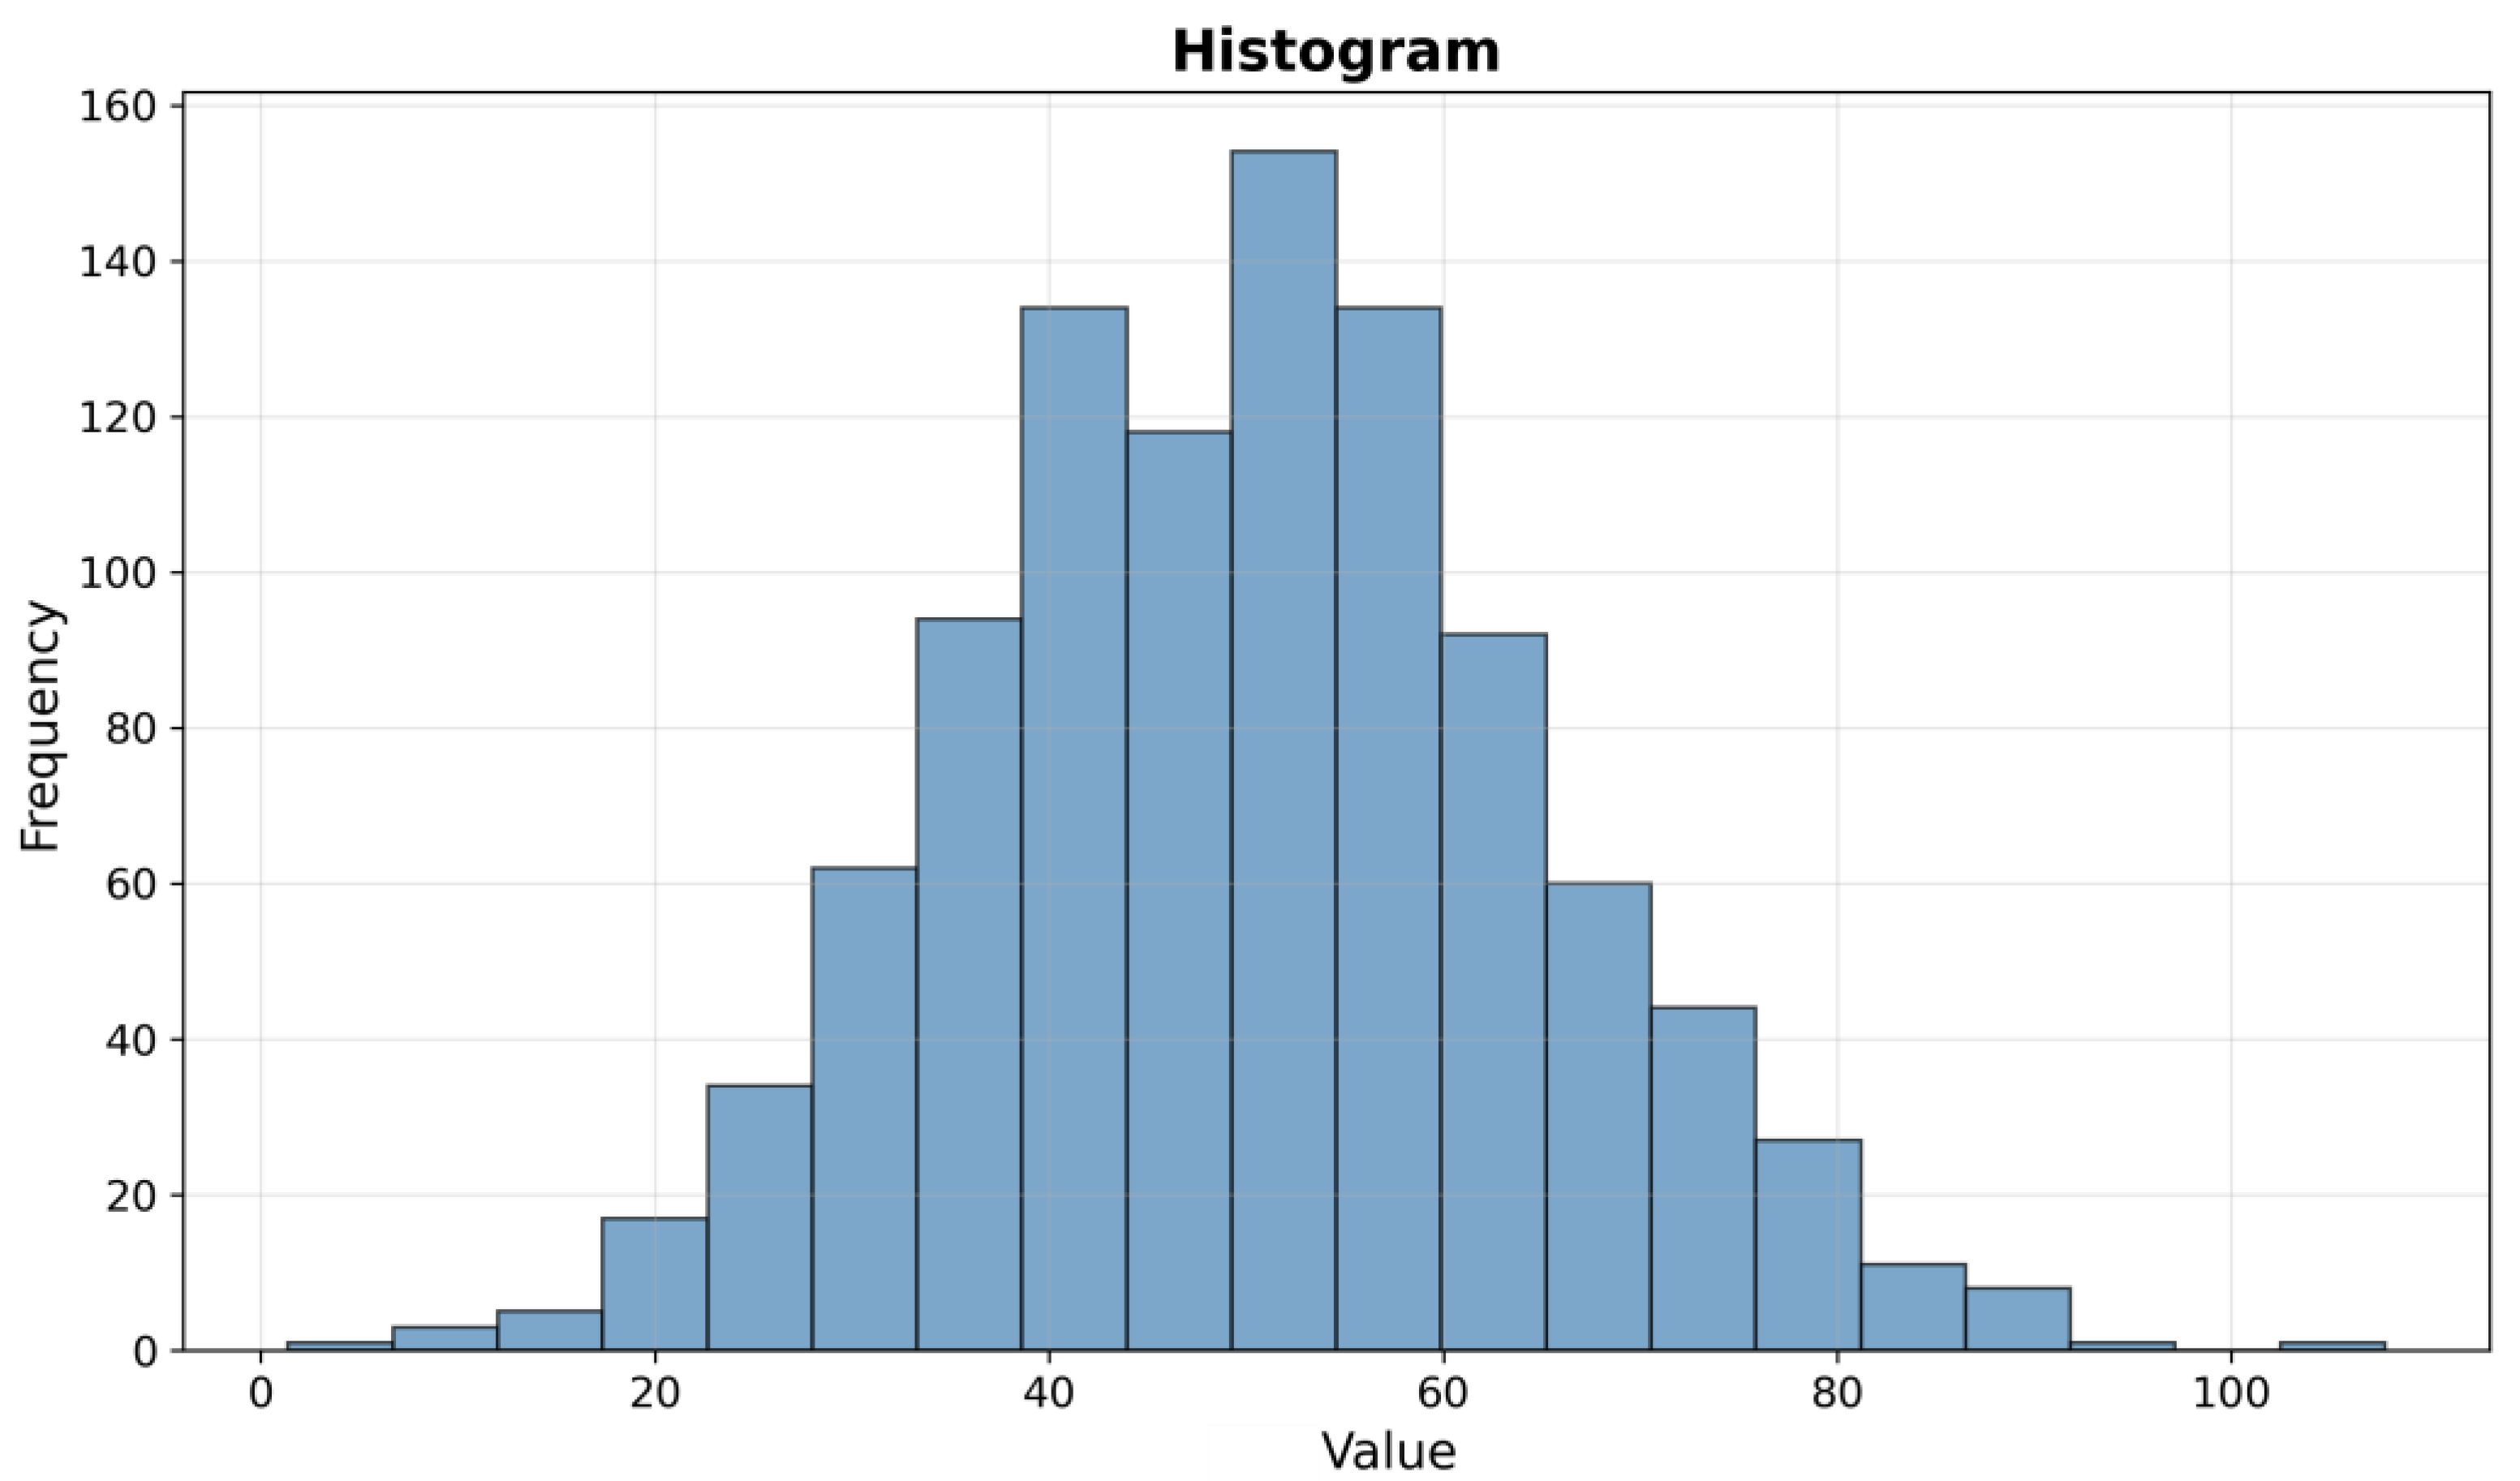
Figure 8 shows that most values were around 10, indicating a positive skew in the series.
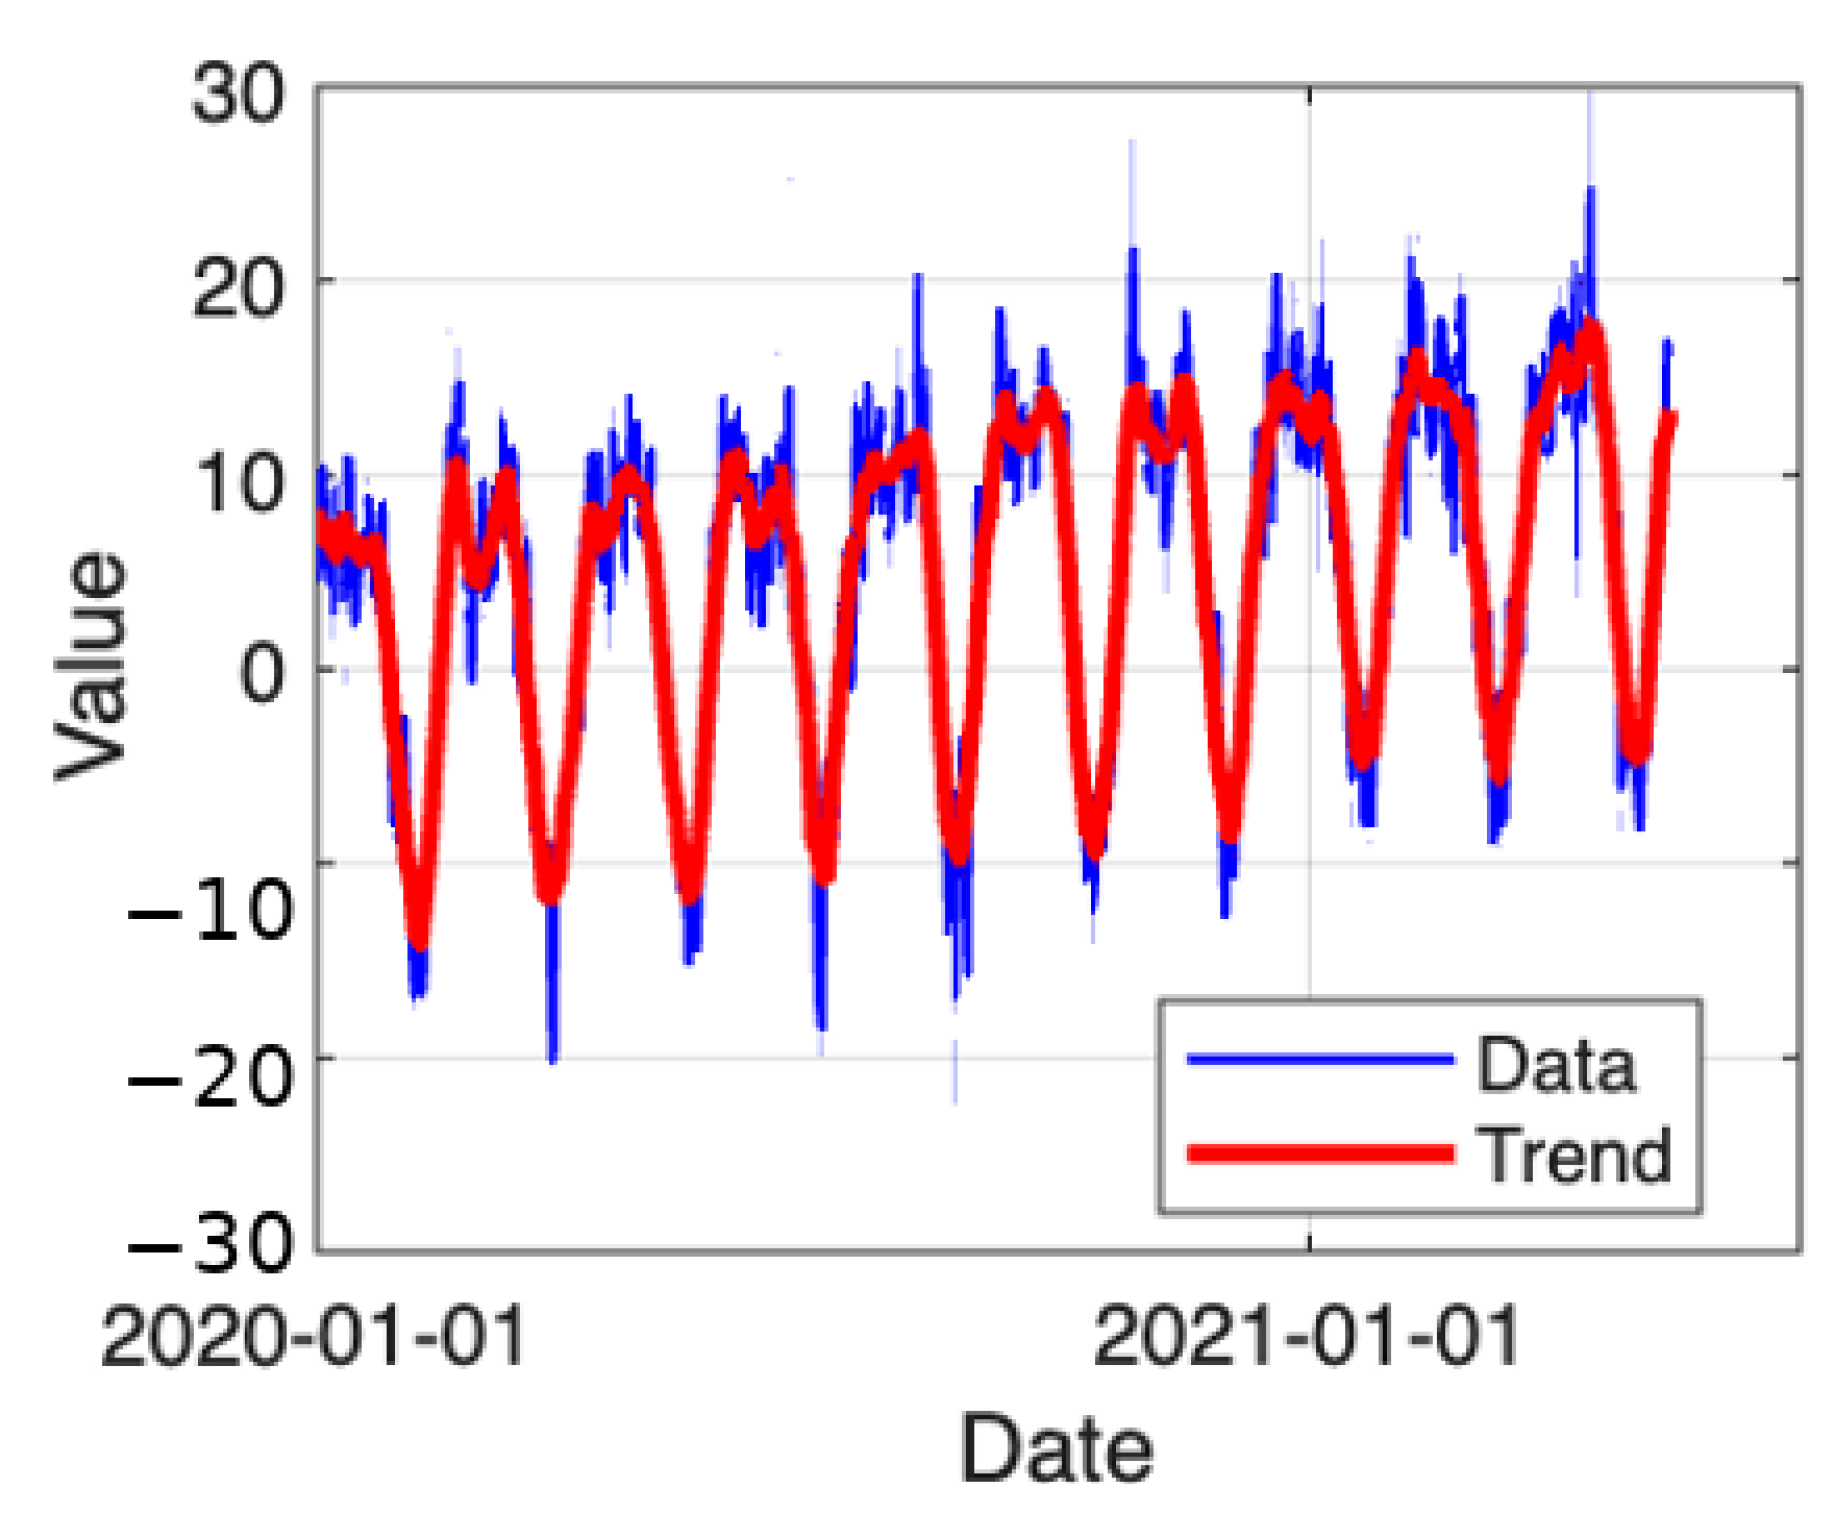
Figure 9 shows an upward trend embedded within seasonal cycles of data. When short-term fluctuations are strong, the red trend line indicates a long-term increase over the observation period.
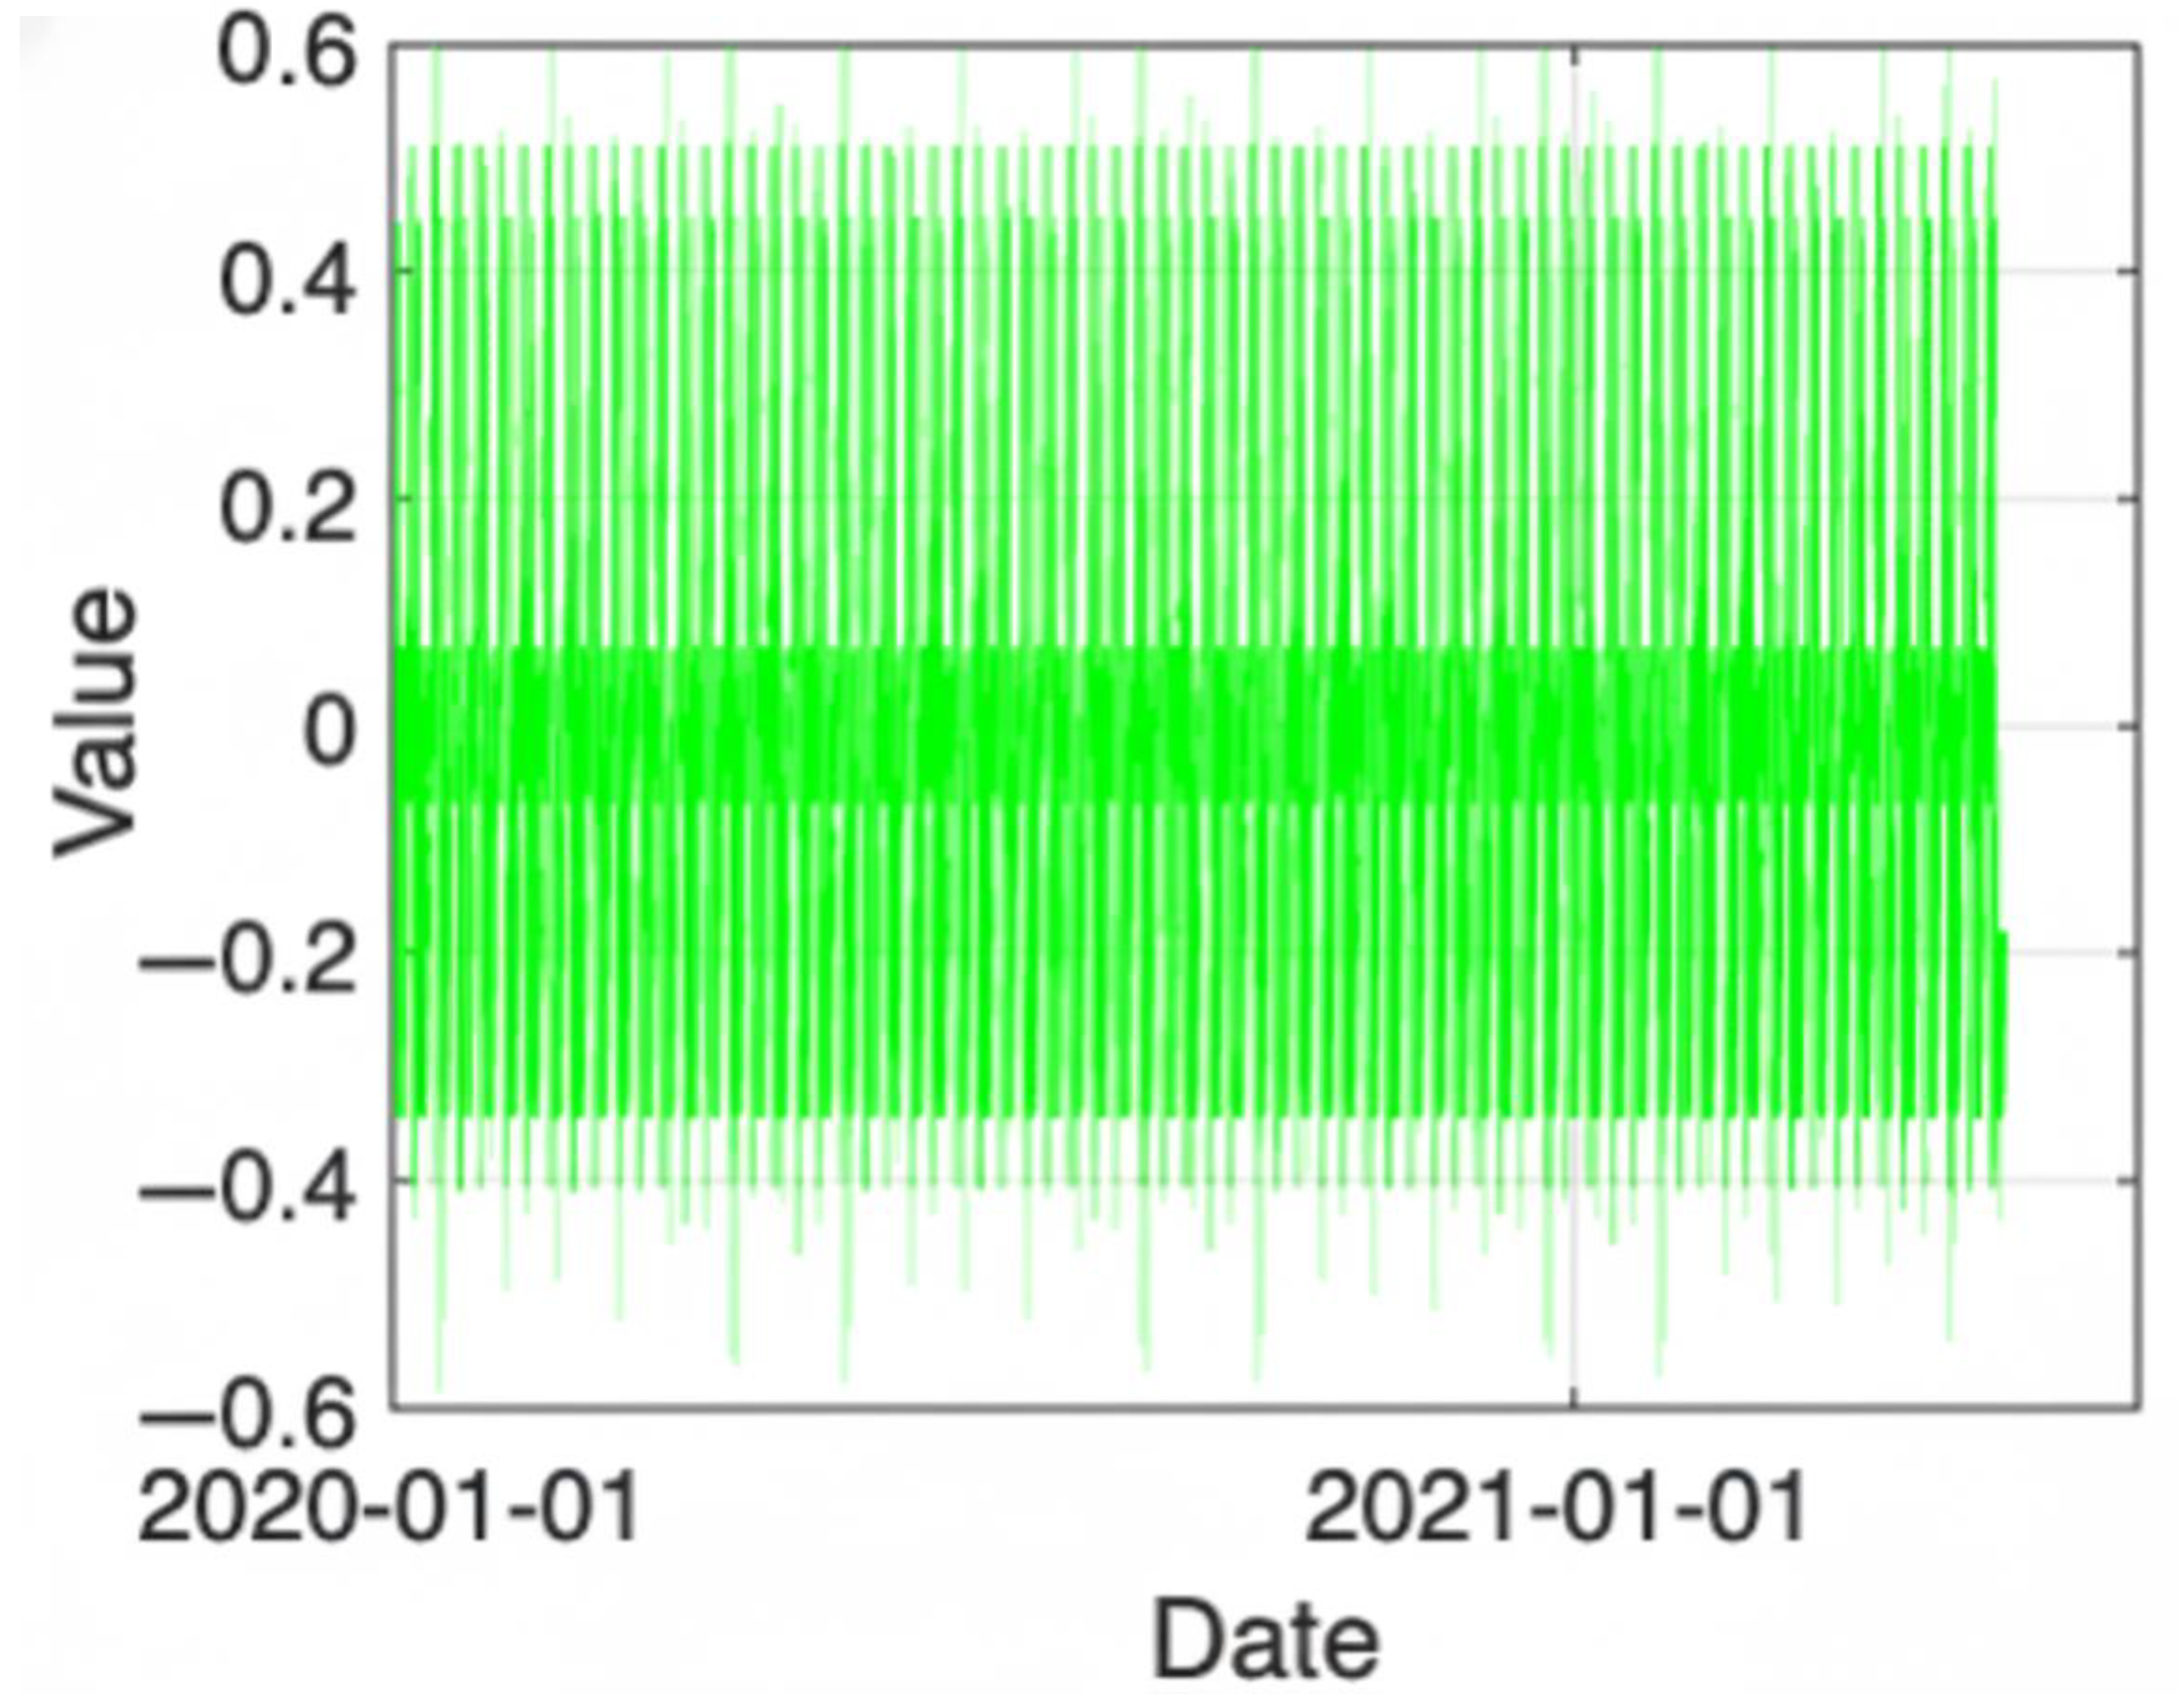
Figure 10 demonstrates a strong and consistent pattern of periodicity for all series, showing stability over time and highly regular fluctuations.
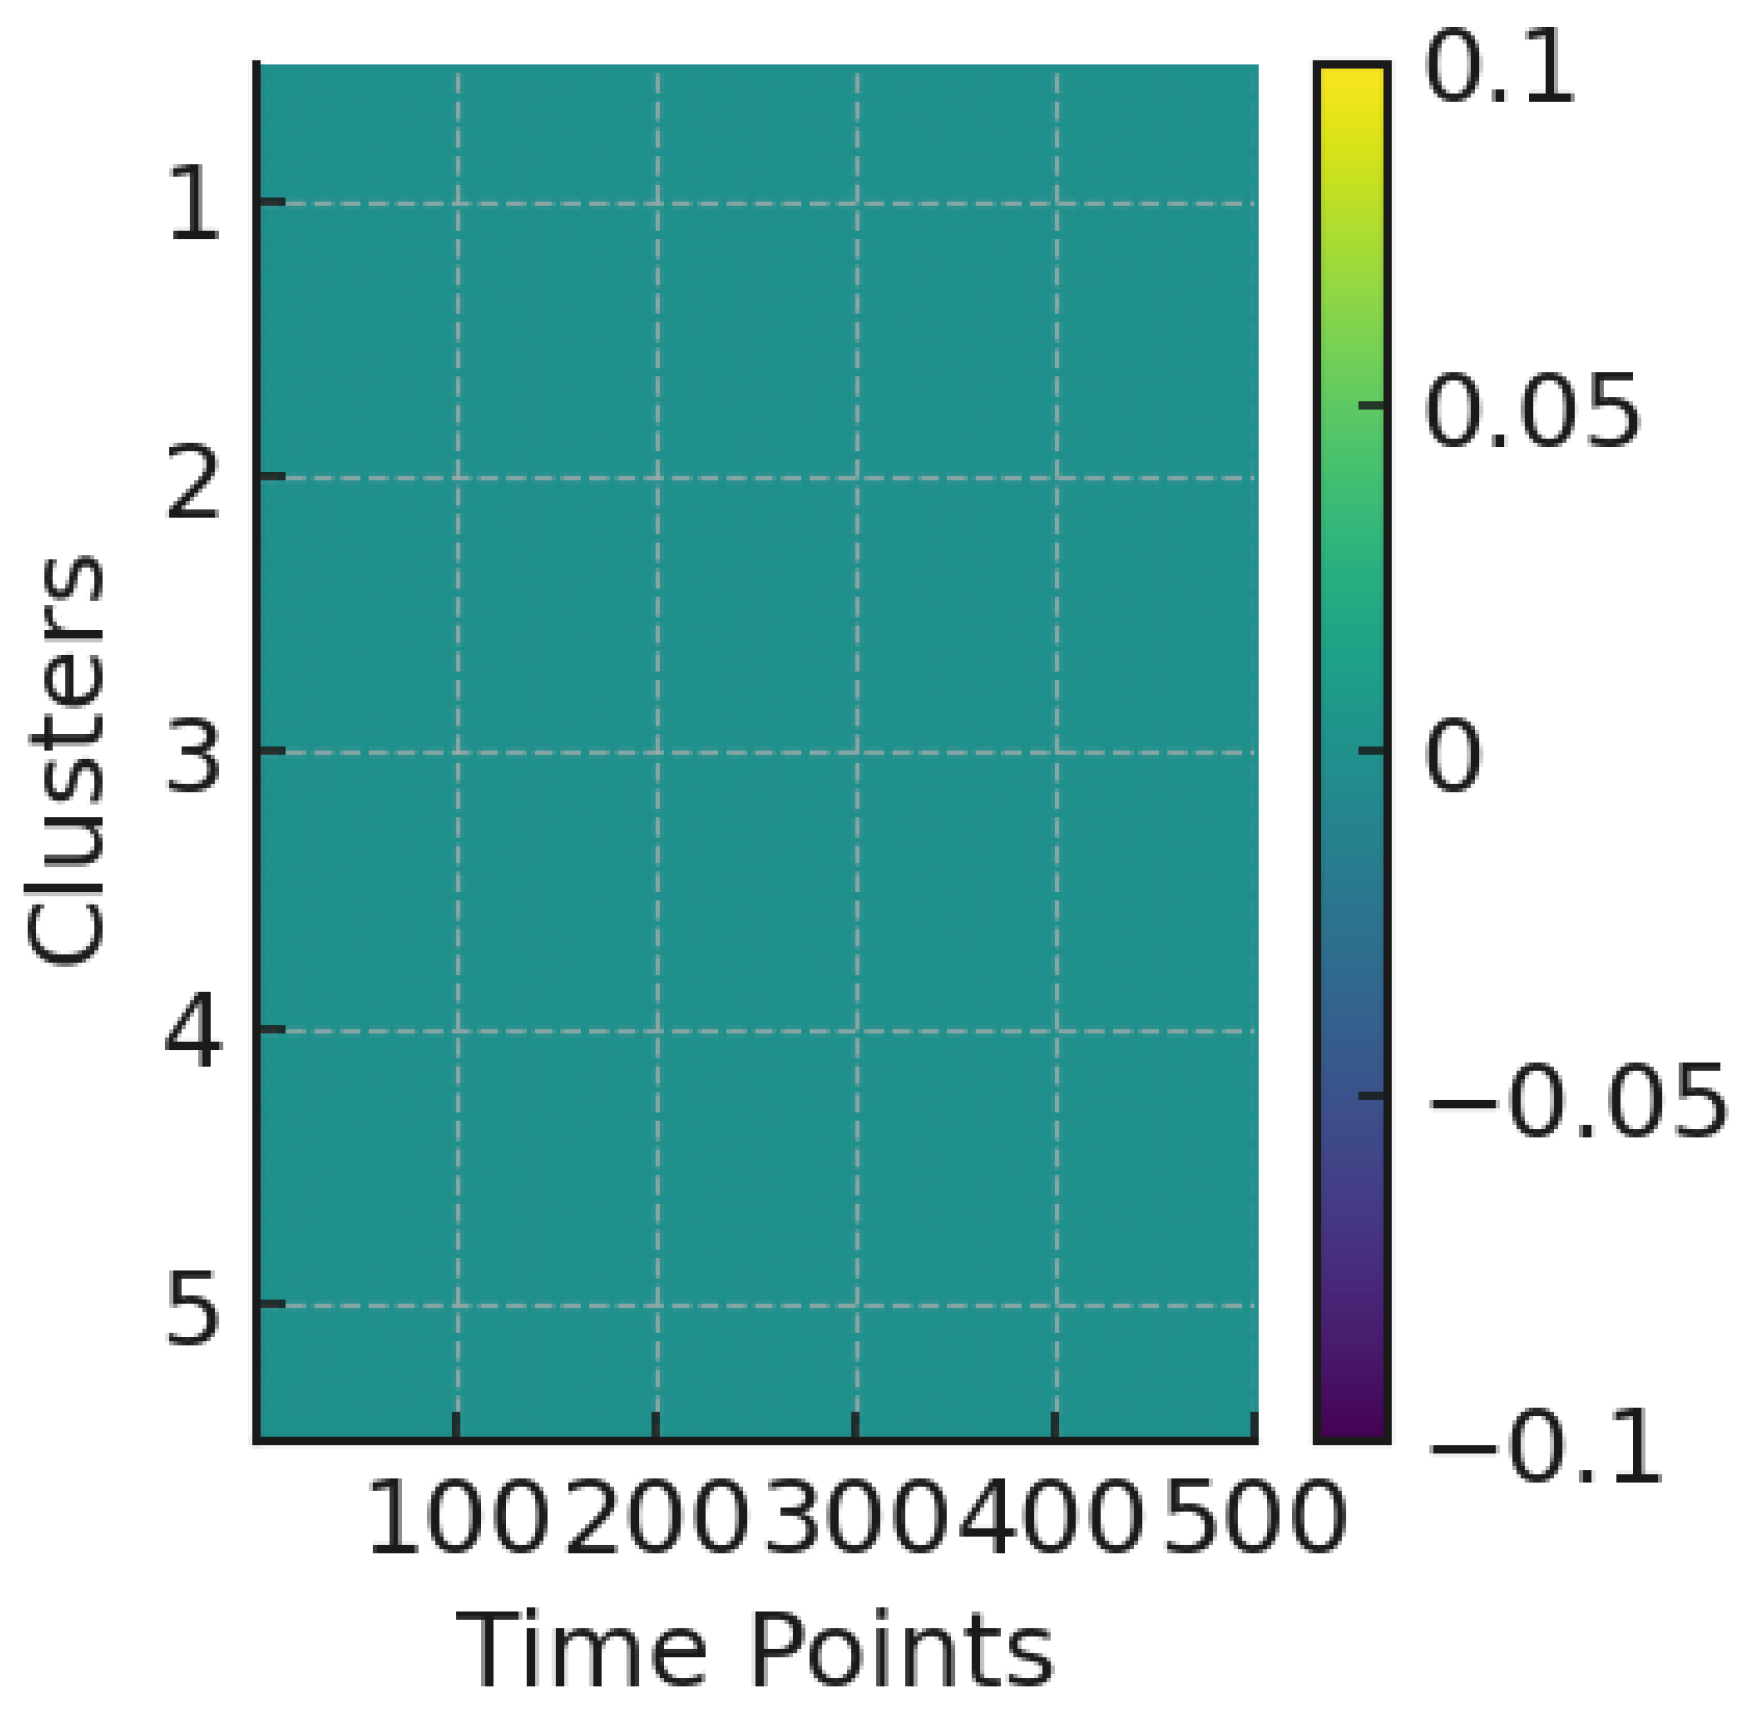
The GMM cluster probability, as indicated in
Figure 11, is always assigned to the cluster with the highest probability. In other words, it does not indicate a clear separation among the data, and the series demonstrates strong homogeneity.
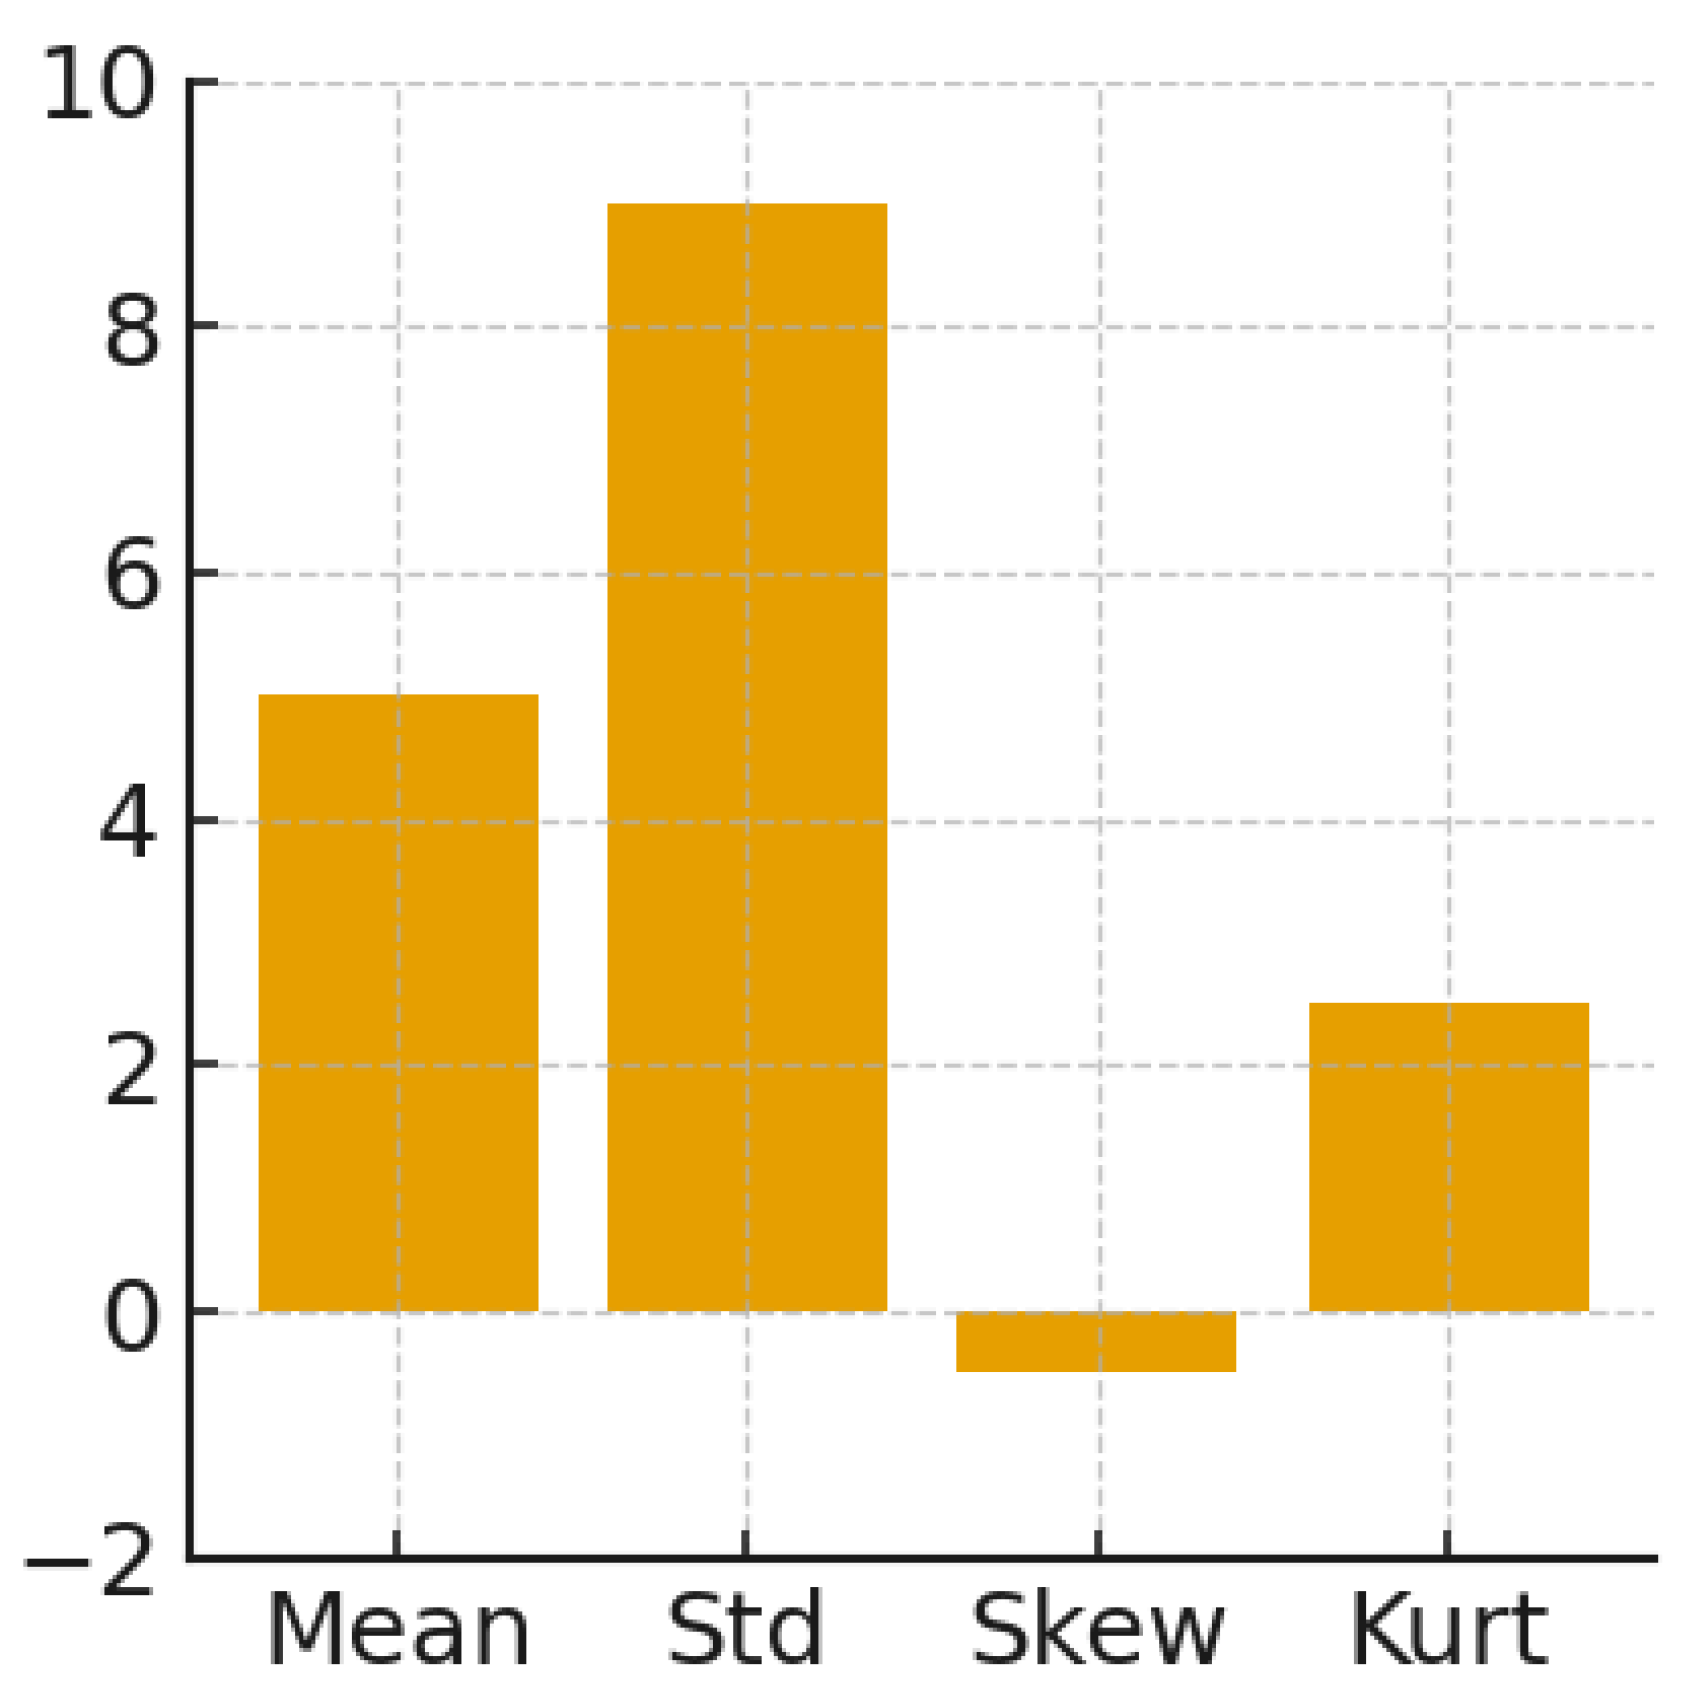
The mean of the data was 5, which was above the reference value. The standard deviation was 9, indicating substantial variability and a negative skew, which suggests that higher values were more common. The kurtosis points out a distribution with a heavier tail than the normal curve.
Figure 12 shows statistical information about the data.
Sensitive Analysis
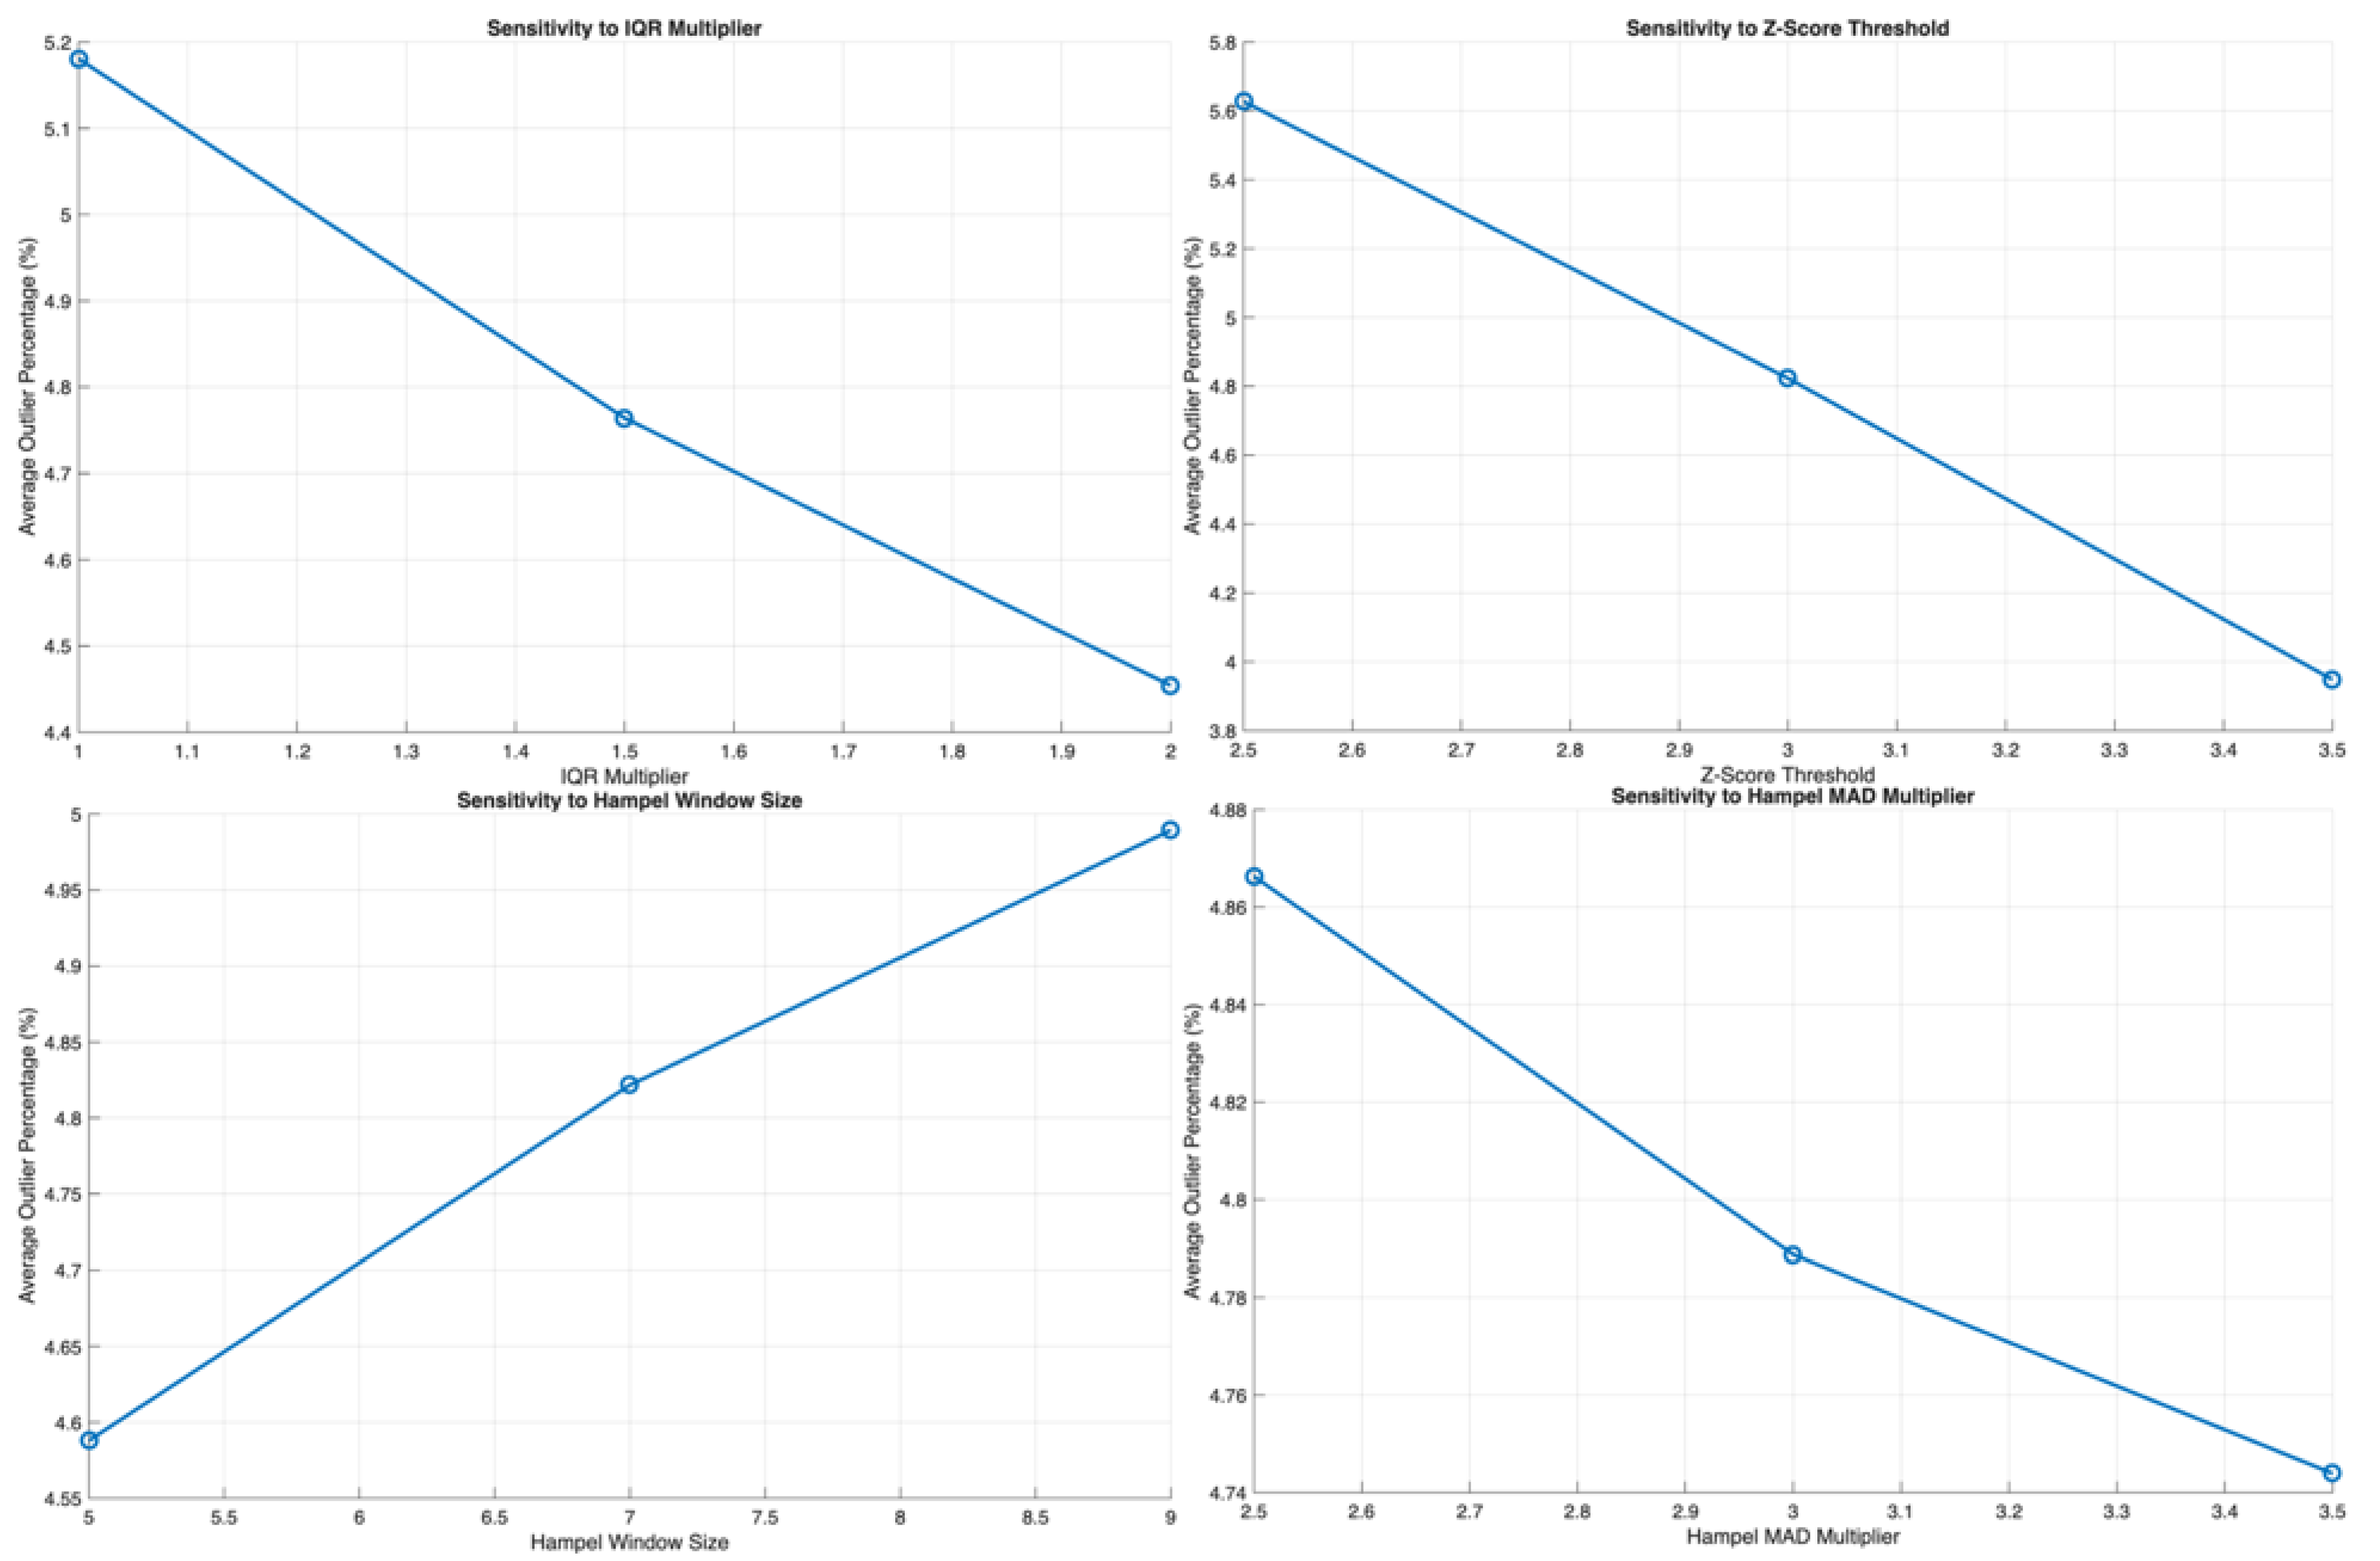
The sensitivity analysis indicates that gradually increasing the IQR multiplier lowers the outlier percentage. A downward trend occurs when the Z-score threshold is raised under more relaxed cutoff criteria. Expanding the Hampel window increases the number of detected outliers when a wider neighborhood makes deviations more apparent. Finally, slightly raising the Hampel MAD multiplier reduces the outlier percentage; however, this effect is less significant compared to other methods.
To formally assess the robustness of the clustering outcomes, we extended the sensitivity analysis to quantify the influence of key parameter choices on the final regional configuration. Specifically, the systematic varied three critical elements:
- (i)
The number of retained principal components,
- (ii)
The anomaly-score threshold, and
- (iii)
The clustering hyperparameters (e.g., linkage criteria and distance thresholds) within a reasonable range around the baseline values. For each parameter combination, the complete analytical pipeline—including preprocessing, PCA, anomaly detection, and clustering—was re-executed. The resulting regional partitions were then compared with the baseline configuration using two complementary metrics: the Adjusted Rand Index (ARI), which measures the similarity between partitions, and the proportion of regions that changed cluster assignment. In most cases, ARI values exceeded 0.8, and fewer than Y% of regions switched cluster assignments. Only under extreme parameter values were notable reclassifications observed, primarily involving regions near cluster boundaries. These findings confirm that the identified clusters are robust to moderate perturbations in preprocessing and modeling choices. This stability reinforces the reliability of the observed spatial patterns and ensures that the derived interpretations are not artifacts of arbitrary parameter selection but rather reflect consistent underlying market structures.
Figure 13 demonstrates a sensitive analysis of the data.
5. Results and Discussion
This research involved decision-makers employing hybrid machine learning methods to identify optimal clustering and operational strategies. It also included a sensitivity analysis to assess the model’s reliability. The study focused on detecting anomalies in quality control, predictive maintenance, risk management, and supply chain monitoring systems. Findings revealed a trade-off between accuracy and efficiency in anomaly detection. Tighter thresholds make it easier to identify irregularities, reducing the chance of missing critical disruptions or fraudulent activities. Although this approach increases false alarms, it also impacts the monitoring team’s workload and investigation costs. Therefore, a lower threshold reduces alerts and operational expenses while minimizing the risk of overlooking harmful anomalies. This helps managers prioritize tasks and effectively balance organizational goals, risk tolerance, and available resources.
The research proposes various methods tailored to different managerial contexts. For example, when the goal is to detect sudden changes or unusual behaviors in short-term operations—such as demand spikes or sensor issues—it is most effective to adjust the thresholds for the Interquartile Range (IQR) and Z-score. Conversely, the Hampel method, which uses a larger window size, is better suited for long-term detection, while regime- or system-shift analysis helps identify deeper structural risks. These insights support the implementation of multi-layered monitoring systems that combine various anomaly detection techniques. Such stratification reduces blind spots and enhances decision-making. The findings demonstrate that these systems can respond faster and more efficiently. Incorporating adaptive anomaly detection frameworks into digital dashboards, enterprise resource planning (ERP) systems, or digital twins improves transparency and enables quicker, more informed decisions. Moving from static, uniform thresholds to adaptive, data-driven calibration increases confidence in automated decision-support tools and enhances organizational agility. Additionally, managerial implications include better resource allocation and workforce planning. Overly strict thresholds can generate many false positives, increasing staffing needs and costs, and hampering efficiency. Conversely, too lenient thresholds may overlook critical issues, risking reputational or financial damage. Sensitivity analysis serves as a strategic tool to help managers allocate resources more effectively, ensuring monitoring efforts align with process importance. Finally, the results underscore the value of including sensitivity analysis in the overall organizational learning cycle. Managers should view sensitivity testing not only as a technical validation step but also as a means to align detection practices with long-term objectives, including efficiency, sustainability, and resilience. Using adaptive thresholds in monitoring allows organizations to reduce costly disruptions, maintain operational continuity, and connect short-term controls with long-term strategic aims. The clustering method showed a ΔBIC ≥ 10 and silhouette ≥ 0.45; the demand regime will be switched to pricing and inventory factors when BOCPD arises. Based on a line of ΔF1 ≥ 0.05 (95% CI non-overlap), the weekly production will be determined. Cost curves identify thresholds.
This combination of methods, including QR/Z-score/Hampel, additive/FFT, PCA, GMM, CUSUM/BOCPD, bridges spectral features and regime segments and provides robust analysis to ensure managers can rely on this model.
To strengthen the empirical interpretation of the regional clusters and the detected anomalies, we explicitly connected them to observable economic and logistical events within the national context. The cluster encompassing northern regions such as Arica y Parinacota and Tarapacá exhibited systematically higher price levels and greater volatility. This pattern is consistent with their geographical remoteness from the main production centers located in central-southern Chile, their reliance on long-distance transportation, and the influence of cross-border demand from Peru and Bolivia. In contrast, the central regions formed a more homogeneous cluster characterized by lower price variability, reflecting their proximity to agricultural production areas and denser logistics and distribution infrastructure.
Several of the most pronounced positive price anomalies coincided temporally with documented supply disruptions, such as extreme weather events that affected harvest volumes and road connectivity, as well as periods marked by significant increases in fuel and transportation costs. Conversely, negative anomalies tended to align with temporary oversupply conditions resulting from abundant harvests or surges in imports. By explicitly linking the empirical clusters and anomaly episodes to these policy, climate, and logistics factors, the results become more interpretable and offer a coherent narrative of regional market dynamics in Chile’s agricultural sector.
The empirical analysis relied on official wholesale price data reported by the Chilean wholesale market system. The dataset comprised 113,511 daily observations of fruits and vegetables recorded between 2 January and 18 July 2025, covering 12 wholesale markets across 9 regions of Chile. Each record includes detailed information on the date, region, market, product, variety, quality grade, origin, traded volume, and three price indicators—minimum, maximum, and volume-weighted average price (expressed in CLP per commercialization unit).
To ensure analytical consistency, only records with valid, strictly positive values for both volume and prices, and with clearly identified regions and products, were retained, corresponding to the full set of 81 products available during the study period. Daily prices contained no missing values and had already undergone quality control by the statistical authority; therefore, no additional ad hoc outlier removal was required.
For the multivariate analysis, it constructed a panel of monthly prices by computing, for each region–product pair, the monthly average of the volume-weighted price, resulting in 532 region–product series over seven months (January–July 2025). To avoid excessively short time series, only combinations with at least 4 months of valid data were retained, yielding 444 series for the PCA and clustering stages. Missing months within these retained series (approximately 18% of all matrix entries) were imputed using the average price of the corresponding product across all regions in that month, thereby preserving comparability across regional markets.
Possible Future Impact of U.S. Tariffs
Although the empirical analysis presented here is based on current trade conditions, potential future changes in U.S. tariff policies could substantially reshape the context in which Chilean consumers and producers make decisions. A prospective increase in U.S. tariffs on imported goods may alter global trade flows, elevate transportation and input costs for perishable agricultural commodities, and generate additional price volatility within domestic markets.
For Chile, such shocks could manifest as higher retail prices, reduced product diversity, and greater uncertainty for producers and retailers, potentially with adverse implications for agricultural welfare and household food security. While these effects are inherently prospective and cannot yet be quantified with existing data, they underscore how external trade policies may either amplify or dampen the regional patterns identified in our clustering results. Consequently, these developments warrant careful monitoring by policymakers and supply chain decision-makers.
6. Conclusions, Future Research, and Limitations
This research shows that noise-resistant hybrid pipelines can effectively analyze and categorize the diverse behaviors of Chilean wholesale fruit and vegetable prices. By combining a three-stage noise reduction process (IQR, Z-score, and Hampel filters) with temporal–spectral decomposition, PCA-based dimensionality reduction, and probabilistic clustering via Gaussian Mixture Models, the study identified five regional groups that reflected different levels of market activity and volatility. The findings suggest that the northern and southern regions have lower variability and weaker connections, while central areas—especially Santiago, Valparaíso, and Antofagasta—show higher volatility and greater systemic influence. These results confirm that robust preprocessing combined with probabilistic modeling provides a reliable framework for uncovering hidden economic patterns in noisy agricultural price data.
The contribution of this work extends beyond empirical segmentation. The proposed hybrid framework enhances the analytical capacity to detect regime shifts and anomalies that traditional linear models overlook. By applying change-point detection and spectral density analysis, the study captured both abrupt disruptions—such as policy shocks and supply interruptions—and gradual drifts induced by macroeconomic conditions. This dual sensitivity underlines the operational relevance of noise-resilient analytics for perishable supply chains, where the early identification of structural transitions enables proactive interventions in pricing, replenishment, and logistics. In this regard, the research bridges methodological rigor with managerial applicability, reinforcing the notion that predictive stability and interpretability are essential precursors to decision value.
From a methodological standpoint, this paper advances the state-of-the-art in agricultural price modeling by coupling decomposition-based denoising with probabilistic clustering and sensitivity-driven calibration. While prior studies have focused on either predictive accuracy or volatility modeling (e.g., Wang et al. [
1], Zhao et al., [
2]), this work integrated both domains within a unified, interpretable structure. The inclusion of sensitivity analysis provides a quantitative foundation for understanding threshold effects, parameter robustness, and the trade-off between detection precision and monitoring costs—an area often neglected in the literature. This comprehensive approach contributes to the growing body of research advocating adaptive, data-dependent thresholds as a cornerstone of resilient analytics.
Limitations and Future Research
The current implementation focused exclusively on price time series and their derived statistical features, without explicitly including exogenous determinants such as transportation costs or climatic conditions. Nevertheless, the proposed framework is inherently flexible and can be extended to incorporate such variables in a structured manner.
Future work could enrich the feature matrix by integrating region-specific covariates that capture key external drivers of price formation. These include, for example, fuel prices, transportation and freight costs, distances to major production hubs, and climate indicators such as rainfall anomalies, temperature extremes, or drought indices. These exogenous variables could be incorporated either as additional dimensions in a principal component analysis or as conditioning variables in a multivariate anomaly-detection model.
Including these external drivers would enhance the explanatory and diagnostic power of the clusters, allowing for a clearer distinction between price fluctuations driven primarily by local shocks (e.g., supply disruptions or regional demand surges) and those induced by broader macroeconomic or climatic factors. Furthermore, such integration would support a more comprehensive interpretation of regional heterogeneity and improve the framework’s utility for policy design and real-time decision support in agricultural market monitoring.
Despite these contributions, certain limitations persist. The current framework relies on regional aggregation, which may obscure intra-regional heterogeneity and micro-level behavioral patterns within markets. Additionally, while the unsupervised structure of Gaussian mixtures is well-suited to exploratory analysis, future research should explore supervised or semi-supervised extensions that incorporate exogenous variables such as climate indicators, transportation costs, or policy interventions. Furthermore, the temporal resolution could be enhanced by using high-frequency transaction data, enabling dynamic updates and near-real-time anomaly detection. Such extensions would further solidify the practical deployment of this methodology within digital decision-support environments.
Future research could explicitly model the effects of prospective U.S. tariff adjustments on import prices, logistics costs, and consumer welfare in Chile. Once post-implementation data become available, empirical analyses could validate the qualitative scenarios proposed here and quantify their impact on consumer behavior and market stability.
Overall, this study establishes a robust and generalizable foundation for the noise-resilient analysis of agricultural price dynamics, uniting statistical precision, computational efficiency, and operational insight. By integrating decomposition, probabilistic modeling, and sensitivity calibration into a coherent analytical pipeline, this approach offers an adaptable methodological framework for regional economic characterization and adaptive anomaly detection. The evidence presented supports a broader research agenda that integrates machine learning and econometric reasoning in agri-food systems, ultimately contributing to more transparent, data-driven, and resilient supply chain governance. A limitation of this study is its reliance on regional aggregation. For future studies, researchers can consider additional factors, such as climate indicators, transportation costs, or policy interventions.
