Abstract
The specialization of tea gardens represents a significant pathway to enhancing the international competitiveness of agriculture. However, it may also disrupt the supply–demand balance of ecosystem services. This study addresses this gap by focusing on the specialized tea zone of Anxi as a case study. Using the InVEST model, we quantitatively assessed four key ecosystem services between 1990 and 2020: carbon storage, habitat quality, water yield, and soil conservation. The findings reveal that tea gardens perform relatively well in terms of carbon storage and habitat quality. However, their capacity for water conservation is limited, and soil conservation is highly susceptible to human disturbance. Dynamic transitions between tea gardens and forests have exerted considerable influence on changes in ecosystem services, with policies and practices aimed at converting tea plantations back to forest demonstrating a positive role in ecological restoration. Finally, guided by the principles of nature-based solutions, this study proposes targeted strategies to provide scientific support and practical references for sustainable development in specialized agricultural regions.
1. Introduction
Tea is a distinctive and economically significant crop, characterized by its strong adaptability to cultivation conditions, high yield potential, and considerable economic added value. In recent years, the area dedicated to tea gardens has expanded rapidly, accompanied by a marked increase in the level of specialization within the industry. A specialized tea zone is a geographically defined area dedicated to concentrated tea production. It is characterized by a clear regional agricultural layout and a highly specialized division of labor within the industry [,]. Agricultural specialization plays a crucial role in alleviating food security concerns, advancing agricultural modernization, and promoting industrial development. It also contributes to enhancing agricultural productivity [], facilitating low-carbon emissions reduction, and supporting the sustainable development of the agricultural economy []. The spatial agglomeration of crop cultivation is a key feature of agricultural specialization. This process involves concentrating the planting and management of one or a few specific crops within a particular region, driven by natural ecological conditions and technological factors. From an ecological and geographical perspective, this represents a shift from dispersed cultivation to geographically concentrated agricultural production [].
However, the transformation of natural habitats into intensive land-use patterns has led to the fragmentation and loss of biodiversity []. Concurrently, the expansion and intensification of tea cultivation can lead to environmental challenges, including soil erosion, water scarcity, and nutrient depletion. Therefore, the progression toward specialized tea gardens, with its associated land-use and ecosystem changes, underscores the necessity of a systematic evaluation of the evolving ecosystem services and their underlying driving mechanisms. It is critical to use adjustments in planting structures as a strategy to assess how tea garden specialization affects ecosystem services. Achieving a balance between economic benefits and ecological preservation can significantly contribute to regional ecosystem management and spatial governance.
Ecosystem services refer to the environmental conditions and benefits that form and sustain human survival and development. These services are directly linked to the sustainable development of both human society and ecosystems, serving as the prerequisite for maintaining normal ecosystem functions and ecological security [,]. They are also a key mechanism for integrating natural ecosystems with socio-economic functions [,]. Current research on ecosystem services primarily encompasses several key areas: trade-off and synergy relationships, the classification of ecosystem service bundles [], and the identification of ecological functional zones []. These analyses are conducted across diverse spatial and administrative scales. However, at this stage, global scholarship on ecosystem services is predominantly concentrated on large-scale studies [,] or those centered around specific ecosystem types [], showing a tendency toward medium and large scales, whereas research at smaller scales, such as county and township levels, remains comparatively limited.
Furthermore, land use/land cover change (LUCC) driven by human activities directly influences the composition and configuration of ecosystems, ultimately affecting their capacity to deliver ecosystem services []. For instance, in high-elevation regions of the United States, LUCC can alter carbon balance and water flow []; in tea plantations in China, expansion-driven changes impact regional carbon storage dynamics []; and in terrestrial ecosystems in Mexico, both LUCC and climate change jointly affect carbon storage []. Spatial changes in land use are also a critical factor influencing the future provision and location of ecosystem services []. However, as a distinctive cash crop, tea is characterized by strong adaptability and high yield [], which has led to a significant increase in the specialization of tea plantations, accompanied by land use changes and rapid transformation of natural ecosystems []. Yet, existing studies predominantly analyze the impact of agricultural specialization on production efficiency from an economic perspective [,], with limited attention paid to its environmental and ecological effects at the county level. Therefore, it is essential to conduct a systematic assessment of the evolution of ecosystem service functions during the specialization of the tea plantation.
Based on this, the study systematically evaluates four key ecosystem services-carbon storage, habitat quality, water yield, and soil conservation in Anxi County from 1990 to 2020 by integrating its natural topographic features, ecological environment, and socio-economic development conditions, using the InVEST model. It aims to address the critical scientific question of “the changing trends of ecosystem services in specialized tea-growing areas and the impact of tea plantation expansion on these changes.” This research examines the spatial patterns and spatiotemporal dynamics of ecosystem services within specialized tea plantation systems. Theoretically, it broadens the research framework of ecosystem services. Practically, it offers nature-based solutions to advance sustainable development across ecological, social, and economic dimensions during county-level urbanization and agricultural industrialization.
2. Overview of the Study Area and Data Sources
2.1. General Description of the Study Area
Anxi County is situated in the coastal region of southeastern China. It acts as a vital link in the cooperative development zone between the mountainous areas of southwestern Fujian and the Xiamen–Zhangzhou–Quanzhou Bay Area (117°36′–118°17′ E, 24°50′–25°26′ N). Positioned at the transitional zone between the urban clusters of Xiamen Bay and Quanzhou Bay and the mountainous hinterlands, Anxi plays a crucial role in regional ecological and socioeconomic connectivity (Figure 1). According to data from the Third National Land Survey, the total land area of Anxi County is approximately 2993.79 km2, administratively divided into 15 towns and 9 townships, encompassing 488 villages and communities. Based on the Seventh National Census, the registered population of Anxi County reaches 1.212 million. Anxi is renowned as the birthplace of Tieguanyin, one of China’s most famous oolong teas, and is widely recognized as the “Hometown of Oolong Tea” in China. With a tea cultivation history spanning over a millennium, the region specializes in growing six nationally recognized tea cultivars, among which Tieguanyin dominates in terms of planting area. Anxi ranks first in Fujian Province in terms of tea garden area, accounting for approximately one-third of the province’s total tea plantation area. Approximately 80% of the county’s population is engaged in tea-related industries, and the total output value of the tea industry reached 32 billion yuan. As such, tea cultivation has become a core pillar of the local economy, positioning Anxi as one of the most specialized tea-producing regions in China. The specialized tea gardens in Anxi County are shown in Figure 2 and Figure 3.
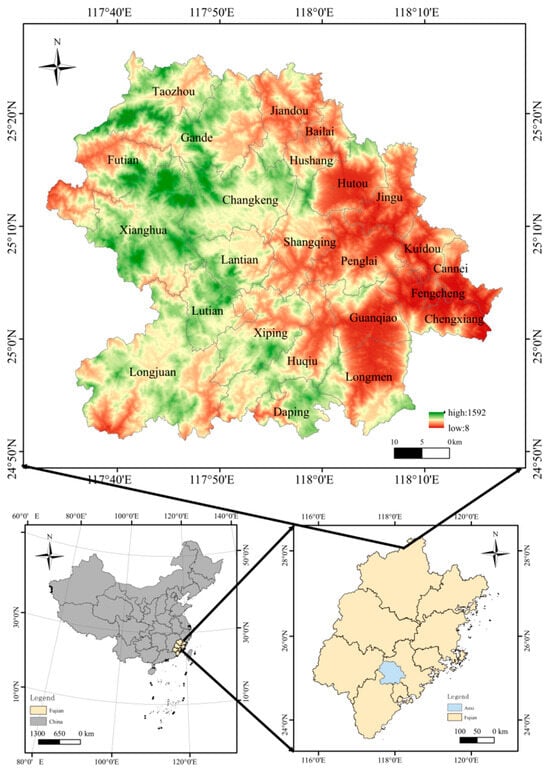
Figure 1.
Location Map of Anxi County.
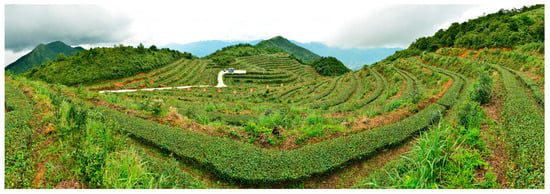
Figure 2.
Characteristics of specialized tea-growing areas in Anxi County (I).
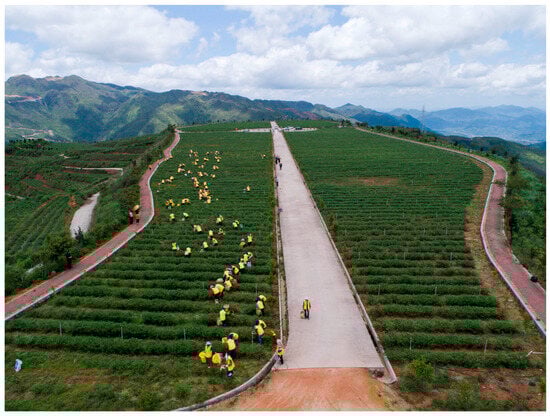
Figure 3.
Characteristics of specialized tea-growing areas in Anxi County (II).
2.2. Data Sources
This study focuses on the period from 1990 to 2020 to ensure temporal continuity and data availability. Using five-year intervals, it captures distinct stages in the evolution of land use patterns, which correspond to the dynamics of tea planting area and industry development in Anxi County. A total of seven time-phase land use datasets were obtained for the years 1990, 1995, 2000, 2005, 2010, 2015, and 2020. All remote sensing data used in this study have a spatial resolution of 30 × 30 m, ensuring comparability and suitability for multi-temporal land use analysis. Based on these datasets, remote sensing images from corresponding years were interpreted and analyzed to extract seven major land use types: forest, tea garden, grassland, farmland, bare land, water bodies, and artificial land. This process led to the establishment of a multi-temporal land use database. It serves as a foundation for subsequent land use change monitoring and analysis. All remote sensing data were sourced from Landsat satellite imagery, obtained via the Geospatial Data Cloud platform (http://www.gscloud.cn/, accessed on 10 March 2023), which offers high-quality, wide-coverage, and scientifically rigorous remote sensing data.
3. Materials and Methods
Currently, commonly used ecosystem services assessment models among scholars primarily include InVEST, SolVES, ARIES, UFORE, and MIMES []. However, with the exception of the InVEST model, the others have yet to achieve substantial development []. The InVEST model, in contrast, integrates multiple modules (such as water yield, soil conservation, carbon storage, and habitat quality modules). Moreover, the InVEST model is known for its user-friendly operation and comprehensive coverage of various ecosystem services processes. These features make it widely applicable, and it has been extensively applied and validated across different scales for its reliability []. Therefore, this study conducts all ecosystem services assessments based on the InVEST model (version 3.13.0, Natural Capital Project, Stanford, CA, USA).
3.1. Carbon Storage Accounting Method
The InVEST model calculates total carbon storage by multiplying the carbon density of each land-use type by its respective area. The carbon storage density table in this study is mainly assigned values by referring to relevant studies. The carbon storage density for the four tea garden types draws on Liu Yu’s research on ancient tea gardens in Yunnan []. The carbon storage density of the aboveground part of other land use types mainly refers to the research results of Wang Kaide []. The specific formula is as follows:
Here, represent the four carbon pool types: above-ground carbon pool, below-ground carbon pool, soil carbon pool, and litter fall carbon pool, respectively. The total carbon storage () is calculated as the summation of carbon storage density for the ii-th land use type (i) multiplied by its corresponding area (i), expressed as:
3.2. Habitat Quality Accounting Method
Habitat quality refers to the accessibility of living resources and characterizes biodiversity attributes. Higher habitat quality indicates greater biodiversity, along with structural and functional integrity within its historical dynamic range. The habitat quality (HQ) is calculated as follows:
Among them, represents the habitat quality of the x raster cell of the j type of land use/cover, represents the habitat suitability of the j type of land use/cover, is the stress level of the x raster cell in the j type of land use/cover, and z and k are the half-saturation and constant in the model and the inherent parameters of the module, respectively. In this study, z was set at 2.5. k is a half-saturated parameter, and its size is usually half that of , with a default value of 0.5.
With reference to the InVEST model manual and previous related studies, this paper classifies cultivated land, construction land, and bare land as threat factors. The parameter table for threat factors includes indicators such as the type of threat factor, maximum impact distance, weight, and decay type []. Meanwhile, habitat suitability and sensitivity values were assigned by drawing on the actual land use in Anxi, the InVEST model manual, previous research, and expert consultations [].
The sensitivity values of different land use types to threat factors range from 0 to 1, with higher values indicating a greater degree of sensitivity of the land use type to the threat factors. The threat level is calculated based on the above public notice, where R represents the number of threat factors. represents the number of rasters of the threat factor; W represents the weight of the threat factor, and its value is [0–1]; is to determine whether grid y is a threat factor (0 indicates no threat factor, 1 indicates a threat factor), and represents the threat value of the yth grid to the coercion level of the x grid. is used to represent the reachability level of the raster x, with a value of [0–1]; represents the sensitivity of the j land use/cover type to the threat factor r, with a value ranging from [0 to 1].
In the formula, is the linear distance between the two grids x and y; is the maximum range of action of the threat factor r. Generally, the stress level decreases as the distance between the threat factor grids increases. Usually, linear or exponential attenuation functions are used to describe the degree of attenuation of the stress level over distance.
3.3. Water Yield Accounting Method
The water yield of the basin is calculated based on parameters such as surface precipitation, soil depth, land use, potential evapotranspiration, and available water content for vegetation. The biophysical parameters required for the InVEST water yield module were determined by considering the actual situation of Anxi County, consulting the model manual, relevant literature, and expert opinions. The key parameters identified were the evapotranspiration coefficient and root depth for each species. The specific formula is as follows:
In the formula, refers to the rainfall of the grid, represents the actual annual evapotranspiration of the grid, and is the average annual rainfall of the study area. Referring to the InVEST model manual, the seasonal influence factor Z is a constant characterizing precipitation features, with a value range of 1 to 30. The larger the value, the more frequent the precipitation in the region, and it is mainly concentrated in the second half of the year. The determination of the Z coefficient is based on the comparison of the water production volume module results with the local water resources bulletin data, and is obtained through repeated debugging. The final determined value is 12. At this time, the water production module results have the best simulation effect on the local water resources bulletin data.
For the type of vegetation land use/land cover, the evapotranspiration of water balance is based on the Budyko water-heat coupling balance formula. The formula is as follows:
In the formula, PET(x) represents the evapotranspiration, ω(x) is a non-physical parameter of the natural climate soil characteristics, used to characterize the amount of water absorbed by a certain type of soil and utilized by plants, ET0(x) is the potential evapotranspiration of the grid calculated, and Kc(βx) is the value of the evapotranspiration factor E related to land use/cover on the grid.
3.4. Soil Conservation Accounting Method
Soil conservation services refer to the erosion expansion capacity of ecosystems to prevent soil erosion and their ability to store and retain sediment. In the InVEST model, the soil conservation module is derived by improving the general soil erosion equation, which mainly involves parameters such as rainfall erosibility factor, soil erosion factor, slope length factor, slope factor, vegetation and management factor Cx and soil and water conservation measures factor Px . In the InVEST model, the soil conservation module is improved using the general soil erosion equation, and the formula is as follows:
In the above formula, Rx represents the rainfall erosive force factor, Kx represents the soil erosibility factor, Lx and Sx represent the topographic factors, and Cx and Px , respectively, represent the vegetation coverage factor and the soil conservation measures factor. In the InVEST model, the retention capacity of vegetation varies among different land use types, which will have a sedimentation effect on the upstream sediment. Therefore, the retention amount of sediment is also calculated as part of the soil conservation quantity module.
In the formula, Sedr represents the amount of soil conservation and Sede represents the total amount of sediment. The terrain factors are calculated from the DEM data. The model automatically generates terrain factors Lx and Sx based on the DEM data after depressurization processing. D represents the area (m) of sediment flowing into the raster cells. Xi is the size of the raster cell (m); xi= | sinα | + | cosα |, where α represents the direction in which the i-th grid cell conveys sediment; θ represents the percentage slope. m is the length exponential factor, and its calculation formula is as follows:
4. Results
4.1. Anxi County Ecosystem Services Assessment
4.1.1. Carbon Storage
The spatiotemporal variation in carbon storage in Anxi County from 1990 to 2020 is illustrated in Figure 4. Temporally, the average carbon storage density across seven periods in Anxi County was as follows: 113.96 t/hm2, 111.37 t/hm2, 100.50 t/hm2, 92.30 t/hm2, 89.94 t/hm2, 90.63 t/hm2, and 92.40 t/hm2, respectively. The total carbon storage during these periods was approximately 34.11 × 10⁶ t, 33.33 × 10⁶ t, 30.08 × 10⁶ t, 27.63 × 10⁶ t, 26.92 × 10⁶ t, 27.13 × 10⁶ t, and 27.66 × 10⁶ t, respectively. Overall, carbon storage exhibited a trend of initial decline followed by a partial recovery. A continuous decrease was observed from 1990 to 2010, reaching the lowest level in 2010. Subsequently, from 2010 to 2020, carbon storage began to increase gradually.
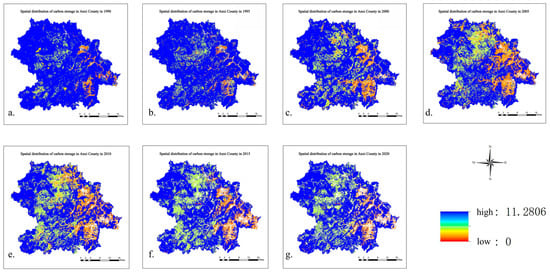
Figure 4.
Distribution of Carbon Storage in Anxi County (Unit: t/hm2). (a–g) represents the spatiotemporal distribution of carbon storage in Anxi from 1990 to 2020.
Spatially, areas with higher carbon storage are mainly concentrated in the northwest and southwest of Anxi County. From 1990 to 2020, a clear decreasing gradient in total carbon storage was observed from these high-value zones in the northwest and southwest toward the eastern regions. Throughout the study period (1990–2020), Futian consistently had the highest average carbon storage density per unit area at the township level, while Fengcheng had the lowest. Other regions displayed varying trends in carbon storage density over time. In terms of the percentage change in carbon storage per unit area, all townships experienced a decline between 1990 and 2020. The most significant reduction occurred in Fengcheng, where carbon storage decreased by 56.98% compared to 1990 levels. Guanqiao and Chengxiang also showed substantial declines, with reductions exceeding 30%. In contrast, Futian and Taozhou recorded the smallest decreases, with declines of less than 10%, indicating relatively stable carbon storage conditions in these areas over the past three decades.
4.1.2. Habitat Quality
As illustrated in Figure 5, the habitat quality in Anxi County from 1990 to 2020 exhibited significant spatiotemporal variation over the 30-year period. Temporally, habitat quality showed a trend similar to that of carbon storage. Overall, habitat quality first declined and subsequently increased during the period from 1990 to 2020. Specifically, a continuous decline was observed from 1990 to 2010, with the lowest value recorded in 2010, followed by an upward trend from 2010 to 2020. The average habitat quality in Anxi County from 1900 to 2020 remained consistently above 0.8, indicating that the overall habitat quality is relatively high. However, significant spatial heterogeneity was evident. Spatially, areas with higher habitat quality were primarily concentrated in the northwest and southwest of Anxi County. Over the period from 1990 to 2020, a gradual decline in habitat quality from the northwest and southwest toward the eastern regions was observed.
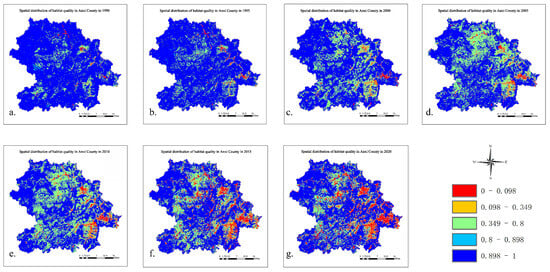
Figure 5.
Distribution of Habitat Quality in Anxi County (a–g) represents the spatiotemporal distribution of habitat quality in Anxi from 1990 to 2020; Habitat quality is represented as a dimensionless index ranging from 0 to 1, with 0 denoting the lowest quality and 1 denoting the highest quality.
When analyzed at the township level, Futian Township consistently exhibited the highest habitat quality from 1990 to 2020, while Fengcheng Township consistently demonstrated the lowest values. Other townships showed varying degrees of change in habitat quality over time. In terms of the percentage change in habitat quality, the trend was consistent with that of carbon storage. All townships experienced a decrease in habitat quality over the 30-year period, with Fengcheng Township showing the most pronounced decline. By 2020, the habitat quality in Fengcheng had decreased by 50.63% compared to 1990. Similarly, Guanqiao, Chengxiang, and Cannei townships experienced declines exceeding 30%. In contrast, Futian and Taozhou townships exhibited only minor decreases, with reductions of less than 5%. Additionally, Xianghua and Daping townships also showed relatively small declines, with reductions below 10%.
4.1.3. Water Yield
As shown in Figure 6, the spatial and temporal variations in water yield in Anxi over the 30-year period from 1990 to 2020 demonstrate a distinct trend. Overall, Anxi has maintained a relatively high level of water supply capacity. From 1990 to 2005, water yield exhibited an upward trend, reaching its peak in 2005. Subsequently, between 2005 and 2020, water yield gradually declined, suggesting a potential shift in hydrological dynamics or environmental conditions. Spatially, water yield in Anxi shows a decreasing gradient from the northwest to the southeast, which is consistent with the region’s elevation distribution. The western part of Anxi, characterized by higher altitudes and better-preserved forest vegetation, sustains a higher level of water yield. This indicates a strong correlation between topography, vegetation cover, and hydrological regulation capacity.
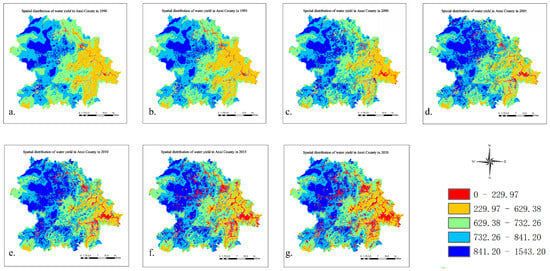
Figure 6.
Distribution of Water Production in Anxi County (Unit: mm). (a–g) represents the spatiotemporal distribution of water production from 1990 to 2020.
At the township level, the spatial pattern of water yield remains relatively stable over the study period. Among all townships, Xianghua consistently recorded the highest water yield, whereas Fengcheng had the lowest values throughout the 30 years. Other townships exhibited varying degrees of fluctuation in unit-area water yield. Notably, only Xianghua showed a slight increase in water yield from 1990 to 2020, while several other townships—such as Jiandou, Taozhou, Bailai, Lutian, Futian, and Gande—maintained relatively stable water yield levels, with changes generally within 1%. Even with extensive environmental and land-use changes over the past three decades, some regions have preserved their hydrological functions. This spatial and temporal analysis reveals regional differences in water provision services. It underscores the critical role of forest ecosystems, particularly in high-altitude areas, for sustainable water management.
4.1.4. Soil Conservation
As shown in Figure 7, over time, the soil conservation capacity in Anxi County remained at a relatively high level and was generally stable, showing an initial decrease followed by an increase, with the minimum value occurring in 2010. When analyzed at the township level, the highest unit-area soil conservation occurred in Futian Township from 1990 to 2020, followed by Gande, Taozhou, and Xianghua Townships. The lowest levels were observed in Fengcheng Township, followed by Cannei, Chengxiang, and Jinggu Townships.
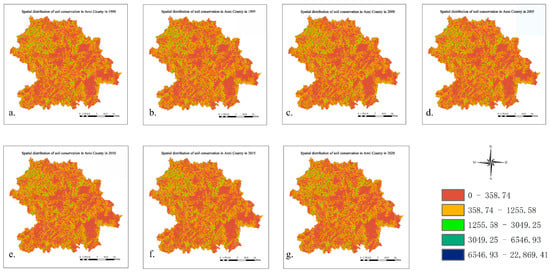
Figure 7.
Distribution of Soil Conservation in Anxi County (Unit: t/(hm2 · a)). (a–g) represents the spatiotemporal distribution of soil conservation in Anxi from 1990 to 2020.
In terms of changes in soil conservation per unit area between 1990 and 2020, the overall trends across all townships remained stable, with no significant fluctuations. Among them, Guanqiao, Chengxiang, and Jinggu Townships exhibited the highest growth rates in soil conservation per unit area. In contrast, Lutian, Hushang, and Lantian Townships experienced slight declines in soil conservation capacity, although the magnitudes of these decreases were relatively small.
4.2. Tea Garden Ecosystem Services
4.2.1. Tea Garden Carbon Storage
Based on the classification and statistical analysis using ArcMap (version 10.6, Esri, Redlands, CA, USA), the average carbon storage density of tea gardens from 1990 to 2020 is presented in Figure 8. According to the results of the mean carbon storage density across different land use types, the tea garden exhibits an average carbon storage density of 55.36 t/hm2, which ranks second only to that of forest land (125.34 t/hm2), and is higher than that of grassland (38.03 t/ha), farmland (19.10 t/hm2), as well as bare land and water bodies.
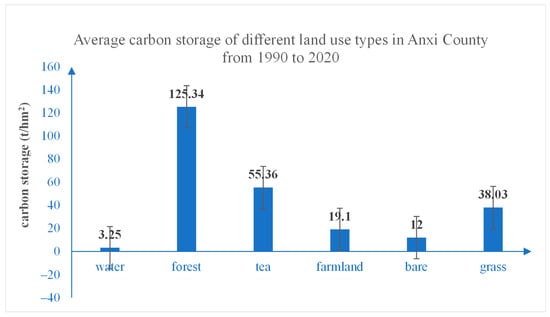
Figure 8.
Average carbon storage of different land use types in Anxi County from 1990 to 2020.
From the perspective of total carbon storage, the tea garden shows significant variation over time. The total carbon storage of tea gardens increased from 1.43 × 10⁶ t in 1990 to 3.14 × 10⁶ t in 2020. Correspondingly, its proportion of the total regional carbon storage rose from 4.18% in 1990 to 11.33% in 2020. However, the overall trend of both the total carbon storage and its proportion exhibits an initial increase followed by a slight decline. In general, tea gardens occupy a relatively large proportion of all land use types. Owing to their considerable biomass, tea gardens exhibit high carbon storage density, coupled with substantial total carbon storage. These values are surpassed only by forest ecosystems and are markedly higher than those of other land use types. When comparing the changes in carbon storage across different land use types (Table S1), the carbon storage density follows the descending order: forest > tea garden > grassland > farmland > bare land > water > artificial land.
4.2.2. Tea Garden Habitat Quality
The statistical results of habitat quality for different land use types from 1990 to 2020, obtained through ArcGIS classification, are presented in Figure 9. The habitat quality index ranges from 0 to 1, with higher values indicating better habitat conditions. The mean habitat quality of tea gardens is 0.80, which is lower than that of forests and water bodies. Although tea plants are shrub species and are mainly cultivated in mid-elevation areas, tea gardens are significantly influenced by human activities, such as seasonal harvesting, plowing, and fertilization. These anthropogenic disturbances reduce their habitat quality compared to natural forest ecosystems.
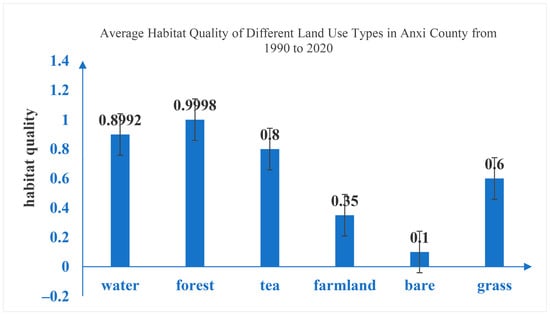
Figure 9.
Average Habitat Quality of Different Land Use Types in Anxi County from 1990 to 2020. Habitat quality is represented as a dimensionless index ranging from 0 to 1, with 0 denoting the lowest quality and 1 denoting the highest quality.
When comparing the average habitat quality across all land use types, forests exhibit the highest value at 0.9998, followed by water bodies (0.8992), tea gardens (0.80), and grasslands (0.60). In contrast, farmland and bare land show relatively low habitat quality, with average values of 0.35 and 0.10, respectively. The high habitat quality of forests and water bodies can be attributed to their greater ecological stability and adaptability. These ecosystems are generally located farther from human-induced disturbance sources and possess stronger resistance to external stressors, which results in higher overall habitat quality.
4.2.3. Tea Garden Water Yield
Water yield refers to the amount of water generated within a study area, calculated as the difference between precipitation and actual evapotranspiration. It represents the volume of water that remains available for surface runoff or groundwater recharge during a rainfall event. Using ArcGIS for classification and statistical analysis, Figure 10 illustrates the spatial distribution and variation in water yield across different land use types from 1990 to 2020. The average water yield of tea gardens was found to be 853.01 mm, which is lower than that of grasslands but still higher than that of farmland and forest. This suggests that tea gardens have a relatively moderate capacity to absorb rainfall compared to other land use types. The relatively low water retention capacity of tea gardens can be attributed to their typical distribution at elevations between 800 and 1200 m, often on sloped terrain. Additionally, the low canopy cover of tea plants and the exposed soil beneath contribute to reduced infiltration capacity, thereby increasing the likelihood of surface runoff. When comparing the average water yield across all land use types, grasslands exhibited the highest value, followed by bare land (841.79 mm), farmland, and forest. The lowest water yield was observed in artificial surfaces. The relatively high water yield in grasslands and bare land can be largely explained by their limited capacity for water infiltration, which results in increased surface runoff []. In contrast, forests and farmlands generally have higher infiltration capacities and more complex vegetation structures. These characteristics allow them to retain more rainfall, which consequently reduces surface runoff and leads to lower water yield values. In summary, land use type plays a critical role in determining the hydrological response of a watershed. Understanding these differences is essential for effective water resource management and land-use planning, particularly in ecologically sensitive regions where tea cultivation is prevalent.
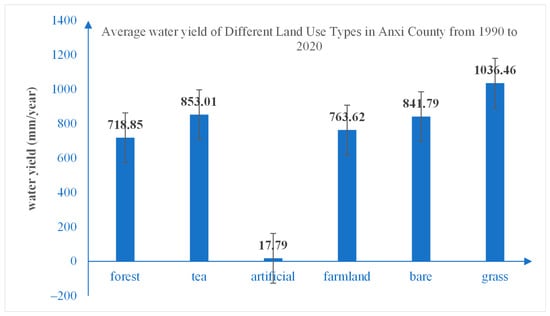
Figure 10.
Average water yield of Different Land Use Types in Anxi County from 1990 to 2020.
4.2.4. Tea Garden Soil Conservation
The statistical results of soil conservation across different land-use types from 1990 to 2020, based on classification using ArcGIS, are presented in Figure 11. The average soil conservation capacity of tea gardens was 3565.13 t/hm2. Compared to forest and grassland, the soil conservation capacity of tea gardens was relatively lower. Tea gardens are agroecosystems heavily influenced by human activities. Owing to the implementation of soil and water conservation measures and effective vegetation management, they exhibit a relatively high soil conservation potential. In terms of total soil conservation (Table S2), the overall amount of soil conservation in tea gardens showed an upward trend from 1990 to 2010, increasing from 7.83 × 10⁷ t in 1990 to a peak of 2.49 × 10⁸ t in 2010, followed by a decline to 2.18 × 10⁸ t in 2020. Correspondingly, the contribution of tea gardens to the total soil conservation in Anxi increased from 5.21% in 1990 to 16.77% in 2010, and then decreased to 14.65% in 2020, primarily due to the reduction in tea garden area after 2010. Changes in the soil conservation capacity of tea gardens were linked to two key factors: the shifting spatial extent of the gardens, which first expanded and then contracted; and the adoption of specific soil conservation measures. When comparing the average soil conservation capacity across different land-use types, forests exhibited the highest value at 5767.66 t/hm2, followed by grasslands (3729.69 t/hm2) and farmland (3066.32 t/hm2). In contrast, artificial surfaces and bare land had the lowest average soil conservation capacities, at 1556.15 t/hm2 and 303.84 t/hm2, respectively. In terms of total soil conservation volume, forests contributed the most, followed by tea gardens, farmland, artificial surfaces, and grasslands. Bare land had the lowest total soil conservation capacity among all land-use types.
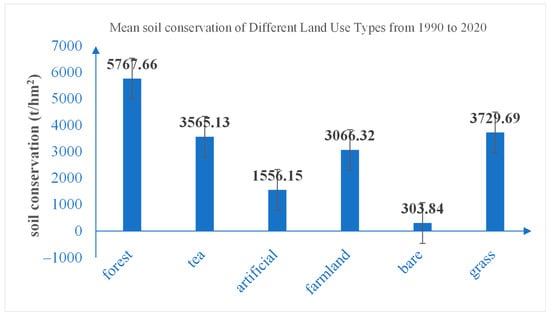
Figure 11.
Mean soil conservation of Different Land Use Types from 1990 to 2020.
4.3. The Transformation of Tea Garden and Its Impact on Changes in Ecosystem Services
4.3.1. Analysis of the Impact of Tea Garden Transformation on Carbon Storage
Our analysis revealed the total and average changes in carbon storage from the main land-use transformations. This was based on a transition matrix analysis of tea gardens, forests, farmland, and artificial surfaces, processed with zonal statistics in ArcGIS (Table 1 and Table 2). From the perspective of total carbon storage changes over the period 1990–2020, the conversion of forest to tea garden had the greatest contribution to the overall reduction in carbon storage. In contrast, the transformation of a tea garden to a forest and a farmland to a tea garden resulted in an overall increase in carbon storage, with the tea garden to forest conversion being the main driver of this increase.

Table 1.
Carbon Storage Changes of Main Conversion Types in Tea Plantations.
Table 2.
Changes in Carbon Storage after Conversion of Tea Plantations.
When examining the average carbon storage change per unit area, the mutual transitions between forest and tea garden induced a significant change of 69.98 t/hm2, which was markedly higher than the 36.26 t/hm2 change resulting from the mutual transitions between tea garden and farmland. Additionally, the conversion of the tea garden to artificial land had a substantial impact on carbon storage per unit area, with a change value of 55.36 t/hm2. Considering the three developmental stages of tea garden cultivation between 1990 and 2020—namely, the phase of scale expansion, the phase of steady growth, and the phase of ecological construction—the conversion of forest to tea garden dominated during the first two stages. However, during the ecological construction phase, there was a noticeable increase in the conversion of the tea garden back to a forest. The carbon storage changes in the entire Anxi region paralleled the mutual conversions between tea gardens and forests during this period. Different land-use types exert significant influences on the total regional carbon pool. Transitions involving tea garden with forest, farmland, and artificial land have considerable impacts on the above-ground carbon pool, below-ground carbon pool, litter and dead organic matter carbon pool, and soil carbon pool. These findings point to the need for integrated land-management strategies that leverage land-use dynamics to promote carbon sequestration and ecological sustainability.
4.3.2. Analysis of the Impact of Tea Garden Transformation on Habitat Quality
Changes in land-use types can lead to alterations in habitat-related threat factors, which in turn significantly affect regional habitat quality. By analyzing how transitions between land uses—such as tea gardens, forests, farmland, and artificial surfaces—affect habitat quality, we can gain key insights for improving regional ecosystems and enhancing biodiversity. Using zonal statistics in ArcGIS, this study analyzed the transformation patterns among tea gardens and other major land-use types, identifying the specific effects of these transitions on habitat quality. As shown in Table 3, the absolute changes in habitat quality index (HQI) following the conversion of tea gardens into other land-use types follow this order: artificial surfaces > farmland > forest. Notably, when tea gardens are converted into artificial surfaces, the habitat quality decreases by 0.7998, which is approximately twice the decrease caused by tea gardens turning into farmland, and four times the decline observed when forests are converted into tea gardens.
Table 3.
Habitat Quality Change Index after Tea Plantation Conversion.
From a temporal perspective, during the periods 1990–2000, 2000–2010, and 2010–2020, the degradation of habitat quality caused by transforming tea gardens into artificial surfaces was 0.79998, 0.79991, and 0.79987, respectively, indicating a consistently stable downward trend. Meanwhile, the corresponding decreases in HQI due to tea gardens converting into farmland were 0.44996, 0.44989, and 0.44963, respectively. Slight variations in the HQI changes were observed between mutual conversions of tea gardens with farmland and forests. These differences are primarily attributed to variations in the surrounding habitat threat factors associated with these land-use types. The bidirectional transitions between tea gardens and other land-use types—especially artificial surfaces, farmland, and forests—have a cumulative effect on the overall habitat quality index of the entire study area. Returning farmland and tea gardens to forest serves as an effective strategy to enhance regional ecological quality and the comprehensive habitat quality index. Considering the three distinct phases of tea garden expansion from 1990 to 2020, the areas of tea gardens converted into artificial surfaces during each period were 703.35 hm2, 1986.84 hm2, and 7362.81 hm2, respectively. This increasing trend in conversion aligns with the observed decline in habitat quality, with the most significant degradation occurring between 2010 and 2020.
4.3.3. Analysis of the Impact of Tea Garden Transformation on Water Yield
Different types of crops exhibit significant differences in their capacity for soil and water conservation. Additionally, due to the topographical distinction between Anxi County’s higher-elevation urban areas and its lower-elevation rural areas, the difference between precipitation and evapotranspiration also varies notably. Within the ArcGIS environment, a zonal statistical analysis was conducted on land-use transitions involving tea gardens and other major land-use categories, with the results presented in Table 4. Based on the statistical analysis, the absolute changes in water yield per unit area resulting from the conversion of tea gardens to other land-use types from 1990 to 2020, ranked by magnitude, were as follows: artificial > forest > farmland. The most significant change occurred when tea gardens were converted to artificial land cover, resulting in a water yield reduction of 737.67 mm. In contrast, conversions from tea gardens to forest and farmland caused water yield changes of 124.34 mm and 50.39 mm, respectively.
Table 4.
Changes in Unit Area Water Production Caused by Tea Garden Conversion.
From a temporal perspective, the reductions in unit-area water yield caused by the conversion of tea gardens to artificial land cover during the periods 1990–2000, 2000–2010, and 2010–2020 were 732.20 mm, 720.82 mm, and 757.58 mm, respectively, indicating a trend of initial decrease followed by an increase. Similarly, conversions from tea gardens to forest led to reductions of 124.48 mm, 125.22 mm, and 126.58 mm, showing a steady upward trend over time. In contrast, tea garden conversions to farmland resulted in increases in water yield per unit area—51.28 mm, 51.71 mm, and 50.95 mm—displaying a pattern of initial growth followed by a slight decline. The variations in water yield associated with land-use transitions between tea gardens, forest, and farmland can primarily be attributed to differences in the water-retention capacities of the respective vegetation types. However, converting tea gardens to artificial surfaces has significantly reduced water yield. This is mainly because such conversions are spatially concentrated near urban core areas. These regions, often located in basin-like topographic settings, are characterized by reduced precipitation and increased evapotranspiration. Furthermore, artificial surfaces are typically associated with enhanced soil and water conservation measures, which may also contribute to the observed decline in water yield.
4.3.4. Analysis of the Impact of Tea Garden Transformation on Soil Conservation
Significant differences exist among various land use types in terms of their capacity for soil conservation. Consequently, the transformation between tea gardens and other major land use categories has led to notable fluctuations in soil conservation services within the study area. Using ArcGIS, spatial zoning statistics were conducted to assess soil conservation under different land use transitions involving tea gardens and other dominant land use types. These analyses yielded data on both total and average changes in soil conservation levels, summarized in Table 5 and Table 6, respectively.
Table 5.
Impact of Tea Plantation Conversion on Total Soil Conservation Changes.
Table 6.
Impact of Tea Garden Conversion on Unit Soil Conservation Changes.
From the perspective of total soil conservation change, the conversions between tea gardens and forests, as well as between tea gardens and artificial land uses, had the most substantial impact on overall soil conservation from 1990 to 2020. Notably, the conversion of forest to a tea garden resulted in the largest decline in soil conservation capacity.
From 1990 to 2020, changes in soil conservation per unit area varied by land-use transition. The changes, in descending order of magnitude, were: forest to tea garden, tea garden to artificial land, tea garden to forest, tea garden to farmland, and farmland to tea garden. Among these, the conversion of forest to tea garden and farmland to tea garden led to a reduction in soil conservation levels. In contrast, transitions from tea garden to forest, tea garden to farmland, and tea garden to artificial land use all resulted in increases in soil conservation. Converting forests to tea gardens caused a greater loss in soil conservation than the gain from restoring them. The impact of land conversion between tea gardens and farmland on soil conservation per unit area grew progressively stronger over time. This trend of intensification is evident across the three study periods: 1990–2000, 2000–2010, and 2010–2020. The conversion of forest to a tea garden showed a fluctuating trend, with an initial decrease followed by an increase in its impact on soil conservation. Conversely, the transition from tea garden to forest initially showed an upward trend followed by a decline. The conversion of tea gardens to artificial land use also demonstrated a trend of initial decline followed by an increase, reaching its peak in 2020.
5. Discussion
5.1. Spatio-Temporal Evolution Characteristics and Spatial Heterogeneity Pattern of Ecosystem Services in Anxi County
This study systematically assessed the spatio-temporal evolution of four key ecosystem services in Anxi County from 1990 to 2020, elucidating their changing characteristics and underlying drivers. Overall, regional ecosystem services reached a temporal turning point around 2010. Spatially, they followed a pattern of “superior quality in the west and inferior quality in the east,” a distribution profoundly shaped by the combined effects of human activities and ecological policies []. From a temporal perspective, both carbon storage and habitat quality showed a synchronized trend of “initial decline followed by recovery,” reaching their nadir around 2010. This turning point ended the era of ecological degradation driven by urban and tea garden expansion. Subsequent restoration policies, implemented after 2010, then actively promoted the recovery of ecological functions []. The initial improvement in habitat quality, which peaked around 2005 before declining, was likely attributable to heightened water consumption from increased evapotranspiration after vegetation restoration. Soil conservation capacity remained consistently high and stable, indicating strong erosion resistance of the regional surface cover. Its minor fluctuation in 2010 was associated with intensified human disturbance during that period, while local improvements in areas like Guanqiao and Chengxiang benefited from the effective implementation of soil and water conservation projects []. Spatially, high-value areas for all four services were consistently concentrated in northwestern and southwestern townships, which feature high forest coverage and low human disturbance, serving as the ecological security barrier for the county. Conversely, eastern townships were generally characterized by low values and significant degradation, especially in Fengcheng Town, where carbon storage and habitat quality decreased by over 50%, highlighting the severe impact of rapid urbanization on ecosystems. The spatial changes in water yield and soil conservation services were relatively moderate, further illustrating the differential responses of various services to driving factors [].
5.2. Spatio-Temporal Evolution Characteristics of Ecosystem Services in Specialized Tea Planting Areas
This study comprehensively evaluated the ecosystem services provided by tea gardens, revealing their significant ecological importance alongside limitations arising from human management. As a typical agricultural ecosystem, tea gardens display a distinct dual nature in key ecosystem services—including carbon storage, habitat quality, water yield, and soil conservation []. Notably, their average carbon storage density and soil conservation capacity are relatively high, ranking second only to woodlands. This underscores the critical role of tea gardens in carbon sequestration and soil preservation [,]. However, frequent human management practices adversely affect tea gardens, resulting in lower habitat quality and water yield capacity compared to woodland and water bodies. This highlights the constraints that human interference imposes on ecosystem self-regulation and hydrological processes. Overall, tea gardens play a non-negligible ecological role in the regional ecosystem, but their management practices significantly influence their service capacity. Future efforts should focus on enhancing the ecological management of tea gardens to better balance agricultural production and ecological conservation [].
5.3. Impact of Specialized Tea Planting Evolution on Ecosystem Services
This study investigated the effects of specialized tea planting expansion on regional ecosystem services in Anxi County. The research highlights the complex relationship between agricultural industrialization and sustainable land use embodied in this form of land cover change [,]. The research found that distinct development pathways emerged in eastern and western Anxi due to differences in natural topography and land use foundations: the east was dominated by urbanization, while the west became the core area for the expansion of specialized tea planting areas. Notably, variations in tea garden management practices across regions further shaped the spatial heterogeneity of ecological effects []. From 2010 to 2020, ecological restoration policies in central and western Anxi enhanced the overall ecosystem service functions. This improvement confirms the positive role of human intervention in mitigating the negative impacts of agricultural expansion []. However, the study also identified potential for optimizing the spatial layout of current ecological restoration measures. Specifically, the conversion of existing tea gardens was primarily concentrated in low-to-middle altitude and steep slope areas, while the establishment of new tea gardens tended to target high-altitude steep slopes []. This spatial mismatch poses ongoing ecological risks, such as decreased water conservation capacity and increased soil erosion, in higher altitude regions []. Overall, the findings of this study align with international research on tea garden ecosystem services, extending beyond the specific context of China [,,].
5.4. Research Implications
Based on Nature-based Solutions, this study proposes the following next steps for Anxi County:
- (1)
- Construct a green infrastructure network with high-altitude ecologically sensitive areas at its core. Given the relatively high carbon storage, habitat quality, and water conservation capacity of the high-altitude areas in northwestern Anxi, ecological protection red lines should be prioritized in these regions. Efforts should focus on restoring natural forests, establishing ecological buffer zones, and developing water conservation forests to enhance water regulation capacity and the stability of biological habitats. On high-altitude steep slopes, promote “forest–tea–grass” composite planting to reduce the ecological vulnerability of monoculture tea plantations. Additionally, remote sensing and GIS technologies should be utilized to establish a dynamic monitoring platform for ecosystem services. This platform will enable real-time assessment and early warning for functions such as water conservation and carbon storage.
- (2)
- Optimize the spatial layout of tea plantations and implement gradient ecological restoration. In response to the soil erosion issues caused by the current expansion of specialized tea plantations in steep slope areas, a comprehensive planning mechanism should be established. This includes strictly prohibiting the development of new tea plantations on slopes greater than 25° and promoting the gradual conversion of existing steep-slope tea plantations back to forests. On slopes between 15° and 25°, ecological tea plantations should be established using NbS techniques such as contour planting, grass strips, and biological hedges. These measures will improve soil water retention and control erosion. Simultaneously, by adopting green methods like organic fertilizers and biological pest control, we can reduce the pressure that agriculture places on ecosystems.
- (3)
- Establish a multi-scale ecosystem service assessment and policy feedback system. Given the high spatial heterogeneity of ecosystem services in Anxi, a systematic evaluation of key services (e.g., carbon storage, water yield, and soil conservation) is necessary. This necessitates the integration of multi-source data, including remote sensing, ecological monitoring, and community surveys. A closed-loop mechanism from policy formulation to implementation, evaluation, and feedback should be developed to enable the dynamic optimization of ecological policies. Designate priority zones for ecosystem service functions in water-sensitive areas such as the upper reaches of the Jinjiang River, imposing strict controls on tea plantation expansion and land conversion. Furthermore, establish public participation platforms to enhance policy transparency and social acceptance, fostering a collaborative governance framework involving multiple stakeholders [].
6. Conclusions
Focusing on the evolutionary characteristics of specialized tea garden landscapes, this study integrated natural geographic and socio-economic data. Using the InVEST model, we assessed four key ecosystem services (carbon storage, habitat quality, water yield, and soil conservation) in these regions from 1990 to 2020. The research focused on characterizing the spatiotemporal trends of tea garden ecosystem services and the impacts of land-use transitions involving tea gardens on these services. The spatial distribution patterns and temporal evolution of ecosystem services were also analyzed. Key findings include the following:
- (1)
- Temporal and Spatial Evolution of Ecosystem Services (1990–2020). From 1990 to 2020, carbon storage and habitat quality both exhibited a U-shaped trend, initially declining and then increasing, with a minimum value observed in 2010. The mean habitat quality remained above 0.8 throughout the study period (1990–2020), indicating generally favorable ecological conditions. Water yield initially increased and then decreased, peaking in 2005. The per-unit-area soil conservation capacity remained relatively stable overall, showing a trend of slight decline followed by recovery, with the lowest value occurring in 2010. Spatially, carbon storage and habitat quality exhibited a gradual decrease from the northwest and southwest toward the eastern regions, consistent with the elevation gradient. Water yield was higher in the northwest and lower in the southeast, with a general decreasing trend from west to east. High soil conservation values were mainly concentrated in the northwestern regions of Anxi, while the central and southeastern areas showed relatively low values.
- (2)
- Characteristics of Ecosystem Services in Tea Gardens. While tea gardens store less carbon and provide poorer habitat than forests, they contribute substantially to these services by outperforming other prevalent land-use types. In terms of water yield, tea gardens demonstrated relatively weak water retention capacity compared to both forests and farmland, with a lower capacity to absorb rainfall, thereby increasing surface runoff. Regarding soil conservation, tea gardens—being a human-managed agroecosystem—demonstrated better performance than farmland. The overall changes in the four ecosystem services were primarily driven by two major land-use shifts: the large-scale expansion of tea gardens (1990–2010), followed by their conversion back to forest for ecological restoration (2010–2020).
- (3)
- Impact of Tea Garden Land-Use Transitions on Ecosystem Services. The mutual conversion between tea gardens and forests had the most significant impact on carbon storage. The conversion of tea gardens back to forest during the ecological restoration phase (2010–2020) was the main contributor to the observed increase in carbon storage. Conversely, the transformation of tea gardens into artificial surfaces or farmland was the leading cause of habitat quality decline. The conversion of tea gardens into forest, farmland, or artificial land uses had a significant impact on water yield. Among these, forested land was far better at retaining water than both tea gardens and farmland. The primary driver behind the decline in soil conservation capacity was the conversion of forests and farmland to tea plantations. This decrease was more pronounced than the improvement observed in reforested areas. The land-use transition patterns involving tea gardens across the three stages (1990–2020) aligned with the overall direction of ecosystem service changes across the Anxi region. This study provides a comprehensive understanding of the dynamics of ecosystem services in tea-growing regions, highlighting the importance of land-use transitions and ecological restoration in shaping these services over time. The results underscore the need for integrated land management strategies that balance agricultural productivity with ecological sustainability.
Supplementary Materials
The following supporting information can be downloaded at: https://www.mdpi.com/article/10.3390/agriculture15222334/s1, Table S1: Total Carbon Storage of Various Land Types in Anxi from 1990 to 2020 (Unit: t); Table S2: Total Soil Conservation of Various Land Types in Anxi from 1990 to 2020 (Unit: t).
Author Contributions
Conceptualization, Y.M. and T.W.; methodology, Y.L.; software, S.Z.; validation, S.Z., Y.L. and Y.M.; formal analysis, T.W.; investigation, S.F.; resources, Y.M.; data curation, Y.M. and S.F.; writing—original draft preparation, Y.M.; writing—review and editing, Y.M. and S.F.; visualization, S.F.; supervision, S.Z.; project administration, Y.M.; funding acquisition, Y.M. and S.F. All authors have read and agreed to the published version of the manuscript.
Funding
This research was funded by the Ministry of Education of China (23YJC850014); the Key Program of New Think Tank in Fujian Province (24MZKB38); Fujian Province Higher Education and Research Special Project (K8120K01a); Fujian Province Innovation Strategy Research Science and Technology Program Project (2023R0023); Fujian Province Innovation Strategy Research Science and Technology Program Project (2023R0147).
Institutional Review Board Statement
Not applicable.
Data Availability Statement
The datasets used and analyzed during the current study are available from the corresponding author on reasonable request.
Acknowledgments
We would like to thank the Ministry of Education of the China for it financial support. We gratefully thank the Agriculture journal and the journal Academic Editor, for their helpful input and feedback on the content of this manuscript.
Conflicts of Interest
The authors declare no conflicts of interest.
References
- Bao, J.; Li, W.; Zhu, J.; Fan, S.; Mao, L. Impacts of land use structures on ecosystem services relationships within specialized tea planting regions: A case study of Anxi County. Front. Environ. Sci. 2024, 12, 1464490. [Google Scholar] [CrossRef]
- Shui, W.; Chen, Y.; Wu, P.; Wang, W. The Construction of a “Granary Model” for Specialized Agricultural Area Commercial Environments: A Case Study of Anxi County, Fujian Province. Inq. Into Econ. Issues 2017, 3, 73–83+106. [Google Scholar]
- Ye, Q.; Wang, W. Research on Evolution and Influence Factors of Planting Industry in China. J. Nat. Sci. Hunan Norm. Univ. 2022, 45, 94–102. [Google Scholar]
- Song, B.; Mu, Y.; Hou, L. Study on the Effect of Farm Households’ Specialization on Low-carbon Agriculture: Evidence from Vegetable Growers in Beijing, China. J. Nat. Resour. 2016, 31, 468–476. [Google Scholar]
- Wu, N.; Li, E.; Li, X. Spatial distribution of specialized vegetable cultivation villages and its influencing factors: A case study of capsicum plantation in Zhecheng County, Henan Province. Geogr. Res.-Aust. 2013, 32, 1303–1315. [Google Scholar]
- Zhang, S.; Wen, L.S.; Weng, A.F.; Cheng, D.L.; Li, B.Y. Research Progress in Biodiversity and Human Well-Being, Based on CiteSpace. Biology 2024, 13, 1020. [Google Scholar] [CrossRef]
- Wen, Z.; Zheng, H.; Ouyang, Z. Research progress on the relationship between biodiversity and ecosystem services. Chin. J. Appl. Ecol. 2020, 31, 340–348. [Google Scholar]
- Worm, B.; Barbier, E.B.; Beaumont, N.; Duffy, J.E.; Folke, C.; Halpern, B.S.; Jackson, J.; Lotze, H.K.; Micheli, F.; Palumbi, S.R.; et al. Impacts of biodiversity loss on ocean ecosystem services. Science 2006, 314, 787–790. [Google Scholar] [CrossRef]
- Wu, J.G. Landscape sustainability science: Ecosystem services and human well-being in changing landscapes. Landsc. Ecol. 2013, 28, 999–1023. [Google Scholar] [CrossRef]
- Potts, S.G.; Imperatriz-Fonseca, V.; Ngo, H.T.; Aizen, M.A.; Biesmeijer, J.C.; Breeze, T.D.; Dicks, L.V.; Garibaldi, L.A.; Hill, R.; Settele, J.; et al. Safeguarding pollinators and their values to human well-being. Nature 2016, 540, 220–229. [Google Scholar] [CrossRef]
- Li, J.Y.; Zhang, C.; Chen, X. Exploring the relative importance of socio-ecological factors to ecosystem services clusters: A support to spatially targeted management. Environ. Res. Lett. 2021, 16, 084053. [Google Scholar] [CrossRef]
- Cui, X.P.; Xu, Y.K. Trade-offs between Water Environmental Protection and Development—Empirical Evidence from China’s Ecological Function Zone System. J. Coast. Res. 2020, 104, 42–47. [Google Scholar] [CrossRef]
- Eldridge, D.J.; Delgado-Baquerizo, M. Continental-scale Impacts of Livestock Grazing on Ecosystem Supporting and Regulating Services. Land Degrad. Dev. 2017, 28, 1473–1481. [Google Scholar] [CrossRef]
- Larondelle, N.; Lauf, S. Balancing demand and supply of multiple urban ecosystem services on different spatial scales. Ecosyst. Serv. 2016, 22, 18–31. [Google Scholar] [CrossRef]
- Cui, F.Q.; Wang, B.J.; Zhang, Q.; Tang, H.P.; De Maeyer, P.; Hamdi, R.; Dai, L.W. Climate change versus land-use change-What affects the ecosystem services more in the forest-steppe ecotone? Sci. Total Environ. 2021, 759, 143525. [Google Scholar] [CrossRef] [PubMed]
- Augustynczik, A.; Yousefpour, R. Assessing the synergistic value of ecosystem services in European beech forests. Ecosyst. Serv. 2021, 49, 101264. [Google Scholar] [CrossRef]
- Lawler, J.J.; Lewis, D.J.; Nelson, E.; Plantinga, A.J.; Polasky, S.; Withey, J.C.; Helmers, D.P.; Martinuzzi, S.; Pennington, D.; Radeloff, V.C. Projected land-use change impacts on ecosystem services in the United States. Proc. Natl. Acad. Sci. USA 2014, 111, 7492–7497. [Google Scholar] [CrossRef]
- Zuo, R.H.; Ma, Y.; Tang, M.; Luo, H.; Li, J.Q.; Liao, T.; Gong, Y.F.; Zhang, S.F.; Gong, J.Y.; Yi, Y. Regional Carbon Storage Dynamics Driven by Tea Plantation Expansion: Insights from Meitan County, China. Land 2025, 14, 227. [Google Scholar] [CrossRef]
- Mendoza-Ponce, A.; Corona-Núñez, R.; Kraxner, F.; Leduc, S.; Patrizio, P. Identifying effects of land use cover changes and climate change on terrestrial ecosystems and carbon stocks in Mexico. Glob. Environ. Chang 2018, 53, 12–23. [Google Scholar] [CrossRef]
- Faichia, C.; Tong, Z.J.; Zhang, J.Q.; Liu, X.P.; Kazuva, E.; Ullah, K.; Al-Shaibah, B. Using RS Data-Based CA-Markov Model for Dynamic Simulation of Historical and Future LUCC in Vientiane, Laos. Sustainability 2020, 12, 8410. [Google Scholar] [CrossRef]
- Shui, W.; Wu, C.; Fu, Y. Spatial differentiation and influencing factors of soil carbon in the tea plantation based on DNDC model: A case study of anxi county, Fujian province. Chin. J. Agric. Resour. Reg. Plan. 2022, 43, 232–242. [Google Scholar]
- Yang, D.; Liu, Z.M. Does farmer economic organization and agricultural specialization improve rural income? Evidence from China. Econ. Model. 2012, 29, 990–993. [Google Scholar] [CrossRef]
- Zhang, Z.; Hua, C.; Ayyamperumal, R.; Wang, M.; Wang, S. The impact of specialization and large-scale operation on the application of pesticides and chemical fertilizers: A spatial panel data analysis in China. Environ. Impact Assess. 2024, 106, 107496. [Google Scholar] [CrossRef]
- Gomes, E.; Inácio, M.; Bogdzevič, K.; Kalinauskas, M.; Karnauskaitė, D.; Pereira, P. Future land-use changes and its impacts on terrestrial ecosystem services: A review. Sci. Total. Environ. 2021, 781, 146716. [Google Scholar] [CrossRef]
- Li, W.; Geng, J.; Bao, J.; Lin, W.; Wu, Z.; Fan, S. Analysis of Spatial and Temporal Variations in Ecosystem Service Functions and Drivers in Anxi County Based on the InVEST Model. Sustainability 2023, 15, 10153. [Google Scholar] [CrossRef]
- Yang, J.; Xie, B.P.; Tao, W.Q.; Zhang, D.G. Ecosystem Services Assessment, Trade-Off, and Bundles in the Yellow River Basin, China. Diversity 2021, 13, 308. [Google Scholar] [CrossRef]
- Liu, Y. Assessment of Tea Plantation Ecosystemservices in Karst Area Based on InVESTmodel—A Case Study of GuangnanCounty, Yunnan Province; Yunnan University: Kunming, China, 2021. [Google Scholar]
- Wang, K.; Deng, L. Dynamics of forest vegetation carbon stock in Fujian Province based on national forest inventories. J. Fujian For. Univ. 2014, 34, 145–151. [Google Scholar]
- Bao, Y.; Kang, L.; Li, T.; Hu, S. Effects of Land Use Change on Habitat Based on InVEST Model-Taking Yellow River Wetland Nature Reserve in Shaanxi Province as an Example. Arid Zone Res. 2015, 32, 622–629. [Google Scholar]
- Wu, K.; Shui, W.; Xue, C.; Huang, Y.; Jiang, C. Spatiotemporal responses of habitat quality to land use changes in the source area of Pearl River, China. Chin. J. Appl. Ecol. 2023, 34, 169–177. [Google Scholar]
- Xu, J.M.; Liu, J.H.; Gao, J.X. Quantitative assessment of vegetation suitability in China based on carbon-water balance. J. Clean. Prod. 2023, 387, 135735. [Google Scholar] [CrossRef]
- Li, W.; Geng, J.W.; Bao, J.L.; Lin, W.X.; Wu, Z.Y.; Fan, S.S. Spatial and Temporal Evolution Patterns of Habitat Quality under Tea Plantation Expansion and Multi-Scenario Simulation Study: Anxi County as an Example. Land 2023, 12, 1308. [Google Scholar] [CrossRef]
- Zhang, M.; Chen, Y.G.; Fan, D.M.; Zhu, Q.; Pan, Z.Q.; Fan, K.; Wang, X.C. Temporal Evolution of Carbon Storage in Chinese Tea Plantations from 1950 to 2010. Pedosphere 2017, 27, 121–128. [Google Scholar] [CrossRef]
- Xue, H.; Ren, X.Y.; Li, S.Y.; Wu, X.; Cheng, H.; Xu, B.; Gu, B.J.; Yang, G.F.; Peng, C.H.; Ge, Y.; et al. Assessment of private economic benefits and positive environmental externalities of tea plantation in China. Environ. Monit. Assess. 2013, 185, 8501–8516. [Google Scholar] [CrossRef] [PubMed]
- Su, S.L.; Wan, C.; Li, J.; Jin, X.F.; Pi, J.H.; Zhang, Q.W.; Weng, M. Economic benefit and ecological cost of enlarging tea cultivation in subtropical China: Characterizing the trade-off for policy implications. Land Use Policy 2017, 66, 183–195. [Google Scholar] [CrossRef]
- Lin, J.; Chen, Z.; Huang, Y.; Xu, Y.; Jiang, F.; Ge, H. Study on the Charactistics of Spatial Distribution of Slope Disintegration Erosion in Anxi County. Res. Soil Water Conserv. 2009, 16, 63–68. [Google Scholar]
- Pujiono, E.; Sadono, R.; Imron, M.A.; Sutomo; Januar, H.I.; Kuswandi, R.; Kurniawan, H.; Hadi, E.; Saputra, M.H.; Hidayah, I.; et al. An agent-based model of agricultural land expansion in the mountain forest of Timor Island, Indonesia. J. Mt. Sci. 2024, 21, 2263–2282. [Google Scholar] [CrossRef]
- Chang, Y.X.; Zhang, Z.Y.; Yoshino, K.; Zhou, S.G. Farmers’ tea and nation’s trees: A framework for eco-compensation assessment based on a subjective -objective combination analysis. J. Environ. Manag. 2020, 269, 110775. [Google Scholar] [CrossRef]
- Wu, Z.; Lin, Q. The Current Situation and Prevention Countermeasures of Soil Erosion in Tea Gardens of Anxi County. Technol. Soil Water Conserv. 2006, 4, 36–38. [Google Scholar]
- Geng, J.W.; Li, H.P.; Shi, Y.J.; Pang, J.P.; Shao, Y.Y. Comparison and Optimization of Water Conservation Function in Natural Forests and Tea Plantations in a Headwater Catchment, Taihu Lake Basin. Forests 2024, 15, 189. [Google Scholar] [CrossRef]
- Xu, W.H.; Qin, Y.W.; Xiao, X.M.; Di, G.Z.; Doughty, R.B.; Zhou, Y.T.; Zou, Z.H.; Kong, L.; Niu, Q.F.; Kou, W.L. Quantifying spatial-temporal changes of tea plantations in complex landscapes through integrative analyses of optical and microwave imagery. Int. J. Appl. Earth Obs. Geoinf. 2018, 73, 697–711. [Google Scholar] [CrossRef]
- van Biervliet, O.; Wisniewski, K.; Daniels, J.; Vonesh, J.R. Effects of Tea Plantations on Stream Invertebrates in a Global Biodiversity Hotspot in Africa. Biotropica 2009, 41, 469–475. [Google Scholar] [CrossRef]
- Willemen, L.; Crossman, N.D.; Newsom, D.; Hughell, D.; Hunink, J.E.; Milder, J.C. Aggregate effects on ecosystem services from certification of tea farming in the Upper Tana River basin, Kenya. Ecosyst. Serv. 2019, 38, 100962. [Google Scholar] [CrossRef]
- Chen, Y.C.; Zhang, S.; Peng, P.; Fan, S.S.; Liang, J.X.; Ye, J.; Ma, Y.Q. Formation Mechanism of Tourists’ Pro-Environmental Behavior in Wuyishan National Park, China, Based on Ecological Values. Forests 2024, 15, 777. [Google Scholar] [CrossRef]
Disclaimer/Publisher’s Note: The statements, opinions and data contained in all publications are solely those of the individual author(s) and contributor(s) and not of MDPI and/or the editor(s). MDPI and/or the editor(s) disclaim responsibility for any injury to people or property resulting from any ideas, methods, instructions or products referred to in the content. |
© 2025 by the authors. Licensee MDPI, Basel, Switzerland. This article is an open access article distributed under the terms and conditions of the Creative Commons Attribution (CC BY) license (https://creativecommons.org/licenses/by/4.0/).