Abstract
Accurate determination of soil and contact parameters is crucial for tillage machinery design; however, the interactions among soil, tools, and roots in citrus orchards covered with green manure remain insufficiently defined. This study, therefore, combined physical experiments with DEM simulations to characterize these interactions. Using significance analysis and response surface methodology (RSM), the effects of major factors on angle of repose (AoR) and initial slip angle (ISA) at varying soil depths were evaluated, enabling precise calibration of both external (soil–machinery) and internal (particle–particle) parameters. Subsequently, a GA-BP optimization model was constructed to enhance calibration accuracy, yielding optimal values for the soil-to-soil rolling friction coefficient (γ = 0.125–0.136), soil-to-65Mn static friction coefficient (μ′ = 0.431 − 0.540), and soil surface energy (JKR = 0.952 − 1.091 J·m−2). Shear tests using the bonding V2 model were conducted to calibrate the Bonding parameters of green manure stems and roots, while pull-out tests and simulations were used to validate the root–soil parameters. Direct shear tests confirmed the model’s reliability, with errors in internal friction angle and cohesion below 10%. These findings may contribute to improving DEM simulation accuracy for soil improvement under green manure coverage and support the optimization of soil tillage in citrus orchards.
1. Introduction
Citrus, cultivated in over 140 countries, enjoys worldwide popularity for its remarkable nutritional value and economic significance [1]. China is one of the major producers, particularly in the southwestern and south-central regions [2,3]. Green manure is commonly planted in citrus orchards to suppress weeds, fix atmospheric nitrogen, and improve soil moisture retention [4,5]. Typical green manure species include vicia villosa roth, ryegrass, and orychophragmus violaceus. Their root systems are generally categorized into taproot systems and fibrous root systems. Among these, Orychophragmus violaceus roots secrete organic acids such as citric and malic acid, which significantly enhance soil acid phosphatase activity and increase the availability of organic phosphorus [6]. Ryegrass is particularly effective in suppressing harmful weeds and preventing nitrogen and phosphorus loss from soil [7,8]. This study, thus, mainly focuses on Orychophragmus violaceus and ryegrass.
In practice, following the shredding of green manure stalks [9,10], agricultural practices, such as trenching and deep plowing, are often conducted near the tree’s drip line, specifically targeting the 20–40 cm soil layer [11]. With increasing mechanization in citrus production, understanding the interaction between equipment and the green manure–soil composite during furrow fertilization, deep tillage, and bed formation has become critical. However, due to limited data on the physical and contact properties of soil, green manure stalks, and roots, it is necessary to quantify these parameters and their interactions with machinery materials. Such supports optimization of mechanized soil operations and promotes sustainable citrus cultivation [12,13].
Numerical modeling, particularly the Discrete Element Method (DEM), has been characterized as an effective tool for simulating the mechanical behavior of soil and its interaction with agricultural machinery [14,15]. Nowadays, the DEM has been increasingly employed to model the interaction process of soil and plants, thereby guiding the structural optimization of tillage tools [16,17,18]. Representative DEM-based applications in orchard contexts include the optimization of green-manure offset straw returners [19], the development of orchard mowing and sweeping devices [20], and the design of vertical-spiral furrow-opening fertilizers [21]. However, reports on citrus orchard soils’ physical and interaction properties under green manure cover are scarce, leading to a lack of experimental data for related agricultural machinery development.
Selecting an appropriate DEM base contact model is a prerequisite for parameter calibration and agricultural machinery simulation tests. For agricultural materials, base model selection depends on the intrinsic mechanical behavior of the material. These include the JKR model [22] for cohesive and surface energy effects, the no-slip model [23] for non-cohesive particles, and the Hysteretic Spring model [24] for particles exhibiting hysteretic elastic behavior. Additionally, if the material can form a continuous flexible body and undergo fracture, the Bonding or Bonding V2 models may be applied. Compared to the original Bonding model, Bonding V2 offers more flexible dynamic bonding and fracture logic [25]. Proper selection of the DEM contact model for soil and green manure is therefore essential to ensure the reliability of subsequent parameter calibration and mechanical operation simulations.
Reliable DEM models require accurate physical and interaction parameters [26]. Physical parameters, such as density, Poisson’s ratio, and shear modulus, are mainly obtained through physical experiments [14]. While, contact and bonding parameters, e.g., coefficient of restitution, coefficient of static friction, normal stiffness per unit area, and shear stiffness per unit area, are mainly calibrated using DEM. Angle of repose (AoR) and initial slip angle (ISA) tests are commonly used to calibrate contact parameters between soil particles and between soil and tillage materials [17,27,28,29]. Bonding parameters for cohesive particle models of flexible materials can be calibrated through shear and tensile tests [30,31,32].
Despite advances in DEM for general agricultural applications, the mechanical modeling of citrus orchard soils with green manure remains underexplored. This investigation, thus, attempted to determine the physical and interaction parameters for soil, green manure stalks, and roots. Basically, the AoR and ISA tests were employed to calibrate inter-particle and particle-material interaction parameters, and the shear tests were performed to validate the reliability of the Hertz–Mindlin with Bonding V2 model for green manure. Additionally, the overall accuracy of the DEM simulation in representing the behavior of the composite soil layer was assessed using the pull-out and direct shear testing [22,33]. These findings may provide a scientific basis for the design and optimization of tillage equipment suitable for citrus orchards with green manure cover.
2. Materials and Methods
2.1. Preparation of Materials
2.1.1. Soil-Green Manure Mixture
In September 2024, undisturbed soil and green manure samples were collected, from a mechanized citrus orchard in Beibei District, Chongqing (106°60′64″ E, 29°86′25″ N), as displayed in Figure 1. At each soil depth (0–100, 100–200, 200–300, and 300–400 mm), five independent soil samples were collected and analyzed, and the average values are reported in Table 1. The orchard, which cultivated the Ehime No. 38 citrus variety, the tree age was 15 years, featured a layered purple soil profile that had been structurally improved through the addition of river sand, paddy soil, and rice husk substrate (Figure 1a). This study focused on green manure types commonly grown in mechanized citrus orchards with a 180–200-day cropping cycle: orychophragmus violaceus (taproot system), Figure 1(b1), and ryegrass (fibrous root system), Figure 1(b1). Experimentally, a metallographic microscope (UCMOS05100KPA, COSSIM, Hangzhou, China) was employed to categorize the shape of the soil particles (Figure 2a), using 100 randomly selected particles as sample. Collectively, basic characteristics of the soil and green manure (Table 1) were measured, and summarized (Table 2).
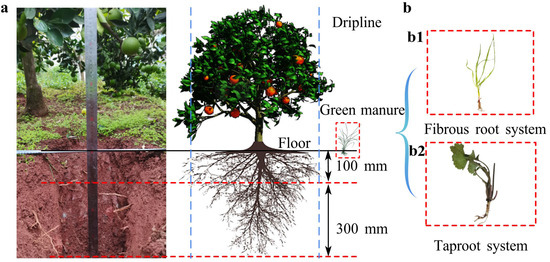
Figure 1.
Ryegrass (fibrous roots). (a) Soil profile of the citrus planting area. (b) Green manure, (b1) Ryegrass (fibrous roots); (b2) Orychophragmus violaceus (taproot system).

Table 1.
Basic characteristics of soil in citrus planting area.
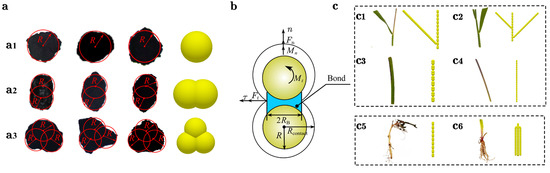
Figure 2.
Soil contact model and particle model. (a) Soil particle models: (a1) represents single-sphere particles, (a2) double-sphere particles, and (a3) triple-sphere particles. The particle radius is R. Simulation contact parameters and discrete element model of green manure stems and roots. (b) Hertz–Mindlin with Bonding V2 model. (c) Simulation model of green manure stalks and roots: (c1,c2) represent stalks with leaves; (c3,c4) are leafless stalks with taproots and fibrous roots; (c5,c6) depict root systems with taproots and fibrous roots.
Table 2.
Basic characteristics of green manure in citrus planting land.
2.1.2. Establishment of Particle Models
According to basic characteristics (Table 1 and Table 2), especially size and shape, particle models of soil (Figure 2a) and green manure (Figure 2c), were constructed, respectively. To reduce computational load, the physical particle radii were scaled by a factor of 1–10 relative to their actual size [39]. Within a small scaling range, the influence of particle size on contact parameters was minimal. According to the sieving results and to ensure model consistency, the particle radius in the simulation was finally set to 1 mm.
Fibrous root system green manure stems were modeled with a diameter of 1 ± 0.5 mm and constructed using rigid elements with a radius of 1 mm, length of 2.2 mm, and a contact radius of 1 mm. Taproot green manure stems were assigned a diameter of 3 ± 0.5 mm and constructed from n rigid elements with a radius of 1.8 mm, a length of 4.9 mm, and a contact radius of 2 mm. To simplify attached leaf structures, the leaf radius was set to 0.5 mm with a contact radius of 0.6 mm. Figure 2(c1,c2) illustrates fibrous root system stems with one and two leaves, respectively (lengths: 33 mm and 33.5 mm; widths: 31 mm and 49.3 mm). Figure 2(c3,c4) represents leafless segments of taproot and fibrous root stems, each 30 mm long.
In this study, following the simplification strategies reported in the literature [22,31,40], a simplified root representation was adopted to retain the dominant mechanical behavior while remaining computationally feasible, preserving the key geometric and mechanical characteristics of the sampled volume. For taproot systems, a single, unbranched main root was idealized because higher-order laterals were relatively small in the samples. For fibrous root systems, higher-order lateral roots with small diameters were neglected due to their limited impact on the overall mechanical response, while coarse roots (approximately 0.8–1.2 mm in diameter) were retained in the model. The adjusted taproot model (Figure 2(c5,c6)) had a length of 60 mm and was composed of rigid elements each 3.5 mm long, with a 2 mm physical radius, 2.4 mm contact radius. The fibrous root model has a length of 40 mm, simplified to six constituent units of 0.5 mm radius, connected with a contact radius of 0.6 mm.
2.2. Determination of Contact Parameters
During tillage, collisions and friction occur among soil, green manure, and tillage materials. Following previous studies, interaction parameters were determined using a combination of literature values and physical experiments (Table 3). To ensure the accuracy and reliability of the simulation model, key contact parameters were measured and calibrated. As 65 Mn is commonly used in soil-tillage machinery, it was selected for testing. Since the soil used is cohesive, friction is the dominant force affecting tillage performance; thus, the static friction coefficient between the soil and 65 Mn steel was measured. Due to the non-spherical nature of green manure roots, rolling friction coefficients between roots, and between roots and tillage materials, could not be directly measured. Thus, the static friction and restitution coefficients between roots and soil were obtained via a friction tester and collision tests.
Table 3.
Simulation parameter range.
2.2.1. Coefficient of Static Friction Between Soil and 65 Mn
Coefficient of static friction (CoSF) between soil particles and 65 Mn was measured using an MXD-01 friction coefficient meter (Jinan Saicheng Electronic Technology Co., Ltd., Jinan, China), as displayed in Figure 3(a1). Soil samples at different depths were prepared in advance. During testing, a 200 × 160 mm 65 Mn steel plate was fixed on the instrument’s platform, and the soil plate was adhered to the slider’s underside with adhesive. A 200 ± 2 g block was placed on the slider to ensure stable contact without interference from particle height. The slider moved uniformly at 100 ± 10 mm·min−1 until the stroke was completed, and the CoSF was recorded. Each test was repeated five times, the average was used for accuracy, and the mean value was calculated for accuracy.
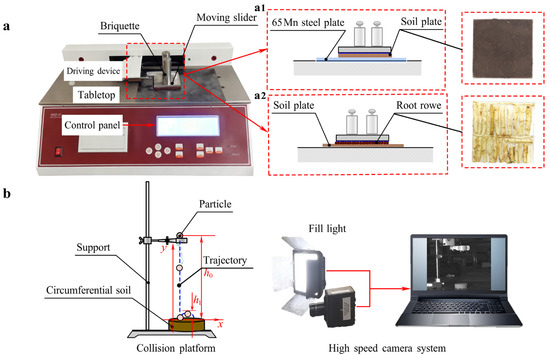
Figure 3.
Determination of contact parameters. (a) Coefficient of static friction (CoSF) test. (a1) The static friction coefficient between soil and 65Mn steel; (a2) The static friction coefficient between root plate and the soil. (b) Coefficient of restitution (CoR) test.
The measured CoSF values between soil and 65 Mn were 0.408 (0–100 mm), 0.378 (100–200 mm), 0.426 (200–300 mm), and 0.448 (300–400 mm). Interestingly, the CoSF generally showed an increasing trend with depth, except in soil layers containing green manure roots. This trend may be attributed to the higher moisture content in deeper layers, which enhances static friction between soil and tillage materials [44].
2.2.2. Coefficient of Restitution and Static Friction Between Root System and Soil
Coefficient of Restitution
The coefficient of restitution (CoR) is the ratio of the relative separation velocity (V1) to the relative approach velocity (V0) along the contact normal (Equation (1)). To measure CoR, a test platform was constructed (Figure 3b), with the collision platform positioned about 500 mm in front of a high-speed camera (Photron Fastcam Mini UX, Tokyo, Japan). Particles were dropped from a height of 200 mm (h0), and the testing processes were captured by the camera. The captured processes were analyzed using MATLAB 2022, which involved grayscale conversion, Gaussian filtering, Otsu thresholding, morphological closing, and connected domain-based edge detection. Kalman filtering was applied to track particle trajectories, followed by wavelet packet denoising for smoothing to obtain the rebound height after collision [45]. An analysis based on Equation (1) revealed that the average restitution coefficients were 0.18 for taproots and 0.10 for fibrous roots (Table 3). Taproots of green manure, being thicker and more rigid, exhibit greater elastic recovery upon impact. In contrast, the flexible structure of fibrous roots likely results in higher energy dissipation [46].
where e is the coefficient of restitution, dimensionless; V0 represents the relative approach velocity before the collision, m·s−1; V1 is the relative separation velocity after the collision, m·s−1; g means the acceleration due to gravity, 9.8 m·s−2; h1 indicates the rebound height after the collision, mm; and h0 shows the height from which the particle was freely dropped before it hit the surface, mm.
Coefficient of Static Friction
To measure the static friction coefficient between roots and soil, the soil plate was fixed on a flat surface, and the root plate was attached to the bottom of a sliding block, as shown in Figure 3(a2). Considering that a single green manure root was too light to ensure sufficient contact with the soil, multiple single roots were arranged and bonded together to form a root plate, which served as the contact surface for the test. The total thickness of the root plate and soil plate did not exceed the measurable range of the friction coefficient tester [22]. The remaining procedure followed the same method used for the soil-65 Mn measurement (Section 2.2.1). Average values from five independent replicates showed that the CoSF between roots and soil was 0.58 for fibrous roots, and 0.2 for taproots (Table 3). The higher CoSF for fibrous roots may be attributed to their numerous fine roots, which increase soil contact area and adhesion. By contrast, taproots have fewer lateral roots and a smaller contact area, resulting in lower friction [47].
2.3. Plan of Simulations
Essentially, the contact, particle (Section 2.1), and setup models are required for DEM to characterize properties [14].
2.3.1. Construction of the Contact Model
Accurate results in DEM simulations would highly depend on selecting an appropriate contact model [31]. Therefore, based on material properties, contact models for soil-to-soil and between green manure particle interactions were, respectively, determined.
Contact Model of Soil-to-Soil
According to the soil database [48], soils in southwest China’s citrus orchards are predominantly clay loam. Given the cohesive and elastoplastic behavior of our samples [49], the Hertz–Mindlin with JKR contact model was chosen. This model accurately captures interparticle cohesion and simulates the stress–strain behavior at particle contacts [50].
Contact Model of Green Manure Particles
To represent the bending and shearing behavior of flexible green manure stalks and roots, the Hertz–Mindlin with Bonding v2 model in EDEM was employed. Accordingly, the model was used to bond adjacent rigid body units [51], as depicted in Figure 2b. Once the rigid units are bonded, the force and torque on the particles are initially set to zero, and then dynamically updated at each simulation time step (Equation (2)). Due to relative motion (translation and rotation) between particles, both tangential and normal forces act on the bonds. Adhesion breaks when normal and tangential shear stresses exceed a critical threshold (Equation (4)). According to particle adhesion theory, adhesion between particles depends on the unit area normal stiffness kn and unit area tangential stiffness kt [52], as described via Equation (5). Since adhesion occurs between particles of the same type, the equivalent elastic modulus (MPa) is E⁎ = E/1 − v2, and the equivalent radius (mm) is R⁎ = R/2 t. From this, the normal and shear stiffnesses can be expressed as and .
In the above equations, A represents the contact area, m2; J stands for the moment of inertia, kg·m2; RB is the adhesive radius, m; Sn, St denote the normal and shear stiffness, N·m−1; δt means the time step; vn, vt represent the normal and tangential velocities of the particles, m·s−1; ωn, ωt indicate the normal and tangential angular velocities, rad·s−1; δFn, δFs refer to the normal and tangential adhesive forces of the bond; δMn, δMs signify the normal and tangential torques of the bond; σmax and τmax denote the maximum normal and tangential critical stresses, respectively; kn stands for the normal stiffness per unit area, N·m−3; while δn represents the normal load, N; kt represents the shear stiffness per unit are, N·m−3, while G* = G/2 − v is the equivalent shear modulus, MPa.
2.3.2. Contact Parameter Assays
Soil behavior during tillage is primarily influenced by internal and external contact parameters, notably shear deformation, cohesion, and the friction coefficient [53]. To calibrate and optimize the simulation parameters for soil improvement in citrus orchards of the southwest, both physical tests and simulation were employed. Experiments were designed by using Design-Expert 13.0 software.
Angle of Repose Assays
Angle of repose (AoR) is an important indicator that reflects interaction force between particles during the interaction between soil and agricultural machinery. The test apparatus (Figure 4a) was constructed, based on the EDEM corporate white paper and relevant literature [54]. It included an MTS universal testing machine (Model: E43.50, MTS Systems Corporation, Alton, VA, USA), a gripping device, and a cylindrical body made of 65 Mn steel with an inner diameter-to-height ratio of 1:3 (ϕ150 × h450 mm). The 65 Mn steel baseplate measured 500 × 500 mm.
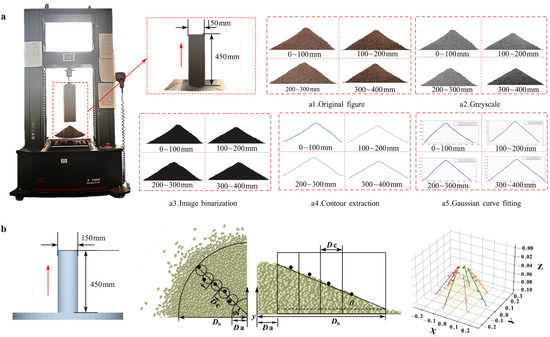
Figure 4.
Calculation of soil angle of repose (AoR) and setup of the simulation model. (a) Test steps for soil AoR at varying depths: A camera captures the soil particle accumulation image (a1), images undergo grayscale conversion (a2), binarization (a3), and contour extraction (a4). The contour is fitted to a Gaussian function, , producing a fitting line for the contour boundary (a5). Taking the second derivative and setting , the slope at the inflection point is obtained as , yielding the final AoR as , where a is the height of the peak of the curve; b is the coordinate of the center of the peak; c is called the standard deviation. Typically, a > 0. For contour fitting images, see Figure A1 in Appendix B. (b) Soil AOR simulation test. The simulation device and test process were consistent with the physical tests. Where Da is the low domain limit, Db is the high domain limit, Dc is the bin diameter, θ is the angle of repose, and φ is the slice orientation angle.
During testing, the cylinder was placed on the baseplate and filled with soil matching the volume used in EDEM simulations. The cylinder was then lifted at a uniform speed of 0.05 m·s−1. It allowed the soil to fall naturally and form a stable conical pile on the baseplate. Once the soil pile reached a stable angle, images were captured with a camera positioned parallel to the plate. AoR was measured as the angle between the soil pile slope and the baseplate.
Captured images were processed in MATLAB through grayscale conversion, binarization, and contour extraction (Figure 4a). Observations of soil particle piles at different depths, and other discrete particle pile shapes from the literature [55] revealed that most discrete particle piles had central protrusions with near-linear slope contours. Thus, contour boundary points were fitted using a Gaussian function in Curve Fitter. The tangent value of the fitted line determined the AoR.
A simulation model consistent with the physical test was established in EDEM 2020 (Figure 4b). The stacking angle of the conical particle pile was accurately measured via post-processing, integrating EDEMpy 0.1.3 with the Spyder interface of Anaconda 3. The central coordinates (X, Y, Z) of particles were extracted, and the pile was divided into n radial umbrella-shaped segments, each with an angle φ (eight segments were used to avoid overlap). The coordinates of the highest particle in each segment were determined. The region between a lower domain diameter Da and high domain diameter Db was equally divided into i slices with a bin diameter Dc. By obtaining the centroid coordinates of particles within each slice and applying the least squares linear fitting method, the AoR was determined. Calculate θ for n umbrella areas, derive the average AoR (θ), standard deviation, and variance coefficient. The fitted line was plotted as 3D graph.
Initial Slip Angle Assays
Clay particles exhibit strong adhesion due to surface tension and surface energy. Zhao et al. [56] investigated the relationship between soil moisture and surface energy through landslide testing, which informed this study’s use of the Initial Slip Angle (ISA) test for soil parameter measurement. Following the EDEM white paper on JKR material friction angles and JB/T 9014.9-1999 [57], the slope method was employed to measure the friction angles between soil samples at different depths and the agricultural machinery material (65 Mn). The instruments utilized a homemade friction angle measuring instrument, ϕ300 × 100 mm consolidation box, a 500 × 500 mm 65 Mn steel plate, and a digital angle gauge (Figure 5).
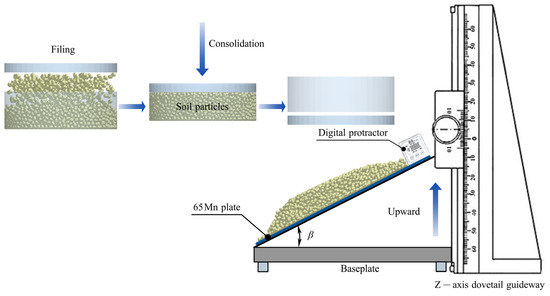
Figure 5.
Initial slip angle test.
A 5 kg soil sample was loaded at 2 kN with a loading rate of 8.48 kN/min in the consolidation box, then placed on the steel plate. The inclined plane was raised at a uniform speed until soil particles began to slide, and the angle shown by the digital gauge was recorded as the ISA. Each test was repeated five times per depth, and the average value was used to ensure accuracy.
The key parameters and experimental procedures of the simulation model platform were consistent with those of the physical tests. The initial sliding angle (when particles begin to slide), and the final sliding angle (when all particles slide off the plate) represent interactions between particles and materials with surface energy. To facilitate the measurement of the friction angle in the simulation model, EDEMpy 0.1.3 and Anaconda 3’s Spyder interface were used to couple and program the post-processing analysis of EDEM 2020. ISA was determined by the geometric friction motion of the particles and quantified by the percentage of particles in contact with the 65 Mn steel plate that slid. The friction angle was determined by reading the initial and final slip thresholds of the particles in the post-processing data.
Shear Assays
Green manure parameters were calibrated via EDEM software by calibrating the stickiness parameters of rigid units based on physical and simulation test results [16,31]. According to the literature [51,58], the primary parameters that affected adhesion in flexible bodies were normal stiffness per unit area (kn), shear stiffness per unit area (kt), critical shear stress (σmax), and critical normal stress (τmax).
In citrus orchards, green manure stems are crushed with a lawn mower and returned to the soil surface. The resulting soil–green manure composite mainly consists of soil, a surface mulch layer of crushed stems, and roots within the soil [59]. Samples were collected at 1 m intervals plus 10 random surface points. After clearing the mulch, root-containing soil was cored vertically with a φ61.8 × 20 mm ring cutter. Root samples were cleaned from the soil without damage. The average length of green manure stems was 40 mm, and the root lengths were the natural root lengths (Figure 6(a2)).
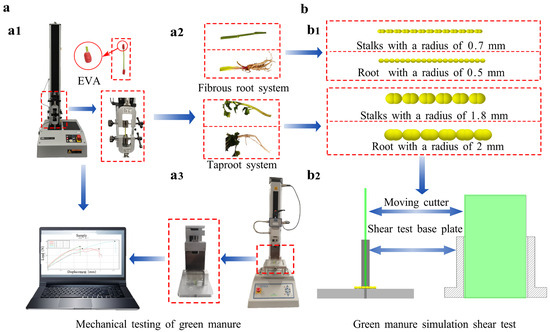
Figure 6.
Mechanical testing and shear simulation model of green manure stems and roots. (a) Tensile and shear tests of green manure. (a1) Tensile test; (a2) Fibrous root system stem and roots; (a3) Taproot system stem and roots. (b) Shear simulation, where (b1) represents the fibrous-root stems and root system, and (b2) depicts the stalk and root system of the taproot system. Dimensions match those detailed in Section 2.1.2 The fibrous-root system is simplified into six roots, each with a 0.5 mm radius.
Tensile tests were conducted using an INSTRON universal testing machine (model: 34SC-1; stroke: 1050 mm; load capacity: 1 kN, INSTRON, Norwood, MA, USA). To prevent damage due to irregular morphology and clamps, leaves were removed, and the ends of stems and roots were wrapped in EVA material. Figure 6(a1) shows a schematic diagram of the physical testing process. Both the tensile samples of the prepared green manure stems and roots were fixed in the tensile clip during the test. The samples were stretched upwards at 5 mm·min−1 in fixed displacement mode. Shear tests (Figure 6(a3)) were performed using a TMS-PRO texture analyzer (load capacity: 2.5 kN, Food Technology Corporation, Sterling, VA, USA) at the same loading speed of 5 mm·min−1. The max force recorded during the shear test was used as the reference value for calibrating DEM bonding parameters.
2.3.3. Plans for the Determination of Significant Parameters
The soil model was established by referencing literature and measurement methods to define material properties and boundary conditions. For the key tillage component material 65 Mn, the Poisson ratio was set at 0.288, the density at 7.82 × 10³ kg·m−3, and the shear modulus at 78.5 GPa [60]. To align the simulation model with actual production needs, a series of parameter optimization experiments, namely Plackett-Burman, Box-Benhnken, and verification tests, were conducted [17].
Plackett–Burman Tests
Box–Benhnken Design Assays
To further determine suitable parameters for DEM modeling of soil, the PB test results were used to identify appropriate parameters, with AoR and ISA as responses. Box–Behnken test was conducted, where −1, 0, and +1 represented the low level, center point, and high level of each factor, respectively.
The intrinsic properties (Table 2) and contact parameters (Table 3) were pre-measured and referenced following the method reported by Wang et al. [58]. Based on tensile and shear tests, along with Equations (2)–(5), the critical ranges of the green manure bonding parameters were determined and set as the levels for the calibration experiments. Using the maximum load from the physical shear test as the reference value, a Box–Behnken Design (BBD) with four factors and three levels was employed to conduct the calibration experiments.
2.4. Experimental Validation of Soil–Green Manure Interactions
To validate the soil–green manure root interaction model, root pull-out and direct shear tests were conducted. Pull-out tests were conducted to evaluate the interaction between soil and root systems [61], while direct shear tests were used to validate the calibrated parameters of soil and soil–root composites [22]. Soil samples were collected using a ϕ61.8 × 20 mm ring cutter inserted perpendicular to the soil layers. Samples were taken from four depth intervals: 0–100 mm (containing green manure roots), 100–200 mm, 200–300 mm, and 300–400 mm. During testing, the moisture content of the soil and roots was adjusted to match the levels at the time of sampling.
2.4.1. Root Pull-Out Test
Root pull-out tests were performed using an INSTRON universal testing machine (load capacity: 1 kN) to validate root–soil interaction model parameters. Orychophragmus violaceus and ryegrass were grown in soil boxes (100 × 100 × 100 mm) for 2 weeks, and under indoor conditions at a temperature of 25 ± 5 °C with a 12 h light cycle. Each box was fixed to the lower fixture of the tensile module, and roots were extracted upward at 10 mm·min−1 (Figure 7a), recording maximum pull-out force. DEM simulations followed the same protocol, with five replicates per group (Figure 7b). Soil parameters were derived from AoR and ISA calibrations; root parameters were taken from Section 2.3.3 calibration; actual root pull-out simulation parameters are listed in Table 3.
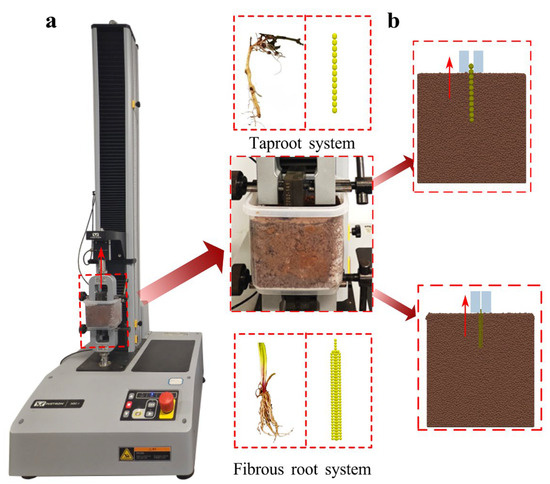
Figure 7.
Pull-out test device and process. (a) Pulling test of actual roots in soil; (b) root pullout simulation test.
2.4.2. Direct Shear Test
Direct shear tests were conducted to validate the calibrated parameters for both the soil and soil–root composite models. Soil samples were collected vertically using a ϕ61.8 × 20 mm ring cutter at depths of 0–100 mm (with green manure roots), 100–200 mm, 200–300 mm, and 300–400 mm. Tests were conducted on a ZJ-type four-unit strain-controlled direct shear apparatus (Nanjing Soil Instrument Factory, Nanjing, China). Three vertical stress levels (100, 200, and 300 kPa) were applied according to the reference values of direct shear tests for purple soil planting sites [62,63], with a strain rate of 0.8 mm·min−1. Soil sampling and apparatus setup were illustrated in Figure 8a. According to the GB/T 50123-2019 standard [64], the specimen is considered failed when the dial indicator readings remain constant or decrease; additionally, if no peak shear stress is observed during shearing, the process is deemed complete when the soil sample reaches a shear displacement of 4 mm [65]. The theoretical formula of the soil direct shear test is Equation (6).
where τ is the soil shear strength, kPa; R denotes the dial gauge reading, mm; and C is the coefficient corresponding to the proving ring, N/0.01 mm.
τ = CR
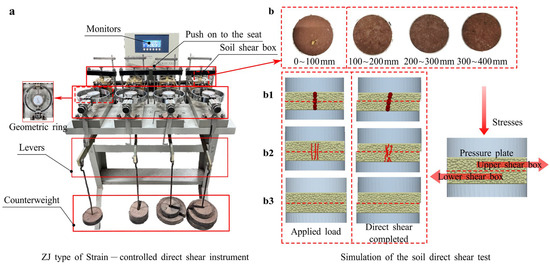
Figure 8.
Direct shear test process and apparatus. The test follows GB/T 50123-2019 standards. (a) Soil direct shear test. (b) Simulation of soil direct shear test, with (b1) showing a soil shear specimen with taproot, (b2) a specimen with fibrous roots, and (b3) a plain soil specimen.
DEM simulation followed the same procedure as the physical test (Figure 8b). Soil contact parameters were calibrated using AoR and ISA tests, and root bonding parameters were obtained from shear tests. Other parameters are listed in Table 3 and Table A2. Different vertical loads were sequentially applied via the force controller in the EDEM.
The relationship between shear strength and vertical pressure was analyzed based on the Mohr–Coulomb criterion, and fitted using Origin 2024 software to obtain the soil’s internal friction angle (φ′) and cohesion (c), as depicted in Figure 10.
where τf is the shear strength, kPa; c indicates soil cohesion, kPa; p means the vertical pressure, kPa; φ′ is the internal friction angle of soil, °.
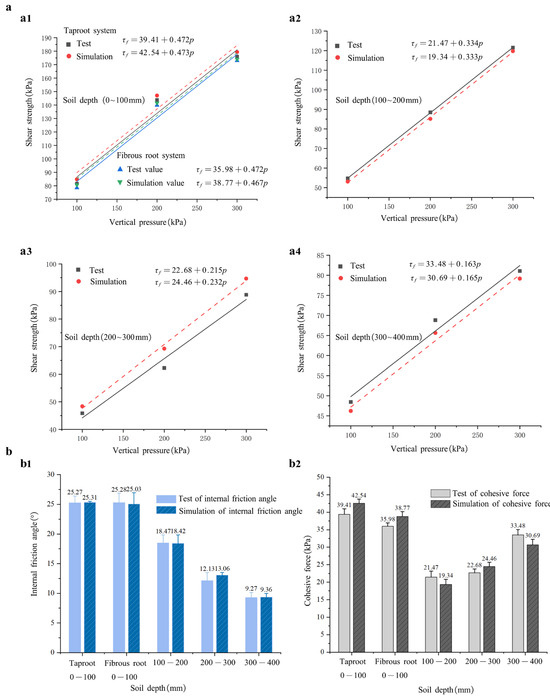
Figure 10.
Results of soil direct shear tests. (a) Relationship between soil shear strength and vertical load at various depths in both physical and simulation tests. According to Equation (7), a linear fit is applied between shear strength and vertical load, where the slope represents the internal friction angle and the vertical axis intercept represents soil cohesion. (a1) shows soil with roots (fibrous and taproot systems) at a depth of 0–100 mm, while (a2,a3,a4) illustrate shear strength versus load curves at depths of 100–200 mm, 200–300 mm, and 300–400 mm, respectively. (b) Internal friction angle and cohesion values derived from both physical and simulation tests at different depths. (b1) Internal friction angle, (b2) Cohesion.
2.5. Statistical Analysis
Statistical significance was achieved using analysis of variance (ANOVA) provided by Design Expert Ver. 13.0 (*, p < 0.05, significant; **, p < 0.01, extremely significant).
3. Results
3.1. Calibration of Soil Parameters
3.1.1. Significant Factors Determine by PB Test
From Table 4, the p < 0.05 for both the AoR (Angle of Repose) and ISA (Initial Slip Angle) models, indicating that the regression models are significant. The difference between the and of AoR and ISA is less than 0.2, Adeq Precision > 4, demonstrating that the models can accurately predict the variations in each factor. Furthermore, γ, μ′, and JKR were significant factors affecting AoR and ISA. These suggest that increasing the values of these three factors positively correlates with increases in AoR and ISA results. Consequently, these three parameters were chosen for the BBD tests, with their low, center, and high levels defined by the values in Table 1 and Table 3. All other parameters were fixed using the measurements from Table 1 and references from Table A2. Test BBD matrix and results are presented in Table A3.
Table 4.
Plackett–Burman significance analysis.
3.1.2. Mechanism Models for Significant Parameters of Soil
To capture the effect of significant factors on AOR and ISA, the action model (Equations (8) and (9)) was constructed based on the BBD test.
Table 5 shows that the p for both AoR and ISA are less than 0.05, indicating that the model terms are significant. For AoR, the single-factor terms γ and μ′ were highly significant, while JKR was significant. Interaction terms such as JKR × μ′, γ2, and μ′2 also significantly affect the experimental results. For ISA, the single-factor terms γ and JKR were significant, while μ′ was highly significant. Interaction terms γ × μ′ and μ′2 are significant factors affecting the experimental results. Additionally, the difference between and for both AoR and ISA is less than 0.2, indicating a high degree of fit with the actual data and good correlation. The Adeq Precision for both AoR and ISA is greater than 4, indicating that the models can be used to predict the AoR and ISA of the improved purple soil effectively.
Table 5.
ANOVA for Box–Benhnken design regression model.
3.1.3. Optimization Parameters of Soil
Based on the physical tests, the average Angle of Repose (AoR) of soil at depths of 0–400 mm was 35.5 ± 1.3°, 33.68 ± 1.9°, 34.46 ± 1.6°, and 34.08 ± 1.1°, respectively. The ISA between soil particles and the 65 Mn steel plate at corresponding depths was 20.92 ± 1.98°, 17.74 ± 2.74°, 22.38 ± 4.02°, and 24.96 ± 1.74°.
To select suitable DEM parameters, physical test data of AoR and ISA at various soil depths were used as target values. A target-value GA-BP optimization model was built using the optimization module in design-expert, and a predictive neural network was implemented in MATLAB 2022. The network included two layers with 10 hidden neurons and 3 output nodes, using AoR and ISA as inputs and their influencing factors as outputs. Regression equations were solved, response surfaces analyzed, and parameter values determined under different AoR and ISA conditions across soil depths. The corresponding target and constraint equations are shown in Equation (10).
By validating multiple optimized solutions (Equation (14)), the best-fitting AoR and ISA values under different soil depths were obtained. Validation tests were conducted using the default parameters (Table 1), the optimized values of significant parameters (Table 6), and the non-significant parameters (Table A2). The results are shown in Table 6. Predicted values were generated by the GA-BP model, and corresponding AoR and ISA simulations were conducted in EDEM. Simulated AoR and ISA values across 0–400 mm depths deviated less than 10% from test results, indicating a good agreement between simulation and physical tests. This validation confirms that the optimized parameters can be applied in subsequent DEM simulations, providing valuable reference data for the design and optimization of related agricultural machinery.
Table 6.
Calibrated soil parameters at different depths and simulation test results.
3.2. Calibration of Green Manure Parameters
3.2.1. Regression Models of Green Manure Significant Factors
Based on the bonding parameter equations in the section Contact Model of Green Manure Particles and the tensile and shear test results from the section Shear Assays, the critical ranges for the green manure bonding parameters were established (Table 7). The maximum load from the physical shear test served as the calibration reference. All other parameters were taken from the measured and literature values in Table 2 and Table 3. The design matrix and outcomes of the four-factor, three-level BBD are summarized in Table A4.
Table 7.
Box–Benhnken design test scheme.
3.2.2. Mechanism Models for Significant Parameters of Green Manure
To improve the accuracy of the discrete element model (DEM) for green manure, the shear force prediction models (Equations (11)–(14)) for the green manure stem and root system was constructed by eliminating insignificant factors based on the BBD test of the green manure flexibility.
Fibrous stem,
Taproot stem,
Fibrous root,
Taproot root,
Variance analysis (Table 7) shows a good fit between green manure shear strength and significant factors (p < 0.01, lack of fit > 0.05). The coefficient of determination values were 0.9382, 0.9349, 0.9929, and 0.9882, with minimal differences between adjusted and predicted (0.0887, 0.1814, 0.0075, and 0.008, < 0.2). These results indicate high reliability of the simplified model, with predicted values closely matching actual data. The Adeq precision values were 13.7482, 15.1936, 32.9782, and 28.0067, all well above the threshold of 4, confirming the model’s predictive capability for adhesive parameters in green manure simulations. From Table 8, p-values for the four single factors in the green manure stalk and root shear strength model show that kn has the greatest impact, with a p < 0.01.
Table 8.
ANOVA results for Box–Benhnken design quadratic regression model of green manure.
3.2.3. Optimization Parameters of Green Manure
Using the optimization module in design-expert software, the optimal adhesion parameter combination was selected to meet the green manure shearing test objectives. As shown in Table 9, the relative error between the simulated and experimental values was consistently below 10%, confirming the high reliability of the green manure model.
Table 9.
Verification results of green manure shear and simulation.
3.3. Experimental Validation Results
3.3.1. Root Pullout Assay
Pull-out force rose linearly with displacement from root-soil friction (Figure 9), with roots straightening and elastically deforming under static friction. When the force reached a critical value, the curve peaked, reflecting the maximum static friction between roots and soil, with displacement primarily caused by root elongation. At the force peak, maximum static friction was reached. Post-peak, force plateaued as root–soil slippage from sliding friction began, loosening soil and weakening adhesion. Further displacement reduced root–soil contact area, gradually lowering pull-out force.
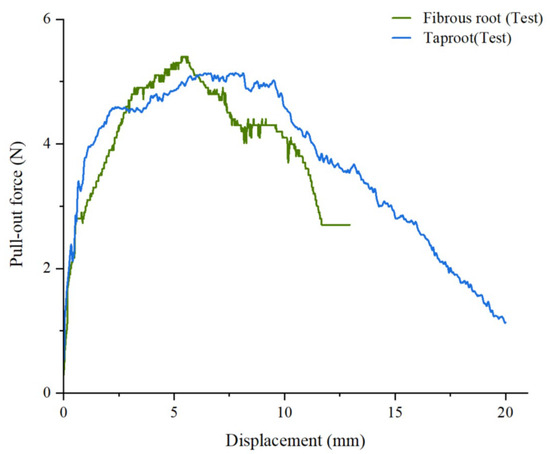
Figure 9.
Force-displacement curve of root pull-out test (physical) in soil.
In physical tests, fibrous roots exhibited higher pull-out forces than taproots, attributed to their higher static friction and larger contact area with soil. Once the soil structure was disrupted, fibrous root pull-out force dropped sharply before stabilizing, while taproot force declined more gradually, consistent with findings by Bai et al. [40] and Zhu et al. [66].
Although the simulation model was idealized and experimental conditions had minor external influences, the overall trends were consistent across simulations and tests. The maximum pull-out forces in simulations were 5.03 N (fibrous roots) and 4.91 N (taproots), closely matching the experimental values of 5.37 N and 5.13 N, respectively. The relative errors were 6.33% and 4.28%, both within 10%, confirming the accuracy of the root–soil interaction parameters and the reliability of the simulation model.
3.3.2. Direct Shear Assay
As shown in Figure 10 and Table 1, combined with the soil samples collected in September (the fertilization period for citrus orchards), the water contents at depths of 0–100 mm, 100–200 mm, 200–300 mm, and 300–400 mm were 12.34%, 15.20%, 16.35%, and 18.16%, respectively. It can be observed that, except for the 0–100 mm layer, soil water content gradually increases with depth, while the internal friction angle decreases correspondingly (Figure 10(b1)). Cohesion, however, exhibits a linear increase with soil depth (Figure 10(b2)), aligning with findings by [67], suggesting that soil moisture content increases with depth and is positively correlated with cohesion in citrus orchard soils.
Notably, when the water content is low, frictional forces dominate between soil particles, resulting in a higher internal friction angle and lower cohesion. As water content increases, capillary water forms thin films between particles, enhancing cohesion while reducing the friction angle [68]. However, above a certain moisture content, interparticle contact weakens, leading to a reduction in cohesion [22,69].
Compared to bare soil (CK) at the same depth [70], the friction angle and cohesion of the root-soil composite increase to varying degrees. The main reason is that the roots are interspersed in the soil, enveloping the soil particles, increasing the roughness and contact area between the roots and the soil, thereby enhancing the cohesion and friction of the root-soil complex. The elastic properties of the root system also help to improve the shear resistance of the root-soil complex, thereby enhancing soil cohesion [71].
Figure 10b indicates that taproots have greater cohesion than fibrous roots. As discussed in Section 2.1.2, the diameter and shear resistance of roots enhance the shear strength of root-containing soils [72]. The simulation results exhibit consistent trends with experimental data regarding the variation in internal friction angle and cohesion with depth, with a maximum relative error within 10%, thereby validating the accuracy of the simulation model. Specifically, the relative errors between simulated and tested values were 0–100 mm (fibrous root: 0.2%, 7.9%; taproot: 9.4%, 7.75%), 100–200 mm (2.7%, 9.8%), 200–300 mm (7.7%, 7.8%), and 300–400 mm (9.7%, 8.3%), all within 10%. These results further confirm the reliability of the numerical model in representing the mechanical behavior of the root–soil composite.
Moreover, during the simulated direct shear test, noticeable root deformation was observed. It can be seen from Figure 8(b1,b2) that the vertical and lateral deformation of the fibrous root system is more obvious than that of the taproot system, which is consistent with the results of the physical test.
4. Discussion
In the southwestern region of China, green manure is commonly planted in orchards to conserve soil moisture and reduce surface temperatures [4,5]. Soil operations in fruit tree planting (trenching, fertilizing, deep tillage, and trench expansion) rely on agricultural equipment. Understanding soil–plant interactions forms the foundation for efficient soil management. Root type markedly influences soil mechanical behavior. Previous studies report differences between taproot and fibrous-root systems in the mechanical response of root–soil composites: Zhang et al. [73] found that fibrous roots exert a greater effect on the tensile strength of root–soil composites in loess hill regions than taproots; Forster et al. [74] showed that root morphology affects soil shear strength and identified fava bean (taproot) as an effective candidate for improving shear resistance; Xiaohong L [75] reported that long-rooted alfalfa (taproot) produced composites with higher shear strength than lupin (fibrous-root).
Soil intrinsic properties also play a key role in mechanical behavior. Clay exhibits complex moisture-dependent responses: apparent cohesion may increase at low-to-moderate water contents, but shear strength typically decreases markedly at high saturation (Wang et al., 2010) [67]. Increased clay content generally raises cohesion and surface energy [49]. Furthermore, soil bulk density, moisture content, and shear resistance tend to increase with depth [76,77]. Thus, characterizing root type and soil characteristics is essential when studying the mechanical behavior of green-manure-covered orchard soils.
Previous DEM studies have modeled root–soil systems under various conditions. Bai et al. [40] employed PFC2D to construct a simplified root–soil discrete element model and conducted direct shear simulations to evaluate the reinforcing effects of various root systems. Chen et al. [28] and Tang et al. [34] developed a DEM-based soil–straw composite model under no-till conditions. However, studies focusing on orchard green manure–soil characteristics and their mechanical interactions with them are still limited.
Soil tillage involves shear deformation, cohesion, and friction. Studies on the mechanical properties of soil and green manure, along with particle interactions, are essential for optimizing model parameters and ensuring simulations effectively guide agricultural operations. Many studies [30] have employed AoR (angle of repose) and ISA (initial sliding angle) tests to calibrate contact parameters for soil particles and tool materials at different depths, providing theoretical support for the development of agricultural equipment.
This study focuses on citrus orchards in Southwest China. AoR and ISA were used as response indicators, and response surface methodology was employed to determine key interaction parameters. DEM modeling and simulation parameters for green manure–amended soil were calibrated accordingly. Bonding parameters of green manure were calibrated through shear tests [31], and root–soil interaction models were validated using root pull-out tests [78]. The compound model was further verified using direct shear tests [79]. Results confirmed that the relationship between shear strength and vertical load in plant–soil composites follows Coulomb’s law. Furthermore, larger root diameters significantly improved soil shear strength by enhancing root-soil interactions [80].
The simulation model (Figure 11) for green manure stems and roots has been constructed using the Hertz-Mindlin with Bonding V2 contact model. It is also considered that for lower versions of EDEM software, the Hertz-Mindlin with Bonding model can be used. Due to the complex and dense structure of roots, simplifications were applied to reduce computational demand and improve efficiency. Based on the characteristics of green manure roots, two types of models were created using SolidWorks 2024 (a taproot model and a fibrous root model). Root particles were generated at specified coordinates using the application programming interface of EDEM 2020 (v2.0.0) and C++ (Microsoft Visual Studio 2022) to develop a custom particle factory. After generating the particle models, particles at specified coordinates were connected using the bonding method. The adjusted taproot model (60 mm length, 2 mm radius) consisted of 15 rigid units, while the fibrous root model (40 mm height, 0.5 mm radius) was built from 165 rigid units. Specifically, replaced Bonding V2 with the simpler bonding formulation while retaining identical calibration parameters (contact, bonding, and physical parameters). Shear validation tests show that the simulated shear force for the taproot model was 54.9 N (relative error 5.67% versus test) and for the fibrous root model was 33.92 N (relative error 8.71% versus test); results from the simplified Bonding model are basically consistent with those from Bonding V2, with the relative error within 10%, which is acceptable for the present engineering-scale simulations.
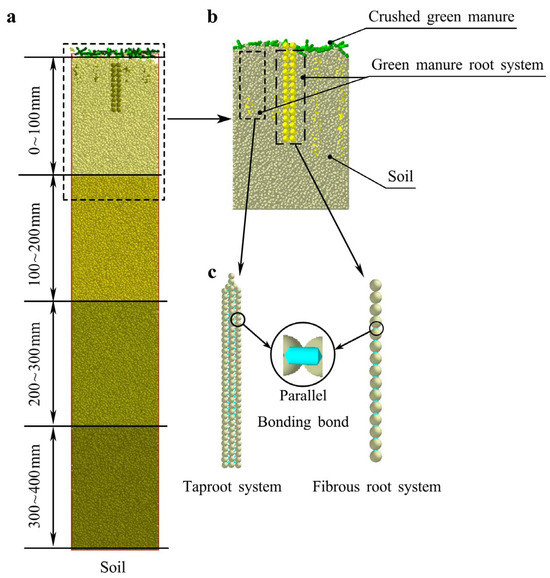
Figure 11.
Citrus orchard soil trough model. (a) Soil trough model at 0–400 mm depth; (b) soil-green manure–root system complex model at 0–100 mm depth; (c) fibrous root system and taproot system model.
5. Conclusions
This study explored soil and green manure conditions for soil processing operations in citrus orchards. Key physical and contact parameters were experimentally measured. A flexible simulation model for green manure stems/roots was established using the Hertz–Mindlin with Bonding V2 model, while soil models at varying depths used the Hertz–Mindlin with JKR model. AoR and ISA served as response indicators. Significant analysis and Response Surface Methodology (RSM) identified and optimized key parameters across depths. Results showed the soil-soil rolling friction coefficient, soil-65 Mn static friction coefficient, and soil surface energy significantly impacted both AoR and ISA, with their interactions analyzed. Optimal parameters were acquired using a GA-BP model and physically validated. Green manure bonding parameters were calibrated via shear tests, achieving < 10% relative error. Root pull-out tests revealed fibrous roots endured higher forces than taproots. Soil shear tests demonstrated increasing depth raised water content, reducing internal friction angle but linearly increasing cohesion. Roots enhanced both internal friction angle and cohesion. Collectively, the parameters and models developed in this study can substantially provide practical guidance for DEM simulations of soil-working operations in green manure–covered citrus orchards in Southwest China. For example, they can be used to optimize the device of ditching or rotary tillage based on soil–tillage material contact parameters, or to predict post-operation soil disturbance using soil–root and soil–soil contact coefficients. It should be noted that these parameters were calibrated for purple soil in Southwest China and for specific green-manure root morphologies; therefore, their application to other soil types requires further adjustment and field validation.
Author Contributions
Conceptualization, C.M. and L.C.; methodology, C.M., J.Z., G.L. and C.L. and C.W.; software, C.M.; validation, C.M., J.Z. and L.W.; investigation, C.M., G.L., C.L. and C.W.; resources, C.W.; data curation, J.Z.; formal analysis, C.M. and L.W.; writing—original draft preparation, C.M.; writing—review and editing, L.C. and J.Z.; visualization, C.M. and G.L.; supervision, L.C. and C.L.; project administration, L.W.; funding acquisition, L.W. and C.W. All authors have read and agreed to the published version of the manuscript.
Funding
This research was funded by the strategic cooperation project between Chongqing and Chinese Academy of Agricultural Sciences (2022-158-13), and Fundamental Research Funds for the Central Universities (SWU-KQ23003).
Institutional Review Board Statement
Not applicable.
Data Availability Statement
The data presented in this study are available on request from the corresponding author due to privacy or ethical restrictions.
Acknowledgments
The authors would like to thank the Southwest University for its support.
Conflicts of Interest
The authors declare no conflicts of interest.
Abbreviations
The following abbreviations are used in this manuscript:
| DEM | Discrete element method |
| AoR | Angle of Repose, ° |
| ISA | Initial Slip Angle, ° |
| CoR | Coefficient of Restitution |
Appendix A
Table A1.
Plackett–Burman screening experiment design and results.
Table A1.
Plackett–Burman screening experiment design and results.
| № | G (MPa) | e | μ | γ | e′ | μ′ | γ′ | JKR (J·m−2) | AoR (°) | ISA (°) |
|---|---|---|---|---|---|---|---|---|---|---|
| 1 | −1 (5.9) | −1 (0.3) | −1 (0.2) | 1 (0.3) | −1 (0.2) | 1 (0.6) | 1 (0.4) | −1 (0.5) | 34.72 | 26.4 |
| 2 | −1 | −1 | −1 | −1 (0.1) | −1 | −1 (0.33) | −1 (0.15) | −1 | 20.20 | 11.7 |
| 3 | 1 (20) | 1 (0.75) | −1 | −1 | −1 | 1 | −1 | 1 (1.5) | 27.90 | 20.6 |
| 4 | 1 | 1 | −1 | 1 | 1 (0.5) | 1 | −1 | −1 | 32.52 | 21.2 |
| 5 | −1 | −1 | 1 (0.5) | −1 | 1 | 1 | −1 | 1 | 29.68 | 27.9 |
| 6 | −1 | 1 | −1 | 1 | 1 | −1 | 1 | 1 | 37.00 | 10.8 |
| 7 | −1 | 1 | 1 | −1 | 1 | 1 | 1 | −1 | 26.94 | 28.1 |
| 8 | 1 | −1 | 1 | 1 | 1 | −1 | −1 | −1 | 31.82 | 11.4 |
| 9 | 1 | −1 | −1 | −1 | 1 | −1 | 1 | 1 | 24.80 | 10.2 |
| 10 | −1 | 1 | 1 | 1 | −1 | −1 | −1 | 1 | 34.25 | 10.8 |
| 11 | 1 | −1 | 1 | 1 | −1 | 1 | 1 | 1 | 38.23 | 25.8 |
| 12 | 1 | 1 | 1 | −1 | −1 | −1 | 1 | −1 | 21.98 | 10.8 |
Table A2.
Soil parameters and contact EDEM parameters.
Table A2.
Soil parameters and contact EDEM parameters.
| Item | Parameter | Symbol | Value | Source |
|---|---|---|---|---|
| Soil | Poisson ratio | ν | 0.38 | [34] |
| Shear modulus (MPa) | G | 20 | [35,36] | |
| Density (kg·m−3) | ρ | 1.47 | Measured | |
| Soil-Soil | Coefficient of restitution | e | 0.37 | [34] |
| Coefficient of static friction | μ | 0.45 | [41] | |
| Soil-65 Mn | Coefficient of restitution | e′ | 0.3 | |
| Coefficient of rolling friction | γ′ | 0.375 | Measured |
Table A3.
Box–Benhnken design test scheme design and results.
Table A3.
Box–Benhnken design test scheme design and results.
| № | γ | JKR (J·m−2) | μ′ | AoR (°) | ISA (°) |
|---|---|---|---|---|---|
| 1 | 0 | 0 | 0 | 39.82 | 19.2 |
| 2 | −1 (0.1) | 0 (1) | −1 (0.33) | 27.32 | 9.90 |
| 3 | 0 (0.2) | 1 (1.5) | 1 (0.6) | 42.42 | 25.8 |
| 4 | 0 | 0 | 0 (0.465) | 38.75 | 18.9 |
| 5 | 1 (0.3) | −1 (0.5) | 0 | 43.78 | 18.6 |
| 6 | 0 | −1 | 1 | 39.74 | 27.0 |
| 7 | 0 | 0 | 0 | 39.29 | 18.6 |
| 8 | −1 | −1 | 0 | 30.60 | 20.4 |
| 9 | 1 | 1 | 0 | 44.80 | 18.3 |
| 10 | −1 | 1 | 0 | 31.55 | 19.2 |
| 11 | 1 | 0 | 1 | 45.15 | 25.8 |
| 12 | 0 | 1 | −1 | 36.15 | 10.2 |
| 13 | 0 | 0 | 0 | 38.63 | 19.2 |
| 14 | 0 | −1 | −1 | 36.03 | 10.8 |
| 15 | 0 | 0 | 0 | 38.51 | 19.2 |
| 16 | 1 | 0 | −1 | 39.61 | 10.8 |
| 17 | −1 | 0 | 1 | 32.80 | 27.6 |
Table A4.
Box–Benhnken design test scheme design and results of green manure.
Table A4.
Box–Benhnken design test scheme design and results of green manure.
| Fibrous | Stems | Root | ||||||||
|---|---|---|---|---|---|---|---|---|---|---|
| № | kn × 1010 (N·m−3) | kt × 109 (N·m−3) | σmax × 108 (Pa) | τmax × 108 (Pa) | Fmax (N) | kn × 109 (N·m−3) | kt × 109 (N·m−3) | σmax × 108 (Pa) | τmax × 108 (Pa) | Fmax (N) |
| 1 | 0 (3.5) | −1 (2) | +1 (8.5) | 0 (6.25) | 30.5 | 0 (5.5) | −1 (2.5) | +1 (6) | 0 (4) | 32.1 |
| 2 | 0 | 0 (3.5) | 0 (6.25) | 0 | 30.2 | 0 | 0 (5) | 0 (4) | 0 | 31.5 |
| 3 | −1 (1.5) | 0 | 0 | −1 (4) | 29.7 | +1 (8) | 0 | +1 | 0 | 28.3 |
| 4 | 0 | +1 (5) | 0 | +1 (8.5) | 30.4 | 0 | +1 (7.5) | −1 (2) | 0 | 32.3 |
| 5 | 0 | 0 | −1 (4) | −1 | 30.2 | +1 | −1 | 0 | 0 | 27.5 |
| 6 | 0 | 0 | +1 | −1 | 30.7 | −1 (3) | 0 | 0 | −1 (2) | 21.2 |
| 7 | 0 | −1 | 0 | +1 | 30.5 | +1 | +1 | 0 | 0 | 28.2 |
| 8 | 0 | 0 | 0 | 0 | 30.7 | −1 | +1 | 0 | 0 | 21.4 |
| 9 | +1 (5.5) | 0 | −1 | 0 | 31.2 | −1 | −1 | 0 | 0 | 21.6 |
| 10 | 0 | −1 | 0 | −1 | 30.5 | −1 | 0 | +1 | 0 | 22.2 |
| 11 | +1 | 0 | 0 | +1 | 31.2 | +1 | 0 | 0 | −1 | 27.9 |
| 12 | 0 | +1 | −1 | 0 | 30.1 | 0 | −1 | −1 | 0 | 32.6 |
| 13 | +1 | +1 | 0 | 0 | 31 | +1 | 0 | −1 | 0 | 27.7 |
| 14 | +1 | −1 | 0 | 0 | 31.3 | 0 | 0 | 0 | 0 | 31.5 |
| 15 | 0 | −1 | −1 | 0 | 30.5 | 0 | +1 | 0 | −1 | 32.6 |
| 16 | +1 | 0 | +1 | 0 | 31.2 | −1 | 0 | 0 | +1 (6) | 23.3 |
| 17 | 0 | 0 | +1 | +1 | 30.2 | 0 | −1 | 0 | −1 | 30.9 |
| 18 | 0 | 0 | 0 | 0 | 30.8 | −1 | 0 | −1 | 0 | 22.9 |
| 19 | 0 | +1 | +1 | 0 | 30.65 | 0 | 0 | 0 | 0 | 32.8 |
| 20 | +1 | 0 | 0 | −1 | 31.2 | 0 | 0 | 0 | 0 | 31.5 |
| 21 | −1 | 0 | −1 | 0 | 29.5 | 0 | 0 | 0 | 0 | 32.9 |
| 22 | 0 | 0 | −1 | +1 | 30.75 | 0 | 0 | +1 | +1 | 32.8 |
| 23 | −1 | 0 | 0 | +1 | 29.4 | 0 | 0 | −1 | −1 | 32.7 |
| 24 | 0 | 0 | 0 | 0 | 30.6 | 0 | 0 | −1 | +1 | 32.7 |
| 25 | −1 | −1 | 0 | 0 | 29.5 | 0 | −1 | 0 | +1 | 32.5 |
| 26 | −1 | +1 | 0 | 0 | 29.9 | 0 | +1 | 0 | +1 | 32.3 |
| 27 | −1 | 0 | +1 | 0 | 29.9 | +1 | 0 | 0 | +1 | 27.9 |
| 28 | 0 | 0 | 0 | 0 | 30.9 | 0 | 0 | +1 | −1 | 32.5 |
| 29 | 0 | +1 | 0 | −1 | 31 | 0 | +1 | +1 | 0 | 32.3 |
| Taproot | Stems | Root | ||||||||
| № | kn × 1010 (N·m−3) | kt × 109 (N·m−3) | σmax × 107 (Pa) | τmax × 107 (Pa) | Fmax (N) | kn × 109 (N·m−3) | kt × 109 (N·m−3) | σmax × 108 (Pa) | τmax × 108 (Pa) | Fmax (N) |
| 1 | 0 (1.325) | +1 (5) | 0 (3.5) | −1 (2.5) | 25.7 | 0 (1.9) | 0 (1.9) | −1 (2) | −1 | 70.4 |
| 2 | −1 (0.15) | 0 (3) | −1 (2) | 0 (3.75) | 22.425 | +1 (3) | 0 | 0 (3.75) | −1 (2) | 73.5 |
| 3 | 0 | +1 | +1 (5) | 0 | 26.8 | 0 | −1 (0.8) | +1 (5.5) | 0 | 71 |
| 4 | 0 | +1 | 0 | +1 (5) | 27.8 | −1 (0.8) | 0 | 0 | −1 | 59.5 |
| 5 | 0 | −1 (1) | +1 | 0 | 23 | 0 | +1 (3) | 0 | −1 | 69.9 |
| 6 | −1 | 0 | 0 | −1 | 21.5 | −1 | +1 | 0 | 0 | 59.4 |
| 7 | 0 | +1 | −1 | 0 | 25.7 | +1 | −1 | 0 | 0 | 74.2 |
| 8 | 0 | −1 | −1 | 0 | 26.3 | −1 | 0 | −1 | 0 | 59.5 |
| 9 | −1 | −1 | 0 | 0 | 20.8 | 0 | 0 | 0 | 0 | 70.4 |
| 10 | 0 | 0 | 0 | 0 | 26.6 | 0 | 0 | 0 | 0 | 68.65 |
| 11 | −1 | +1 | 0 | 0 | 25.9 | 0 | 0 | +1 | +1 | 70.4 |
| 12 | +1 (2.5) | +1 | 0 | 0 | 24.9 | 0 | −1 | −1 | 0 | 71 |
| 13 | 0 | 0 | 0 | 0 | 26.6 | +1 | 0 | −1 | 0 | 73.5 |
| 14 | 0 | 0 | 0 | 0 | 27 | +1 | 0 | +1 | 0 | 73.5 |
| 15 | 0 | 0 | 0 | 0 | 27.8 | +1 | 0 | 0 | +1 | 73.5 |
| 16 | +1 | 0 | 0 | +1 | 26.7 | 0 | 0 | 0 | 0 | 67.9 |
| 17 | +1 | 0 | 0 | −1 | 27.7 | 0 | +1 | 0 | +1 | 69.9 |
| 18 | −1 | 0 | 0 | +1 | 24.8 | 0 | −1 | 0 | −1 | 71 |
| 19 | 0 | 0 | −1 | −1 | 26.6 | −1 | 0 | 0 | +1 | 59.5 |
| 20 | 0 | −1 | 0 | −1 | 27.3 | 0 | +1 | −1 | 0 | 69.9 |
| 21 | −1 | 0 | +1 | 0 | 21.93 | 0 | 0 | 0 | 0 | 70.4 |
| 22 | 0 | 0 | 0 | 0 | 26 | 0 | 0 | −1 | +1 | 70.4 |
| 23 | +1 | −1 | 0 | 0 | 27.6 | 0 | +1 | +1 | 0 | 69.9 |
| 24 | 0 | 0 | −1 | +1 | 24 | 0 | 0 | 0 | 0 | 70.4 |
| 25 | +1 | 0 | −1 | 0 | 26.7 | 0 | −1 | 0 | +1 | 71 |
| 26 | +1 | 0 | +1 | 0 | 27.3 | −1 | 0 | +1 | 0 | 59.5 |
| 27 | 0 | −1 | 0 | +1 | 23.4 | −1 | −1 | 0 | 0 | 62.3 |
| 28 | 0 | 0 | +1 | +1 | 27.5 | 0 | 0 | +1 | −1 | 70.4 |
| 29 | 0 | 0 | +1 | −1 | 24.6 | +1 | +1 | 0 | 0 | 73.2 |
Appendix B

Figure A1.
Gaussian curve fitting.
Figure A1.
Gaussian curve fitting.

References
- Zhong, G.; Nicolosi, E. Citrus Origin, Diffusion, and Economic Importance. In The Citrus Genome; Gentile, A., La Malfa, S., Deng, Z., Eds.; Springer International Publishing: Cham, Switzerland, 2020; pp. 5–21. ISBN 978-3-030-15308-3. [Google Scholar]
- Gentile, A.; La Malfa, S.; Deng, Z. (Eds.) The Citrus Genome; Compendium of Plant Genomes; Springer International Publishing: Cham, Switzerland, 2020; ISBN 978-3-030-10799-4. [Google Scholar]
- Mukhametzyanov, R.R.; Brusenko, S.V.; Khezhev, A.M.; Kelemetov, E.M.; Kirillova, S.S. Changing the Global Production and Trade of Citrus Fruits. In Sustainable Development of the Agrarian Economy Based on Digital Technologies and Smart Innovations; Popkova, E.G., Bogoviz, A.V., Sergi, B.S., Kaurova, O.V., Maloletko, A.N., Eds.; Springer Nature: Cham, Switzerland, 2024; pp. 19–24. ISBN 978-3-031-51272-8. [Google Scholar]
- Kumar, S.; Kumari, S.; Rana, S.S.; Rana, R.S.; Anwar, T.; Qureshi, H.; Saleh, M.A.; Alamer, K.H.; Attia, H.; Ercisli, S.; et al. Weed Management Challenges in Modern Agriculture: The Role of Environmental Factors and Fertilization Strategies. Crop Prot. 2024, 185, 106903. [Google Scholar] [CrossRef]
- Silwana, S.; Mulidzi, A.R.; Jovanovic, N. Evaluating the Effects and Benefits of Cover Crops in Citrus Orchards: A Review. S. Afr. J. Plant Soil 2023, 40, 117–126. [Google Scholar] [CrossRef]
- Dong, N.; Hu, G.; Zhang, Y.; Qi, J.; Chen, Y.; Hao, Y. Effects of Green-Manure and Tillage Management on Soil Microbial Community Composition, Nutrients and Tree Growth in a Walnut Orchard. Sci. Rep. 2021, 11, 16882. [Google Scholar] [CrossRef]
- Li, H.; Wang, X.; Li, Y.; Hou, Y.; Zhao, Z.; Meng, L.; Liu, J.; Wang, J.; Xiong, B.; Wang, Z. Cover Crops Control Weed and Improve Soil Qualities in Citrus Orchard. J. Soil Sci. Plant Nutr. 2023, 23, 6827–6837. [Google Scholar] [CrossRef]
- Liu, R.; Zhang, Y.; Wang, Z.; Zhang, X.; Xu, W.; Zhang, J.; Zhang, Y.; Hu, B.; Shi, X.; Rennenberg, H. Groundcover Improves Nutrition and Growth of Citrus Trees and Reduces Water Runoff, Soil Erosion and Nutrient Loss on Sloping Farmland. Front. Plant Sci. 2024, 15, 1489693. [Google Scholar] [CrossRef] [PubMed]
- Zhao, N.; Wang, X.; Ma, J.; Li, X.; Cao, J.; Zhou, J.; Wu, L.; Zhao, P.; Cao, W. Co-Incorporating Green Manure and Crop Straw Increases Crop Productivity and Improves Soil Quality with Low Greenhouse-Gas Emissions in a Crop Rotation. Crop J. 2024, 12, 1233–1241. [Google Scholar] [CrossRef]
- Wofuru-Nyenke, O.K. Mechanized Cover Crop Farming: Modern Methods, Equipment and Technologies. Circ. Agric. Syst. 2023, 3, 6. [Google Scholar] [CrossRef]
- Ma, X.; Li, F.; Chen, Y.; Chang, Y.; Lian, X.; Li, Y.; Ye, L.; Yin, T.; Lu, X. Effects of Fertilization Approaches on Plant Development and Fertilizer Use of Citrus. Plants 2022, 11, 2547. [Google Scholar] [CrossRef]
- Barbosa, L.A.P. Modelling the Aggregate Structure of a Bulk Soil to Quantify Fragmentation Properties and Energy Demand of Soil Tillage Tools in the Formation of Seedbeds. Biosyst. Eng. 2020, 197, 203–215. [Google Scholar] [CrossRef]
- Zhang, X.; Yu, S.; Hu, X.; Zhang, L. Study on Rotary Tillage Cutting Simulations and Energy Consumption Predictions of Sandy Ground Soil in a Xinjiang Cotton Field. Comput. Electron. Agric. 2024, 217, 108646. [Google Scholar] [CrossRef]
- Coetzee, C.J. Review: Calibration of the Discrete Element Method. Powder Technol. 2017, 310, 104–142. [Google Scholar] [CrossRef]
- Horabik, J.; Molenda, M. Parameters and Contact Models for DEM Simulations of Agricultural Granular Materials: A Review. Biosyst. Eng. 2016, 147, 206–225. [Google Scholar] [CrossRef]
- Shi, Y.; Jiang, Y.; Wang, X.; Thuy, N.T.D.; Yu, H. A Mechanical Model of Single Wheat Straw with Failure Characteristics Based on Discrete Element Method. Biosyst. Eng. 2023, 230, 1–15. [Google Scholar] [CrossRef]
- Xie, D.; He, J.; Liu, T.; Liu, C.; Zhao, G.; Chen, L. Establishment and Validation the DEM-MBD Coupling Model of Flexible Straw-Shajiang Black Soil-Walking Mechanism Interactions. Comput. Electron. Agric. 2024, 224, 109203. [Google Scholar] [CrossRef]
- Dai, Q.; Zuo, Z.; Zheng, Q.; Fu, Y.; Zhang, S.; Mao, H. Optimization and Experimental Study of a Soil Loosening and Root Lifting Device for Shanghai Green (Brassica rapa Subsp. Chinensis) Harvesting Based on an EDEM-RecurDyn Simulation. Agriculture 2025, 15, 1865. [Google Scholar] [CrossRef]
- Zhang, Q.; Zhao, J.; Yang, X.; Wang, L.; Su, G.; Liu, X.; Shan, C.; Rahim, O.; Yang, B.; Liao, J. Design and Testing of an Offset Straw-Returning Machine for Green Manures in Orchards. Agriculture 2024, 14, 1932. [Google Scholar] [CrossRef]
- Shen, S.; He, Y.; Tang, Z.; Dai, Y.; Wang, Y.; Ma, J. Development of an Orchard Mowing and Sweeping Device Based on an ADAMS–EDEM Simulation. Agriculture 2023, 13, 2276. [Google Scholar] [CrossRef]
- Chen, P.; Su, J.; Xu, J.; Liu, M. Design and Experiment of Hilly Orchard Vertical Spiral Ditching-fertilizing Machine. Trans. Chin. Soc. Agric. Mach. 2024, 55, 223–233, 274. [Google Scholar]
- Zhang, S.; Zhao, H.; Wang, X.; Dong, J.; Zhao, P.; Yang, F.; Chen, X.; Liu, F.; Huang, Y. Discrete Element Modeling and Shear Properties of the Maize Stubble-Soil Complex. Comput. Electron. Agric. 2023, 204, 107519. [Google Scholar] [CrossRef]
- Liang, R.; Chen, X.; Zhang, B.; Wang, X.; Kan, Z.; Meng, H. Calibration and Test of the Contact Parameters for Chopped Cotton Stems Based on Discrete Element Method. Int. J. Agric. Biol. Eng. 2022, 15, 1–8. [Google Scholar] [CrossRef]
- Ucgul, M.; Fielke, J.M.; Saunders, C. 3D DEM Tillage Simulation: Validation of a Hysteretic Spring (Plastic) Contact Model for a Sweep Tool Operating in a Cohesionless Soil. Soil Tillage Res. 2014, 144, 220–227. [Google Scholar] [CrossRef]
- Xu, Y.; Wang, C.; Zhu, J.; Guo, F.; Tang, H.; Wang, J. Research on the Method of Establishing a Discrete Element Model of Mature Natural Bending Flexible Rice Plants Based on DEM. Powder Technol. 2025, 466, 121412. [Google Scholar] [CrossRef]
- Zhang, J.; Li, C.; Niu, Q.; Wang, P.; Wang, L.; Li, H. Characterization of Green Peppers Based on Dynamic Repose Angle. LWT 2023, 180, 114703. [Google Scholar] [CrossRef]
- Aikins, K.A.; Ucgul, M.; Barr, J.B.; Jensen, T.A.; Antille, D.L.; Desbiolles, J.M.A. Determination of Discrete Element Model Parameters for a Cohesive Soil and Validation through Narrow Point Opener Performance Analysis. Soil Tillage Res. 2021, 213, 105123. [Google Scholar] [CrossRef]
- Chen, G.; Wang, Q.; Li, H.; He, J.; Wang, X.; Zhang, X.; He, D. Experimental Research on Vertical Straw Cleaning and Soil Tillage Device Based on Soil-Straw Composite Model. Comput. Electron. Agric. 2024, 216, 108510. [Google Scholar] [CrossRef]
- Ucgul, M.; Fielke, J.M.; Saunders, C. Three-Dimensional Discrete Element Modelling (DEM) of Tillage: Accounting for Soil Cohesion and Adhesion. Biosyst. Eng. 2015, 129, 298–306. [Google Scholar] [CrossRef]
- Fang, M.; Yu, Z.; Zhang, W.; Cao, J.; Liu, W. Friction Coefficient Calibration of Corn Stalk Particle Mixtures Using Plackett-Burman Design and Response Surface Methodology. Powder Technol. 2022, 396, 731–742. [Google Scholar] [CrossRef]
- Zhao, W.; Chen, M.; Xie, J.; Cao, S.; Wu, A.; Wang, Z. Discrete Element Modeling and Physical Experiment Research on the Biomechanical Properties of Cotton Stalk. Comput. Electron. Agric. 2023, 204, 107502. [Google Scholar] [CrossRef]
- Yue, Y.; Xing, R.; Baikeli, Y.; Xu, H.; Ma, W.; Guo, L. Systematic Calibration and Validation of Discrete Element Model Parameters for Cotton Root Systems. Agriculture 2025, 15, 1827. [Google Scholar] [CrossRef]
- Adajar, J.B.; Alfaro, M.; Chen, Y.; Zeng, Z. Calibration of Discrete Element Parameters of Crop Residues and Their Interfaces with Soil. Comput. Electron. Agric. 2021, 188, 106349. [Google Scholar] [CrossRef]
- Tang, Z.; Gong, H.; Wu, S.; Zeng, Z.; Wang, Z.; Zhou, Y.; Fu, D.; Liu, C.; Cai, Y.; Qi, L. Modelling of Paddy Soil Using the CFD-DEM Coupling Method. Soil Tillage Res. 2023, 226, 105591. [Google Scholar] [CrossRef]
- Barr, J.; Desbiolles, J.; Ucgul, M.; Fielke, J.M. Bentleg Furrow Opener Performance Analysis Using the Discrete Element Method. Biosyst. Eng. 2020, 189, 99–115. [Google Scholar] [CrossRef]
- Wang, J.; Xu, Y.; Wang, C.; Xiang, Y.; Tang, H. Design and Simulation of a Trenching Device for Rice Straw Burial and Trenching Based on MBD-DEM. Comput. Electron. Agric. 2023, 207, 107722. [Google Scholar] [CrossRef]
- Wang, X.; Zhong, X.; Geng, Y.; Wei, Z.; Hu, H.; Geng, D.; Zhang, X. Construction and parameter calibration of the nonlinear elastoplastic discrete element model for no-tillage soil compaction. Trans. Chin. Soc. Agric. Eng. 2021, 37, 100–107. [Google Scholar]
- Huang, Y.; Gao, P.; Zhang, Q.; Shen, H.; Zhu, R.; Shi, J. Design and Experiment of Grass—Soil Separation Device with Combination of Stubble Cutting and Grass Guiding Used for No-till Planter. Trans. Chin. Soc. Agric. Mach. 2020, 51, 67–78. [Google Scholar]
- Takabatake, K.; Mori, Y.; Khinast, J.G.; Sakai, M. Numerical Investigation of a Coarse-Grain Discrete Element Method in Solid Mixing in a Spouted Bed. Chem. Eng. J. 2018, 346, 416–426. [Google Scholar] [CrossRef]
- Bai, H.; Li, R.; Wang, W.; Xie, K.; Wang, X. Investigation on Parameter Calibration Method and Mechanical Properties of Root-Reinforced Soil by DEM. Math. Probl. Eng. 2021, 2021, 6623489. [Google Scholar] [CrossRef]
- Xiang, W.; Wu, M.; Lü, J.; Quan, W.; Ma, L.; Liu, J. Calibration of simulation physical parameters of clay loam based on soil accumulation test. Trans. Chin. Soc. Agric. Eng. 2019, 35, 116–123. [Google Scholar] [CrossRef]
- Tekeste, M.Z.; Balvanz, L.R.; Hatfield, J.L.; Ghorbani, S. Discrete Element Modeling of Cultivator Sweep-to-Soil Interaction: Worn and Hardened Edges Effects on Soil-Tool Forces and Soil Flow. J. Terramech. 2019, 82, 1–11. [Google Scholar] [CrossRef]
- Zeng, B.; Li, M.; Yao, L.; Zhao, S.; Chen, X.; Wang, Y.; Liu, F.; Xie, S. Simulation and experiment on the mechanical properties of Coptis chinensis root-soil composites based on image reconstruction. Trans. Chin. Soc. Agric. Eng. 2023, 39, 75–84. [Google Scholar]
- Kim, W.-S.; Kim, Y.-J.; Park, S.-U.; Kim, Y.-S. Influence of Soil Moisture Content on the Traction Performance of a 78-kW Agricultural Tractor during Plow Tillage. Soil Tillage Res. 2021, 207, 104851. [Google Scholar] [CrossRef]
- Cao, L.; Ma, C.; Jiao, H.; Ma, W.; Wang, L.; Li, C. Construction and Testing of an Empirical Model for Calculating the Tumbled Range of Dry Prickly Ash Particles on the Separation Belt. Comput. Electron. Agric. 2024, 218, 108711. [Google Scholar] [CrossRef]
- Vannoppen, W.; De Baets, S.; Keeble, J.; Dong, Y.; Poesen, J. How Do Root and Soil Characteristics Affect the Erosion-Reducing Potential of Plant Species? Ecol. Eng. 2017, 109, 186–195. [Google Scholar] [CrossRef]
- Zhang, P.; Wang, Y.; Sheng, D.; Zhang, S.; Gu, S.; Yan, Y.; Zhao, F.; Wang, P.; Huang, S. Optimizing Root System Architecture to Improve Root Anchorage Strength and Nitrogen Absorption Capacity under High Plant Density in Maize. Field Crops Res. 2023, 303, 109109. [Google Scholar] [CrossRef]
- China Soil Science Data Center. Available online: http://vdb3.soil.csdb.cn/extend/jsp/eng (accessed on 22 May 2024).
- Johnson, K.L.; Kendall, K.; Roberts, A. Surface Energy and the Contact of Elastic Solids. Proc. R. Soc. A Math. Phys. Sci. 1971, 324, 301–313. [Google Scholar]
- Xia, R.; Li, B.; Wang, X.; Li, T.; Yang, Z. Measurement and Calibration of the Discrete Element Parameters of Wet Bulk Coal. Measurement 2019, 142, 84–95. [Google Scholar] [CrossRef]
- Zhang, Z.; Mei, F.; Xiao, P.; Zhao, W.; Zhu, X. Discrete Element Modelling and Simulation Parameters Calibration for the Compacted Straw Cube. Biosyst. Eng. 2023, 230, 301–312. [Google Scholar] [CrossRef]
- Weerasekara, N.S.; Powell, M.S.; Cleary, P.W.; Tavares, L.M.; Evertsson, M.; Morrison, R.D.; Quist, J.; Carvalho, R.M. The Contribution of DEM to the Science of Comminution. Powder Technol. 2013, 248, 3–24. [Google Scholar] [CrossRef]
- Синеoкoв, Г.Н.; Панoв, И.М. Теoрия и Расчеты Пoчвooбрабатывающих Машин; Машинoстрoительная пресса: Moscow, Russia, 1977; ISBN 978-7-111-05481-8. [Google Scholar]
- Jia, F.; Han, Y.; Liu, Y.; Cao, Y.; Shi, Y.; Yao, L.; Wang, H. Simulation prediction method of repose angle for rice particle materials. Trans. Chin. Soc. Agric. Eng. 2014, 30, 254–260. [Google Scholar]
- Luo, S.; Yuan, Q.; Shaban, G.; Yang, L. Parameters Calibration of Vermicomposting Nursery Substrate with Discrete Element Method Based on JKR Contact Model. Trans. Chin. Soc. Agric. Mach. 2018, 49, 343–350. [Google Scholar]
- Zhao, C.; Jiang, L.; Lu, X.; Xiao, X. Analysis of Wet Soil Granular Flow down Inclined Chutes Using Discrete Element Method. Water 2019, 11, 2399. [Google Scholar] [CrossRef]
- JB/T 9014.9-1999; Continuous Handling Equipment—Loose Bulk Material—Determination of Friction Coefficient of Material Sliding on Trough. State Machinery Industry Bureau: Beijing, China, 1999.
- Wang, Y.; Zhang, Y.; Yang, Y.; Zhao, H.; Yang, C.; He, Y.; Wang, K.; Liu, D.; Xu, H. Discrete Element Modelling of Citrus Fruit Stalks and Its Verification. Biosyst. Eng. 2020, 200, 400–414. [Google Scholar] [CrossRef]
- Dung, T.V.; Ngoc, N.P.; Dang, L.V.; Hung, N.N. Impact of Cover Crop and Mulching on Soil Physical Properties and Soil Nutrients in a Citrus Orchard. PeerJ 2022, 10, e14170. [Google Scholar] [CrossRef] [PubMed]
- Meng, Y.; Wei, J.; Wei, J.; Chen, H.; Cui, Y. An ANSYS/LS-DYNA Simulation and Experimental Study of Circular Saw Blade Cutting System of Mulberry Cutting Machine. Comput. Electron. Agric. 2019, 157, 38–48. [Google Scholar] [CrossRef]
- Murgia, I.; Giadrossich, F.; Mao, Z.; Cohen, D.; Capra, G.F.; Schwarz, M. Modeling Shallow Landslides and Root Reinforcement: A Review. Ecol. Eng. 2022, 181, 106671. [Google Scholar] [CrossRef]
- Wang, G.; Zhou, T.; Wei, J. Experimental Study on Shear Performance of Herb Root-Soil Complex in Purple Soil and Yellow Soil. Soil Water Conserv. China 2019, 34–37+69. [Google Scholar] [CrossRef]
- Wei, J.; Li, J.; Shi, B. Shear Strength Features of Two Typical Root-soil Composites from Soil Bunds on Purple Farmlands. J. Basic Sci. Eng. 2018, 26, 483–492. [Google Scholar] [CrossRef]
- GB/T 50123-2019; Standard for Geotechnical Testing Method. Ministry of Housing and Urban–Rural Development of the People’s Republic of China, General Administration of Quality Supervision, Inspection and Quarantine of the People’s Republic of China: Beijing, China, 2019.
- Ma, J.; Zhang, S.; She, F.; Zhao, X.; Ma, B.; Li, H.; Wang, C.; Shang, Y.; Li, Z. Influence of the Vegetation Restoration Age on the Soil Detachment of Root–Soil Composites on the Loess Plateau of China. Eur. J. Soil Sci. 2024, 75, e70011. [Google Scholar] [CrossRef]
- Zhu, J.; Leung, A.K.; Knappett, J.A.; Zhang, X.; Wang, Y. A New Root–Soil Interface Contact Model to Simulate the Overturning Behaviour of Root System Architectures. Acta Geotech. 2025, 20, 1969–1989. [Google Scholar] [CrossRef]
- Wang, C.; Liu, J.; Xing, H.; Yao, X.; Wang, L.; Niu, G. Friction Properties of Interface between Soil-Roots and Soil-Soil of Artemisia Sphaerocephala and Sabina Valgaris. In Proceedings of the 2010 4th International Conference on Bioinformatics and Biomedical Engineering, Chengdu, China, 18–20 June 2010; pp. 1–5. [Google Scholar]
- Ma, S.; Yao, Y.; Bao, P.; Guo, C. Effects of Moisture Content on Strength and Compression Properties of Foundation Soils of Cultural Relics in Areas Flooded by the Yellow River. Front. Mater. 2023, 10, 1186750. [Google Scholar] [CrossRef]
- Li, Y.-H.; Lv, M.-F.; Guo, Y.-C.; Huang, M.-S. Effects of the Soil Water Content and Relative Roughness on the Shear Strength of Silt and Steel Plate Interface. Measurement 2021, 174, 109003. [Google Scholar] [CrossRef]
- Wei, Y.; Liu, Y.; Liu, X.; Chen, Y.; Yan, Z.; Du, Y. Study on shear strength of root-soil composite of Dolichos lablab and Medicago sativa in purple soil region. Acta Pratacult. Sin. 2023, 32, 82–90. [Google Scholar]
- Wang, R.; Qin, C.; Sun, H.; Feng, Y. Effects of Root Morphologies on Shearing Characteristics of the Root-Soil Composite: An Experimental Case Study of Ficus virens in Chongqing, China. Catena 2024, 246, 108407. [Google Scholar] [CrossRef]
- Tang, H.; Chen, Y.; Liu, X.; He, B.; Li, Y.; Qiang, J.; Li, T. Study on the mechanic features of root and root-soil matrix of Dolichos lablab L. hedgerows on the slopes of the karst area. Acta Ecol. Sin. 2019, 39, 6114–6125. [Google Scholar] [CrossRef]
- Zhang, S.; Ma, J.; Liu, S.; Zhang, L.; Li, Z.; She, F.; Ding, J.; Li, P.; Tian, C. Effects of Herbaceous Plant Roots on Tensile Strength of Root-Soil Composite in Loess Hilly Region. Catena 2025, 260, 109423. [Google Scholar] [CrossRef]
- Forster, M.; Ugarte, C.; Lamandé, M.; Faucon, M.-P. Root Traits of Crop Species Contributing to Soil Shear Strength. Geoderma 2022, 409, 115642. [Google Scholar] [CrossRef]
- Xiaohong, L. The Effects of Terrace Hedgerows Roots on the Erodibility of the Root-Soil Complex in the Purple Soil Area. Master’s Thesis, Southwest University, Chongqing, China, 2022. [Google Scholar]
- Ji, C.; Xie, W.; Yang, Q.; Qu, C.; Fan, P.; Wu, Z.; Yuan, K. Microstructural Mechanisms Influencing Soil-Interface Shear Strength: A Case Study on Loess and Concrete Plate Contact. Buildings 2025, 15, 3512. [Google Scholar] [CrossRef]
- Zeng, X.; Li, Y.; Liu, X.; Yao, J.; Lin, Z. Relationship between the Shear Strength and the Depth of Cone Penetration in Fall Cone Tests. Adv. Civ. Eng. 2020, 2020, 8850430. [Google Scholar] [CrossRef]
- Zhao, J.; Yu, J.; Sun, K.; Wang, Y.; Liang, L.; Sun, Y.; Zhou, L.; Yu, Y. A Discrete Element Method Model and Experimental Verification for Wheat Root Systems. Biosyst. Eng. 2024, 244, 146–165. [Google Scholar] [CrossRef]
- Tamás, K.; Bernon, L. Role of Particle Shape and Plant Roots in the Discrete Element Model of Soil–Sweep Interaction. Biosyst. Eng. 2021, 211, 77–96. [Google Scholar] [CrossRef]
- Liu, J.; Tang, Y.; Jiang, Y.; Luo, S.; Wu, K.; Peng, X.; Pan, Y. Experimental Study on the Effect of Root Content on the Shear Strength of Root–Soil Composite with Thick and Fine Roots of Cryptomeria japonica (Thunb. Ex L.f.) D.Don. Forests 2024, 15, 1306. [Google Scholar] [CrossRef]


Disclaimer/Publisher’s Note: The statements, opinions and data contained in all publications are solely those of the individual author(s) and contributor(s) and not of MDPI and/or the editor(s). MDPI and/or the editor(s) disclaim responsibility for any injury to people or property resulting from any ideas, methods, instructions or products referred to in the content. |
© 2025 by the authors. Licensee MDPI, Basel, Switzerland. This article is an open access article distributed under the terms and conditions of the Creative Commons Attribution (CC BY) license (https://creativecommons.org/licenses/by/4.0/).