Abstract
Considering the current prediction from the Food and Agriculture Organization, food production needs an increase of over 70 percent by 2050, and the agriculture sector requires a boost that is also obtained by integrating novelty technologies and methods of the artificial intelligence (AI) field. This study investigates the innovation lifecycle of AI-driven agriculture through a causal inference analysis within the university–industry–research (UIR) collaboration framework. Using time series data from 1985 to 2023, collected from Web of Science (academic articles), CORDIS (research projects), WIPO (patents), and Crunchbase (start-ups), the study explores the causal dynamics among four key innovation pillars. Results from Granger causality and impulse-response analyses reveal a sequential innovation pathway in which start-up activity precedes research projects, followed by academic publications and patent filings. These findings highlight the interdependence of innovation stages and the evolving role of UIR collaboration in driving agricultural transformation. The study provides quantitative insights for policymakers, investors, and researchers to strategically foster innovation ecosystems in AI-driven agriculture.
1. Introduction
The collaboration between universities and industry manifests in multiple directions, including research services, training in education, and curiosity-led research, as Gallagher et al. investigated in [1]. This collaboration is also present in the intersection of two major domains of worldwide interest in innovation and evolution, namely artificial intelligence and agriculture. As agriculture is the key component of economy, it also plays an important role in Sustainable Development Goals defined in [2] as Zero Hunger, Sustainable Consumption and Production, Life and Land, Clean Water, and Sanitation Objectives. Handling a wide variety of challenges such as the increase in human beings, the new trends in competitive markets, climate change and sustainability, traditional farming needed a twist in perspective, leading to the smart farming context, thus transforming traditional practices in order to increase the productivity, quality, nutrition, and security of crops, while reducing the impact on the environment, as pointed out in [3].
In this paper, the term university–industry–research (UIR) collaboration designates the synergistic cooperation among universities, research institutes, and industry actors for the co-creation and transfer of knowledge, technology, and innovation outcomes, particularly within the framework of AI-driven agricultural development.
This work explores the innovation lifecycle of AI-driven agriculture, understood here as the temporal progression of innovation activities across the research, development, protection, and commercialization stages of the university–industry–research ecosystem. Innovation is seen at the intersection of industries, universities, and research, as the work [4] also focused on the impact of innovation efficiency when it comes to industry–university–research cooperation. The study was performed in China between 2009 and 2015, having as main objective to determine the cause of the GDP decrease in 2010. They concluded with the affirmation that there is not a deep enough degree of cooperation between the industries and universities, mainly because of the fact that university research does not match the requirements of industries. The research also pointed out that the government funding for innovation does not positively affect innovation efficiency.
The core innovation subjects, also seen from the perspective of [5], is given by enterprises, universities, and scientific research institutions, playing different roles in innovation activities. The research [5] debates the fact that it is narrow to focus only on the innovation within enterprises from the production level and overlook the basics of innovation. Also, Refs. [6,7] pointed out that it is crucial to examine how each subject’s impact, relationship, and contribution affect the gap between the supply and demand side of production, education, and research resources. But, when it comes to food and agriculture production industry, Refs. [8,9] formed the conclusions that it is seen more as a lagging sector, not the focal point of innovation policies. A similar vision is also highlighted in [10], pointing out that innovative technologies developed in different fields of science may bring interesting contributions to the sector of agriculture. The agriculture industry is seen in the traditional literature as a limited field of innovation-generating forces, and innovation is more likely to appear as a result from the knowledge transfer of other sectors [11,12].
Current gaps in research and policy call for the need for an in-depth study of the particular domain of agriculture impacted by artificial intelligence technologies [13]. This study investigates the sub-domains of agriculture even deeper, along with AI technologies, focusing on innovation at the intersection of university, industry, and research perspectives. The innovation impact is computed as a result of inference causality on time series data collected from several databases that store outputs of the four analyzed pillars: written academic work in scientific journals, projects as an intersection between universities along with companies, patents filled by companies or as individuals within universities, and also established start-ups. Another perspective was presented in [14], a meta-analytical study of literature written in the field of agriculture, pointing out the exponential increase in interest in the field after 2011. The scope of the research was formed around the innovation purpose and type of innovation in agriculture. Nowadays, artificial intelligence is similar to the term of innovation, as the study in [15] also emphasizes, with multiple studies being conducted on this major correlation between artificial intelligence and its implementation in particular industries. Even though there is a massive interest in AI, in general, along with its impact in multiple industries, the literature lacks research focused on this proposed intersection of AI and agriculture along with the implications given by the innovation perspective transposed in the four major pillars. The scope of this study is not to determine the impact of AI in agriculture, but to characterize the evolution of a particular segment of agriculture, that in which AI was integrated.
1.1. Objective and Research Questions
In this paper, we incorporate the overall concept of innovation cycle seen from the university–industry–research collaboration perspective, leading to a framework used for integrating time series evaluation of the four initial pillars derived from the innovation cycle. This perspective is demonstrated upon narrowing the industry as a whole and focusing on the direction of innovation within the agriculture domain impacted by artificial intelligence technologies. For reaching the major objective of the paper, we have formulated a list of research questions that lead to the desired output.
Based on the theoretical framework, this study is guided by the following main research question:
RQ1.
Is there any sequential causality in the innovation lifecycle of AI in agriculture?
To operationalize this overarching question, a set of specific sub-questions has been formulated, as summarized:
RQ2.
Does a shift in academic research activity drive subsequent changes in the number of projects developed?
RQ3.
Does the increase in research projects cause an increase in patents filing?
RQ4.
Does the increase in patent filing cause an increase in start-up formation?
RQ5.
Is the overall evolution of the research domain similar to the evolution of the six particular sub-directions defined by the proposed classification?
These sub-questions examine the causal relationships among the four pillars of innovation—academic research, projects, patents, and start-ups—within the university–industry–research collaboration framework.
In addition to the causal dimension, the study also addresses a methodological research question that supports the design of the empirical analysis:
RQzero.
What is the set of keywords defining the intersection between the domains of artificial intelligence and agriculture in academic research?
This question guides the construction of the datasets used in the subsequent causal analysis by ensuring the accurate identification of relevant literature, projects, patents, and start-ups across the four innovation pillars.
The research follows a structured approach to address the previously formulated research questions. The initial step involves defining a theoretical model of the innovation lifecycle, drawing from both scientific literature and business practices. As the research horizon is defined by the two main areas, namely agriculture and artificial intelligence, clear borders had to be set for both to be able to reduce any biases to a minimum and ensure comparable datasets across pillars. As a result, the scope has been narrowed down to the most significant keywords. Multiple simulations are made, and an objective function is desired to evaluate the relevance of the searching criteria. The research then progresses to refining the search query for optimal accuracy. Each key element will be incrementally added to test the results’ relevance to the researched field. In the absence of a method that can include absolutely all the values to fully satisfy the applicability of AI in agriculture, a classification of the extracted data was considered based on the most comprehensive search query, which is, however, limited. Besides the general direction of AI-driven agriculture evaluated within the four pillars of innovation, a more detailed investigation is also taken into consideration by a more granulated classification on six sub-domains of agriculture where artificial intelligence is present. Using statistical methods, a comparison is made between the overall trend of AI in agriculture and the trend of AI for each of the six sub-domains proposed. Therefore, the next step involves comparing the means of the resulting series to determine if there are significant differences. If no significant differences are found, it indicates that the choice of search query does not substantially affect the temporal evolution of the analyzed dimensions, making it unnecessary to refine the query for greater accuracy.
In the continuation of the study, we focused on defining the data structure by selecting the dimensions necessary for creating time series, particularly the temporal dimension and the measure under analysis. This resulted in a series of frequencies representing the number of articles, projects, patents, and start-ups that were extracted from four databases using a searching method that describes the intersection of the AI and agriculture domains. The resulting time series, corresponding to each stage of the innovation lifecycle, were smoothed and min max normalized to mitigate the cyclic effects caused by external events, or, in the case of projects, the ending of one program and the starting of another, as well as to make the series comparable. The next step involved determining the knee points, from which each series experiences a sudden change, to gain an initial understanding of the order of processes in the innovation cycle and whether it aligns with the formulated hypotheses. The second derivative approach was used to identify the points of maximum curvature. The knee point is where the curve changes from a gradual to a steep slope, indicating exponential growth.
To explore the causal relationships among the different stages of innovation, Granger causality analysis was employed. This method was used to determine whether one time series could predict another, indicating potential causal influences among the stages. The analysis was conducted for each pairwise combination of the four variables. For instance, we tested whether the number of articles Granger-causes the number of projects, and vice versa, to understand the directional influence between research publications and the initiation of new projects. Similarly, the relationship between patents and start-ups was examined to identify whether patent activity precedes the emergence of new start-ups, suggesting a causal link between intellectual property development and entrepreneurial ventures. Each Granger causality test was conducted using lagged values appropriate for the temporal dynamics of the data, ensuring that the tests accounted for potential time delays between the stages. Alternatively, cross-correlation analysis and other relevant tests have been used to understand the dynamic interactions between the stages.
1.2. Contribution and Research Paper Structure
The key findings of the current research can be summarized as follows:
- A methodology for automatically generating the most relevant search query for describing in an as narrow as possible method the intersection between AI and agriculture domains of research;
- The evaluation on time axis between the general domain of AI in agriculture and the specific sub-domains defined by the current classifier;
- A general evaluation of lifecycle innovation perspective for AI-driven agriculture;
- Proposal framework for future planning of investment for AI in agriculture increasing impact.
The research is structured as follows: Section 2 describes the main finding of the domain by conducting a literature review with the main topics of applications, methodologies and trends in the field of AI-driven agriculture. Section 3 introduces the methodology based on which the research is built upon, sequentially describing all the steps involved. In Section 4, we present the main results along with the discussions, while in Section 5, we finish the research, drawing the conclusions and taking further steps in future work to be added to this current research. Additional results along with all databases used for this study will be made available on request.
2. Literature Review
The intersection of artificial intelligence (AI) and agriculture has garnered significant research attention in recent years, reflecting the potential of AI to transform traditional farming practices. This review synthesizes findings from multiple studies to explore the applications, methodologies, and trends in this field.
2.1. Artificial Intelligence in Agriculture—Trends
Several studies have focused on systematic reviews to map the landscape of AI applications in agriculture. Ref. [16] provides a comprehensive analysis of AI methods utilized in agriculture, highlighting benefits and challenges associated with applications such as data collection using sensors, smart robots, and crop monitoring systems. Similarly, Ref. [17] examines 906 studies, narrowing the focus to 176 for bibliometric analysis, though it lacks detailed methodological justification for the chosen search terms. In the work of [18], a systematic literature review was conducted at the intersection of AI and IoT in the domain of agriculture, as the main components when it comes to precision agriculture.
The research [19] categorizes AI applications into 12 sub-domains, including harvesting, precision farming, pest and disease management, and agricultural robotics. This taxonomy provides a structured framework for understanding the breadth of AI’s role in agriculture. In parallel, Ref. [20] explores Agriculture 4.0, using digital repositories such as Web of Science and Scopus to identify emerging trends over the past decade.
Temporal trends in AI research are evident in studies such as [21], which notes a significant increase in interest around 2018. Using Scopus data from 2000 to 2021, this study reveals a growing focus on AI in agriculture. The paper [22] analyzes the Web of Things (WoT) domain, identifying trends and emphasizing solution proposals and experimental research. Although trends vary by year, 2016 stands out as an outlier for increased activity in this domain. Another perspective of analyzing the trends in AI-driven agriculture addresses the need for AI methods approach classification, such as the work [23], in which the authors reached the conclusions that 44% of the main AI technologies in agriculture are regarding robotics, 22% neural networks, while the rest, 34%, represent deep learning, fuzzy logics, SVM, k-nearest, random forest. AI algorithms and methods are split into specific sub-domains of agriculture in [24], such as soil management, water management, livestock management, and crop management. This classification is also an input of investigation in our current research when it comes to sub-domains of AI-driven agriculture.
The research [25] delves into the intersection of AI and geospatial analysis, noting an evolution toward machine learning and deep learning techniques, with agricultural robots and antennas emerging as prominent tools. Similarly, Ref. [26] investigates sustainability applications, employing PRISMA methodology to map trends over a 30-year period, highlighting a notable surge in publications post-2018.
The studies employ diverse methodologies, ranging from bibliometric analyses to systematic reviews. For example, Ref. [27] utilizes the Scopus database to identify 73 contributions focused on AI in agriculture, emphasizing applications such as precision farming, water optimization, and traceability systems. Ref. [28] adopts the PRISMA 2020 framework to examine factors influencing the adoption of AI in agriculture, livestock, and aquaculture, analyzing 38 studies, 55% of which are literature reviews.
In [29,30], some insights are provided into specific subfields. Ref. [29] explores soil management, pest and weed control, and water-use optimization, without detailing its query selection methodology. In contrast, Ref. [30] systematically reviews 25 years of research on the agricultural value chain, classifying 88 publications into empirical studies, case studies, and conceptual works.
Several studies focus on niche applications of AI in agriculture. Ref. [31] examines intelligent vertical agriculture, identifying machine learning models and algorithms used in studies from 2016 to 2022. This specialized focus aligns with broader trends in precision and smart farming. Additionally, Ref. [32] investigates AI’s role in the business aspects of agriculture, using a targeted search query to extract relevant contributions. Ref. [33] focuses on a literature review using “Industry 4.0” key-term for investigating artificial intelligence technologies in Industry 4.0. A similar perspective of investigation is performed within [34] for agricultural mapping, where a bibliographic data analysis and literature review establish the scientific contribution, collaboration, AI methods, and trends in the field of agriculture mapping.
While these studies offer valuable insights, several limitations are evident. For instance, Refs. [17,30] lack robust methodologies for validating their search queries, potentially introducing biases. Similarly, Ref. [26] acknowledges limitations in its keyword-based selection criteria, which may restrict the scope of its findings. Similar situations of limited query for the research query within PRISMA methodology are present in [35], where the selection was performed combining the keywords “Artificial intelligence” and “agri*”, leading to an unreliable initial set of elements to be analyzed.
The reviewed studies collectively highlight the transformative potential of AI in agriculture, encompassing diverse applications such as precision farming, sustainability, and geospatial analysis. However, methodological inconsistencies and limited query transparency in some studies underscore the need for standardized approaches. Although the use of AI models is solving a lot of the agriculture problems mentioned in the research [36], research in this topic is still in its initial stage. Future research should address these gaps while exploring emerging technologies and their implications for sustainable agricultural practices. While prior studies have explored the role of artificial intelligence in agriculture, most have focused on technological applications or efficiency assessments rather than the causal mechanisms linking research, projects, patents, and commercialization outcomes. Existing analyses of university–industry–research collaboration have also been largely descriptive, lacking a formal examination of dynamic interdependencies over time. This study addresses this gap by applying a causal inference framework—integrating Granger causality and impulse-response analysis—to identify the sequential relationships that characterize the innovation lifecycle of AI-driven agriculture.
2.2. Classification Techniques and Challenges in the Agriculture Field
Many researchers have used systematic reviews to explore how AI is applied in agriculture. For example, Refs. [37,38] offered a broad look at AI-based methods, discussing both the benefits and drawbacks of tools like sensors, smart robots, and crop monitoring systems. In a similar effort, Ref. [39] evaluated 906 studies and narrowed them down to 176 for a bibliometric analysis, but they provided limited details on how they chose their search terms. Ref. [40] grouped AI’s use in agriculture into 12 categories, such as harvesting, precision farming, pest and disease control, and robotics. This framework helps illustrate how widely AI can be used. Around the same time, Ref. [41] studied Agriculture 4.0 by gathering information from databases like Web of Science and Scopus to pinpoint new trends from the past decade. Temporal patterns in AI research also stand out; Ref. [42] noticed a spike in interest around 2018, based on Scopus data from 2000 to 2021. This reflects growing attention to AI applications in farming. Ref. [43] looked at how AI and geospatial analysis have grown to include machine learning and deep learning approaches, noting a surge in agricultural robots and antennas.
Different methods have been used to study AI in agriculture such as [38,43], which focused more on specific topics. Ref. [43] looked at soil management, pest and weed control, and water usage but did not fully explain their search strategy. Certain reviews targeted niche areas. Ref. [42] examined vertical farming from 2016 to 2022 and listed the machine learning methods used. Ref. [44] looked at how AI influences the business side of agriculture, using a narrower search approach. Despite the useful findings, there are some gaps. For instance, Refs. [45,46] do not fully explain how they tested their search terms, which might introduce bias.
Overall, these studies highlight AI’s transformative impact on agriculture, mentioning areas like precision farming, sustainability, and geospatial analysis. However, inconsistent methods and vague search term choices in some reviews indicate the need for more standardized approaches. Future work should address these issues and continue exploring new AI technologies for sustainable agricultural practices.
The literature shows a clear trajectory toward more intelligent, adaptive, and resource-efficient systems across domains. From pioneering zero-shot and generalized zero-shot techniques that expand recognition capabilities without exhaustive annotations, to agricultural innovations in marketing, quality control, robotics, machine learning applications, and digital twins, these advancements collectively underscore the transformative power of AI in addressing real-world challenges. As these methods continue to evolve, the convergence of zero-shot learning frameworks, robust model optimization, and agricultural domain adaptation promises a new era of innovation in both theoretical methodologies and practical applications.
3. Proposed Methodology
Starting from the innovation lifecycle steps defined by the existing literature, the present study focuses on the first four: academic world, projects started around innovation, possible patents resulting from the innovation and companies established around it. Table 1 describes the data sources used for each pillar, along with potential dimensions extracted.

Table 1.
Source of databases for each involved pillar.
Web of Science is used for extracting relevant data referring to scientific articles written in the topics of artificial intelligence in agriculture. By using advanced search criteria, the data extracted includes publication dates, citation counts, journal impact factors, and paper abstract, which are crucial for understanding the evolution and influence of scientific research in this domain. The robust indexing system of Web of Science ensures that only high-quality, peer-reviewed articles are included, providing a solid foundation for assessing academic progress and trends in AI applications in agriculture.
Cordis is added for gathering data across different calls and programs about projects written starting from the core of artificial intelligence in agriculture. Cordis is used to identify and analyze the progression and outcomes of projects that focus on AI in agriculture. This includes detailed project descriptions, funding amounts, project durations, consortium members, and final reports. The data from Cordis helps in understanding how EU policies and funding impact AI innovation cycles in the agricultural sector.
WIPO is the international database of patents used for extracting the number of patents filled with the main topic in AI-driven agriculture. By analyzing patent filings, one can gauge the technological advancements and the regions or entities that are leading in innovation. The database offers insights into the type of AI technologies being patented, the rate of patent filings over time, and the collaborative networks forming around these innovations.
CrunchBase is used for insight about companies that were formed under the main description of AI in agriculture. It provides information on company funding rounds, investor activities, mergers and acquisitions, and leadership changes. For this research, CrunchBase is used in tracking the emergence and growth of start-ups that are specifically categorized under AI applications in agriculture. This data helps in understanding market dynamics, investment trends, and the overall health and vibrancy of the entrepreneurial ecosystem in this field. Figure 1 summarizes the methodological steps undertaken to test the previously formulated hypotheses.
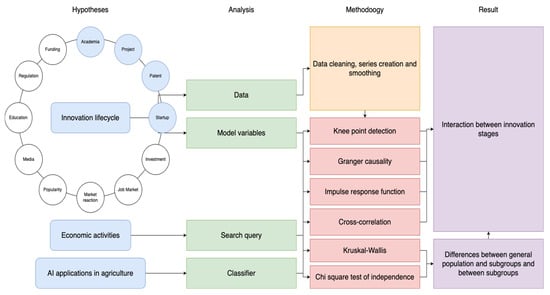
Figure 1.
Overview of the main methodological steps.
The focal starting point of the methodology is represented by the innovation lifecycle formed as a circular flow of the key stages in the development and adoption of innovation. The cycle proposed as a continuous, interconnected process implies the following actors:
- Academia—As the ground of knowledge foundation;
- Project—The starting of development of ideas and directions extracted from the previous step, the academia;
- Patent—The protection of the intellectual property derived from the projects;
- Start-up—The ideas patented and involved in new businesses;
- Investment—Rounds of investments in the start-ups;
- Job Market—Employment opportunities impacted by the new companies and investment appeared;
- Market Reaction—The response of consumers and industries to the innovation on the market;
- Popularity—The recognition of innovation within the market;
- Media—Press and digital platforms presenting information around the innovation;
- Education—The training process for preparing students to handle the innovation into practice;
- Regulation—Government policies and legal frameworks;
- Funding—Financial support such as grants for sustaining innovation, such as public or private investments.
The term “innovation lifecycle” refers to the sequential process through which knowledge is generated, mobilized, protected, and commercialized within an innovation ecosystem. This lifecycle encompasses four interdependent stages corresponding to the pillars analyzed in this research: (1) scientific knowledge production, represented by academic publications; (2) applied research and technology development, reflected in funded research projects; (3) protection of intellectual property through patenting; and (4) entrepreneurial implementation through start-up formation and market diffusion. Together, these stages depict the temporal progression of innovation activities that characterize the evolution of AI-driven agriculture. The circularity is established by the funding last stage that lays the foundation for new innovation needs. The current research evaluates the evolution and impact in causality measures for the first four pillars.
3.1. Search Query Formulation
As the research horizon is defined by the two main areas, namely agriculture and artificial intelligence, clear borders had to be set for both to be able to reduce any biases to a minimum and ensure comparable datasets across pillars. As a result, the scope has been narrowed down to the most significant keywords. Many studies have taken into consideration the analysis of the literature review in the domain of intersection between artificial intelligence and agriculture. To address our first research question, RQzero—“What is the set of keywords defining the intersection between the domains of AI and agriculture in research academic writing?”, building the search query has started using the Boolean operator “AND” between the set of strings representing both artificial intelligence and agriculture. For each field of interest, a proper methodology was used for narrowing the string enough so that the result does not contain any objects that are not part of the desired dataset. The first query consisting of all fields that contain exactly the words “artificial intelligence” and “agri*” or “agro*”, without the year 2024, has been tested on the Web of Science publications. The query has given 7499 results. The analysis covers the period 1985–2023, ensuring comparability across all four innovation pillars. This time span was selected to capture the full evolution of AI-related developments in agriculture, from early foundational research to recent start-up activity.
ALL = (artificial intelligence) AND (ALL = (agri*) OR ALL = (agro*))
For best describing the field of intersection between agriculture and artificial intelligence, the key-terms used for describing the AI part are given by the set C = {“artificial intelligence”, “machine learning”, “IoT”, “Robotics”, “Object Detection”}. The key defining words for artificial intelligence have been determined from the intersections of multiple research works that used the PRISMA methodology for conducting systematic literature reviews, such as [16,17,19,20,21,25]. Therefore, artificial intelligence, machine learning, IoT, and robotics have been highlighted as the factors that cover most of the information, reducing from the previous mentioned studies those terms that did not determine disjoint sets.
The construction of the search query involved an iterative procedure to identify the most representative agricultural terms associated with artificial intelligence. Agricultural terms were initially extracted from the NACE classification (Section A—agriculture, forestry, and fishing) and refined through semantic clustering using natural language processing techniques. Each candidate term was then evaluated using a relevance metric that quantifies its contribution to the intersection between the AI and agriculture domains. Terms exceeding the inclusion threshold (relevance ≥ 0.9) were retained in the final query.
A detailed description of this procedure—including the clustering parameters, mathematical formulation of the relevance metric, and illustrative examples—is provided in Appendix A. The final query obtained is TS = ((“artificial intelligence” OR “machine learning” OR “IoT” OR “Robotics” OR “Object Detection”) AND (agri* OR farm* OR crop OR “AgTech” OR animal OR land)).
The obtained query is run for each pillar, with Table 2 containing the results and specific selection method depending on the database used. For companies’ pillar, the industries declared by the company should be found both in agriculture and artificial intelligence sets. For Patents’ pillar, the selection method is similar to Web of Science query, where the search is performed upon the front page of the patent. In the case of Projects’ pillar, using Cordis database, the Excels for all the calls that are referred in this research, FP1–FP7, Horizon Europe, Horizon 2020, were concatenated based on the common fields that are present in each call. A number of 124,607 projects are filtered based on a Python 3.14.0. script, resulting in 1147 projects that contain in the title or abstract at least one key-term from {“artificial intelligence”, “machine learning”, “IoT”, “Robotics”, “Object Detection”} and a least one from {agri*, farm*, crop, “AgTech”, animal, land}.
Table 2.
Selection criteria for all pillars involved in the research.
The four databases employed in this study represent distinct yet interrelated dimensions of the innovation process. Web of Science captures the production of academic knowledge; CORDIS documents publicly funded R and D initiatives that translate such knowledge into applied research; WIPO provides a record of technological protection through patenting; and Crunchbase reflects entrepreneurial activity and market diffusion of innovation. These sources differ in their validation mechanisms—ranging from peer review to open data contribution—but together they capture the main phases of the innovation lifecycle. The integration of these heterogeneous datasets enables a holistic assessment of temporal linkages across the research–innovation continuum.
The integration of these datasets is not intended to equate their content or methodological rigor, but to align them as temporal indicators of distinct innovation activities. Each dataset was aggregated at the yearly level and analyzed for temporal relationships, allowing the identification of sequential dynamics between knowledge creation, institutional projects, intellectual property generation, and entrepreneurial emergence. By focusing on time series interactions rather than on absolute magnitudes, the analysis minimizes the impact of inherent scope and curation differences among the databases.
3.2. AI Applications in Agriculture—Classification
To enable a finer-grained evaluation of the intersection between artificial intelligence and agriculture, a subcategory-level classification was developed. Several previous studies proposed taxonomies of AI applications in agriculture, such as in [53] where 13 main areas of application are identified, while [54] outlined a hierarchical structure of farm systems from regional to cropping system levels. Building on these works, and in alignment with [17,20], we focused our analysis on cropping systems, excluding livestock, climate, vegetation, and secondary or tertiary systems. The resulting taxonomy of AI–agriculture domains is provided in Appendix B.
These categories have been reduced to six for more reliability, based on their coverage area. Therefore, crop management includes land preparation, seeding, planting, and crop rotation. Disease control integrates biological control, cultural practices, and chemical applications to minimize environmental impact. Soil monitoring assesses soil properties to detect changes and manage threats like erosion and contamination. Irrigation and fertilization management ensures optimal water and nutrient application for crop growth and includes, by extension, the horizon defined by nutrient and water management. Weather prediction applies scientific methods to forecast atmospheric conditions. Performance management and sustainability monitoring leverage AI to enhance productivity, efficiency, and environmental sustainability. As a result, the final set of subcategories used for the next step of the classification is given by S = {crop management, disease and pest, fertilization and irrigation, soil, sustainable farming, weather forecasting}.
These categories are useful to describe data, determine more homogenous series, and diagnose the slope. In addition, correctly classified values can be further matched across all innovation cycle steps, leading towards representative and accurate causality methods application.
3.3. Classifier of AI in Agriculture Sub-Domains
Recent advancements in natural language processing (NLP) have led to significant improvements in zero-shot classification, where models assign labels to text without prior training on labeled data for that specific task [55], particularly for domains where labeled datasets are scarce or continuously evolving. Traditional text classification approaches rely on supervised learning with annotated datasets, but these methods require significant manual effort. Zero-shot ranking methods, such as those explored by [56], utilize transformer models to assess entailment probabilities between input text and predefined category labels.
For this study, a Python-based workflow has been developed to perform zero-shot classification on a collection of objects described by titles and abstracts. Our first classifications were performed using two models: “facebook/bart-large-mnli”, a variant of the BART (Bidirectional and Auto-Regressive Transformer) architecture fine-tuned on the Multi-Genre Natural Language Inference (MNLI) dataset and “MoritzLaurer/deberta-v3-large-zeroshot-v2.0”, a variant of the DeBERTa v3 (Decoding-enhanced BERT with Disentangled Attention) architecture, fine-tuned for zero-shot classification using a hypothesis-based approach. Both of those models were initially used for classification tasks, making use of their pre-trained language understanding to assign relevant categories without the need for labeled training data.
Our scripts first normalize and clean each text entry, then leverage the BART-based and DeBERTa classifiers via the HuggingFace pipeline API to assign one of several predefined, agriculture-related categories, and then the resulting classifications, along with their confidence scores, are compiled into a structured spreadsheet. Upon comparing the results of those two models, we chose to continue with the BART-based classifier because it consistently provided higher confidence scores and more accurate classifications within the agricultural domain. Its performance was more stable, with fewer ambiguous or overlapping assignments, making it a more reliable choice for categorizing AI-related agricultural texts in a zero-shot setting. Several studies such as [57,58] highlight the classification techniques using AI and their misinterpretations with inconsistent labeling and performance variations across classifiers when considering very niche topics, which is very similar to our case. A quick result classification can be seen in Table 3 where the BART model outperformed the Mortiz model. While the abstracts are not included in the visual representation, they were an important part of the classification process.
Table 3.
Zero-shot classification of AI in agriculture: BART vs. MoritzLaurer.
Although DeBERTa v3 has a strong performance for most NLP general tasks, according to https://arxiv.org/pdf/2111.09543 (accessed on 12 November 2024), our empirical observations along with the results showed that BART provided more consistent and domain-relevant classifications for AI applications in agriculture. By following the above steps, we are able to create a procedure that provides a streamlined, data-driven approach of interpreting and organizing textual inputs without having the need to do any kind of manual annotations, thanks to the advanced language processing capabilities of the BART model.
3.4. Series Smoothing
Various time series smoothing techniques were applied to normalize and smooth the data series, as they have been proven particularly helpful in studies focusing on agriculture topics, such as [59,60,61], thereby allowing for a clearer understanding of the underlying dynamics. The four categories—articles, patents, projects, and start-ups, spanning from 1982 to 2023—were considered. Each dataset was processed using several smoothing techniques.
Simple Moving Average (SMA) calculates the average of a defined number of data points. For this study, a 3-point window was used, meaning each data point was replaced by the mean of itself and the two surrounding points. This method helps to smooth out short-term fluctuations and highlight longer-term trends. The formula for SMA is
where N is the window size, t is the current time step, and xi represents the values in the time series.
The Exponential Moving Average (EMA) assigns more weight to recent data points, making it more responsive to recent changes compared to the SMA. In this analysis, a span of 12 was chosen, balancing the sensitivity to new trends while smoothing out the noise. EMA is defined as
where α is the smoothing factor equal to 2/(span + 1), and xt is the value at time t. The first term x1 was initialized with the first value of the normalized dataset for each pillar. This recursive method is especially useful for datasets with recent variability.
In addition, Ref. [62] have mentioned the Lowess method as an alternative to the above-mentioned techniques for increased robustness, as it accounts for non-normal distributions. It effectively smooths the series by allowing a flexible fitting, which can capture local variations. For this study, a fraction parameter equal to 0.1 was used, indicating that 10% of the data points were used to fit each local regression. This method is suitable for identifying underlying patterns that might not be visible through more rigid smoothing techniques. Lowess is particularly beneficial for data exhibiting non-linear trends.
Nevertheless, Ref. [63] have applied a Gaussian filter to the data series, which weights each data point according to a Gaussian (bell-shaped) curve. A window size of k = 5 was therefore used in the present study, where each value was replaced by a weighted average of itself and its four surrounding points. This approach is effective at smoothing while retaining the general shape of the data trends, and is defined as
where G(i) represents the Gaussian weights, and k is the size of the window. The Gaussian filter helps in minimizing the effect of outliers while preserving the overall trend.
Each dataset was subject to all the aforementioned smoothing methods. The original and smoothed values were plotted for comparison to assess how effectively each method captured trends and minimized noise. The SMA and EMA methods are simple yet effective for steady trends, whereas Lowess and Gaussian smoothing are more versatile in handling non-linear patterns and variable data. The choice of method has been made according to the specific characteristics of each series, allowing for a flexible and more accurate result.
3.5. Knee Point Detection
Knee points represent moments in time where a significant shift occurs, marking a point of maximum curvature in the data trend. This type of investigation within a time series gave multiple positive responses in research such as [64], where they redesigned the Bayesian Information Criterion (BIC) method for partitioning-based clustering algorithms by proposing a new knee-point-finding method based on it. The concept of maximum curvature is used in scientific research for capturing the point where the rate of change reaches the maximum value, meaning that the curve bends the most at this value of x-axis. The formula used for detecting this point is defined by
where f(x) is the function associated with the time series data, and x represents the time variable.
In this current methodology, we evaluate the differences between the maximum curvature applied to the same datasets representing articles, patents, projects, and start-ups, spanning the years from 1982 to 2023 and the value of maximum second derivate. The detection technique leverages the concept of curvature analysis. Specifically, the approach involves calculating the first and second derivatives of the time series data to identify points where the curvature is maximized. The knee point is the point where the rate of change shifts most noticeably, highlighting a critical transition period in the dataset. The first derivative provides the rate of change in the data with respect to time. It measures how fast the data values are increasing or decreasing, while the second derivative indicates the change in the rate of the first derivative. By analyzing the second derivative, it is possible to identify points of maximum curvature where the rate of change undergoes a significant shift. The formula for calculating the second derivative is
where f(x) is the function associated with the time series data, and x represents the time variable.
The method implemented in this study involves several steps. The time series data for each category is extracted, with the years serving as the time axis. Using numerical differentiation, the first and second derivatives of each dataset are calculated. The knee point is identified as the position where the second derivative reaches its maximum value, indicating a point of highest curvature. This approach assumes that a significant change in trend or growth rate is marked by an inflection point that can be detected via curvature analysis. The formula used to identify the knee point is as follows:
where argmax identifies the index at which the second derivative is maximized.
3.6. Causal Inference
To investigate the dynamic relationships between research outputs, technological innovation, practical implementation activities, and entrepreneurial activity, we employed a three-step approach combining Granger causality analysis, impulse response function analysis, and cross-correlation analysis. This perspective was chosen to identify causal links, quantify the temporal dynamics between variables, and explore their lead–lag relationships, as indicated by [65], and reiterated by [66,67]. Granger causality analysis was employed to assess whether one time series could predict another, based on past values. The analysis was conducted for all variable pairs using lag selection through the Akaike Information Criterion (AIC) and Bayesian Information Criterion (BIC), hypothesis testing, with the null hypothesis defined as “variable x does not Granger-cause variable y”, and causality network assessment, where nodes represent variables and directed edges indicate Granger causality. To further explore the dynamic interactions between variables, impulse response functions (IRFs) were derived using a Vector Autoregressive (VAR) model. The model in cause was fitted using the preprocessed time series data, ensuring optimal lag length as determined in the Granger causality step, and was used to estimate how a unit shock to one variable influences other variables over time. The results were visualized in impulse response plots, illustrating the magnitude and duration of the responses.
To complement the findings from the Granger causality and IRF analyses, cross-correlation analysis was performed to examine lead–lag relationships between variable pairs at different lags. The cross-correlation function (CCF) was computed for each pair, with specific attention to lag structure, where positive and negative lags were analyzed to identify whether changes in one variable precede or follow changes in another. The statistical significance of cross-correlation coefficients was evaluated to ensure robust conclusions. Nevertheless, cross-correlation plots were generated to identify peaks and troughs, highlighting significant relationships and their temporal dynamics.
4. Results and Discussion
4.1. General to Sub-Domain Classification Data Along All Pillars
To evaluate the research questions regarding the sequential progression of innovation from articles to projects, patents, and start-ups, we analyzed the yearly distribution of data across six categories: {crop management, disease and pest, fertilization and irrigation, soil, sustainable farming, weather forecasting}. For the articles dimension, 33,473 publications were considered, based on the criteria established in the previous stage.
The analysis begins in 1985, marking the earliest identifiable research outputs on the use of artificial intelligence in agriculture in the Web of Science database. Using a consistent time frame (1985–2023) across all data sources ensures comparability among the four innovation pillars. Although the innovation process typically involves a temporal lag between publications, projects, patents, and start-ups, maintaining a unified period allows for the application of time series causality techniques (Granger and impulse-response analyses) to identify these delays empirically rather than imposing them a priori.
A significant acceleration of innovation activity is observed after 2010, particularly in the number of start-ups and applied research projects. Nevertheless, the analysis maintains the full 1985–2023 time frame, as the study aims to capture the entire evolution of the AI-driven agricultural innovation lifecycle. The discussion specifically emphasizes the post-2010 period as an acceleration phase, providing detailed interpretations of the structural changes in the innovation system during this stage.
This resulted in a positive trend and an exponential increase in the number of articles, with a turning point after 2017, as presented in Figure 2. Among subcategories, soil management showed stabilization around 2022, possibly reflecting research maturity in this area. In contrast, other subcategories, such as disease and pest management and sustainable farming, displayed steady growth but without distinct inflection points.
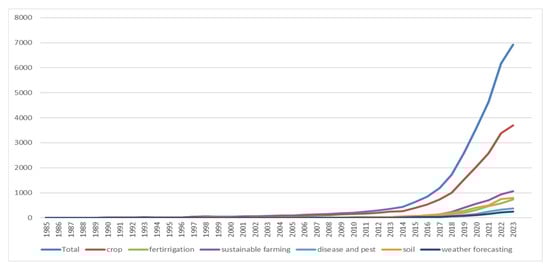
Figure 2.
The evolution of publications per class (Source: Authors’ computation).
Project data was retrieved from the Cordis database for Horizon Europe, Horizon 2020, FP1 to FP7, yielding a dataset of 124,607 records. After filtering, 1147 projects were identified for the 1985–2023 period. To mitigate cyclic patterns caused by program cycles, the analysis counted projects active in each year rather than their start years.
Figure 3 demonstrates a consistent increase since 1985, with dips in 1998, 2002, and 2019 corresponding to program transitions or the COVID-19 pandemic. An exponential growth phase began in 2014 with the launch of Horizon 2020.
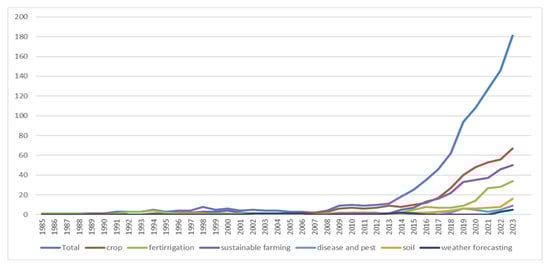
Figure 3.
The evolution of projects per category (Source: Authors’ computation).
Patent data analysis identified 955 records for the period. A significant increase occurred after 2015, peaking before 2020, followed by a decline, as in Figure 4. This suggests a burst of innovation activity, possibly linked to agricultural technological advancements, with a recent decline that could signal market saturation or reduced patent filings.
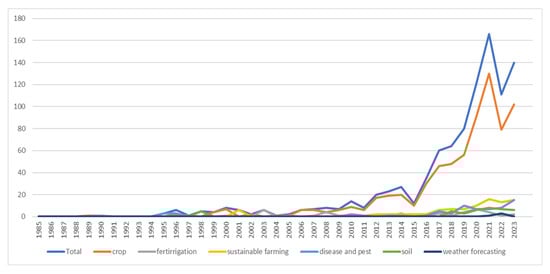
Figure 4.
The evolution of patents per category (Source: Authors’ computation).
For start-ups, 825 entries were analyzed. The frequency distribution, Figure 5, showed a gradual increase until the mid-2000s, followed by a sharp rise after 2010, peaking between 2014 and 2018. A decline is evident after 2020. Among categories, crop-related start-ups dominated, with the highest activity during 2016–2018, sustainable farming and disease and pest management also showed strong contributions, peaking during the same period, fertilization and irrigation, soil management, and weather forecasting showed lower but steady activity throughout the period.
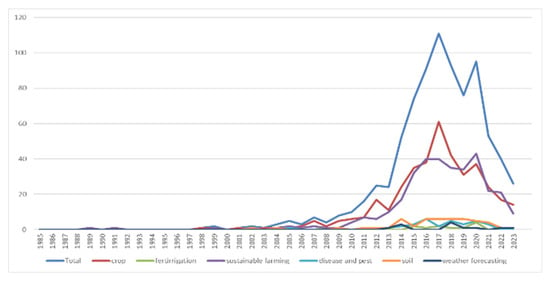
Figure 5.
The evolution of start-ups per category (Source: Authors’ computation).
This distribution highlights a concentration of start-up activity during 2010–2016, likely driven by advancements in agricultural technology, policy incentives, and increased investment in Agritech. The subsequent decline may reflect market consolidation or a shift in funding priorities.
In response to our research question, RQ5—Is the overall evolution of the research domain similar to the evolution of the six particular sub-directions defined by the proposed classification? Statistical analyses were conducted using the Kruskal–Wallis test to determine whether there are significant differences between the six categories and the Chi-square test to evaluate deviations from the total frequency distribution per year. The results of the first method are summarized in Table 4.
Table 4.
Differences between the innovation phases (Source: Authors’ computation using Python).
Kruskal–Wallis results for articles indicated statistically significant differences among the six categories, suggesting that certain categories show a stronger presence in the academic literature.
The Chi-square test also validated H1, confirming that the observed frequencies of articles significantly deviate from the expected yearly totals, highlighting temporal dynamics and potential shifts in research focus. For projects, the Kruskal–Wallis test similarly validated H1, demonstrating that the distribution of projects across categories is non-uniform and likely influenced by varying levels of practical applicability or funding priorities. However, the Chi-square test validated H0 (Null Hypothesis: There is no significant difference between the observed and expected frequencies; the distribution is uniform or consistent with expected trends), indicating no significant deviation from the expected total yearly frequencies. This suggests that while project distributions differ by category, their overall yearly volume remains consistent with general trends. Patents showed significant differences across categories, as evidenced by the same test. These differences point to varying innovation intensities, likely driven by technological advancements or market demand in specific areas. The Chi-square test also validated H1, indicating that patent filings deviate significantly from the total yearly frequencies, reflecting the uneven pace of innovation across time. Start-ups showed significant differences across categories, suggesting that entrepreneurial activity is influenced by category-specific situations. The Chi-square test results further revealed significant deviations from total yearly frequencies, aligning with the findings for patents and indicating that start-up formation is closely tied to temporal and categorical variations.
The analyses indicate that the hypothesized sequential progression of innovation is partially validated. Articles, patents, and start-ups all show significant categorical and temporal variations, as evidenced by both Kruskal–Wallis and Chi-square tests. However, projects demonstrate a divergence in this trend, with significant categorical differences but no deviation from yearly frequencies.
4.2. Results in Smoothing Techniques
To investigate the temporal relationships among the four innovation phases, we analyzed normalized annual data spanning from 1985 to 2023. Due to inherent fluctuations and noise in the raw time series data, smoothing techniques were applied to highlight underlying trends and facilitate clearer visual interpretation; the tested methods included Simple Moving Average (SMA) with a window size of 3 years, Simple Exponential Smoothing (SES) with a smoothing factor α = 0.2, and Gaussian smoothing with a kernel size of 5. Parameter selection aimed to balance noise reduction with the preservation of local dynamics. The chosen configuration, namely original data for articles and SMA for projects, patents, and start-ups, provided stable representations of long-term evolution without introducing noticeable phase distortions. To verify that smoothing did not induce false dynamics, the smoothed and original series were compared, observing high pairwise correlations (r > 0.95) and temporal alignment of key inflection points within ±1 year. Augmented Dickey–Fuller (ADF) tests indicated that all four series were initially non-stationary (p > 0.9). Each series was differenced between one and five times until stationarity was achieved (Articles = 1, Projects = 3, Patents = 5, Start-ups = 4). To mitigate autocorrelation and prevent spurious inference, a pre-whitening procedure following the Box–Jenkins approach was applied prior to Granger causality and cross-correlation analysis.
Figure 6 illustrates the smoothed and original time series for each innovation phase. The visual representations suggest a sequential pattern where peaks in the number of projects are followed by increases in articles, which are then succeeded by rises in patents. Start-ups seem to evolve rapidly compared to the other dimensions involved in the innovation. This observation preliminarily supports the hypothesized progression in the innovation cycle.
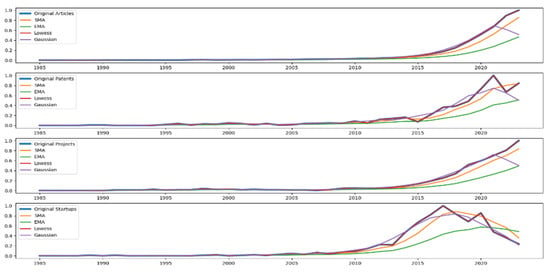
Figure 6.
Original series compared to the different methods of smoothing (Source: Authors’ computation using Python).
4.3. Chronology in Knee Points
To further quantify the onset and intensification of activity in each phase, knee point analysis was conducted using the second derivative method and maximum curvature. As stated previously in the methodology, knee point was used to detect a significant acceleration in the trend, highlighting critical years of innovation surges for each phase. The second derivate method results are compared to those generated by the maximum curvature. Figure 7 contains the resulting knee points for each time series associated with each pillar, while Figure 8 contains the same type of outputs but computed with the maximum curvature knee point method detection.
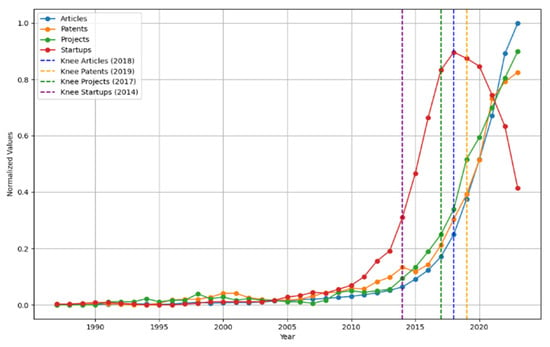
Figure 7.
Knee point detection using maximum second derivate (Source: Authors’ computation using Python).
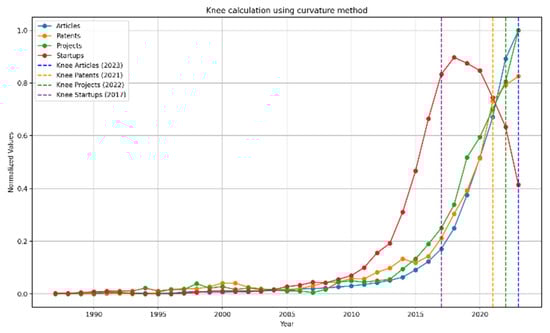
Figure 8.
Knee point detection using maximum curvature (Source: Authors’ computation using Python).
The detected knee points were 2014 for start-ups, 2017 for projects, 2018 for articles, and 2019 for patents. These results indicate a chronological progression, with start-ups preceding other phases, followed by projects, articles, and finally patents, as shown in Figure 7. The early knee point for start-ups relative to projects suggests a potential decoupling between entrepreneurial activity and structured project initiatives, potentially due to independent funding or market-driven ventures. Moreover, the appearance of projects before articles and patents suggests a natural progression toward tangible outcomes, indicating that the latter may be considered results or derivatives of the former.
For the maximum curvature, the values obtained within Figure 8 indicate as knee points the years 2017 for start-ups, 2022 for projects, 2023 for articles, and 2021 for patents. The results obtained indicate for this evaluation the maximum point that describes an intensive interest in each of the analyzed pillars. A particular value that has a different evaluation is given by the maximum curvature of the articles’ time series, the value being equal to the upper limit of the series, indicating the fact that there is still an increase in interest in publishing in scientific journals the results obtained by the research performed within the intersection of AI and agriculture. Summarizing the results from Figure 7 and Figure 8, Table 5 contains the starting and ending point of intensive increase in interest in each of the four pillars.
Table 5.
Interval of intensive interest in dissemination (Source: Authors’ computation using Python).
Based on the interval defined within Table 5, Figure 9 highlights for each time series the years within the lower and upper limit of the two indicators.
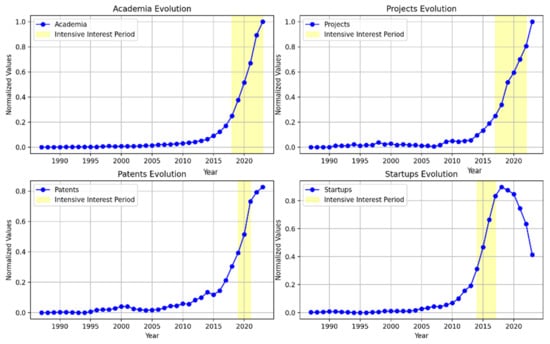
Figure 9.
Golden period of innovation in all four pillars (Source: Authors’ computation using Python).
The publications in the academia environment show stable growth between 2010 and 2017, after that detecting that sharp increase. The highlighted period between 2018 and 2023 suggests a significant interest in research activity. The reasons behind the evolution are given by possible policy incentives, emerging scientific interest along with technological advancements. The upper limit of the highlighted period is generated solely on the reason of time series ending, but not the potential increase. For the projects’ time series, we deduce a similar trajectory to the academia environment, following a slow evolution since 2010, with a strong increase in 2017. The period determined by an accelerated rate of investments in projects, 2017–2022, indicates a period of similar implications in the Cordis programs.
The filing of patents shows more of a stable evolution until 2014, with a higher slope starting from 2019. The peak period 2019–2021 refers to the window where an intense transition from research to commercialization was performed. The golden period of start-ups’ foundation was between 2014 and 2017, but with a visible saturation reached around 2018, leading to a decrease in interest. This can be explained by possible changes in regulations, funding, or even market limitations. This decline can also suggest other sources such as a shift in the investors’ interest, the competition, or even consolidation.
The overall compared evolution given by the academia and projects dragging the patent series indicate the outcomes of research being translated into more tangible advancements in technology. For academia and projects, series are seen as leading indicators when it comes to innovation, the early growth showing a steady projection before the immersive rise in recent years.
4.4. Causality in Innovation Lifecycle
To examine the dynamic relationships between research outputs, technological innovation, and implementation activities, we applied Granger causality tests for all possible combinations of the series, thereby addressing our research questions on causality, RQ1—Is there any sequential causality in the innovation lifecycle of AI in agriculture? The tests were conducted using lags ranging from 1 to 5 years to assess whether past values of one time series can predict the future values of another. Table 6 reports the p-values and significance levels for each directional relationship across lags.
Table 6.
Results of Granger causality tests for lags 1 to 5 (Source: Authors’ computation using Python).
The optimal lag length for the VAR model was determined using the Akaike Information Criterion (AIC = −34.636) and Bayesian Information Criterion (BIC = −30.604), both indicating an optimal lag order of 5. Subsequent analyses were based on this specification. Equation-wise, Durbin–Watson statistics ranged from 1.45 to 1.93, indicating no severe residual autocorrelation. The stability check showed one or more companion roots close to the unit circle, suggesting that the system is near the boundary of stability.
The results, visualized in Figure 10 as a causality network, reveal several significant relationships between the variables. The intensity of the relationship has been considered strong or weak based on the number of significant consecutive lags.
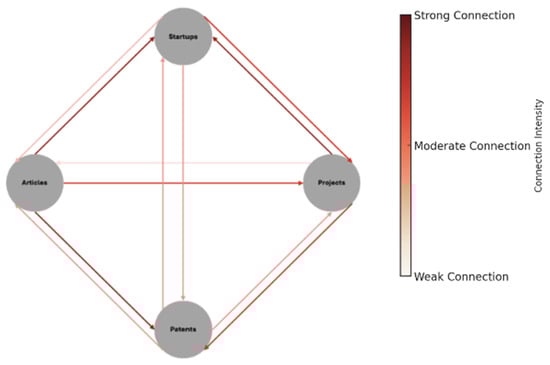
Figure 10.
Causality network (Source: Authors’ computation).
The results demonstrate that articles strongly predict patents and start-ups across most of the lags. This suggests that increases in research activity act as a significant driver for subsequent technological innovations. Conversely, patents and start-ups also influence articles, though to a lesser extent and primarily at lower lags. These bidirectional relationships suggest a feedback loop where technological advancements inspire further research activity, creating a reinforcing cycle between innovation and research output. When looking at the start-ups, the analysis indicates strong influence by articles and projects, and a weaker one by patents, suggesting that research activity and technological innovations drive the establishment of new entrepreneurial initiatives. However, the influence of start-ups on other variables, particularly articles and patents, appears limited. This asymmetry suggests that while research and innovation stimulate the creation of start-ups, these entrepreneurial activities contribute less to upstream research or further innovation. Similarly, articles were found to Granger-cause projects at lower lags, indicating that research outputs can lead to practical applications, particularly in the short term. However, the reverse relationship was weaker and inconsistent, suggesting that while practical implementations might inspire research, the effect is neither robust nor sustained. The relationship between patents and projects highlights another interesting connection, where patents appear to have only a limited and inconsistent influence on projects. This asymmetry suggests that implementation fosters new technological developments, as real-world use cases also demonstrate.
To further explore the dynamic interactions among the series, impulse response functions were estimated from the stable VAR model using 1000 bootstrap replications to generate 95% confidence intervals over a 10-year horizon (Figure 11). All roots of the companion matrix lie within the unit circle, confirming model stability. The confidence bands indicate that the responses are statistically bounded and do not exhibit explosive behavior.
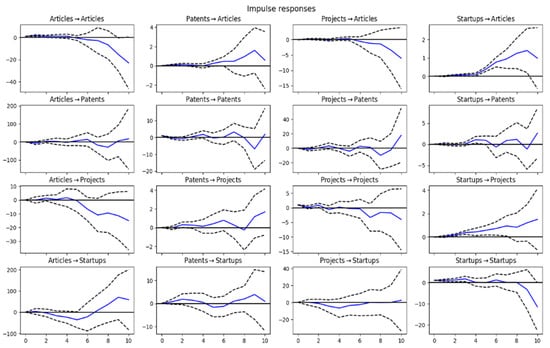
Figure 11.
Impulse response functions (Source: Authors’ computation using Python).
A shock to patents leads to a positive response in articles, reaffirming the earlier causality findings and suggesting that technological advancements can stimulate new research publications. Contrariwise, a shock to articles has a negative effect on patents, stating that research activity may inhibit patent filings. This apparent discrepancy between the positive Granger causality of the articles—patents connection and the initially negative impulse response should not be interpreted as a contradiction. While the first one evaluates predictive relationships, the latter measures the dynamic reaction of one series to an exogenous shock. Thus, research activity can statistically predict future patenting, while an abrupt surge in publications may initially suppress patent output before contributing to longer-term innovation. The analysis further reveals that articles influence projects with a fluctuating but generally negative response, highlighting that the translation of research into practical applications is subject to variability and additional influencing factors. The influence of projects over articles is rather a temporary adjustment and does not have a strong effect long-term. On the other hand, patents have a positive effect on projects with a higher intensity in the long run, suggesting a longer buffer between transforming a prototype into a ready-to-market product. Start-ups demonstrate an interesting behavior. Shocks to start-ups show limited but positive effects on both articles and patents, indicating that entrepreneurial activity has some influence on new research outputs and applied implementations and innovation, although the effect is weaker compared to the role of patents. On the other hand, start-ups demonstrate strong persistence to projects, as demonstrated by the autocorrelated response, showing that they represent a powerful driver towards continuous development.
To complement these findings, cross-correlation analysis was conducted on pre-whitened series to identify lead–lag dynamics while mitigating autocorrelation effects. The cross-correlation functions were computed with 95% significance envelopes (±2 standard errors) and are presented in Figure 12. The relationship between articles and patents shows no significant cross-correlation at any lag, suggesting that changes in the number of published articles do not directly lead to or follow changes in patent filings. However, patents show a significant cross-correlation with articles, particularly at lag 0 and negative lags, implying that an increase in patents precedes an increase in research publications. This further supports the notion that technological advancements foster additional research activity. The relationship between patents and projects is similarly robust, with a significant peak around lag 0 and positive lags, indicating that increases in patents are followed by increases in projects. This suggests that patent activity serves as a leading indicator for the initiation of practical implementation activities. In contrast, no significant cross-correlation was observed between articles and projects, nor between projects and articles, implying that research outputs do not directly influence project initiation, and project activities have limited feedback effects on academic research. Start-ups show dynamics in the cross-correlation analysis. The results reveal that start-ups are significantly influenced by patents, with positive correlations at lag 0 and subsequent lags. This suggests that technological innovations act as a foundation for entrepreneurial activity, encouraging the creation of new start-ups. However, the influence of start-ups on other series remains marginal, as no significant cross-correlation was observed between start-ups and articles or projects. This further reinforces the earlier conclusion that start-ups are primarily downstream processes influenced by innovation, with limited feedback effects on upstream research or implementation activities.
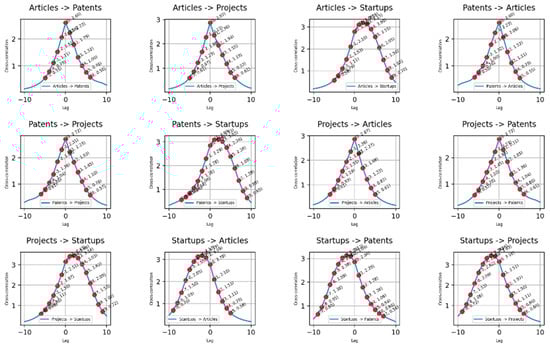
Figure 12.
Cross-correlation plots (Source: Authors’ computation using Python).
Overall, these results highlight the significant role of patents as a leading indicator of both research outputs and implementation activities, while also emphasizing the emergence of start-ups as a key downstream outcome of innovation processes. The observed bidirectional relationships between articles and patents suggest a feedback loop between research and innovation, while the strong influence of patents on projects underscores the importance of technological advancements in driving applied activities. However, the lack of significant relationships between articles and projects suggests that practical applications may rely more on innovation outputs than on direct academic research. Finally, the limited influence of start-ups on upstream processes suggests that entrepreneurial activities are primarily influenced by, rather than influencing, broader innovation and research systems.
The causal patterns identified in this study substantiate theoretical expectations derived from innovation system theory and the Triple Helix model, which emphasize the interdependence of academic, industrial, and research actors in driving technological advancement. The empirical results also align with prior findings in other domains (e.g., biotechnology and ICT), confirming that effective knowledge transfer mechanisms are essential for accelerating innovation diffusion.
Previous studies have examined sequential or causal relationships among innovation indicators in fields such as biotechnology, information technology, and renewable energy in [68,69]. These works confirm that the innovation process often unfolds through interdependent stages linking research, patents, and commercialization. However, to our knowledge, no prior study has applied a causal inference framework to investigate these dynamics within the context of AI-driven agriculture and university–industry–research collaboration. This gap underscores the novelty of our analytical approach.
4.5. Limitations and Future Improvements
The current research reached to answer the proposed research questions, but some limitations need to be drawn for a proper interpretation of the results. While the three pillars defined by research academic work in articles, patents filling, and companies established with the fields of interest AI along with agriculture are transposed in time series extracted from worldwide sources, thus describing the overall evolution and interest in this domain, the projects pillar was formed only out of Cordis projects. This database is representing the image of research and investment in research in the European union. Further investigations can be taken in consideration for extension with other such programs.
Another aspect crucial to be mentioned in this section is the method that involves the criteria for selection when it comes to all analyzed pillars. The presented implementation of the methodology within Section 3 was conducted starting from the premises that it is nearly impossible to compare using LLM techniques all materials available within the WOS database in order to determine those that are of great importance of the intersection of the fields of agriculture and AI. For that, our approach used the set of keywords for field description. Seen as an initial limitation, it then transformed into a generical method for transposing the set of keywords in other databases, such as Cordis, Crunchbase, and WIPO.
Another limitation concerns the temporal scope of the analysis. The study covers the period 1985–2023, which captures the full evolution of AI-driven innovation in agriculture but may not reflect future developments or short-term fluctuations beyond this interval. Moreover, although the use of a consistent time span across all datasets facilitates comparability, it may overlook domain-specific delays between academic research, project implementation, patenting, and start-up formation.
The results should also be interpreted considering certain methodological constraints. The application of Granger causality and impulse-response functions captures statistical dependencies among innovation indicators but does not imply deterministic or direct causal mechanisms. Moreover, the datasets used—Web of Science, CORDIS, WIPO, and Crunchbase—while comprehensive, do not represent the entire spectrum of agricultural innovation activities and may introduce database-specific biases. Consequently, the findings should be viewed as indicative of general patterns within AI-driven agricultural innovation rather than universally generalizable results. Further development of the study could involve incorporating additional phases of the innovation lifecycle and extending the analysis to other industries to assess the general character of the findings. As a next step, the analysis could also be extended to assess the robustness of the results under alternative query formulations. This would involve testing the sensitivity of keyword selection to related terms and evaluating how such variations may affect the identified temporal patterns and causality relationships.
5. Conclusions
The intersection between artificial intelligence and agriculture represents a rapidly expanding research area, recognized for its transformative potential in productivity, sustainability, and innovation. The objective of extending current research performed upon this intersection of domains with a more in-deep evaluation of the major pillars that are describing the innovation lifecycle was reached using time series investigations, statistical methods for smoothing the series and for causal analysis, along with an additional approach combining sub-domain classification for particular evaluation of the evolution of this domain in subcategories.
The overall compared evolution given by the academia and projects dragging the patent series indicate the outcomes of research being translated into more tangible advancements in technology. For academia and projects, series are seen as leading indicators when it comes to innovation, the early growth showing a steady projection before the immersive rise in the recent years. Some implications between the analysis of academia and project evolution may suggest more investments that need to be performed in research and innovation projects, thus supporting the surge in academic research. For the patents’ direction, the innovation environment more likely shifted towards protecting the intellectual property, leading to a maturity in the advancements within the technological field. The only pillar that faced a decrease in interest is represented by the start-ups; this decline suggests more of a consolidation within the domain or a shift in the investors’ interests.
The results of the statistical analysis reveal a partially sequential progression, addressing the research question RQ1. The overall direction follows the expected upstream flow, with research activity preceding projects, patents, and start-ups, yet the observed dynamics show that some phases respond faster than others, highlighting a structured but non-linear innovation pathway. The Granger causality indicates the hypothesis that academic research drives patents and start-ups, while also indicating weak feedback effects, from patents and start-ups back to research. However, the influence of articles on projects and vice versa is less pronounced, suggesting that research activity does not directly lead to implementation efforts, answering to RQ2. These findings are further supported by impulse response analysis, where a shock to patents positively influences research output, while a shock to articles demonstrates a negative effect on patents. This difference reflects distinct perspectives: Granger causality captures predictive relationships, whereas impulse responses describe short-term dynamic adjustments that may initially diverge before converging in the long run. Cross-correlation results further validate the role of patents as a leading indicator for both research and implementation activities, as well as the role of start-ups as a downstream outcome with limited feedback effects. In relation to the research questions, the analysis suggests the presence of sequential causality in the innovation lifecycle (RQ2–RQ5), with patents acting as a driver of both research and application, while start-ups appear as fast-reacting but primarily downstream actors. The expected influence of projects on patents remains weak, and the link between academic research and project initiation appears inconsistent.
Beyond the empirical contribution, the results of this study provide several practical implications for policy and strategic planning. The identified causal sequence among academic research, projects, patents, and start-ups suggests that policy measures fostering early-stage research and facilitating its transition into applied projects can significantly accelerate innovation outcomes. Strengthening the mechanisms that link research institutions with industry—such as technology transfer programs, innovation incubators, and collaborative R&D funding—could enhance the overall efficiency of the innovation lifecycle. Furthermore, the observed acceleration after 2010 highlights the importance of maintaining long-term investments in digital and AI-based agricultural technologies to sustain innovation capacity and competitiveness.
Author Contributions
Conceptualization, G.G. and M.Z.; methodology, G.G., M.Z., B.F.M. and I.-D.P.; software, M.Z., B.F.M. and I.-D.P.; validation, G.G., M.Z., B.F.M. and I.-D.P.; formal analysis, M.Z., B.F.M. and I.-D.P.; investigation, G.G., M.Z., and B.F.M.; resources, M.Z., B.F.M. and I.-D.P.; data curation, M.Z., B.F.M. and I.-D.P.; writing—original draft preparation, G.G., M.Z., B.F.M. and I.-D.P.; writing—review and editing, G.G., M.Z., B.F.M. and I.-D.P.; visualization, G.G., M.Z., B.F.M. and I.-D.P.; supervision, G.G. and M.Z.; project administration, G.G. and M.Z.; funding acquisition, G.G. and M.Z. All authors have read and agreed to the published version of the manuscript.
Funding
The research was conducted and financed in the framework of the project “CauseFinder: Causality in the Era of Big Data and AI and its Applications in Innovation Management” (Contract No. 760049 / 23.05.2023; Code CF 268/ 29.11.2023).
Institutional Review Board Statement
Not applicable.
Informed Consent Statement
Not applicable.
Data Availability Statement
The original contributions presented in this study are included in the article. Further inquiries can be directed at the corresponding authors.
Conflicts of Interest
The authors declare no conflicts of interest.
Appendix A
In order to confirm that all relevant papers have been covered by the above query, the terms defining agriculture have been fetched from NACE → A AGRICULTURE, FORESTRY AND FISHING → 01 Crop and animal production, hunting, and related service activities [70].
All unique words have been extracted, resulting in a list of 50 relevant words, further narrowed down by using a text-based semantic grouping approach, leveraging natural language processing techniques and hierarchical clustering to group similar words. The most relevant groupings were obtained by applying a parameterization with 10 clusters, using the cosine similarity function to measure proximity between terms. Further, the clusters are analyzed and described using keywords that best represent each group of terms. The largest cluster (Cluster 0) includes general crop types and livestock categories, whereas other clusters focus on specific aspects of agriculture, such as oil seed processing (Cluster 4), post-harvest activities (Cluster 1), and hunting/trapping activities (Clusters 3 and 5). Additionally, livestock-related clusters were formed for poultry (Cluster 8) and pig farming (Cluster 9), while agricultural production terms were grouped separately in Cluster 2. This classification provides a structured way to analyze agricultural concepts in relation to AI applications.
Considering the formalization query given by the initial Q1 = (C1 OR C2 OR … Cn) AND (CC1 OR CC2 OR … CCm), we conducted an isolation methodology for determining the impact of each unique term, let it be called X, where X is extracted from the initial set of 50 relevant words from agriculture domain. The set Ci is represented by the elements from the keywords from AI domain, while CCj is represented by the 50 unique words extracted from NACE taxonomy that are relevant to the desired selection. The objective is to gradually build upon an initial query and determine, at each step, the keywords relevant to the field of Agriculture. The methodology conducted accepted the premise that the CCi keywords are independent and only analyzed in single-use impact. Considering the query Q2 = (C1 OR C2 OR … Cn) AND (CC1 OR CC2 OR … CCm OR X), for each X keyword from the set M, Card(Q2/Q1) is computed, where Q2/Q1 = (C1 OR C2 OR … Cn) AND (NOT(CC1) AND NOT(CC2) AND … NOT(CCm)) AND X. The cardinality of the set resulting from the query Q2/Q1 represents the total number of new publications extracted only if term X is considered. Using the notation n = Card(Q2/Q1), a quality metric is introduced in the methodology.
where m is the number of relevant publications classified using Web of Science categories in the intersection of AI and agriculture domains.
A threshold of 0.9 is deciding whether the X term is to be used in the final search query or not. The testing of the search methodology was conducted using Web of Science database. The starting query was defined by TS = ((“artificial intelligence” OR “machine learning” OR “IoT” OR “Robotics” OR “Object Detection”) AND (agri*)), resulting in 17,895 elements. After that, each term from the set {tree, pig, crop, seed, oil, animal, farming, crop, production, harvest, hunting, trapping, land} is added to the equation. For example, in the case of X = “tree” term, the cardinality of the result reached 51,834. This is a good example of the situation of words that are polysemous, tree having multiple meanings depending on the context, a biological meaning and a computer science data structure. For that, isolating only the new results for “tree” term resulted in a number of 33,966 elements. The small difference is given by the fact that the wild card * cannot be used in the NOT Boolean operator, the query being adjusted to TS = ((“artificial intelligence” OR “machine learning” OR “IoT” OR “Robotics” OR “Object Detection”) AND “tree”) NOT TS = (“agriculture” OR “agribusiness” OR “agricultural” OR “agrifood” OR “agronomy”). Only 2148 elements are classified within the environment sciences, the rest integrated in multiple fields referring to computer science fields.
Each key-term is iterated and the final query obtained is TS = ((“artificial intelligence” OR “machine learning” OR “IoT” OR “Robotics” OR “Object Detection”) AND (agri* OR farm* OR crop OR “AgTech” OR animal OR land)).
Appendix B
This appendix presents the classification of agricultural sub-domains used in the study for evaluating the intersection between artificial intelligence and agriculture. The taxonomy is derived from prior frameworks [17,20,53,54] and focuses on cropping systems while excluding livestock, climate, vegetation, and secondary or tertiary sectors.
Table A1.
Domains of agriculture—AI relation.
Table A1.
Domains of agriculture—AI relation.
| L0 | L1 | L2 | L3 | L4 | L5 | L6 | CODE |
|---|---|---|---|---|---|---|---|
| Regional system | Agricultural sector | Farm system | Cropping system | Pre-harvesting | Crop system | Nutrients management | NM |
| Regional system | Agricultural sector | Farm system | Cropping system | Pre-harvesting | Crop system | Water management | WM |
| Regional system | Agricultural sector | Farm system | Cropping system | Pre-harvesting | Crop system | Crop management | CM |
| Regional system | Agricultural sector | Farm system | Cropping system | Pre-harvesting | Weeds, pathogens, and insects | Disease control | DI |
| Regional system | Agricultural sector | Farm system | Cropping system | Pre-harvesting | Soil | Soil monitoring | SM |
| Regional system | Agricultural sector | Farm system | Cropping system | Pre-harvesting | Soil | Irrigation management | IM |
| Regional system | Agricultural sector | Farm system | Cropping system | Pre-harvesting | Soil | Fertilization management | FM |
| Regional system | Agricultural sector | Farm system | Cropping system | Pre-harvesting | Soil | Weather prediction | WP |
| Regional system | Agricultural sector | Farm system | Cropping system | Harvesting | Harvesting | HM | |
| Regional system | Agricultural sector | Farm system | Cropping system | Harvesting | Biomass | BM | |
| Regional system | Agricultural sector | Farm system | Cropping system | Performance management | PM | ||
| Regional system | Agricultural sector | Farm system | Cropping system | Sustainability monitoring | SU |
Note: L0, L1, L2, L3, L4, L5, L6 represent the levels of the agriculture domains hierarchy. All leaf categories have been initially considered for the study.
References
- Gallagher, C.; Lusher, D.; Koskinen, J.; Roden, B.; Wang, P.; Gosling, A.; Polyzos, A.; Stenzel, M.; Hegarty, S.; Spurling, T.; et al. Network patterns of university-industry collaboration: A case study of the chemical sciences in Australia. Scientrometrics 2023, 128, 4559–4588. [Google Scholar] [CrossRef]
- Mondejar, M.E.; Avtar, R.; Diaz, H.L.B.; Dubey, R.K.; Esteban, J.; Gómez-Morales, A.; Hallam, B.; Mbungu, N.T.; Okolo, C.C.; Prasad, K.A.; et al. Digitalization to achieve sustainable development goals: Steps towards a Smart Green Planet. Sci. Total Environ. 2021, 794, 148539. [Google Scholar] [CrossRef]
- Sharma, V.; Tripathi, A.K.; Mittal, H. Technological revolutions in smart farming: Current trends, challenges & future directions. Comput. Electron. Agric. 2022, 201, 107217. [Google Scholar] [CrossRef]
- Zhang, M. How Industry-University-Research Cooperation Influences Innovation Efficiency in China. In Proceedings of the 16th International Scientific Conference on Hradec Economic Days, Hradec Kralove, Czech Republic, 30–31 January 2018. [Google Scholar] [CrossRef]
- Xu, A.; Qiu, K.; Zhu, Y. The measurements and decomposing of innovation inequality: Based on Industry-University-Research perspective. J. Bus. Res. 2023, 157, 113556. [Google Scholar] [CrossRef]
- Chen, K.; Guan, J. Measuring the efficiency of China’s regional innovation systems: Application of network data envelopment analysis (DEA). Reg. Stud. 2012, 46, 355–377. [Google Scholar] [CrossRef]
- Hauser, C.; Siller, M.; Schatzer, T.; Walde, J.; Tappeiner, G. Measuring regional innovation: A critical inspection of the ability of single indicators to shape technological change. Technol. Forecast. Soc. Change 2018, 129, 43–55. [Google Scholar] [CrossRef]
- Knudson, W.; Wysocki, A.; Champagne, J.; Peterson, H.C. Entrepreneurship and Innovation in the Agri-Food System. Am. J. Agric. Econ. 2004, 85, 1330–1336. [Google Scholar] [CrossRef]
- Andrade, D.; Pasini, F.; Scarano, F.R. Syntropy and innovation in agriculture. Curr. Opin. Environ. Sustain. 2020, 45, 20–24. [Google Scholar] [CrossRef]
- Martinho, V.J.P.; Guine, R.d.P.F. Integrated-Smart Agriculture: Contexts and Assumptions for a Broader Concept. Agronomy 2021, 11, 1568. [Google Scholar] [CrossRef]
- Clancy, M.; Heisey, P.; Ji, Y.; Moschini, G. The Roots of Agricultural Innovation: Evidence from Patents. In Proceedings of the NBER Conference on “Economics of Research and Innovation in Agriculture”, Washington, DC, USA, 17 May 2019; University of Chicago Press: Chicago, IL, USA, 2019. [Google Scholar]
- García Álvarez-Coque, J.M.; López-García Usach, T.; Sanchez García, M. Territory and innovation behaviour in agri-food firms: Does rurality matter? In Proceedings of the 126th EAAE Seminar New Challenges for EU Agricultural Sector and Rural Areas. Which Role for Public Policy? Capri, Italy, 27–29 June 2012. [Google Scholar]
- Bjerke, L.; Johansson, S. Innovation in agriculture: An analysis of Swedish agricultural and non-agricultural firms. Food Policy 2022, 109, 102269. [Google Scholar] [CrossRef]
- Coca, O.; Stefan, G.; Mironiuc, M. The Evaluation of Innovation in Agriculture. A Meta-Analytical Study of Literature, Scientific Papers Series Management. Econ. Eng. Agric. Rural. Dev. 2017, 17, 111–120. [Google Scholar]
- Yablonsky, S.A. Multidimensional Data-Driven Artificial Intelligence Innovation. Technol. Innov. Manag. Rev. 2019, 9, 16–28. [Google Scholar] [CrossRef]
- Elbasi, E.; Mostafa, N.; Alarnaout, Z.; Zreikat, A.; Cina, E.; Varghese, G.; Shdefat, A.; Topcu, A.; Abdelbaki, W.; Mathew, S.; et al. AI Technology in the Agricultural Sector: A Systematic Literature Review. IEEE Access 2023, 11, 171–202. [Google Scholar] [CrossRef]
- Oliveira, R.C.D.; Silva, R.D.D.S.E. Artificial Intelligence in Agriculture: Benefits, Challenges, and Trends. Appl. Sci. 2023, 13, 7405. [Google Scholar] [CrossRef]
- Senoo, E.E.K.; Anggraini, L.; Kumi, J.A.; Karolina, L.B.; Akansah, E.; Sulyman, H.A.; Mendonca, I.; Aritsugi, M. IoT Solutions with Artificial Intelligence Technologies for Precision Agriculture: Definitions, Applications, Challenges, and Opportunities. Electronics 2024, 13, 1894. [Google Scholar] [CrossRef]
- Meghwanshi, S. Artificial intelligence in agriculture: A review. Int. Res. J. Mod. Eng. Technol. Sci. 2024, 6, 4358–4363. [Google Scholar]
- Araujo, S.O.; Peres, R.S.; Barata, J.; Lidon, F.; Ramalho, J.C. Characterising the Agriculture 4.0 Landscape—Emerging Trends, Challenges and Opportunities. Agronomy 2021, 11, 667. [Google Scholar] [CrossRef]
- Bhagat, P.R.; Naz, F.; Magda, R. Artificial intelligence solutions enabling sustainable agriculture: A bibliometric analysis. PLoS ONE 2022, 17, e0268989. [Google Scholar] [CrossRef]
- Farroq, M.S.; Riaz, S.; Alvi, A. Web of Things and Trends in Agriculture: A Systematic Literature Review. arXiv 2023. [Google Scholar] [CrossRef]
- Sachithra, V.; Subhashini, L.D.C.S. How artificial intelligence uses to achieve the agriculture sustainability: Systematic review. Artif. Intell. Agric. 2023, 8, 46–59. [Google Scholar] [CrossRef]
- Liakos, K.G.; Busato, P.; Moshou, D.; Pearson, S.; Bochtis, D. Machine Learning in Agriculture: A Review. Sensors 2018, 18, 2674. [Google Scholar] [CrossRef]
- Karmaoui, A.; Jaafari, S.E.; Chaachouay, H.; Hajji, L. A bibliometric review of geospatial analyses and artificial intelligence literature in agriculture. GeoJournal 2023, 88, 343–360. [Google Scholar] [CrossRef]
- Kar, A.K.; Choudhary, S.K.; Singh, V.K. How can artificial intelligence impact sustainability: A systematic literature review. J. Clean. Prod. 2022, 376, 134120. [Google Scholar] [CrossRef]
- Cavazza, A.; Dal Mas, F.; Paoloni, P.; Manzo, M. Artificial intelligence and new business models in agriculture: A structured literature review and future research agenda. Br. Food J. 2023, 125, 436–461. [Google Scholar] [CrossRef]
- Georgopoulos, V.; Gkikas, D.; Theodorou, J.A. Factors Influencing the Adoption of Artificial Intelligence Technologies in Agriculture, Livestock Farming and Aquaculture: A Systematic Literature Review Using PRISMA 2020. Sustainability 2023, 15, 16385. [Google Scholar] [CrossRef]
- Ryan, M.; Isakhanyan, G.; Tekinerdogan, B. An interdisciplinary approach to artificial intelligence in agriculture. NJAS Impact Agric. Life Sci. 2023, 95, 2168568. [Google Scholar] [CrossRef]
- Ganeshkumar, C.; Jena, S.K.; Sivakumar, A.; Nambirajan, T. Artificial intelligence in agricultural value chain: Review and future directions. J. Agribus. Dev. Emerg. Econ. 2023, 13, 379–398. [Google Scholar] [CrossRef]
- Siregar, R.R.A.; Seminar, K.B.; Wahjuni, S.; Santosa, E. Vertical Farming Perspectives in Support of Precision Agriculture Using Artificial Intelligence: A Review. Computers 2022, 11, 135. [Google Scholar] [CrossRef]
- Fadele, A.A.; Jegede, A.; Dada, E.G. Artificial Intelligence of Things (AIoT) Solutions for Sustainable Agriculture and Food Security. In Artificial Intelligence of Things for Achieving Sustainable Development Goals; Lecture Notes on Data Engineering and Communications Technologies; Springer: Cham, Switzerland, 2024; Volume 192. [Google Scholar] [CrossRef]
- Alenizi, F.; Abbasi, S.; Mohammed, A.H.; Rahmani, A.M. The artificial intelligence technologies in Industry 4.0: A taxonomy, approaches, and future directions. Comput. Ind. Eng. 2023, 185, 109662. [Google Scholar] [CrossRef]
- Espinel, R.; Herrera-Franco, G.; Garcia, J.L.R.; Escandon-Panchana, P. Artificial Intelligence in Agricultural Mapping: A Review. Agriculture 2024, 14, 1071. [Google Scholar] [CrossRef]
- Ruiz-Real, J.L.; Uribe-Toril, J.; Arriaza, J.A.T.; de Pablo Valenciano, J.A. A Look at the Past, Present and Future Research Trends of Artificial Intelligence in Agriculture. Agronomy 2020, 10, 1839. [Google Scholar] [CrossRef]
- Nosratabad, S.; Zahed, R.K.; Ponkratov, V.V.; Kostyrin, E.V. Artificial Intelligence Models and Employee Lifecycle Management: A Systematic Literature Review. Organizacija 2022, 55, 181–198. [Google Scholar] [CrossRef]
- Li, J.; Lan, X.; Long, Y.; Liu, Y.; Chen, Y.; Shao, L.; Zheng, N. A Joint Label Space for Generalized Zero-Shot Classification. IEEE Trans. Pattern Anal. Mach. Intell. 2020, 43, 4103–4115. [Google Scholar] [CrossRef] [PubMed]
- Pàmies, M.; Llop, J.; Multari, F.; Duran-Silva, N.; Parra-Rojas, C.; Gonzalez-Agirre, A.; Massucci, F.A.; Villegas, M. A weakly supervised textual entailment approach to zero-shot text classification. In Proceedings of the 17th Conference of the European Chapter of the Association for Computational Linguistics, Dubrovnik, Croatia, 2–6 May 2023; pp. 286–296. [Google Scholar] [CrossRef]
- Oliveira, L.F.P.; Silva, M.F.; Moreira, A.P. Agricultural robotics: A state of the art survey. In Proceedings of the 23rd International Conference Series on Climbing and Walking Robots and the Support Technologies for Mobile Machines, Moscow, Russia, 24–26 August 2020. [Google Scholar] [CrossRef]
- Wang, X.; Ye, Y.; Gupta, A. Zero-Shot Recognition via Semantic Embeddings and Knowledge Graphs. Computer Vision and Image Understanding. In Proceedings of the 2018 IEEE/CVF Conference on Computer Vision and Pattern Recognition, Salt Lake City, UT, USA, 18–23 June 2018; pp. 6857–6866. [Google Scholar] [CrossRef]
- Tan, C.; Xu, X.; Shen, F. A survey of zero shot detection: Methods and applications. Cogn. Robot. 2021, 1, 159–167. [Google Scholar] [CrossRef]
- Li, Y.; Chao, X. ANN-Based Continual Classification in Agriculture. Agriculture 2020, 10, 178. [Google Scholar] [CrossRef]
- Peng, Y.; Wang, Y. An industrial-grade solution for agricultural image classification tasks. Comput. Electron. Agric. 2021, 187, 106253. [Google Scholar] [CrossRef]
- Meshram, V.; Patil, K.; Meshram, V.; Hanchate, D.; Ramkteke, S.D. Machine learning in agriculture domain: A state-of-art survey. Artif. Intell. Life Sci. 2021, 1, 100010. [Google Scholar] [CrossRef]
- Chen, X.; Lan, X.; Sun, F.; Zheng, N. A Boundary Based Out-of-Distribution Classifier for Generalized Zero-Shot Learning. In Proceedings of the Computer Vision and Pattern Recognition—ECCV, Glasgow, UK, 23–28 August 2020; pp. 572–588. [Google Scholar] [CrossRef]
- Purcell, W.; Neubauer, T. Digital Twins in Agriculture: A State-of-the-art review. Smart Agric. Technol. 2023, 3, 100094. [Google Scholar] [CrossRef]
- Web of Science. Available online: https://www.webofscience.com/wos/woscc/basic-search (accessed on 20 December 2024).
- Cordis—EU Research Projects Under FP1–FP6 (1984–2006). 2024. Available online: https://data.europa.eu/data/datasets/cordisfp7projects?locale=en (accessed on 15 November 2024).
- Cordis—EU Research Projects Under HORIZON 2020 (2014–2020). 2024. Available online: https://data.europa.eu/data/datasets/cordish2020projects?locale=en (accessed on 15 November 2024).
- Cordis—EU Research Projects Under HORIZON EUROPE (2021–2027). 2024. Available online: https://data.europa.eu/data/datasets/cordis-eu-research-projects-under-horizon-europe-2021-2027?locale=en (accessed on 15 November 2024).
- WIPO PatentScope Simple Search. 2024. Available online: https://patentscope.wipo.int/search/en/search.jsf (accessed on 10 November 2024).
- CrunchBase Companies Database. 2024. Available online: https://www.crunchbase.com/discover/organization.companies (accessed on 20 December 2024).
- Sparrow, R.; Howard, M.; Degeling, C. Managing the risks of artificial intelligence in Agriculture. NJAS Impact Agric. Life Sci. 2022, 93, 172–196. [Google Scholar] [CrossRef]
- Fresco, L.O.; Westphal, E. A hierarchical classification of farm systems. Exp. Agric. 1988, 24, 399–419. [Google Scholar] [CrossRef]
- Akdemir, K.; Hurriyetoglu, A. Zero-Shot Ranking Socio-Political Texts with Transformer Language Models to Reduce Close Reading Time. In Proceedings of the 5th Workshop on Challenges and Applications of Automated Extraction of Socio-Political Events from Text (CASE), Abu Dhabi, United Arab Emirates, 7–8 December 2022. [Google Scholar] [CrossRef]
- Kyritsis, K.; Perikos, I.; Paraskevas, M. Zero-Shot Sentiment Analysis Exploring BART Models. In Proceedings of the IEEE/ACIS 8th International Conference on Big Data, Cloud Computing, and Data Science (BCD), Ho Chi Minh City, Vietnam, 14–16 December 2023; pp. 192–197. [Google Scholar] [CrossRef]
- Shafik, W.; Tufail, A.; Namoun, A.; De Silva, L.C.; Apong, R.A.A.H.M. A Systematic Literature Review on Plant Disease Detection: Motivations, Classification Techniques, Datasets, Challenges, and Future Trends. IEEE Access 2023, 11, 59174–59203. [Google Scholar] [CrossRef]
- Wang, Q.J.; Zhang, S.Y.; Dong, S.F.; Zhang, G.C.; Yang, J.; Li, R.; Wang, H.Q. Pest24: A large-scale very small object data set of agricultural pests for multi-target detection. Comput. Electron. Agric. 2020, 175, 105585. [Google Scholar] [CrossRef]
- Riley, R.R.; Lutgen, L.H. G91-1055 Using Moving Averages to Effectively Analyze Trends. In Historical Materials from University of Nebraska-Lincoln Extension; University of Nebraska-Lincoln: Lincoln, NE, USA, 1991; p. 645. [Google Scholar]
- Kim, T.; Solanki, V.S.; Baraiya, H.J.; Mitra, A.; Shah, H.; Roy, S. A Smart, Sensible Agriculture System Using the Exponential Moving Average Model. Symmetry 2020, 12, 457. [Google Scholar] [CrossRef]
- Monteiro, M.A.; Grové, B.; Matthews, N. Developing a Moving Average Crossover Strategy as an Alternative Hedging Strategy for the South Africa Maize Market. Agriculture 2022, 12, 1227. [Google Scholar] [CrossRef]
- Cauba, A.G.; Darvishzadeh, R.; Schlund, M.; Nelson, A.; Laborte, A. Estimation of transplanting and harvest dates of rice crops in the Philippines using sentinel-1 data. Remote Sens. Appl. Soc. Environ. 2025, 37, 101435. [Google Scholar] [CrossRef]
- Kofi, I.; Eric, G.; Samuel, Y. Detection of plant leaf disease employing image processing and gaussian smoothing approach. Int. J. Comput. Appl. 2017, 162, 20–25. [Google Scholar] [CrossRef]
- Zhao, Q.; Hautamaki, V.; Franti, P. Knee Point Detection in BIC for Detecting the Number of Clusters. In Advanced Concepts for Intelligent Vision Systems; Blanc-Talon, J., Bourennane, S., Philips, W., Popescu, D., Scheunders, P., Eds.; ACIVS 2008; Lecture Notes in Computer Science; Springer: Berlin/Heidelberg, Germany, 2008; Volume 5259. [Google Scholar] [CrossRef]
- Sarker, R. Causality Analysis in Agricultural Economics: A review of theoretical and empirical issues. Cah. Econ. Sociol. Rural. 1995, 34, 5–43. [Google Scholar] [CrossRef]
- Shahzad, F.; Bouri, E.; Mokni, K.; Ajmi, A.N. Energy, agriculture, and precious metals: Evidence from time-varying Granger causal relationships for both return and volatility. Resour. Policy 2021, 74, 102298. [Google Scholar] [CrossRef]
- Miwakeichi, F.; Galka, A. Comparison of bootstrap methods for estimating causality in Linear Dynamic Systems: A Review. Preprints 2023, 2023060740. [Google Scholar] [CrossRef]
- Lee, H.; Choi, Y.; Seo, H. Comparative analysis of the R&D investment performance of Korean local governments. Technol. Forecast. Soc. Change 2020, 157, 120073. [Google Scholar] [CrossRef]
- Etzkowitz, H.; Leydesdorff, L. The dynamics of innovation: From National Systems and “Mode 2” to a Triple Helix of university–industry–government relations. Res. Policy 2000, 29, 109–123. [Google Scholar] [CrossRef]
- Nace Taxonomy. 2024. Available online: https://www.openriskmanual.org/wiki/NACE_Division_A.1_-_Crop_and_animal_production,_hunting_and_related_service_activities (accessed on 10 September 2024).


Disclaimer/Publisher’s Note: The statements, opinions and data contained in all publications are solely those of the individual author(s) and contributor(s) and not of MDPI and/or the editor(s). MDPI and/or the editor(s) disclaim responsibility for any injury to people or property resulting from any ideas, methods, instructions or products referred to in the content. |
© 2025 by the authors. Licensee MDPI, Basel, Switzerland. This article is an open access article distributed under the terms and conditions of the Creative Commons Attribution (CC BY) license (https://creativecommons.org/licenses/by/4.0/).