Abstract
The paper describes an installation and procedure for evaluating the velocity profile for the airflow produced by the fan of the cleaning unit of a New Holland wheat combine harvester. The velocity profile is based on measurements taken at 52 points spread over the entire surface of the top and bottom sieves, for different speeds of the fan, different positions of the wind boards and different opening positions of the sieves. The experimental data obtained were graphically represented using the Radial Basis Function (RBF) interpolation model and highlighted that the airflow generated by the fan at the upper screen level, in the longitudinal plane and, especially, in the transverse plane, is distributed unevenly, and depends on the fan rotor speed, the opening of the louvers of the two screens and the arrangement of the two deflectors. The correct adjustment of the cleaning unit and correct evaluation of the air velocity profile over the sieves result in the reduction in grain losses from the upper sieve due to grain flotation, reduction in the content of broken grains in the grain tank due to the reduction in the material flow from the tailing auger as well as reduction in the impurities content of the grain tank due to better separation of the material over the surface of the lower sieve.
1. Introduction
The combines used for harvesting a variety of grain crops have an important role in the advancement of agricultural technologies, aiming to harvest the field in a short and precise amount of time, with minimum losses, low cost and high productivity. The machines are, usually, complex and self-propelled and they are designed to achieve different operations in one pass, depending on the species, such as plant cutting or detachment of plant parts; plant pick-up and transport; threshing; grain separation from the mass of vegetal material; grain cleaning and transport towards the grain tank; and straw chopping and discharge [1,2]. In order to achieve these operations, combine harvesters are equipped with different systems and devices, specific to the crop that must be harvested: devices for plant cutting or for the detachment of plant parts (corn ears, sunflower heads, etc.); threshing–separating systems; cleaning devices; dehusking systems; straw chopping and discharging systems; and grain tanks and different transportation equipment’s (scraper, bucket and auger elevators, straw walkers, etc.) [3,4,5]. Under these circumstances, and taking into account the technological requirements, the combine harvesters have different operating capacities and configurations, depending on the crop, climate and terrain conditions, etc. [2]. Of all the systems and devices of the combine harvesters, the grain cleaning systems play an important part, as they aim to perform the separation and elimination of impurities, grain collection and transportation to the grain tank and ear transportation to the threshing equipment [5,6]. Consequently, cleaning systems are important for the quality of the harvested grains, which must contain only small amounts of impurities and broken grains, and are considered one of the key systems of combine harvesters [7,8,9,10]. The operating process of the cleaning system is based on the pneumatic and mechanical separation of a mixture containing grains and other than grain material (MOG), resulting from the threshing unit and straw walker system. The efficiency of the cleaning unit depends on both its design and its settings. The basic design of a cleaning system consists of an outer, fixed shell and an inner, mobile shell, which has an oscillatory motion; the inner shell contains two overlapped sieves (Figure 1) [2,4]. The fixed shell is equipped with a fan, which directs the air flow towards the two sieves and the back of the combine, in an inclined direction, and two augers: the grain auger for the clean grains and the tailing auger for the heads (which are returned to the threshing unit). The upper sieve has a special design, with adjustable openings, while the lower sieve has round openings and may be changed, depending on the grain type and dimensions [5,11].
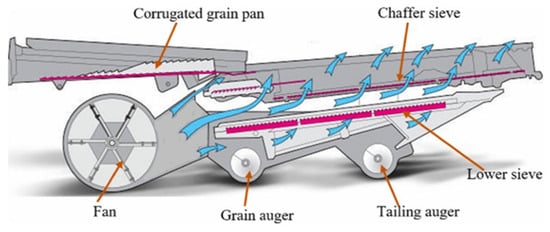
Figure 1.
Schematic diagram and operating process of the classic cleaning system of a combine harvester [2,10].
The operating process of the cleaning system is as follows: the mixture of grains and MOG, coming from the threshing unit and the straw walker system, is directed towards the upper sieve by the means of an oscillating corrugated grain pan; from the upper sieve, the big and small impurities (straws, dust and chaff) are blown by the air outside the combine. The heavy particles (grains and ears) pass through the sieve openings and land on the lower sieve, where mechanical and pneumatic separation takes place, and the grains pass through the round openings of the sieve towards the grain auger, while the heads remain on the sieve and are directed towards the tailing auger in order to be returned to the threshing unit [1,2,5,6,12,13,14]. The cleaning systems in agricultural combine harvesters were continuously improved, being equipped with different types of fans (radial, transverse, axial, etc.) (Figure 2), in order to generate a more uniform air flow on the surfaces of the lower and upper sieves. Also, in modern combines, the air is discharged through two connections (Figure 2b), a main one (lower), for the separation of impurities, and the other, the upper one, through which the mixture of grains and MOG is previously stirred [2,5,10].
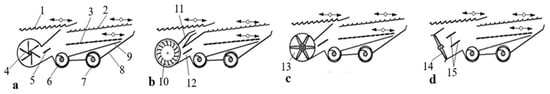
Figure 2.
Cleaning systems of combine harvesters [2,5,10]: (a) radial-flow fan; (b) cross-flow fan; (c) axial-flow blower in cross-axial position; (d) axial-flow blower in longitudinal-axial position: 1—grain pan; 2—upper sieve; 3—lower sieve; 4—radial fan; 5—simple vane; 6—grain auger; 7—tailing auger; 8—fixed housing; 9—oscillating housing; 10—cross-flow fan; 11—upper discharge duct; 12—lower discharge duct; 13—axial flow blower in transverse position; 14—axial flow blower in longitudinal position; 15—double vane.
In order to optimize the working process, with the aim to reduce grain losses and impurities content, adjustments are made that must take into account the specific requirements of the crop (wheat, corn, soybean, rapeseed, sunflower, beans, peas, etc.), grain moisture, the degree of weeding of the soil, the slope of the land, etc. [15,16]. Some works state that by making inappropriate adjustments to the cleaning system, neglecting the operating conditions, losses of up to 5% of the harvested grain quantity may occur [17,18].
Worldwide, numerous studies have been carried out to improve the technical performance of the cleaning systems in the combines used to harvest cereal seeds and technical plants, of which the following are noteworthy [2]:
- -
- The importance of uniform feeding and distribution, of stirring and stratification of the mixture formed by seeds and MOG, which comes from the threshing machine and the shaking system, and being subjected to the technological operation of cleaning the grains [2,19,20].
- -
- Experimental results obtained in the field, showing that the technical performance of the cleaning system is significantly improved when a strong air flow is used, uniformly distributed in the vegetable mixture layer, with a velocity of 6–8 m·s−1 in the threshing area, 5–6 m·s−1 in the front part of the upper sieve and 3–4 m·s−1 for the rear part of the same sieve, when harvesting wheat [21,22].
- -
- Research coordinated by Geert Craessaertsa highlights that the air flow velocity profile and the positions of the upper sieve have direct implications on seed losses [23,24,25].
- -
- Part of the research carried out worldwide was on the conception, design and realization of various experimental models, based on other operating principles, such as those coordinated by Krzysiak, who experimented with an innovative mechano-pneumatic seed cleaning system with a rotating drum [26,27].
- -
- In order to improve the technological performance of cleaning thew harvested seeds, several researchers have used innovative techniques based on the following methods [2]: establishing mathematical models to describe the operating principles of the operating process [5,28] followed by CFD (Computational Fluid Dynamics) simulation; use of PIV (Particle Image Velocity) and LDV (Laser Doppler Velocity) sensors for measuring the air flow velocity inside the cleaning system [29,30,31,32]; and in order to study the movement of the particles in the seed and MOG mixture inside the cleaning system, various procedures were used, such as the Discrete Element Method (DEM) [30], high-speed cameras [33], lasers [34], etc., granule-sensors (seeds and impurities) to monitor and track their trajectory during the cleaning process [35,36]. These techniques have the advantage of allowing the adjustment of the working parameters, such as fan speed, vanes opening and feed speed of the seed and MOG mixture; these can also be used in conjunction with the use of intelligent controllers (fuzzy control system, PID controller, etc.) [1,23,37].
Analyzing the current state of research regarding the uniformity and velocity of the air flow generated by the fan of the cleaning system, at the level of the sieve surfaces, we found that there is no methodology and facility that would allow the measurement of these parameters on harvesting combines used in modern agriculture.
As a result, given the importance of grain cleaning systems in combine harvesters, through this scientific approach we set out to design and create an original methodology and installation for measuring the air flow velocity profile at the sieve surfaces according to the specific settings of the harvesting technologies of various agricultural crops, such as fan speed, the position of the deflectors in the air exhaust duct and the opening of the louvers of the two sieves.
2. Materials and Methods
In this paper, the cleaning system of the New Holland TC 5050, Plock, Poland combine harvester, produced by CNH Industrial N.V., was studied. The cleaning system is a classic one (Figure 3), including a centrifugal fan with six blades (2), 630 mm in diameter and 1000 mm in length; an upper sieve with a surface (6) of 1.58 m2 and 1587 mm in length; and a lower sieve with a surface (5) of 1.35 m2 and 1359 mm in length.
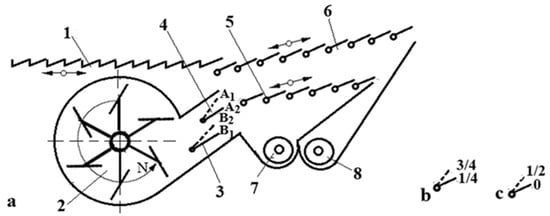
Figure 3.
New Holland TC 5050 cleaning system: (a) schematics; (b) positions of the upper sieve louvers; (c) positions of the lower sieve louvers; 1—grain pan; 2—tangential flow centrifugal fan; 3—df.1; 4—df.2; vanes; 5—lower sieve, with louvers; 6—upper sieve, with louvers; 7—grain auger; 8—tailing auger.
Both sieves (5 and 6) are provided with adjustable louvers, depending on the crop to be harvested.
The discharge duct of the fan is 280 mm in height and is equipped with two adjustable vanes marked A (4 in Figure 3) and B (3 in Figure 3); each vane has two operating positions: up (A1 and B2) and down (A2 and B1), which direct the air flow towards the sieves.
Cleaning system adjustments are made according to the technological requirements of the crops. As an example, for wheat harvesting, the following adjustments are mentioned in the combine’s user manual [38]:
Figure 4a presents a general view of the New Holland TC 5050 Plock, Poland combine harvester.
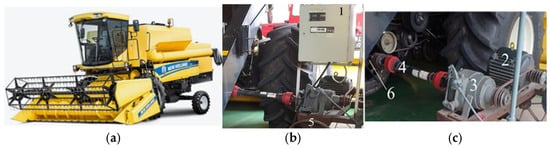
Figure 4.
New Holland TC 5050, Plock, Poland combine harvester and S1 test rig: (a) general view of the combine; (b) S1 test rig general view; (c) components of the test rig: 1—variable frequency drive; 2—asynchronous electric motor; 3—planetary reduction gear with brake; 4—drive shaft; 5—frame on wheels; 6—shaft of the combine fan.
Two test rigs were designed and built in order to carry out the experimental research aiming to evaluate the air flow velocity profile on the surfaces of the sieves of the system of the combine under study, namely one for operating the combine fan at different speeds (S1) and the second for measuring air flow velocities (S2). The (S1) test rig (Figure 4b,c) was used for powering the fan of the cleaning system; it is composed of a frame on which the following parts were mounted: asynchronous motor (4.5 kW, 1430 rev/min); belt transmission; planetary reduction gear with brake (3); and drive shaft (4). The electric motor was powered by means of a variable frequency drive, which was used to modify the speed of the electric motor and fan. The fan speed was measured with a DT-2234C tachometer (2.5–99,999 rev/min range, precision ±0,05%), based on laser technology. The (S2) test rig was used for measuring air velocity over the surface of the sieves; it was designed as an automated complex device (Figure 5) and is composed from a supporting frame (1) on which a support plate (3) is moved by the means of sliding rod (7), three axial bearings (6) and a toothed belt transmission (8).
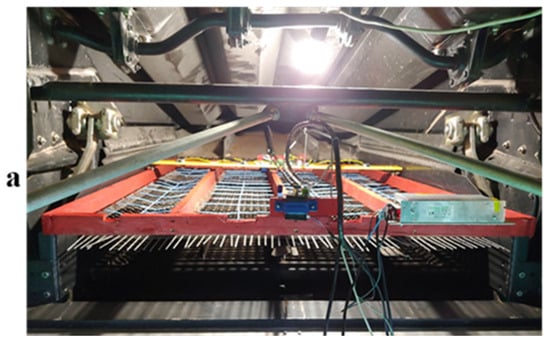
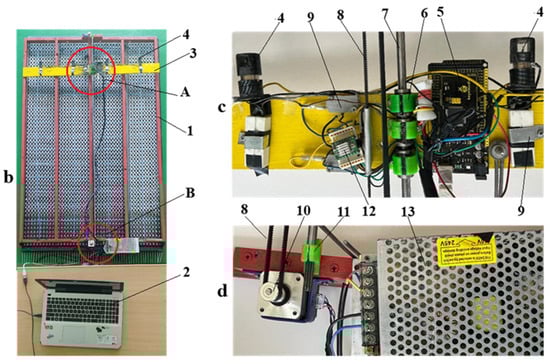
Figure 5.
S2 test rig: (a) general view; (b) components of the test rig; (c) detail “A”, automation components; (d) detail “B”, driving system of the supporting plate; 1—frame; 2—computer; 3—supporting plate; 4—anemometer-type sensors; 5—Arduino Mega 2560, IT microcontroller board; 6—axial bearings; 7—sliding rod; 8—toothed belt transmission; 9—limiting switch; 10—step-by-step motor; 11—fixtures of the sliding rod; 12—stepper motor driver; 13—power source.
In order to measure the air velocity, the following electronic equipment was mounted on the supporting plate (3, Figure 5): four anemometer-type sensors (4), placed perpendicular to the air flow direction, with 250 mm between each other, as well as an Arduino Mega 2560 microcontroller board (5, Figure 5), which was programmed to acquire the signals from the anemometers and also to provide the signals for the step-by-step motor (10), which was used to displace the plate (3) over the entire length of the sieve. The stepper motor is of the NEMA 17, CN type, and the A4988, IT driver was used for its command and control. The step-by-step motor is driving the plate (3) by means of a toothed belt transmission (8); two limiting switches (9) were used to send signals to the microcontroller board when the plate (3) has reached the upper and lower ends of the sieve.
Figure 6 presents the electric connections diagram. Two NTC 100K, CN temperature sensors (4) were used to measure the temperatures of the air blown by the fan and of the ambient air, respectively.
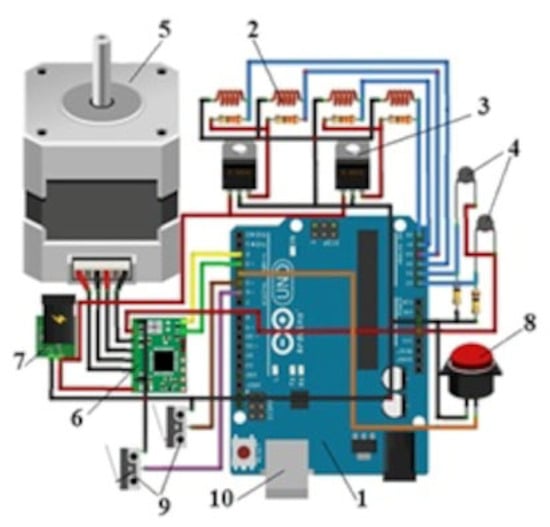
Figure 6.
Connections diagram: 1—Arduino Mega 2560, IT microcontroller board; 2—anemometer-type velocity sensors; 3—voltage stabilizers IC; 4— NTC 100K, CN temperature sensors; 5—step-by-step motor NEMA 17 type; 6—A4988 stepper motor driver; 7—power source; 8—start button; 9—limiting switches; 10—USB port.
The information from the microcontroller board was transferred to a PC (2, Figure 5b) using a USB cable and was saved on the computer as an Excel file.
In order to acquire the data regarding the air velocity, the frame (1, Figure 5) was mounted in a position that allowed the air velocity sensors to be at 50 mm above the upper sieve; the plate (3) was displaced over the entire length of the sieve, in 200 mm steps (Figure 7). When the plate reached the programmed measuring position, it was stopped for ten seconds, and data from the air velocity sensors were acquired; it was then moved to the next position, and the process was repeated.
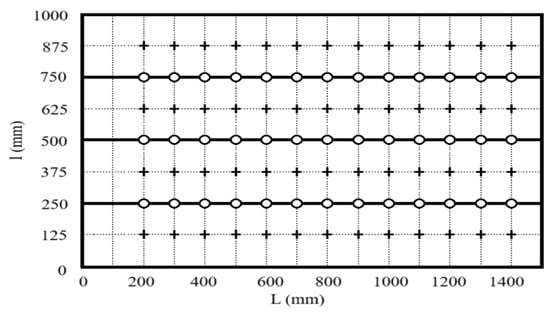
Figure 7.
Points on the sieve’s surface where air velocity was measured or interpolated. “+”—points where air velocity was measured; “o”—points where air velocity was interpolated using the RBF model; L—sieve length, mm; l—sieve width, mm.
The air velocity sensors were previously calibrated, and the respective results were presented in a previous paper [39].
The measured data regarding the air velocity were used to obtain 2D and 3D graphical representations of the air velocity profiles.
The tests were performed taking into account the following independent variables:
- Fan speed: 400, 500, 600 and 800 rev/min;
- Two variants for the positions of the fan vanes: A and B (Table 1);
 Table 1. Positions of the vanes.
 - Two positions of the louvers for each sieve: 1/4 and 3/4 for the upper sieve; 0 and 1/2 for the lower sieve.
In order to obtain an accurate air velocity profile, the Radial Basis Function (RBF) interpolation model was used. This model uses radial functions to estimate airflow velocity values between the 52 experimentally determined airflow velocity points. The model is useful in the present experiment because it leads to an increase in the number of points with known velocity from 52 to 91 (Figure 7). The number of airflow velocity values obtained by the RBF interpolation model is 39. The model estimates functions that are dependent on the radial distance between the points, and these functions are used in a linear combination to construct an interpolation function as follows. A radial function that depends only on the distance from a point and a center is expressed as
where x is the point where we wish to evaluate the function, c is the center of the radial function and ‖x − c‖ is the Euclidian norm.
where N is the number of given points, ci are the centers of the radial functions or the experimental points 52, wi are the weights associated with each radial function and Φ is the selected radial function.
ϕ(x,c) = ϕ(‖x − c‖),
There are several possibilities for modeling the radial function, including the Gaussian, multiquadric, inverse multiquadric and cubic functions. Among these functions, the best approximation results for the missing values of the air flow velocity on the sieve were obtained by applying the multiquadric function.
where r is the distance between the point where the velocity must be evaluated and the point where the velocity was measured.
The mathematical model used is accurate because it guarantees realistic values at the points with known data for the air velocity. The disadvantage of the model is that it requires large computing resources when the number of points increases. To obtain the air flow velocity values in the missing points, a Dell graphics workstation with two Xeon, USA processors and 24 cores each (64 Gb DDR4 ECC RAM) was used in the calculation of the model.
Three repetitions were performed for each experimental measurement of the air flow velocity on the surface of the sieves.
3. Results and Discussion
The experimental data obtained through measurements with the stand presented above, at the level of the upper sieve surface, are graphically represented in 2D and 3D, using the Radial Basis Function (RBF) interpolation model, in order to obtain real images regarding the speed profiles depending on the fan speeds N (400, 500, 600 and 800 rev/min), the various positions of the cleaning sieve louvers (Figure 3b,c) and the arrangement of the vanes (Figure 3a). In the four superimposed images in Figure 8, Figure 9, Figure 10 and Figure 11, the sieve length L (mm) is represented on the X axis, and the sieve width l (mm) is represented on the Y axis.
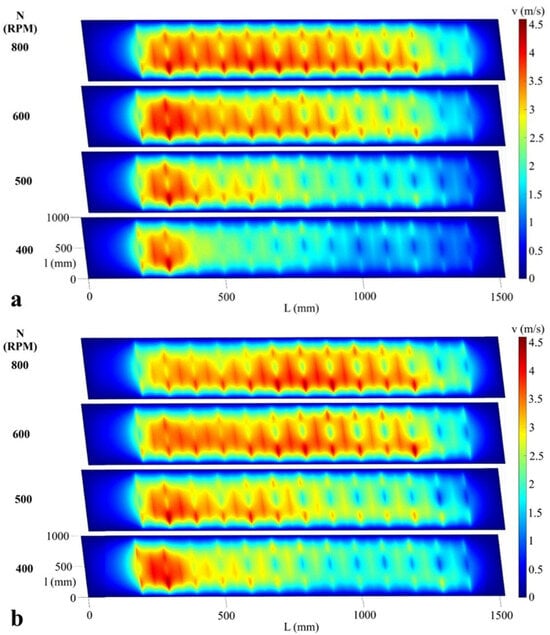
Figure 8.
Air velocity field (m/s) on the surface of the upper sieve at 400, 500, 600 and 800 rev/min (RPM), upper sieve louvers in position 1/4, lower sieve louvers in position 1/2. (a) Vanes in variant A and (b) Vanes in variant B.
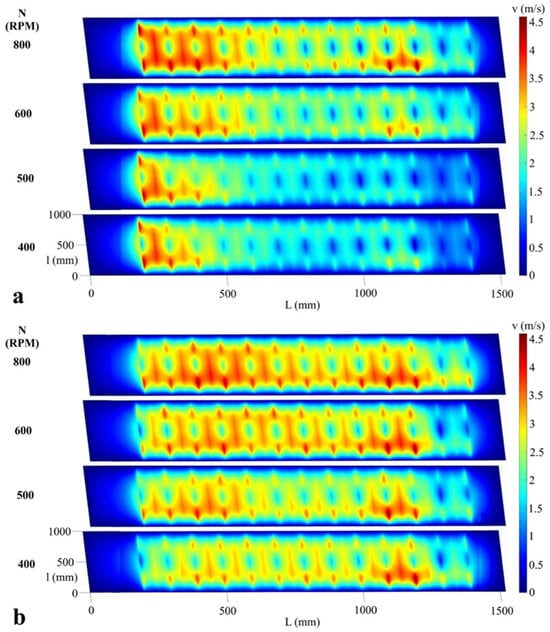
Figure 9.
Air velocity field (m/s) on the surface of the upper sieve at 400, 500, 600 and 800 rev/min (RPM), upper sieve louvers in position 3/4, lower sieve louvers in position 1/2. (a) Vanes in variant A and (b) Vanes in variant B.
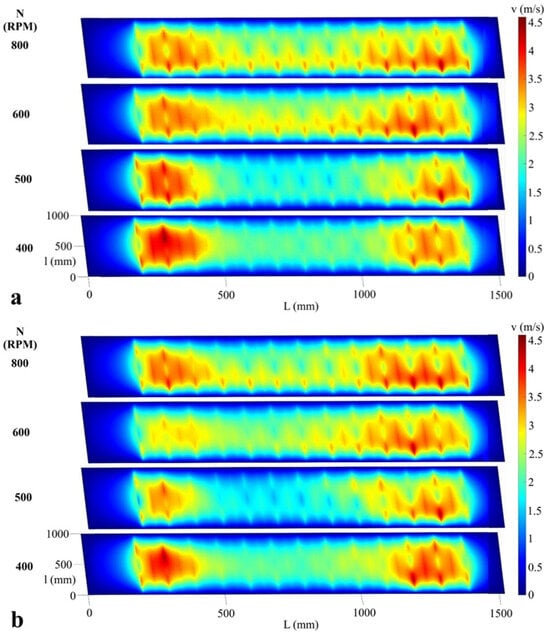
Figure 10.
Air velocity field (m/s) on the surface of the upper sieve at 400, 500, 600 and 800 rev/min (RPM), upper sieve louvers in position 1/4, lower sieve louvers in position 0. (a) Vanes in variant A and (b) Vanes in variant B.
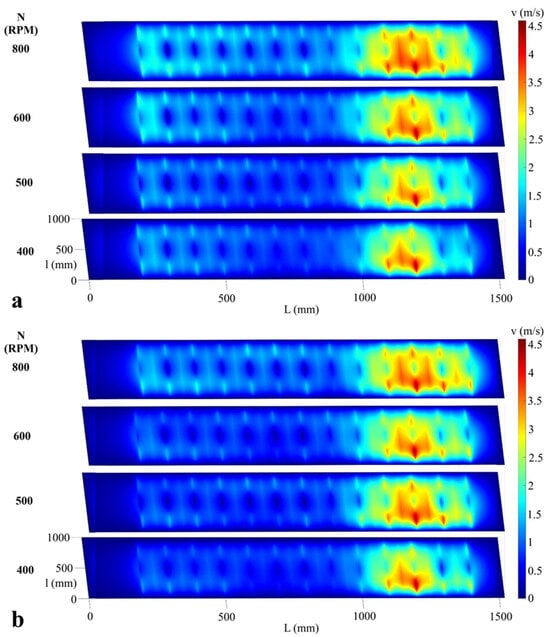
Figure 11.
Air velocity field (m/s) on the surface of the upper sieve at 400, 500, 600 and 800 rev/min (RPM), upper sieve louvers in position 3/4, lower sieve louvers in position 0. (a) Vanes in variant A and (b) Vanes in variant B.
For experimental variant A (Table 1), with the vanes adjusted to positions A1 and B1, respectively, with the lower sieve opened at 1/2 and the upper sieve opened at 1/4, the air flow velocity recorded values were between 2.5 and 4.5 m/s in the first half of the upper sieve at a fan speed of 400 rev/min (Figure 8a). It should be noted that as the fan rotor speed was increased to 800 rev/min, the air flow increased, which led to an increase in the air flow velocity along the upper sieve, while the air flow velocity field became uniform. In the case of changing the position of the vanes to variant B (Table 1), using the same settings of the two cleaning sieves, at a fan speed of 400 rev/min (Figure 8b), the air flow was slightly directed towards the middle of the sieve; when increasing the fan rotor speed to 800 rev/min, the air flow velocity filed showed a tendency to become uniform along the screen surface. The results obtained and presented regarding the air flow velocity profile for the conditions presented above are also supported by various research conducted under laboratory conditions, on different experimental models [40,41].
By changing the position of the upper sieve louvers from position 1/4 to position 3/4 (Figure 9a), the air flow velocity decreases at the level of its surface due to the increase in the air flow cross-section through the sieve. For the fan rotor speed of 400 rev/min and the vanes according to variant A (Table 1), the air flow velocity field presents higher values in the front of the sieve; with the increase in the air flow rate (due to the increased fan rotor speed), the velocity profile tends to become slightly uniform along the surface of the upper sieve.
By changing the position of the vanes according to variant B, respectively, for settings A2 and B2, with the upper sieve louvers opened at 3/4, the lower sieve opened at 1/2 and at a fan rotor speed of 400 rev/min, the maximum velocity recorded on the upper sieve surface is 2.5 m/s; increasing the fan speed to 800 rev/min led to a maximum velocity of 4 m/s (Figure 9b). Over the entire speed range (400–800 rev/min), the velocity field is more evenly distributed on the surface of the upper sieve. This occurs because the air flow was directed towards the rear of the cleaning system, due to the arrangement of the vanes in positions A2 and B2. Therefore, the distribution and velocity of the air flow at the surface of the upper sieve, which determine the quality of the seed cleaning process, depend on the fan air flow, and, respectively, its velocity, the position of the deflectors, as well as the settings of the louvers of the two sieves—a fact demonstrated by other papers [42,43].
When the upper sieve louvers were opened 1/4 and the lower sieve louvers were closed (position 0), at a fan rotor speed of 400 rev/min, with the vanes in positions A1 and B1 respectively (variant, Table 1), the air flow velocity field presented higher values in the 0–400 mm and 1100–1400 mm sections and lower values in the middle section of the upper sieve (Figure 10a). This situation was due to the fact that the vane df.1 (4, Figure 3) directed the air flow towards the front section of the sieve. At the same time, it must be taken into account that with the lower sieve being closed, the air flow generated by the fan penetrated with difficulty through its louvers and was directed towards the rear part of the cleaning system, leaving the enclosure through the rear section of the upper sieve, which led to an increased air velocity in the 1100–1400 mm area of the sieve. Therefore, for this variant, changing the position of the vanes did not have a significant impact on the air flow distribution.
Figure 11a presents the results obtained for the same operating conditions but with the upper sieve louvers opened to 3/4. In this situation, the air velocity has recorded high values (between 3 and 4.5 m/s) in the rear area of the cleaning system. The air flow velocity field was unevenly distributed over the entire surface of the upper sieve; this was due to the lower screen, which was closed and acted as a deflector, thus not allowing the air flow to pass, directing it towards the rear of the upper sieve. Similar results were obtained when the vanes were placed according to variant B (Figure 11b).
In order to analyze the air flow distribution in the transverse plane, a 3D representation of the air flow velocity field was taken into account for the following test conditions: the vanes in positions A2 and B2 (variant B, Table 1), the upper sieve louvers in position 3/4 and the lower sieve louvers in position 1/2 as well as fan rotor speeds of 400 rev/min (Figure 12a) and 800 rev/min (Figure 12b). From the analysis of the experimental data, it was found that the air flow velocity was also non-uniform in the transverse direction of the cleaning system, with higher values being recorded on the sides of the sieves and lower values on their middle part. This non-uniformity was maintained along the entire length of the upper sieve and increased when the fan rotor speed was increased from 400 rev/min to 800 rev/min.
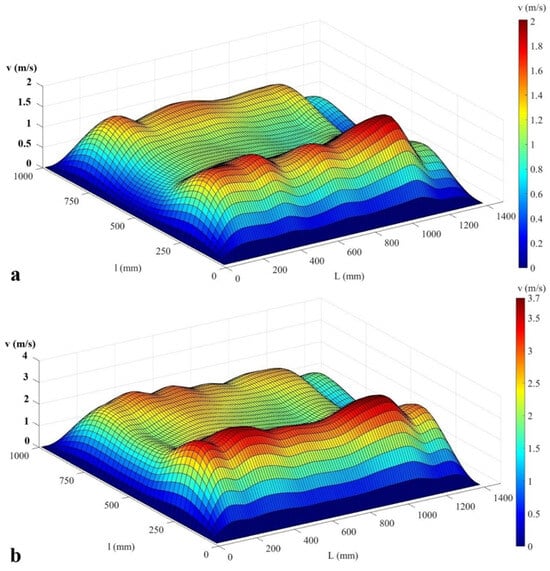
Figure 12.
Three-dimensional representation of the air velocity field (m/s) on the surface of the upper sieve, with the vanes positioned in variant B, the louvers of the upper sieve in position 3/4, the louvers of the lower sieve in position 1/2. (a) 400 rev/min fan speed and (b) 800 rev/min fan speed.
The distribution and velocity of the air flow at the surface of the upper sieve are parameters that are difficult to manage and regulate, and while they have a major impact on the process of separating the mixture of seeds and MOG, certain aspects are confirmed by other papers based on research carried out in laboratory conditions, using different experimental models and various simulation software [40,41,42,43]. Compared to the results obtained in the cited papers, which are based on experimental laboratory models, our research aims to test seed cleaning systems and MOG from real combines used for harvesting cereals and technical plants. For these reasons, our research is original and allows testing the performance of cleaning systems from any type of combine.
The unevenness of the air flow at the surface of the upper sieve, in the transverse plane, is specific to cleaning systems equipped with tangential centrifugal fans and is explained by the fact that the air is sucked through its sides, which causes a deficit of air flow in the middle area.
By directing the air flow to the side areas of the cleaning system during the working process of the combines, the material resulting from the threshing device and the shakers (seeds and MOG) is agglomerated towards the central area of the upper sieve, which causes poor cleaning, with significant seed losses compared to the side areas.
The accuracy of the measurements is conditioned by the precision of the sensors with which the laboratory stand was equipped. For this purpose, statistical calculations were performed to determine the standard deviation. For the calibration of the anemometric sensors in the stand, the Testo 405i, DE anemometer was used, which has an accuracy of ±0.1 m/s in the range 0–2 m/s and an accuracy of ±0.3 in the range 2–15 m/s, and was used as a reference base. The number of individual measurements for each of the 52 measurement points on the surface of the sieve was 10.
For these conditions, the average value of the velocity was calculated for each measuring point, and then the standard deviation was determined for each established position. The results obtained were represented graphically (Figure 13) to make it easier to analyze. From the analysis of these results, it appears that the maximum value of the standard deviation of the anemometric sensors is 0.248 m/s, which is lower than the precision of the Testo 405i anemometer (of ±0.3 for the range of 2–15 m/s) used as a reference base. These results show us that the built stand and the research method were established correctly.
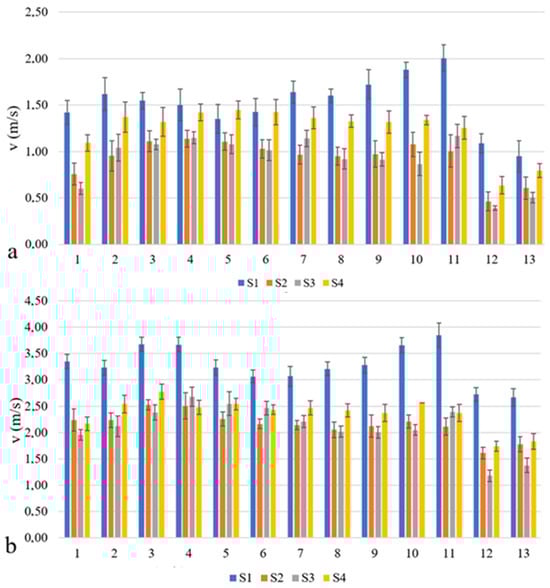
Figure 13.
Air flow velocity measured on the surface of the upper sieve and its standard deviation, with the deflectors in position B, with the upper sieve in position 3/4, with the lower sieve in position 1/2, and for the fan speed of (a)—400 (RPM) and (b)—800 (RPM); v—air flow velocity (m/s); 1, 2, 3, …, 13—air flow velocity measurement zones along the sieve; S1, S2, S3, S4—anemometric sensors for measuring the air flow velocity in the transverse plane.
4. Conclusions
The results of experimental research conducted and disseminated worldwide through the publication of a large number of valuable scientific papers highlight that the cleaning systems in the composition of agricultural crop harvesters have an important role in achieving qualitative work indices, with minimal losses and high purity.
In order to achieve the purpose and objectives imposed by this scientific endeavor, an original test rig was designed and built, which allows the precise measurement of air flow velocities at the level of the upper sieve of the cleaning system of the New Holland TC 5050 combine. The experimental research was designed as a multifactorial experience, aiming to determine the influence of the sieve settings, of the position of the vanes and of the fan rotor speed on the distribution of the air flow velocity at the level of the upper sieve.
The experimental data obtained and graphically represented, using the Radial Basis Function (RBF) interpolation model, highlighted the following aspects:
- (1)
- The air flow velocity profile generated by the fan at the upper sieve level, in the longitudinal plane, is distributed unevenly, and depends on the fan rotor speed, the opening of the louvers of the two sieves and the arrangement of the two vanes. As the fan rotor speed increases, the air flow increases, and the degree of air flow distribution improves. By opening the louvers of the upper sieve, an increase in the unevenness of the air flow velocity distribution was observed, with the air speed increasing towards the front of the cleaning system. When the louvers of the lower sieve were closed, the unevenness of the air flow velocity distribution increased, and maximum values were recorded towards the rear section of the upper sieve. By changing the position of the vanes for the two variants A and B, it was observed that the air flow velocity was directed mainly along the surface of the upper sieve.
- (2)
- It was observed that, at the surface of the upper sieve and along its entire length, in the transverse plane, the air flow velocity generated by the fan was distributed unevenly, with higher values recorded on the sides and lower values in the middle area of the cleaning system. This situation is specific to agricultural crop harvesters equipped with tangential centrifugal fans.
- (3)
- The obtained results show the importance of this scientific endeavor and that, in the future, further studies and research are necessary, aiming to improve the separation process of seeds and MOG. In order to improve the uniformity of the air distribution at the level of the upper sieve surface, the following directions must be taken into account: conducting comparative studies for different cleaning systems, equipped with different types of fans (centrifugal–tangential, axial and cross-flow); improving the design of centrifugal–tangential-type fans using variable suction sections; optimizing the construction of deflectors; and improving the sealings of the cleaning system housings.
Author Contributions
Conceptualization, I.-A.D., P.-M.C., R.R. and I.Ţ.; methodology, I.-A.D., P.-M.C., R.R. and I.Ţ.; software, I.-A.D. and P.-M.C.; validation, I.Ţ. and P.-M.C.; formal analysis, R.R.; investigation, I.-A.D.; resources, I.-A.D. and P.-M.C.; data curation, I.-A.D., P.-M.C. and I.Ţ.; writing—original draft preparation, I.-A.D., P.-M.C. and I.Ţ.; writing—review and editing, I.-A.D., P.-M.C., R.R. and I.Ţ.; visualization, P.-M.C., R.R. and I.Ţ.; supervision, I.Ţ.; project administration, I.Ţ.; funding acquisition, I.-A.D. and I.Ţ. All authors have read and agreed to the published version of the manuscript.
Funding
This paper was financially supported by the doctoral grant, accorded by the Doctoral University Studies Contract, no. 10542/02.10.2023, affiliated with the “Ion Ionescu de la Brad” Iasi University for Life Sciences, as the Organizing Institution for Doctoral University Studies (IOSUD).
Data Availability Statement
The original contributions presented in this study have been included in the article. Further inquiries can be directed to the corresponding author.
Acknowledgments
The authors sincerely thank the reviewers and editors for their valuable feedback and efforts. They also appreciate the support of the laboratory members, whose contributions were essential to this research.
Conflicts of Interest
The authors declare no conflicts of interest. The funders had no role in the design of the study; in the collection, analyses, or interpretation of data; in the writing of the manuscript; or in the decision to publish the results.
Abbreviations
The following abbreviations are used in this manuscript:
| CFD | Computational Fluid Dynamics |
| DEM | Discrete Element Method |
| LDV | Laser Doppler Velocity |
| MOG | Material Other Than Grain |
| PID | Proportional Integral Derivative |
| PIV | Particle Image Velocity |
| RBF | Radial Basis Function |
References
- Liang, Z.; Li, Y.; Baerdemaeker, J.D.; Xu, L.; Saeys, W. Development and testing of a multi-duct cleaning device for tangential-longitudinal flow rice combine harvesters. Biosyst. Eng. 2019, 182, 95–106. [Google Scholar] [CrossRef]
- Liang, Z.; Wada, M.E. Development of cleaning systems for combine harvesters: A review. Biosyst. Eng. 2023, 236, 79–102. [Google Scholar] [CrossRef]
- Badretdinov, I.; Mudarisov, S.; Khasanov, E.; Nasyrov, R.; Tuktarov, M. Operation technological process research in the cleaning system of the grain combine. J. Agric. Eng. 2021, 52, 1129. [Google Scholar] [CrossRef]
- Hermann, D. Optimisation of Combine Harvesters Using Model-Based Control. Ph.D. Thesis, Technical University of Denmark, Copenhagen, Denmark, 2018. [Google Scholar]
- Miu, P. Combine Harvesters (Theory, Modeling, and Design), 1st ed.; CRC Press: Boca Raton FL, USA, 2016; pp. 275–300. [Google Scholar]
- Tabatabaifar, A. Airflow and Particle Motion on an Adjustable Chaffer Sieve. Ph.D. Thesis, Pennsylvania State University, Stadtkolich, PA, USA, 1992. [Google Scholar]
- Griffin, G.A. Combine Harvesting; John Deer & Company Publications: Moline, IL, USA, 1987. [Google Scholar]
- Qiao, Z.X. Studies on characteristic of material mechanics of rice grains. Acta Agric. Univ. Jiangxiensis 1992, 12, 1–9. [Google Scholar]
- Xu, L.Z.; Li, Y.; Chai, X.Y.; Wang, G.M.; Liang, Z.W.; Li, Y.M. Numerical simulation of gas-solid two-phase flow to predict the cleaning performance of rice combine harvesters. Biosyst. Eng. 2020, 190, 11–24. [Google Scholar] [CrossRef]
- Badretdinov, I.; Mudarisov, S.; Lukmanov, R.; Permyakov, V.; Ibragimov, R. Mathematical modeling and research of the work of the grain combine harvester cleaning system. Comp. Electron. Agric. 2019, 165, 104966. [Google Scholar] [CrossRef]
- Li, H.; Li, Y.; Gao, F.; Zhao, Z.; Xu, L. CFD–DEM simulation of material motion in air-and-screen cleaning device. Comp. Electron. Agric. 2012, 88, 111–119. [Google Scholar] [CrossRef]
- Gebrehiwot, M.G.; De Baerdemaeker, J.; Baelmans, M. Numerical analysis of a cross-flow fan with two outlets. In Proceedings of the HEFAT, 5th International Conference on Heat Transfer, Fluid Mechanics and Thermodynamics, Sun City, South Africa, 1–4 July 2007; Available online: http://hdl.handle.net/2263/42752 (accessed on 22 September 2024).
- Gebrehiwot, M.; De Baerdemaeker, J.; Baelmans, M. The effect of a cross-flow opening on the performance of a centrifugal fan in the cleaning section of a combine harvester. In Proceedings of the CIGR International Conference of Agricultural Engineering, Iguassu Falls City, Brazil, 31 August–4 September 2008. [Google Scholar]
- Gebrehiwot, M.G.; De Baerdemaeker, J.; Baelmans, M. Effect of a cross-flow opening on the performance of a centrifugal fan in a combine harvester. Biosyst. Eng. 2010, 105, 247–256. [Google Scholar] [CrossRef]
- De Baerdemaeker, J.; Saeys, W. Advanced control of combine harvesters. In Proceedings of the 4th IFAC Conference on Modelling and Control in Agriculture, Horticulture and Post-Harvest Industry, Espoo, Finland, 27–30 August 2013. [Google Scholar] [CrossRef]
- Dahany, A. Capacity Improvement of an Oscillating Sieve with Airflow for Grain-Chaff Separation in a Combine Optimisation of the Air Distribution. Ph.D. Thesis, Hohenheim University, Hohenheim, Germany, 1994. [Google Scholar]
- Berner, D.; Grobler, W.H. Gesteuerte adaptive Regelung einer Mähdrescherreinigungsanlage. Grund. Landtech. 1986, 36, 3. [Google Scholar]
- Ding, B.; Liang, Z.; Qi, Y.; Ye, Z.; Zhou, J. Improving cleaning performance of rice combine harvesters by DEM–CFD coupling technology. Agriculture 2022, 12, 1457. [Google Scholar] [CrossRef]
- Chai, X.; Xu, L.; Sun, Y.; Liang, Z.; Lu, E.; Li, Y. Development of a cleaning fan for rice combine harvester using computational fluid dynamics and response surface methodology to optimise outlet airflow distribution. Biosyst. Eng. 2020, 192, 232–244. [Google Scholar] [CrossRef]
- Chai, X.; Zhou, Y.; Xu, L.; Li, Y.; Li, Y. Effect of guide strips on the distribution of threshed outputs and cleaning losses for tangential longitudinal flow rice combine harvester. Biosyst. Eng. 2020, 198, 223–334. [Google Scholar] [CrossRef]
- Wu, Q.F. TC5000 series new combines of New Holland Company. Agric. Eng. 2014, 4, 31–34. [Google Scholar]
- Kutzbach, H.D.; Quick, G.R. Harvesters and threshers. In CGIR Handbook of Agricultural Engineering, Vol. III, Plant Production Engineering; American Society of Agricultural Engineering: St. Joseph, MI, USA, 1999. [Google Scholar]
- Craessaerts, G.; Saeys, W.; Missotten, B.; De Baerdemaeker, J. A genetic input selection methodology for identification of the cleaning process on a combine harvester, Part I: Selection of relevant input variables for identification of the sieve losses. Biosyst. Eng. 2007, 98, 166–175. [Google Scholar] [CrossRef]
- Craessaerts, G.; Saeys, W.; Missotten, B.; De Baerdemaeker, J. Identification of the cleaning process on combine harvesters. Part I: A fuzzy model for prediction of the material other than grain (MOG) content in the grain bin. Biosyst. Eng. 2008, 101, 42–49. [Google Scholar] [CrossRef]
- Craessaerts, G.; Saeys, W.; Missotten, B.; De Baerdemaeker, J. Identification of the cleaning process on combine harvesters, Part II: A fuzzy model for prediction of the sieve losses. Biosyst. Eng. 2010, 106, 97–102. [Google Scholar] [CrossRef]
- Krzysiak, Z.; Samociuk, W.; Zarajczyk, J.; Beer-Lech, K.; Bartnik, G.; Kaliniewicz, Z.; Dziki, D. Effect of Sieve Unit Inclination Angle in a Rotary Cleaning Device for Barley Grain. Trans. ASABE 2020, 63, 609–618. [Google Scholar] [CrossRef]
- Krzysiak, Z.; Samociuk, W.; Skic, A.; Bartnik, G.; Zarajczyk, J.; Szmigielski, M.; Dziki, D.; Wierzbicki, S.; Krzywonos, L. Effect of Sieve Drum Inclination Angle on Wheat Grain Cleaning in a Novel Rotary Cleaning Device. Trans. ASABE 2017, 60, 1751–1758. [Google Scholar] [CrossRef]
- Huisman, W. Optimum Cereal Combine Harvester Operation Using an Automatic Machine and Threshing Speed Control. Ph.D. Thesis, The University of Wageningen, Wageningen, The Netherlands, 1984. [Google Scholar]
- Kenney, K.L.; Wright, C.T.; Bryden, K.M. A virtual engineering approach to developing selective harvest technologies. In Proceedings of the 2005 ASAE Annual Meeting, Tampa, FL, USA, 17–20 July 2005; p. 056046. [Google Scholar] [CrossRef]
- Streicher, E.A.; Stroshine, R.L.; Krutz, G.W.; Hinkle, C.N. Cleaning shoe air velocities in combine harvesting of wheat. Trans. ASAE 1986, 29, 923–928. [Google Scholar] [CrossRef]
- Ueka, Y.; Matsui, M.; Inoue, E.; Mori, K.; Okayasu, T.; Mitsuoka, M. Turbulent flow characteristics of the cleaning wind in a combine harvester. Eng. Agric. Environ. Food 2012, 5, 102–106. [Google Scholar] [CrossRef]
- Guan, Z.; Li, H.; Chen, X.; Mu, S.; Jiang, T.; Zhang, M. Development of impurity-detection system for tracked rice combine harvester based on DEM and mask R-CNN. Sensors 2022, 22, 9550. [Google Scholar] [CrossRef]
- Adewumi, B.; Rao, S.; Kumar, K.; Ventakrishnan, L.; Karthikeyan, L. Velocity and trajectory profiles of soybean grains in the cross-flow system. In Proceedings of the Food Process Automation Conference, Providence, RI, USA, 28–29 June 2008; p. 701P0508cd. [Google Scholar] [CrossRef]
- Liang, Z.; Li, D.; Li, J.; Tian, K. Effects of fan volute structure on airflow characteristics in rice combine harvesters. Span. J. Agric. Res. 2021, 18, e0209. [Google Scholar] [CrossRef]
- Mariyono, J. Productivity growth of Indonesian rice production: Sources and efforts to improve performance. Int. J. Prod. Perform. Manag. 2018, 67, 1792–1815. [Google Scholar] [CrossRef]
- Reyns, P.; Missotten, B.; Ramon, H.; Baerdemaeker, J. A review of combine sensors for precision farming. Precis. Agric. 2002, 3, 169–182. [Google Scholar] [CrossRef]
- Zhou, Y.; Liu, M.S.; Zhang, Z.D.; Huang, R.L. Research on application of fuzzy neural network in combine harvester. In Proceedings of the Fifth International Conference on Fuzzy Systems and Knowledge Discovery, Jinan, China, 18–20 October 2008; pp. 231–235. [Google Scholar] [CrossRef]
- Dumbravă, I.A.; Cârlescu, P.M.; Rosca, R.; Țenu, I. Study of the air velocity in the combine harvesting cleaning system. Agron. Lucr. Ştiinţifice 2024, 67, 95–100. Available online: https://www.uaiasi.ro/revagrois/PDF/2024-1/paper/Volume_67-1_2024_Paper-18.pdf (accessed on 22 September 2024).
- Dumbravă, I.A.; Cârlescu, P.M.; Țenu, I. Development of an anemometer for measuring air flow velocity in agriculture. Agron. Lucr. Ştiinţifice 2024, 67, 90–94. Available online: https://www.uaiasi.ro/revagrois/PDF/2024-1/paper/Volume_67-1_2024_Paper-17.pdf (accessed on 22 September 2024).
- Li, D.; He, Q.; Yue, D.; Geng, D.; Yin, J.; Guan, P.; Zha, Z. Research experiment on airflow field control technology of harvester cleaning system based on load distribution. Agriculture 2024, 14, 779. [Google Scholar] [CrossRef]
- Zhang, C.; Geng, D.; Xu, H.; Li, X.; Ming, J.; Li, D.; Wang, Q. Experimental Study on the Influence of Working Parameters of Centrifugal Fan on Airflow Field in Cleaning Room. Agriculture 2023, 13, 1368. [Google Scholar] [CrossRef]
- Yang, L.; Lizhang, X.; Ying, Z.; Baijun, L.; Zhenwei, L.; Yaoming, L. Effects of throughput and operating parameters on cleaning performance in air-and-screen cleaning unit: A computational and experimental study. Comput. Electron. Agric. 2018, 152, 141–148. [Google Scholar] [CrossRef]
- Liu, P.; Jin, C.; Yang, T.; Chen, M.; Ni, Y.; Yi, X. Design and Experiment of Multi Parameter Adjustable and Measurable Cleaning System. Trans. Chin. Soc. Agric. Mach. 2020, 51, 191–201. [Google Scholar]
Disclaimer/Publisher’s Note: The statements, opinions and data contained in all publications are solely those of the individual author(s) and contributor(s) and not of MDPI and/or the editor(s). MDPI and/or the editor(s) disclaim responsibility for any injury to people or property resulting from any ideas, methods, instructions or products referred to in the content. |
© 2025 by the authors. Licensee MDPI, Basel, Switzerland. This article is an open access article distributed under the terms and conditions of the Creative Commons Attribution (CC BY) license (https://creativecommons.org/licenses/by/4.0/).